supplementary material for - · pdf filesupplementary material for ... changho lee 3 &...
TRANSCRIPT
www.sciencemag.org/content/344/6181/289/suppl/DC1
Supplementary Material for
Ultimate Permeation Across Atomically Thin Porous Graphene
Kemal Celebi, Jakob Buchheim, Roman M. Wyss, Amirhossein Droudian, Patrick Gasser, Ivan Shorubalko, Jeong-Il Kye, Changho Lee, Hyung Gyu Park*
*To whom correspondence should be addressed: [email protected]
Published 18 April 2014, Science 344, 289 (2014)
DOI: 10.1126/science.1249097
This PDF file includes:
Materials and Methods
Figs. S1 to S11
Full Reference List
Supplementary Materials for
Ultimate Permeation across Atomically Thin Porous Graphene
Kemal Celebi1†, Jakob Buchheim1†, Roman M. Wyss1, Amirhossein Droudian1, Patrick Gasser1, Ivan Shorubalko2, Jeong-Il Kye3, Changho Lee3 & Hyung Gyu Park1*
1 Nanoscience for Energy Technology and Sustainability, ETH Zurich, Sonneggstrasse 3, CH-8092 Zürich, Switzerland. 2 Laboratory for Electronics/Metrology/Reliability, EMPA (Swiss Federal Laboratories for Materials Science and Technology), Überlandstrasse 129, CH-8600 Dübendorf, Switzerland 3 Materials & Components R&D Laboratory, LG Electronics Advanced Research Institute, 38 Baumoe-ro, Seocho-gu, Seoul 137-724, Korea. * To whom correspondence should be addressed: [email protected] † These authors contributed equally to this work.
Materials and Methods
Graphene synthesis
Graphene was grown on copper foils (Alfa Aesar #13382) in a cold-wall chemical vapor
deposition system (Aixtron AG). The samples were annealed for 30 min at 950°C under Ar
(1500 sccm) and H2 flow (100 sccm), followed by a two-step growth with flowing ethylene at
25 sccm for 2 min and 50 sccm for 1 min. All growths were carried out at 4 mbar chamber
pressure.
Graphene Transfer
Graphene was transferred using a spin-coat-and-back-etch method in order to obtain double
layer graphene on the target substrate (36). Our modified method begins with the spinning of
1

poly (methyl methacrylate) PMMA (950k, 2% Anisol) on as-grown graphene at 4000 rpm,
yielding sub-100-nm polymer layers. The PMMA/graphene/copper is then placed on the
surface of (NH4)2S2O8 solution (0.5 M in water) to etch the copper. After 10 min, the sample
is removed from the solution and the backside of the foil is cleaned to remove graphene
remainder. The successive, 90-min-long etch removes the copper entirely, leaving the
PMMA/graphene layer. The floating PMMA/graphene layer is transferred to a DI-water bath
for rinsing. Another as-grown graphene on a copper foil is used to fish out the rinsed sample
and left for air-drying, yielding double layer graphene between copper and PMMA. The
procedure for the copper foil removal is then repeated as described above. The second fish-out
is performed by the holey SiNx frame, followed by air-dry and a subsequent hotplate anneal
for 30 min at 180°C, which relaxes PMMA and promotes the adhesion of graphene on the
target substrate. The PMMA is finally removed in a quartz tube furnace at 400°C for 2 hours,
under 500 sccm H2 : 500 sccm Ar flow.
FIB patterning and membrane characterization
The freestanding double layer graphene was patterned using Focused Ion Beam (FIB) milling.
Two FIB methods were employed. First, for pores diameters between 16 nm and 1000 nm,
Ga+ ion beam (FEI Helios 450) exposure (30 kV, 33 pA) was used. A dose of ~0.5-5×10⁻⁵
pA/nm2 yielded well-defined pore size distributions. In the second method, sub-10-nm pores
were drilled by a He+ ion FIB (Zeiss Orion Plus) using a 30 kV, 16 pA beam and an exposure
dose of ~6×10⁻³ pA/nm2. Sub-100-nm pores are drilled using single pixel exposures at high
dwell times. Too high dosage or increased pore density were avoided, due to the possibility of
tearing of the graphene, connecting nearby pores (Fig. S7). The geometry and edge structures
of graphene pores were investigated by high-resolution transmission electron microscopy (Cs-
corrected HRTEM, JEM ARM 200F, JEOL, Japan) at an accelerating voltage of 200 kV (Fig.
S8). After patterning, the membranes were thoroughly investigated for larger holes, cracks 2
and patterning-induced defects by acquiring high resolution SEM (FEI Helios 450) images of
each patterned window. The pore sizes were subsequently characterized using these SEM
images (5 kV, 25 pA). Pore diameter distributions were determined using an image analysis
software (ImageJ 1.45s).
Characterization of pore-edge chemistry (XPS and TOFSIMS)
Samples of freestanding double-layer graphene in the patterned (2500-5000 10-nm-diameter
pores) and unpatterned (pristine graphene) states were investigated for possible differences in
the oxygen content. Since patterning leaves dangling carbon bonds at the pores formed in
graphene, it is expected that at these positions water and possibly oxygen would react to
saturate these dangling bonds. To assess the oxygen content, patterned and unpatterned
samples were mounted on Au coated Si wafers inside the FIB chamber and later analyzed by
X-ray photoelectron spectroscopy (XPS). The utilized probe was a monochromatized Al Kα
X-ray beam with a diameter of about 8 µm in a Quantum 2000 imaging XPS spectrometer
(Physical Electronics Instruments, Inc.). Imaging analysis was not possible, although the SiNx
support frame of 50×50 µm in size could well be localized. This enabled the area-selective
analysis of oxygen, carbon, silicon and nitrogen through their most intense core level lines
(O1s, C1s, N1s, Si2p).
The data show that the relative amount of oxygen with respect to carbon (i.e., the sensitivity-
corrected intensity ratio O/C) is enhanced in the patterned sample by about 10±5% as
compared to the unpatterned sample. This result corroborates the presence of dangling bonds
in graphene as a consequence of the FIB patterning and environmental exposure. Additional
time-of-flight secondary ion mass spectrometry (TOFSIMS) data comparing the fragments
O+, O-, OH- and CO- from both samples show clearly higher oxygen-containing signals from
the patterned sample. In an analogous way, this finding can be an additional support for the
3
presence of oxidation-passivated pores in the porous graphene membrane. From the acquired
data, we could mention about pore edge shape and edge chemistry as follows.
Edge shape - To fabricate our membranes, we use double-layer graphene formed by double
transferring of CVD-grown, polycrystalline graphene sheets, with crystalline sizes ranging
from sub-µm to a few µm. Thus the physically torn edges are likely to take a random
crystalline direction. Actually, the edges produced by FIB are shown random by transmission
electron microscopy (Fig. S8).
Edge chemistry - From the fact that the FIB-perforated graphene samples are taken out of the
FIB chamber and exposed to a slightly humid laboratory environment, we anticipate that
oxidation might proceed and passivate the pore edges. Passivation by oxygen-containing
chemical moieties via strong oxidation has been observed by other researchers, suggesting
that the pore edges can be terminated by carbonyl, hydroxyl, or carboxyl groups. It is,
therefore, possible that the edges of the graphene pores are also terminated by these oxygen-
containing moieties, although their number density may not be as high as observed by the
above studies. Another possibility is that trace carbon and hydrogen in the FIB chamber can
bind to the edges right after the ion bombardment, providing partial hydrogen termination.
The XPS and TOFSIMS data suggest that there exist oxygen-containing moieties at the pore
edge, but we cannot rule out unambiguously the existence of hydrogen termination. It is likely
that the graphene pore edges are terminated by a variety of chemical moieties from oxygen to
hydrogen containing species.
Effect of edge chemistry to transport - Edges are particularly important for small pores, as the
edge chemistry can alter the flow rates and selectivity. There have been theoretical studies
showing significant edge effects, such as water permeation enhancement by hydrophilic edge
termination (OH) (37), H2/CH4 selectivity reduction by N-functionalization (38), anion
4
blockage by F and N functionalization and cation blocking by H-termination (39), as well as
ion blockage by carboxyl groups (40, 41). These studies use sub-nm pores, where the electron
clouds of the functional group take up a significant portion of the pore area. For our
membranes, on the other hand, the pore sizes are 1-3 orders of magnitude larger than such
functional groups, e.g., the size of a C-O group is ~0.40 nm (considering van der Waals radii
of C (~0.11 nm) and O (~0.15 nm) and the C-O covalent bond length of ~0.14 nm) and the
size of a C-N group is ~0.42 nm (considering van der Waals radii of C and N (~0.16 nm) and
the C-N bond length of ~0.15 nm), and therefore we can safely neglect the effect of the edge
chemistry on the direct permeation .
Raman measurement of graphene membrane
We conducted two-dimensional Raman scans on both patterned (four 1 μm pores in one 4-
μm-wide window) and unpatterned free standing double layer graphene membranes (Fig. S9).
The excitation wavelength and power were 532 nm and 2 mW, respectively, and the pixel
spacing for the 2D Raman mapping was chosen to be 100 nm. The unpatterned freestanding
graphene membrane shows a high quality graphene with high G peak intensity and uniformly
low D peak intensities. The patterned graphene, on the other hand, shows a reduced G peak
intensity and a significant increase in the D peak intensity. The four 1 μm graphene pores can
be easily identified in the 2D Raman mapping.
Stability of graphene membranes
We experimentally confirmed the temperature stability of our graphene membranes. Baking
the membranes at 250°C in air for more than 2 hours did not change the pore size or lead to
any other failure as shown in (Fig. S10A). Porous graphene is also inert in strong acids, bases
and solvents. We exposed the membranes to acidic conditions in 1 M H2SO4 for 2 h and
5
acetone. We confirmed that none of the treatments causes a change of the pore sizes of the
graphene membrane (Fig. S10B, C).
Gas flow measurement setup
Single and multi-component gas flow measurements were carried out in a constant-volume /
variable-pressure apparatus (Fig. S4A). At the upstream of the setup, the calibrated mass flow
controllers (MKS, Germany) regulated the feed as well as the retentate streams; while at the
downstream, another mass flow controller adjusted the flow rate of Ar as the sweeping gas.
The flow rate and the composition of the permeate stream (i.e., H2, CO2, Ar) were determined
respectively through a mass flowmeter and a calibrated mass spectrometer (Cirrus 2, MKS,
Germany). During the measurements, the membrane was clamped in a 2 × 2 cm2 custom made
fixture made of polyoxymethylene (POM). All the measurements were carried out at room
temperature (25°C).
Single component gas measurement
To maintain the gas purity, the flow setup was evacuated and flushed with pure gases
repeatedly before each measurement. The downstream pressure was kept at atmospheric
pressure while the upstream pressure was changed in the range of 0-400 mbar gauge pressure.
All measurements used only pure gases (99.99%) without use of any carrier gas.
Separation factor characterization
The molar compositions of the gas mixtures were regulated by the mass flow controllers. The
feed flow rate was set high enough (stage cut: Permeate / Feed = 1%) in order to avoid feed
composition change due to the permeation of the feed through the membrane. Therefore, the
measurements were independent of the feed flow rates (42). The back diffusion rate of the
carrier gas (Ar) from the permeate side to the feed side through the membrane was estimated 6

to be less than 0.1 sccm, which is less than 1% of the retentate flow rate. The carrier gas
contribution to the gas data was, hence, neglected from the feed side.
Since the mass spectrometer was calibrated with different gas mixtures, the detected ratios of
the flow rates of the permeated gases are independent of the sweeping gas flow rate. The
sweeping gas flow rate was set 100-fold higher than the permeate flow rate, reducing the
partial pressure of the permeating gases at the permeate side. During the gas mixture test, the
upstream pressure was kept constant at 350 mbar gauge, while the downstream pressure was
kept at atmospheric pressure. The permeate composition was determined when the system
reached to steady state after several hours.
Quantification of leakage flow through the double layer graphene membrane
Graphene lattice is impermeable to gases because the diameter of the geometric opening of
the honeycomb carbon lattice (0.064 nm) is far smaller than the van der Waals diameter of He
atoms (0.28 nm) (5). We can consider leakage as a measure for the existence of defect-
originated pores. Bunch et al. measured a He leak rate of 105-106 atoms/s through a 2×2 µm
freestanding graphene (at ~1 bar ΔP). This area is about two orders of magnitude smaller than
our membrane area. Thus we can expect a maximum leak rate of 108 atoms/s through our
freestanding graphene before perforation. This rate is only valid for a perfect graphene lattice
and it may be claimed that our leakage rate can be larger due to carbon vacancies, grain
boundaries or other defects that can form sub-nm pores. To probe this claim, we measured our
leakage rate before the pore drilling and found it to be 3×10¹¹ molecules/s (this is the
maximum leakage value, limited by the noise of our mass spectrometer). Although this value
is three orders of magnitude larger than the prediction above, it is still 5-6 orders of magnitude
less than our measured N2 flow rates through FIB-drilled pores (in the range of 1016-1017
molecules/s, depending on the membrane and ΔP). Therefore, we believe that the mass-
transport contribution by inherent sub-nm atomic defects of CVD-grown graphene is 7
negligible, thus the influence of graphenic repulsion on the overall permeation can also be
neglected.
Characterization of the membrane clogging during the liquid flow measurement
According to a recent report (20), graphene exposed to water can be torn apart along the grain
defects and peel away from the substrate. During the water permeation test, we also found that
the graphene peeled off and blocked the pores by either covering the membrane (Fig. S11A)
or clogging the pores in an agglomerated shape (Fig. S11B), thereby leading to gradual flux
reduction. We believe that the issue of the graphene pore clogging remains to be further
investigated. In this study, we report the water permeance based on the initial flow rates
assuming that all pores are open. This data agrees with the permeance value estimations using
the final flow rate and reduced pore area (accounting for the N2 flux reduction).
Mechanical deformation of the graphene membrane and feed pressure
The deformation of the double layer graphene can be calculated using the membrane shell
theory. The basic assumption is that the membrane structure cannot support any bending
moment. This assumption leads to a very simple situation where only in-plane stresses apply,
being constant over the cross section of the structure. The bulging (deflection h from the flat
membrane) caused by a uniform pressure load on the membrane can be calculated as ℎ =
�𝑝𝑝𝑅𝑅4(1−𝜈𝜈)8𝐸𝐸𝐸𝐸
�13 (assuming 𝑡𝑡 ≪ 𝑅𝑅 and ℎ ≪ 𝑅𝑅), where p is the applied pressure, R the membrane
radius, Et the two dimensional (2D) elastic modulus with t being the membrane thickness, and
ν the poisson ratio of graphene (43).
Inserting typical values for our double layer of polycrystalline CVD graphene membrane
(𝐸𝐸𝑡𝑡 = 2 × 55 𝑁𝑁/𝑚𝑚, 𝜈𝜈 = 0.3, 𝑝𝑝 = 40𝑘𝑘𝑘𝑘𝑘𝑘, 𝑅𝑅 = 2𝜇𝜇𝑚𝑚) a maximal deflection ℎ ≈ 115 𝑛𝑛𝑚𝑚 at
the center of the 4µm diameter free-standing graphene membrane is obtained (44). This 8
calculated deflection is slightly higher than the deflection of single-crystalline graphene flakes
measured at low pressures by AFM (45), which is consistent with the reported effect of
softened elastic response of multi crystalline CVD graphene (44). Note that the patterned
pores further weaken the elastic response of the graphene membrane. This effect can be easily
accounted for by including the notion of membrane porosity 𝜎𝜎 to reduce the 2D elastic
modulus: 𝐸𝐸𝑡𝑡𝑝𝑝𝑝𝑝𝑝𝑝𝑝𝑝𝑝𝑝𝑝𝑝 = (1 − 𝜎𝜎)𝐸𝐸𝑡𝑡 . The graphene membranes reported here have a typical
porosity of 3-4%, and therefore the changes of the elastic modulus would be minor.
The calculated membrane deflection is very small causing only very little change of the
curvature of the 4-μm diameter membrane. Since the membrane is operated in steady state
conditions and the estimated curvature caused by the bulging is quite small, we do not believe
that the permeation mechanism would be altered significantly. Another concern is the
corresponding in plane strain in the graphene sheet, which could potentially increase the pore
size. However, the calculated strain 𝜖𝜖 ≈ 2.2 × 10⁻³ is not sufficient to significantly increase
the membrane pore size. Both assumptions are supported by the gas permeation data obtained
from our membranes. The gas flux is linear in the applied pressure drop over the range of 0 to
2 bar indicating that even at high membrane pressures there is no noticeable pore size
increase. Hence we conclude that the bulging of the graphene membrane in our experimental
condition is not strong enough to have a significant effect on the permeation.
9
Supplementary Figures
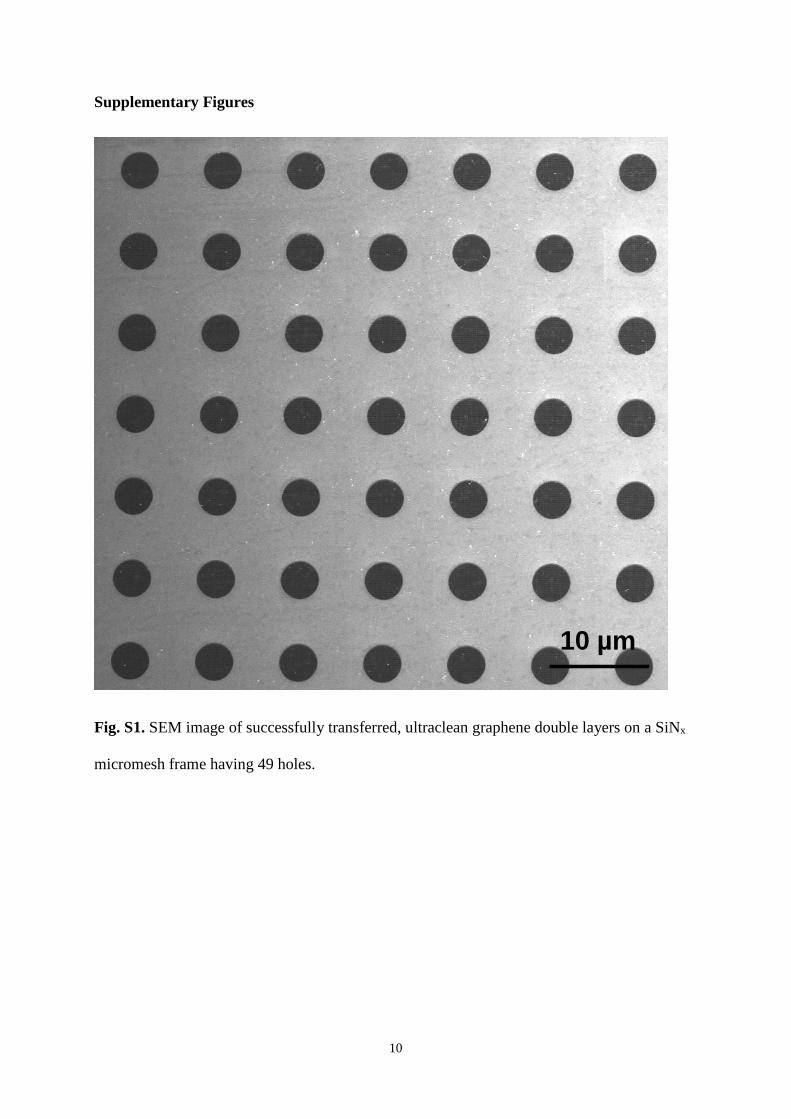
Fig. S1. SEM image of successfully transferred, ultraclean graphene double layers on a SiNx
micromesh frame having 49 holes.
10 µm
10

Fig. S2. N2 gas fluxes with respect to applied pressure difference across the membrane
showing linear relationship.
Fig. S3. N2 gas flow rate with respect to applied pressure difference across 50-nm-pore
graphene membrane at higher pressures up to 2 bar.
0 100 200 300 400 5000
2
4
6
8
7.6 nm 100 nm 400 nm 1000 nm
Flux
(109 s
ccm
m-2)
Pressure difference (mbar)
0 500 1000 1500 20000.0
0.2
0.4
0.6
0.8
1.0
1.2
N2 f
low
rate
(scc
m)
Pressure difference (mbar)
11
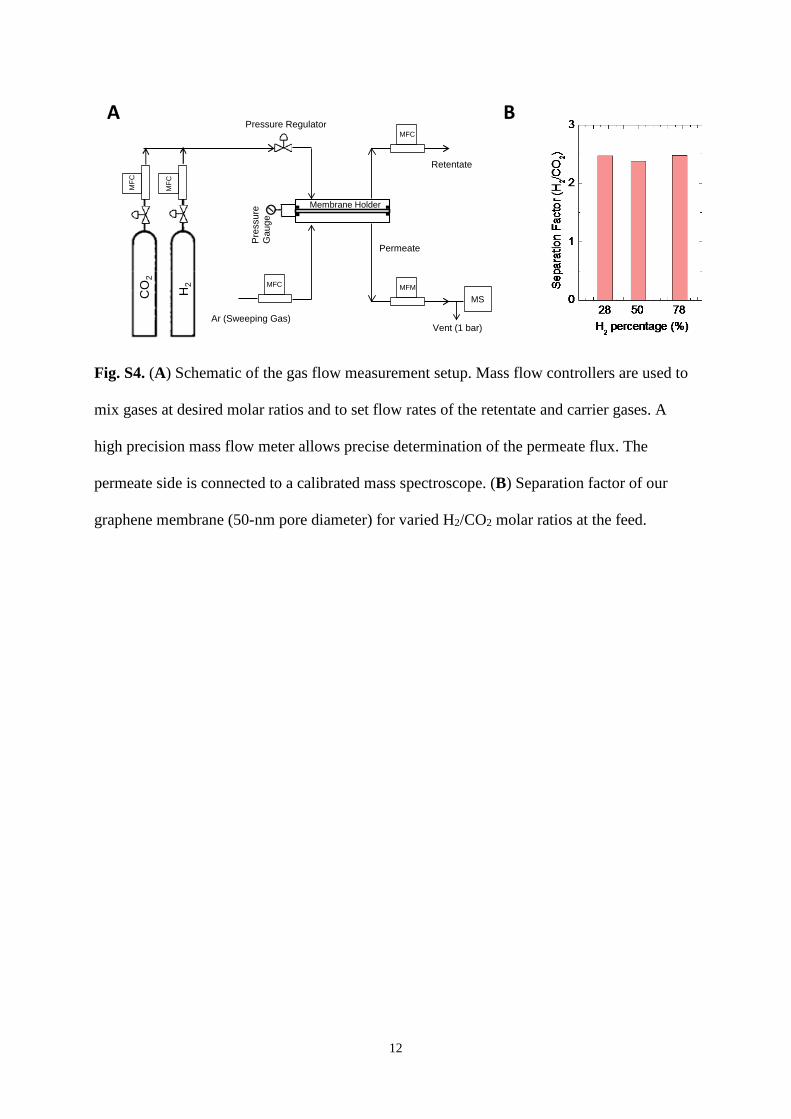
Fig. S4. (A) Schematic of the gas flow measurement setup. Mass flow controllers are used to
mix gases at desired molar ratios and to set flow rates of the retentate and carrier gases. A
high precision mass flow meter allows precise determination of the permeate flux. The
permeate side is connected to a calibrated mass spectroscope. (B) Separation factor of our
graphene membrane (50-nm pore diameter) for varied H2/CO2 molar ratios at the feed.
Retentate
Pressure Regulator
MFCMFC
MFC
Ar (Sweeping Gas)
MFC
MFM
MS
Vent (1 bar)
Pres
sure
G
auge
CO
2
H2
Membrane Holder
Permeate
A B
12

Fig. S5. Water vapor transmission through a 400-nm-pore graphene membrane. Raw data of
measured weight loss over time in the upright cup evaporation experiment. Red dots are
measured values, and the black line is the linear fit of the weight loss rate. The measurement
was carried out at 35% relative humidity at 25oC.
Fig. S6. Raw data of measured DI water permeation through a 200-nm-pore graphene
membrane. Applied membrane feed pressure is 250 mbar. Red dots are measured values and
black line is the linear fit of the permeate flow rate after flow stablilization.
0 500 10000.0
0.5
1.0
1.5
2.0
2.5
Wei
ght l
oss
(mg)
Time (min)
0 5 10 150.0
0.5
1.0
1.5
2.0
2.5
Perm
eate
d vo
lum
e (m
m3 )
time (min)
13
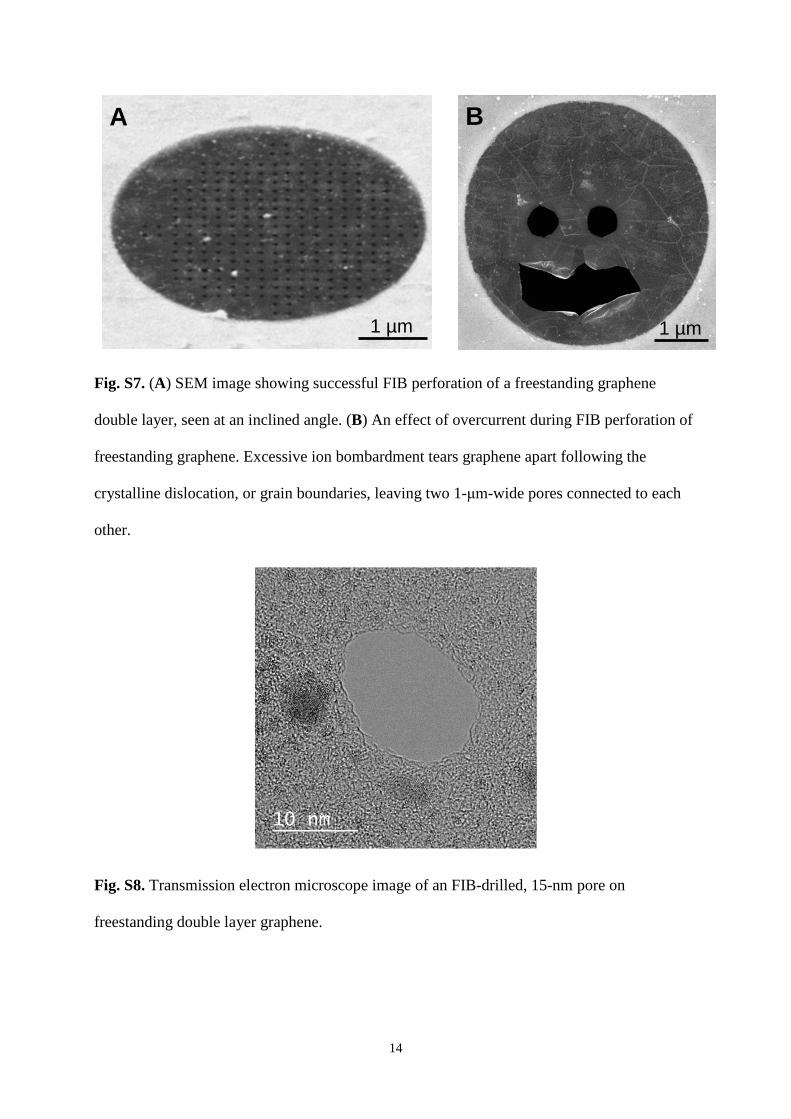
Fig. S7. (A) SEM image showing successful FIB perforation of a freestanding graphene
double layer, seen at an inclined angle. (B) An effect of overcurrent during FIB perforation of
freestanding graphene. Excessive ion bombardment tears graphene apart following the
crystalline dislocation, or grain boundaries, leaving two 1-μm-wide pores connected to each
other.
Fig. S8. Transmission electron microscope image of an FIB-drilled, 15-nm pore on
freestanding double layer graphene.
1 µm 1 µm
A B
14
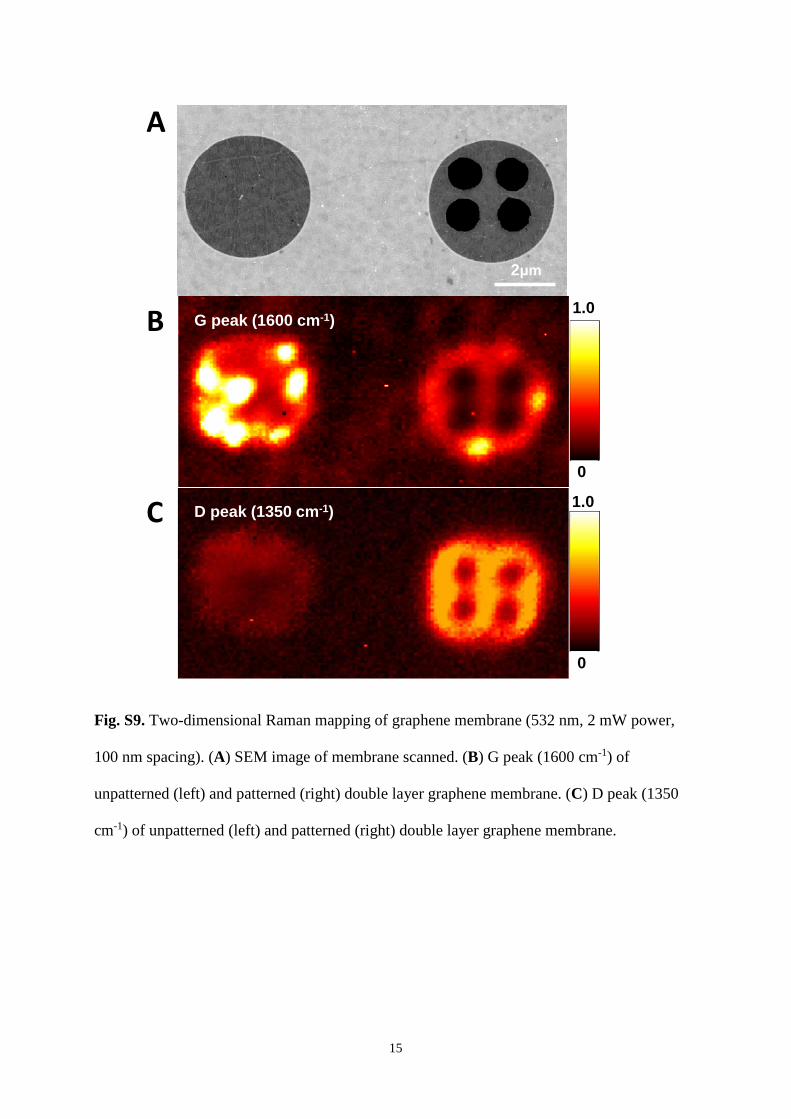
Fig. S9. Two-dimensional Raman mapping of graphene membrane (532 nm, 2 mW power,
100 nm spacing). (A) SEM image of membrane scanned. (B) G peak (1600 cm-1) of
unpatterned (left) and patterned (right) double layer graphene membrane. (C) D peak (1350
cm-1) of unpatterned (left) and patterned (right) double layer graphene membrane.
2μm
D peak (1350 cm-1) 1.0
0
G peak (1600 cm-1)1.0
0
A
B
C
15
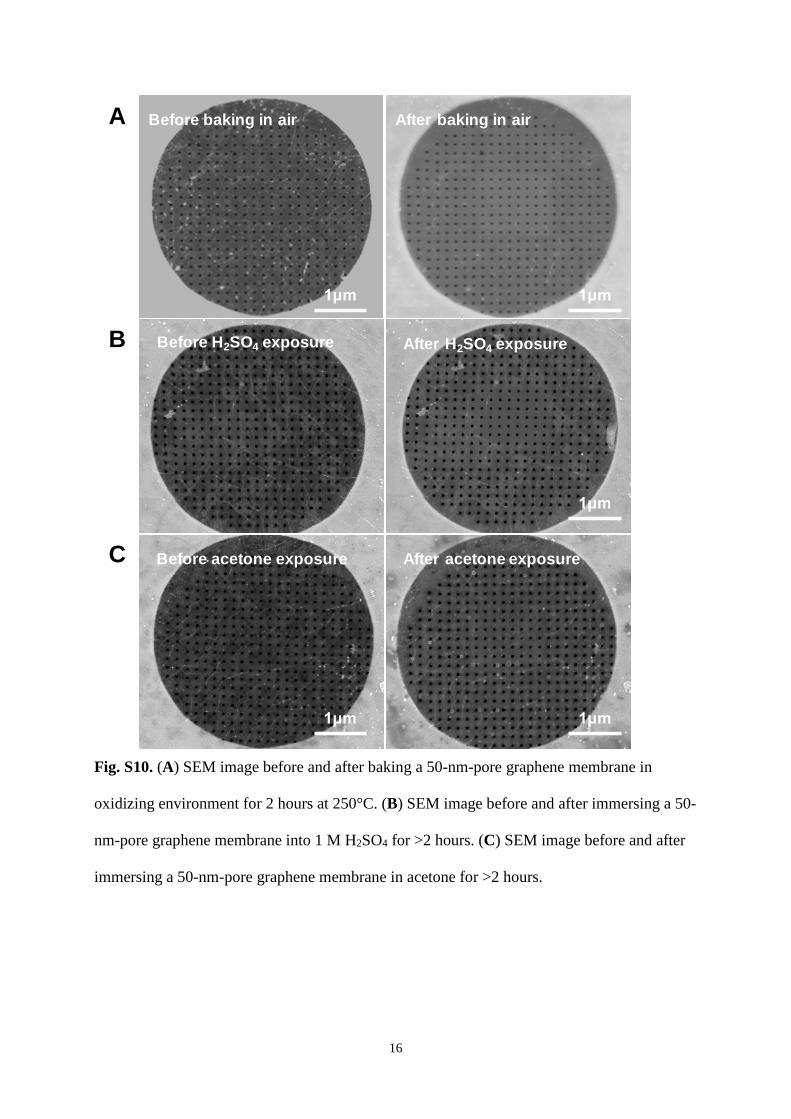
Fig. S10. (A) SEM image before and after baking a 50-nm-pore graphene membrane in
oxidizing environment for 2 hours at 250°C. (B) SEM image before and after immersing a 50-
nm-pore graphene membrane into 1 M H2SO4 for >2 hours. (C) SEM image before and after
immersing a 50-nm-pore graphene membrane in acetone for >2 hours.
1μm
Before acetone exposure
1μm
After acetone exposure
After H2SO4 exposure
1μm
Before H2SO4 exposure
After baking in air
1μm
Before baking in air
1μm
A
B
C
16
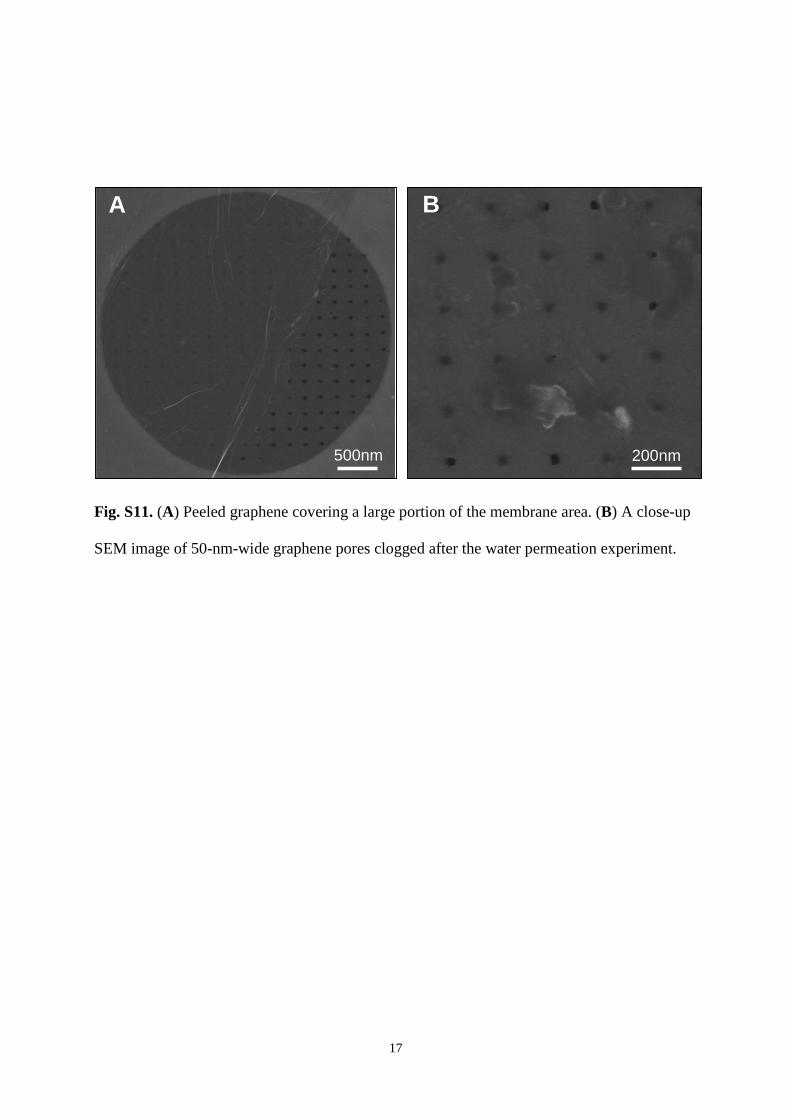
Fig. S11. (A) Peeled graphene covering a large portion of the membrane area. (B) A close-up
SEM image of 50-nm-wide graphene pores clogged after the water permeation experiment.
200nm500nm
A B
17
References and Notes 1. X. Li, W. Cai, J. An, S. Kim, J. Nah, D. Yang, R. Piner, A. Velamakanni, I. Jung, E. Tutuc, S.
K. Banerjee, L. Colombo, R. S. Ruoff, Large-area synthesis of high-quality and uniform graphene films on copper foils. Science 324, 1312–1314 (2009). doi:10.1126/science.1171245
2. K. S. Kim, Y. Zhao, H. Jang, S. Y. Lee, J. M. Kim, K. S. Kim, J. H. Ahn, P. Kim, J. Y. Choi, B. H. Hong, Large-scale pattern growth of graphene films for stretchable transparent electrodes. Nature 457, 706–710 (2009). doi:10.1038/nature07719 Medline
3. K. S. Novoselov, A. K. Geim, S. V. Morozov, D. Jiang, Y. Zhang, S. V. Dubonos, I. V. Grigorieva, A. A. Firsov, Electric field effect in atomically thin carbon films. Science 306, 666–669 (2004). doi:10.1126/science.1102896
4. J. S. Bunch, S. S. Verbridge, J. S. Alden, A. M. van der Zande, J. M. Parpia, H. G. Craighead, P. L. McEuen, Impermeable atomic membranes from graphene sheets. Nano Lett. 8, 2458–2462 (2008). doi:10.1021/nl801457b Medline
5. V. Berry, Impermeability of graphene and its applications. Carbon 62, 1–10 (2013). doi:10.1016/j.carbon.2013.05.052
6. S. Garaj, W. Hubbard, A. Reina, J. Kong, D. Branton, J. A. Golovchenko, Graphene as a subnanometre trans-electrode membrane. Nature 467, 190–193 (2010). doi:10.1038/nature09379 Medline
7. S. P. Koenig, L. Wang, J. Pellegrino, J. S. Bunch, Selective molecular sieving through porous graphene. Nat. Nanotechnol. 7, 728–732 (2012). doi:10.1038/nnano.2012.162 Medline
8. S. C. O’Hern, C. A. Stewart, M. S. Boutilier, J. C. Idrobo, S. Bhaviripudi, S. K. Das, J. Kong, T. Laoui, M. Atieh, R. Karnik, Selective molecular transport through intrinsic defects in a single layer of CVD graphene. ACS Nano 6, 10130–10138 (2012). doi:10.1021/nn303869m Medline
9. K. Celebi, M. T. Cole, J. W. Choi, F. Wyczisk, P. Legagneux, N. Rupesinghe, J. Robertson, K. B. Teo, H. G. Park, Evolutionary kinetics of graphene formation on copper. Nano Lett. 13, 967–974 (2013). doi:10.1021/nl303934v Medline
10. H. W. Kim, H. W. Yoon, S. M. Yoon, B. M. Yoo, B. K. Ahn, Y. H. Cho, H. J. Shin, H. Yang, U. Paik, S. Kwon, J. Y. Choi, H. B. Park, Selective gas transport through few-layered graphene and graphene oxide membranes. Science 342, 91–95 (2013). doi:10.1126/science.1236098
11. H. Li, Z. Song, X. Zhang, Y. Huang, S. Li, Y. Mao, H. J. Ploehn, Y. Bao, M. Yu, Ultrathin, molecular-sieving graphene oxide membranes for selective hydrogen separation. Science 342, 95–98 (2013). doi:10.1126/science.1236686
12. R. A. Sampson, On Stokes’s current function. Philos. Trans. R. Soc. London A 182, 449–518 (1891). doi:10.1098/rsta.1891.0012
13. K.-K. Tio, S. S. Sadhal, Boundary conditions for stokes flows near a porous membrane. Appl. Sci. Res. 52, 1–20 (1994). doi:10.1007/BF00849164
14. M. Knudsen, Die Gesetze der Molekularströmung und der inneren Reibungsströmung der Gase durch Röhren. Ann. Phys. 333, 75–130 (1909). doi:10.1002/andp.19093330106
15. N. Dongari, A. Sharma, F. Durst, Pressure-driven diffusive gas flows in micro-channels: from the Knudsen to the continuum regimes. Microfluid. Nanofluid. 6, 679 (2009).
16. L. Lund, A. Berman, Flow and self‐diffusion of gases in capillaries. Part I. J. Appl. Phys. 37, 2489 (1966). doi:10.1063/1.1708841
17. R. D. Present, A. J. Debethune, Separation of a gas mixture flowing through a long tube at low pressure. Phys. Rev. 75, 1050–1057 (1949). doi:10.1103/PhysRev.75.1050
18. A. Gugliuzza, E. Drioli, A review on membrane engineering for innovation in wearable fabrics and protective textiles. J. Membr. Sci. 446, 350–375 (2013). doi:10.1016/j.memsci.2013.07.014
19. S. A. Brewer, Recent advances in breathable barrier membranes for individual protective equipment. Rec. Pat. Mat. Sci. 4, 1 (2011). doi:10.2174/1874465611104010001
20. T. Yoon, J. H. Mun, B. J. Cho, T.-S. Kim, Penetration and lateral diffusion characteristics of polycrystalline graphene barriers. Nanoscale 6, 151–156 (2013).
21. L. M. Robeson, The upper bound revisited. J. Membr. Sci. 320, 390–400 (2008). doi:10.1016/j.memsci.2008.04.030
22. Y. Li, F. Liang, H. Bux, W. Yang, J. Caro, Zeolitic imidazolate framework ZIF-7 based molecular sieve membrane for hydrogen separation. J. Membr. Sci. 354, 48–54 (2010). doi:10.1016/j.memsci.2010.02.074
23. Z. Tang, J. Dong, T. M. Nenoff, Internal surface modification of MFI-type zeolite membranes for high selectivity and high flux for hydrogen. Langmuir 25, 4848–4852 (2009). doi:10.1021/la900474y Medline
24. R. M. de Vos, H. Verweij, High-selectivity, high-flux silica membranes for gas separation. Science 279, 1710–1711 (1998). doi:10.1126/science.279.5357.1710
25. K. Nagai, A. Higuchi, T. Nakagawa, Gas permeability and stability of poly (1‐trimethylsilyl‐1‐propyne‐co‐1‐phenyl‐1‐propyne) membranes. J. Polym. Sci. B 33, 289–298 (1995). doi:10.1002/polb.1995.090330214
26. M. E. Rezac, B. Schöberl, Transport and thermal properties of poly (ether imide)/acetylene-terminated monomer blends. J. Membr. Sci. 156, 211–222 (1999). doi:10.1016/S0376-7388(98)00346-9
27. D. Shekhawat, D. R. Luebke, H. W. Pennline, “A review of carbon dioxide selective membranes: A topical report,” Report DOE/NETL 2003/1200 (U.S. Department of Energy, National Energy Technology Laboratory, Pittsburgh, PA, 2003).
28. W. J. Koros, R. Mahajan, Pushing the limits on possibilities for large scale gas separation: Which strategies? J. Membr. Sci. 175, 181–196 (2000). doi:10.1016/S0376-7388(00)00418-X
29. P. Bernardo, E. Drioli, G. Golemme, Membrane gas separation: A review/state of the art. Ind. Eng. Chem. Res. 48, 4638–4663 (2009). doi:10.1021/ie8019032
30. B. Freeman, Y. Yampolskii, I. Pinnau, Materials Science of Membranes for Gas and Vapor Separation (Wiley, New York, 2006).
31. A. Mehta, A. L. Zydney, Permeability and selectivity analysis for ultrafiltration membranes. J. Membr. Sci. 249, 245–249 (2005). doi:10.1016/j.memsci.2004.09.040
32. R. Shukla, M. Balakrishnan, G. P. Agarwal, Bovine serum albumin-hemoglobin fractionation: Significance of ultrafiltration system and feed solution characteristics. Bioseparation 9, 7–19 (2000). doi:10.1023/A:1008194300403 Medline
33. S. Nakatsuka, A. S. Michaels, Transport and separation of proteins by ultrafiltration through sorptive and non-sorptive membranes. J. Membr. Sci. 69, 189–211 (1992). doi:10.1016/0376-7388(92)80039-M
34. H. Guo, G. Zhu, I. J. Hewitt, S. Qiu, “Twin copper source” growth of metal-organic framework membrane: Cu3(BTC)2 with high permeability and selectivity for recycling H2. J. Am. Chem. Soc. 131, 1646–1647 (2009). doi:10.1021/ja8074874 Medline
35. B. Elyassi, M. Sahimi, T. T. Tsotsis, Silicon carbide membranes for gas separation applications. J. Membr. Sci. 288, 290–297 (2007). doi:10.1016/j.memsci.2006.11.027
36. J. W. Suk, A. Kitt, C. W. Magnuson, Y. Hao, S. Ahmed, J. An, A. K. Swan, B. B. Goldberg, R. S. Ruoff, Transfer of CVD-grown monolayer graphene onto arbitrary substrates. ACS Nano 5, 6916–6924 (2011). doi:10.1021/nn201207c Medline
37. D. Cohen-Tanugi, J. C. Grossman, Water desalination across nanoporous graphene. Nano Lett. 12, 3602–3608 (2012). doi:10.1021/nl3012853 Medline
38. D. E. Jiang, V. R. Cooper, S. Dai, Porous graphene as the ultimate membrane for gas separation. Nano Lett. 9, 4019–4024 (2009). doi:10.1021/nl9021946 Medline
39. K. Sint, B. Wang, P. Král, Selective ion passage through functionalized graphene nanopores. J. Am. Chem. Soc. 130, 16448–16449 (2008). doi:10.1021/ja804409f Medline
40. D. Konatham, J. Yu, T. A. Ho, A. Striolo, Simulation insights for graphene-based water desalination membranes. Langmuir 29, 11884–11897 (2013). doi:10.1021/la4018695 Medline
41. A. K. Mishra, S. Ramaprabhu, Functionalized graphene sheets for arsenic removal and desalination of sea water. Desalination 282, 39–45 (2011). doi:10.1016/j.desal.2011.01.038
42. H. Lin, E. Van Wagner, B. D. Freeman, L. G. Toy, R. P. Gupta, Plasticization-enhanced hydrogen purification using polymeric membranes. Science 311, 639–642 (2006). doi:10.1126/science.1118079
43. M. K. Small, W. Nix, Analysis of the accuracy of the bulge test in determining the mechanical properties of thin films. J. Mater. Res. 7, 1553–1563 (1992). doi:10.1557/JMR.1992.1553
44. C. S. Ruiz-Vargas, H. L. Zhuang, P. Y. Huang, A. M. van der Zande, S. Garg, P. L. McEuen, D. A. Muller, R. G. Hennig, J. Park, Softened elastic response and unzipping in chemical vapor deposition graphene membranes. Nano Lett. 11, 2259–2263 (2011). doi:10.1021/nl200429f Medline

45. S. P. Koenig, N. G. Boddeti, M. L. Dunn, J. S. Bunch, Ultrastrong adhesion of graphene membranes. Nat. Nanotechnol. 6, 543–546 (2011). doi:10.1038/nnano.2011.123 Medline