supplementary material for energy/ghg consensus …
TRANSCRIPT

1
SUPPLEMENTARY MATERIAL FOR ENERGY/GHG CONSENSUS QUESTION 2010
This material was prepared by the LWVDE Energy/Green House Gas Subcommittee during the period of
late August 2010 to late February 2011. Its members were: John Austin, Chris Bason, Sumner Crosby,
Mary Anne Edwards, Steve Hegedus, Peggy Schultz and Chad Tolman. Detailed information is provided
in 8 sections, including figures, tables and references. The figures and tables start with number 1 in each
section; the references for all 8 sections are in a single set of Endnotes.
SECTION 1. LWVUS and LWVDE KEY STATEMENTS ON GHGS AND CLIMATE CHANGE
The national, as well as the Delaware leadership of the League of Women Voters, spoke out early and
forcefully about the threat to the future vitality of the Earth if actions are not taken to aggressively protect
our environment. At its 2008 national membership meeting the LWVUS agreed that global climate
change is one of the most serious threats to the environment, health and economy of our nation. Noting
that recent scientific studies show global warming is already causing environmental changes that will
have significant global impacts, the LWVUS created the Climate Change Task Force (CCTF) from its
membership to address this issue. One of the tangible products of this committee is the creation of the
LWV Toolkit For Climate Action, an excellent resource for classroom teachers and the public, now on the
League website (www.lwv.org) under Toolkit for Climate Action1
The LWVUS called for prompt and aggressive action to cut U.S. greenhouse gas (GHG) emissions and
cited detailed objectives to guide the development of comprehensive climate legislation. In a letter to the
U.S. House of Representatives in January 2009, Mary G. Wilson LWVUS President, wrote the following:
“The League of Women Voters strongly urges you to take quick and strong action against global climate
change. Based on the best available science, we urge you to support a cap on greenhouse gas emissions
for the year 2020 that is at least 20 percent below 1990 levels, without loopholes that will undermine the
cap. We also ask that you support a cap for the year 2050 that is 80-100 percent below 1990 emissions.”2
Delaware‟s League of Women Voters exercised strong leadership on this subject. In a Letter to the Editor,
December 11, 2009, published in both the Cape Gazette and Vol. 16, No. 4 of the LWV NCOs VOTER,
Delaware League President Sandy Spence wrote:
“The League of Women Voters of Delaware believes that global climate change is one of the most serious
threats to the environment, health, economy and security of our nation and the world. League members
throughout the country call on the United States and world political leaders to cap emissions at 25%
below 1990 levels by 2020. We also join many other civic and social organizations in urging providing
critical adaptation and associated assistance to countries most in need. Delaware itself is especially
vulnerable to sea level rise, as it has the lowest average elevation of any state in the country....”3
In 2010, the national environmental debate is framed as a jobs issue. Reporting on the opening of UD‟s
Dec. 13 - 14 conference on “Creating the Clean Energy Economy”, The News Journal, bluntly states that
it‟s time to drop the ideological blinders when it comes to clean energy - the clean energy issue belongs to
all of us and is primarily about jobs. Conference speakers said the Chinese and Europeans get this
important point - it‟s we American‟s, or at least our politicians, who don‟t. America will be playing catch
up unless we stop ideological arguments, reduce our reliance on fossil fuels and focus on innovation in
cleaner energy industries. Delaware is well positioned with its state leadership and its institutions of
higher learning to do just this.

2
SECTION 2. THE BASIC SCIENCE OF CLIMATE CHANGE AND THE ROLE OF GHGS,
ESPECIALLY CO2
In the long span of about 4.5 billion years since the earth was first formed, it has undergone many
changes, with temperatures ranging from superheated steam to freezing cold. Just in the past 800,000
years we have gone from warm interglacial periods to ice ages when Manhattan was buried beneath a
mile of ice, and sea levels were low enough that people could walk from Siberia to Alaska.
For the past 8,000-10,000 years, during which time civilization developed, the global average temperature
and the sea level have been remarkably stable. That started to change in about 1750 with the coming of
the Industrial Revolution and the steam engine. The burning of fossil fuels – starting with coal, and later
oil and natural gas – has added carbon dioxide (CO2) to the atmosphere as the population grew and as
more people wanted the comfort and convenience provided by machines getting their energy from fossil
fuels. The concentration of CO2 in the atmosphere has increased from about 280 parts per million (ppm)
in 1750 to about 390 ppm today, and it‟s increasing by more than 2 ppm per year as emissions continue to
increase.4 The global average temperature has increased by about 0.8°C (1.5°F) since 1750, mostly in the
last 30 years. The rate of warming is increasing and would continue to increase for several decades even
if we were able to bring emissions of CO2 and other greenhouse gases (GHGs) to a sudden stop. The
slow response is called inertia in the climate system. Like the QE2, it takes time to respond and can‟t be
turned on a dime.
Carbon dioxide and a number of other gases in the atmosphere (water vapor, methane, nitrous oxide,
ozone and fluorochemicals – but not oxygen or nitrogen) are called greenhouse gases because they act
much like the glass on a greenhouse, allowing radiation from the sun (mostly visible light) to pass
through the atmosphere, but impeding the longer wavelength infrared radiation from Earth from escaping
back into space. Thus the glass on a greenhouse or these gases in the atmosphere make in warmer at the
surface of the earth that it would be otherwise. (Your car, left in the sun with the windows rolled up,
behaves similarly.) The average temperature at earth‟s surface is now about 60°F; without GHGs the
average temperature would be 0°F, and the oceans would be frozen. Global average temperatures remain
stable only as long as the rate of energy absorbtion from the sun is balanced by an equal rate of energy
loss into space.
Scientists have two ways to estimate what they call „climate sensitivity,‟ the amount by which the average
surface temperature rises for a doubling of CO2 concentration. One is based on computer models of the
atmosphere, land, ocean and ice system, and the other is by looking back to see the relationship between
CO2 concentration and temperature in the planet‟s past. The first gives sensitivities of about 1.5 to 4.5°C
per doubling,5 while the second gives about 6°C,
6 once enough time has passed to allow the oceans to
warm up as much as they are going to and enough ice to melt and vegetation to move so that a new steady
equilibrium condition is reached. Major sources of uncertainty are changes in clouds, the release of CO2
and methane from natural sources as the earth warms, and how much time is required to reach
equilibrium. Predicting the future is difficult both because of uncertainties in how the climate will
respond to a particular concentration of GHGs and how rapidly humanity will reduce rates of emissions or
take other actions to affect the balance of incoming and outgoing radiation.
One of the most important impacts of global warming for Delaware is flooding due to a combination of
sea level rise (SLR) and increasing intensity of storms. Sea level in Delaware is rising as a result of
expansion of water as it warms, the addition of water from the melting of ice on land, and the slow
sinking of the land. During the past century these factors caused the sea level at Lewes to rise about a
foot (0.3 meter) relative to the land. SLR by 2100 is projected to be in the range of 0.5 to 1.5 m (1.7 to 5
feet),7 but could be much more, depending on how rapidly GHGs are added to the atmosphere.
8 The
warming of water and the melting of ice takes heat, and the heat is being supplied by the imbalance

3
between the incoming solar radiation being absorbed and the radiation going out into space. Warming
increases the rate of water evaporation and makes it possible for the atmosphere to hold more water
vapor. The result is increased droughts in some areas and floods in others. Low pressures during storms
can add storm surges along the coast of 4 or 5 feet to the rising sea level, bringing salt water farther inland
and endangering beaches, buildings, roads, bridges and farms. Delaware has already begun to plan ahead
to minimize the damage from the climate change that cannot be avoided.4
SECTION 3. DELAWARE’S PER CAPITA ENERGY CONSUMPTION AND GHG EMISSIONS
The U.S. Dept. of Energy gives the rank ordering of states by per capita energy consumption. Some of
the data for 2008 are shown in Table 1 ranked from highest to lowest per capita use.
Table 1. 2008 Per Capita Energy Use by State9
Rank State Million BTU
1 WY 1016
2 AK 946
3 LA 783
4 ND 687
25 DE 337
32 PA 310
34 NJ 304
40 MD 256
47 CA 229
48 MA 225
49 HI 220
50 RI 209
51 NY 205
Delaware is right in the middle of the rank ordering. (There are 51 because DC is included.) While
Delaware‟s per capita energy use is only a half to a third of the worst states, it is higher than that in any of
its neighbors and about 50% higher than the best states at the bottom of the list. Note that 38% of
Delaware‟s electricity is generated out of state and imported via the PJM grid.10
Figure 1b11
shows the carbon dioxide emissions (in 2008) on a per capita use basis. The ranking of states
is similar to that shown in Table 1, but different. Now Delaware is 12th from the top while VT has the
lowest per capita emissions. This is probably because much of Delaware‟s electricity comes from coal,
while much of Vermont‟s comes from hydropower. Wyoming is so high in the table and the figure
because if burns a lot of coal to produce electricity that is consumed in other states. The U.S. average is
20.6 metric tons (mt) per capita, with DE approximately 35% higher than that.

4
QuickTime™ and aTIFF (Uncompressed) decompressor
are needed to see this picture.
Table 2 below shows selected per capita CO2 emissions by country, listed in decreasing order for 2006.
Table 2. List of Countries by Carbon Dioxide Emissions per capita (mt)12
Country 1990 2006
Qatar 25.2 56.2
U.S. 19 19
Canada 16.2 16.7
Denmark 9.8 9.9
UK 10 9.4
Germany 12.2 (1991) 9.7
China 2.1 4.6
India 0.8 1.3
Solomon Islands 0.5 0.4
Haiti 0.1 0.2
Qatar and some other oil-rich Middle Eastern countries have the highest per capita CO2 emissions, but
their populations are small. Though China has passed the U.S. in total emissions (note the large increase
in per capita emissions from 1990 to 2006), on a per capita basis emissions are still only a quarter of those
in the U.S. India is less than a tenth. Haiti, a very poor and densely populated Caribbean nation, is 1%.
Note that the only country to experience a significant decrease in emissions was Germany, where CO2
decreased by 20%. This is largely due to strong national policies to promote the installation of clean
renewable energy and improved energy efficiency. These policies have resulted in a significant growth in
clean energy industries and employment.

5
In Delaware significant reductions in energy use are possible with weatherization, improved building
design, and more efficient transportation. Electric motors are inherently more energy efficient that
internal combustion engines. A fleet of electric vehicles or plug-in hybrids with large batteries could use
energy provided largely by wind or solar power. The batteries could also provide a means of storing
energy during times of strong winds or bright sunshine when more renewable energy is generated than is
needed by the grid. This concept is called V2G (Vehicle to Grid) and is being tested in a collaborative
effort of the University of Delaware and Delmarva Power.13
SECTION 4. IMPACTS OF CLIMATE CHANGE ON DELAWARE
The 1990„s were the warmest decade in a thousand years. And it‟s not going to get better. The
Intergovernmental Panel on Climate Change says that average temperatures by 2100 will range from 3.2
to 7.2°F hotter than current temperatures, with winters warming more than summers.14
That doesn‟t
sound too remarkable, but let‟s look at some of the implications of what may appear at first to be a
modest temperature increase.
Scientists say that Delaware‟s growing season will last longer, and for a state whose major industry is
agriculture, that could be good news. Unfortunately, weeds migrating from the south will also be more
prolific. Crops and domestic animals will suffer from a higher survival rate of pathogens and parasites,
including the corn flea beetle. Corn, as you know, is Delaware‟s major crop, yielding $36 million
annually.15
Furthermore, heat is shown to have a negative influence on the production of milk,
Delaware‟s fifth most important agricultural product.16
Heat waves will be more common, and people
who cannot afford air conditioning, especially the aged, will be at risk. Warmer air is also an
encouragement to the formation of ozone. Northern Delaware is already a “moderate nonattainment” area
for ozone17
, which is known to aggravate respiratory illnesses as well as to reduce crop yields. Warmer
seas will be more susceptible to algae blooms which can carry harmful bacteria, potentially harmful to
both people and shellfish nursery habitats.18
With climate change will come greater storm intensity, with precipitation coming in short, intense bursts.
The EPA says that precipitation, already increased up to 10% in some parts of the state, will increase 15-
40% in all seasons.19
In 2009 a pea farmer in Kent County complained that flooding reduced his crop to
about 1/4 of the usual yield. Several parts of State Highway #9 routinely close due to flooding following
only moderate rainfalls. Though this weather event should not be equated with a climate change event, it
is indicative of things to come. Increased precipitation in the winter comes with a serious price tag: last
winter‟s “Snowmegeddon” cost Delaware taxpayers $8.8 million for snow removal.20
Sea level rise, another impact of global warming, will drive Delaware Bay‟s salt water further north,
devastating baby oysters and intruding into aquifers normally used for drinking water. The oyster harvest
was worth $19.2 million in 2009 alone.21
Some landowners are already losing irrigation wells and ponds
to saltwater intrusion.22
Given that 70-90% of the state‟s commercial fish and shellfish either live entirely
in estuaries or use them as nurseries, a net loss of wetlands or increased salt in the water could seriously
affect our fishermen‟s chances of earning a living.23
Increased salinity in our waterways will also
increase damage to infrastructure.
WILMAPCO, in the early stages of a report on climate change‟s effects on transportation, points out that
New Castle County is more likely to suffer from sea level rise than either of the other two counties
because of its vulnerable infrastructure, including roadways, dikes, railroads and sewage facilities. Salt-
water intrusion and inundation will both be increasingly serious problems. Already the Wilmington water
gates that discharge storm water are below river level for all but a few hours each day. With 4 1/2 feet of
sea level rise, Wilmington‟s Southbridge neighborhood will be under water. Even now, several times a
year when we have big rains, many places along Route 9 have to be closed due to flooding. Dikes and

6
impoundments all along the Delaware River have already been breached multiple times, threatening both
homes and wetlands.
Delaware‟s land is also slowly sinking, which adds to the effects of sea level rise. One expert says that
we can expect sinking of one foot by the next century.24
Sea level rise, when combined with wind-driven waves, increases flood risk and flood damage that has
already destroyed boardwalks and houses, and will ultimately even wash away hotels.25
In 2006, tourism
brought $2.6 billion to the state.26
That income is threatened as properties along both the ocean and
Delaware River coasts are increasingly subject to storm damage. A rising water table near the inland bays
poses a particular at risk because of the fly ash piles next to the Indian River Power Plant; harmful
chemicals in the fly ash can easily leach into the drinking water.27
By the end of the century a marked increase in extreme heat waves during the summers is expected to
have serious health impacts on the elderly, the very young and the homeless.28
Delaware‟s 381 miles of shoreline, its average elevation of 65 feet, its dependence on agriculture and
tourism for economic well-being, all combine to make a compelling case for attention to climate change
issues in the State.
SECTION 5. STEPS DELAWARE HAS TAKEN TO REDUCE GREENHOUSE GAS
EMISSIONS AND ADAPT TO CLIMATE CHANGE
Efforts to reduce greenhouse gas emissions are taking place at all levels of government in the Mid-
Atlantic Region, and especially here in Delaware. A wide variety of programs to reduce emissions, and
promote energy efficiency and clean energy have been put in place, and state government is developing
plans to reduce shoreline erosion and other effects sea level rise will have on Delaware‟s infrastructure
and economy.
With 381 miles of shoreline, Delaware is particularly susceptible to increased coastal erosion and
wetlands inundation from sea level rise along its many beaches and inland waterways. Changes in
Delaware‟s average temperature, precipitation, and sea level have the potential to alter agricultural
production and to affect local and regional hydrology - directly impacting not only the state‟s forests,
wetlands, and estuarine environments, but also the habitation of coastal areas and even human health.
In 2008 Governor Minner signed Senate Bill 263 authorizing Delaware‟s participation in the Regional
Greenhouse Gas Initiative (RGGI), the nation's first market-based, mandatory cap-and-trade program to
reduce greenhouse gas (GHG) emissions.29
It applies to power plants larger than 25 MW and aims to
reduce GHG emissions from plants in the 10-state region by 10% by 2019. The bill set aside 10% of the
money raised by the sale of the state‟s CO2 emission allowances to fund GHG emission reduction
projects in Delaware through a competitive grant program. A Greenhouse Gas Reduction Reduction
Projects Advisory Body was established and met in May 2010, and has since evaluated 36 proposals in
response to a Request for Proposals (RFP) from DNREC, with $1.4 million available for grants in the first
round of funding. Delaware‟s Sustainable Energy Utility (SEU) receives 65% of RGGI auction proceeds
to promote energy efficiency and distributed renewable energy; 15% goes to weatherizing homes and
providing affordable energy services for low-income families, and 10% to DNREC for program
administration.
In 2010 Governor Markell signed Senate Substitute 1 for Senate Bill 119, strengthening Delaware‟s
Renewable Energy Portfolio Standards (RPS).30
The bill strengthened the earlier RPS and now requires
that 5% of the total electricity sales come from renewable energy sources in 2010, increasing gradually
each year to 25 percent in 2025; solar photovoltaics (PV) over the same period increase to 3.5% of the

7
total. The benefits include improved regional and local air quality, improved public health, increased
electric supply diversity, increased protection against price volatility and supply disruption, improved
transmission and distribution performance, and new economic development opportunities.
Efforts are also underway to reduce GHG emissions directly by replacing coal-fired power plants by
natural gas and by developing utility-scale renewable energy generation. Power companies are
increasingly switching to natural gas to fuel their plants, driven by low prices and forecasts of vast
supplies for years to come. As for whether coal is cheaper than natural gas or renewable energy, well,
that's not just a matter of a comparison of the BTU cost or the cost per megawatt hour. In economics,
there is a term known as externalities, costs not always figured into the market place price of a product.
The classic example of externalities is a business that pollutes, incurring environmental damages, medical
costs and impairing public health. Such costs are not part of the market place price of the product, but are
cost burdens the public and state government.
Calpine and Invista are two companies undergoing a fuel conversions from coal fired boilers to natural gas,
and NRG‟s Indian River Power plant is in the process of closing its three oldest coal fired units. With the
Calpine Corporation‟s purchase of Conectiv Energy‟s generation assets, the Edge Moor, DE and Deepwater,
NJ plants began burning natural gas exclusively on July 1, 2010. As the result of a Consent Decree lodged in
the U.S. District Court for the District of Delaware,31
corrective actions are expected to result in net
reductions in emissions from three 10 MW boilers at the Invista Seaford plant of 1,029 tons per year of
nitrogen oxides (NOx); 4,211 tons per year of sulfur oxides (SOx); and 269 tons per year of particulate matter
(PM). Invista must control NOx, SOx, and PM by ceasing to use coal at the Seaford boilers and installing of
a natural gas-fired boiler.
Pursuant to a September 25, 2007, consent order, between NRG Energy and the Delaware Department of
Natural Resources and Environmental Control (DNREC), NRG agreed to operate the Indian River Power
Plant in a manner that would limit the emissions of NOx, SOx and mercury. Further, NRG agreed to
mothball IRPP 82 MW Unit 2 by May 1, 2010, and 82 MW Unit 1 by May 1, 2011. On February 3,
2010, the company and DNREC announced a proposed plan to retire the 155 MW Unit 3 by December
31, 2013. The closure of the three units will reduce GHG emissions generated in Delaware by 1.73
million tons CO2 based on 2008 emissions.32
Only the 442 MW Unit 4 will continue operations - with
advanced pollution controls. While the unit closures will reduce instate emissions by 4.16%, Delaware
imports approximately 38% of its electrical power needs. Thus, these closures may be replaced by other
coal generation within the PJM energy grid until more renewable generation projects come on line.
NRG will be replacing at least 220 MW of generating capacity with the construction of the offshore
Bluewater Wind project. The project may be the first offshore wind farm in the United States, and is
expected to start up in 2014. Though a power purchase agreement, Delmarva Power will buy 200 MW.
The Delaware Municipal Electric Corporation has separately agreed to buy another 20 MW. The
Bluewater Wind project will provide a supply of clean, stably-priced energy, and provide significant other
economic and health benefits.
Delaware has the following state-level policies and incentives in place that support the development of
renewable energy and energy efficiency technologies.
Building energy codes for energy efficiency
In 2004 Governor Markell signed Senate Bill 59 to mandate continual adoption of the most recent
building codes: the 2009 International Energy Conservation Code for residential construction and
ASHRAE Standard 90.1-2007 for commercial construction.33
Grants for energy efficiency
8
Delaware has two grant programs for energy efficiency: the Delaware Energy An$wers for
Business Program and the Energy An$wers for Home Appliances Program.
Grants for renewable energy
Delaware has a program that provides grants to projects that demonstrate the market potential for
renewable technologies and accelerate the commercialization of these technologies and a program
that offers grants to projects that develop or improve renewable energy technology in the state.
Public benefits funds for energy efficiency
Delaware has separate public benefit funds for investor-owned utilities (IOUs), cooperatives, and
municipal utilities that each provide support for energy efficiency
Public benefits funds for renewable energy
Delaware has separate public benefit funds for investor-owned utilities (IOUs), cooperatives, and
municipal utilities that provide support for renewable energy.
Rebates for renewable energy
Delaware‟s three public benefit funds each offer rebates for eligible renewable energy
technologies
Renewable portfolio standard for renewable energy
Delaware requires investor-owned utilities (IOUs) and participating cooperatives and municipal
utilities to purchase 25% of the electricity sold in the state from renewable sources by 2025, of
which 3.5% must come from solar photovoltaics. No municipal or cooperative utilities have opted
to participate in the state RPS.
State standards for public buildings for energy efficiency
State agencies must purchase ENERGY STAR® qualified products if they are available
competitively.
How will Delaware adapt to the effects of sea level rise?
Sea level rise (SLR) affects more than just beaches and oceanfront land owners. It can increase the height
of storm waves, making more areas vulnerable to storm damage. SLR can inundate low lying areas,
causing losses to tidal wetlands, habitat, and agricultural areas. It can also cause higher water tables and
salt water intrusion, interfering with septic systems, drinking water and irrigation water. Sea level has
increased along the Delaware coast by more than one foot over the past century.34
However, due to
human development and alterations, the coastline can no longer adapt naturally as it has in the past.
Marshes and other critical habitats are at risk if they are unable to migrate landward with rising sea levels.
Coastal areas now see inundation from the sea on a regular basis - resulting in significant social and
economic impacts.
Development in Delaware‟s coastal zone that does not account for SLR puts homes, businesses and
infrastructure at risk, resulting in human hardship, economic loss, and significant costs to government for
response and recovery.
On January 27, 2010, DNREC Secretary Collin O‟Mara issued an Administrative Policy35
ordering that
all DNREC programs shall consider the potential effect of coastal inundation in project planning,
engineering, design, and review, as well as land acquisition, management, and restoration. The policy also
directs that DNREC programs shall conduct a vulnerability assessment of DNREC holdings and assets,
9
and shall consider project alternatives that avoid siting buildings and infrastructure within areas that are
vulnerable to inundation.
To further address these issues, a Sea Level Rise Advisory Committee has been formed by DNREC to
recommend policy changes and practices that will ensure that Delaware makes informed policy and
investment decisions today to prevent damage and losses to infrastructure, resources and homes
tomorrow. The Advisory Committee includes stakeholders from a diverse network of interests including
municipal governments, highway planners, landowners, emergency managers, wildlife managers,
agricultural professionals, insurance agents, tourism officials, and environmentalists.36
Chad Tolman
represents the LWVDE. The Committee has a web site that includes information presented at its
meetings.37
There is also a DNREC web site for adaptation to sea level rise.38
SECTION 6. BASED ON PAST DELAWARE ENERGY AND CLIMATE CHANGE STUDIES,
WHAT NEAR- AND LONG-TERM ACTIONS DO WE RECOMMEND THE LEAGUE
SUPPORT?
In the past decade there have been three major Delaware energy/climate change plans: The Delaware
Climate Change Action Plan in 2000, Bright Ideas for Delaware’s Energy Future in 2003, and the
Delaware Energy Plan 2009-2014. Here we describe their origins and major recommendations.
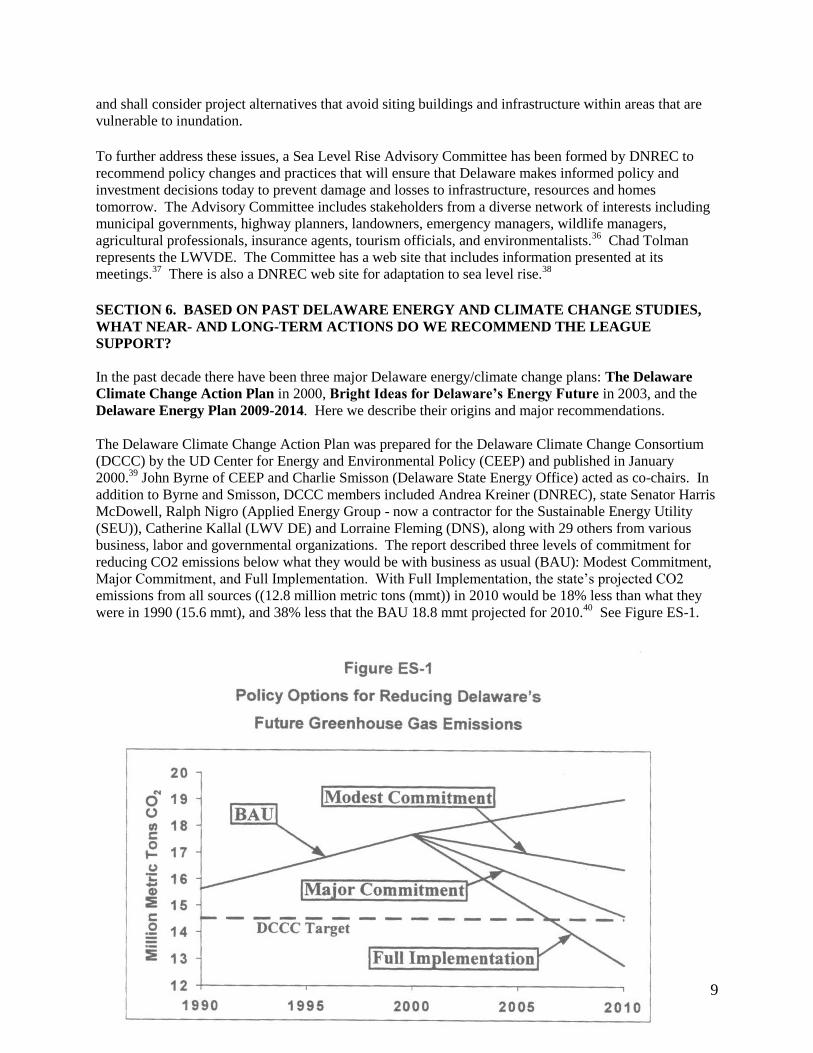
The Delaware Climate Change Action Plan was prepared for the Delaware Climate Change Consortium
(DCCC) by the UD Center for Energy and Environmental Policy (CEEP) and published in January
2000.39
John Byrne of CEEP and Charlie Smisson (Delaware State Energy Office) acted as co-chairs. In
addition to Byrne and Smisson, DCCC members included Andrea Kreiner (DNREC), state Senator Harris
McDowell, Ralph Nigro (Applied Energy Group - now a contractor for the Sustainable Energy Utility
(SEU)), Catherine Kallal (LWV DE) and Lorraine Fleming (DNS), along with 29 others from various
business, labor and governmental organizations. The report described three levels of commitment for
reducing CO2 emissions below what they would be with business as usual (BAU): Modest Commitment,
Major Commitment, and Full Implementation. With Full Implementation, the state‟s projected CO2
emissions from all sources ((12.8 million metric tons (mmt)) in 2010 would be 18% less than what they
were in 1990 (15.6 mmt), and 38% less that the BAU 18.8 mmt projected for 2010.40
See Figure ES-1.

10
Data available from the EPA show Delaware‟s CO2 emissions decreasing from 17.4 Mt (million tons) in
1990 to 16.6 in 2000 and 16.4 in 2008.41
While the numbers for 1990 and 2000 are different from those
shown in the figure above, it is clear that little or no reduction in CO2 emissions took place in Delaware
between 2000 and 2008.
The Policy Priorities recommended by the Delaware Climate Change Action Plan were divided into 5
Programmatic Priorities and 3 Institutional Priorities. By each Programmatic Priority below is shown the
estimated reduction of CO2 emissions, rounded to the nearest 0.001 mmt (million metric tons). (In some
cases the bulleted items are paraphrased.)
PROGRAMMATIC PRIORITIES
#1 Increase energy efficiency (5.461 mmt CO2)
Provide incentives for industrial efficiency upgrades.
Promote cost-effective, energy efficient lighting.
Raise energy efficiency standards for buildings and appliances.*
Switch from electricity to natural gas for space and water heating or to higher efficiency electrical
appliances.
Increase CAFE standards for vehicles.
Provide incentives for the purchase of fuel-efficient vehicles.
Reduce vehicle miles traveled.
#2 Switch to more environmentally friendly energy sources (0.729 mmt CO2)
Promote wider use of natural gas for heating, ventilation and air conditioning.
Encourage Alternative Fuel Vehicles.
Switch electricity generation from high to low carbon fuels.*
Investigate a regional environmental dispatch policy for power supplies.
#3 Increase natural carbon storage (0.139 mmt CO2)
Strengthen afforestation/reforestation and urban tree planting programs.
Develop growth management strategies that include afforestation/reforestation goals
Strengthen forest management legislation to encourage conservation.
#4 Promote renewable energy (0.134 mmt CO2)
Encourage building-integrated photovoltaics.*
Develop and implement a renewable portfolio standard (RPS).*
#5 Promote recycling (0.068 mmt CO2-equivalents)42
Implement Pay-As-You-Throw or Volume-Based Fees Programs.
Implement a mandatory curbside recycling program*
Improve the bottle refund system.*
Line items marked with an asterisk (*) have been implemented in Delaware since the 2000 report. What
is most interesting about the above is: 1) energy efficiency provides nearly 84% of the estimated total of
6.531 mmt CO2 emission reduction potential; 2) renewable energy provides only 2% of the total; and 3)
solar PV is the only renewable energy source mentioned – no doubt because Willett Kempton and
coworkers had not yet described the huge offshore wind resource off the Delaware coast.43

11
INSTITUTIONAL PRIORITIES
#1 Public education and outreach
Develop and publish a directory of sources of information on climate change, including an
inventory of groups and agencies engaged in related activities.
Develop and disseminate educational materials on climate change .. to promote the Delaware
Climate Change Action Plan throughout the state.
Create a website for the Delaware Climate Change Action Plan.
Convene a series of educational and information exchange forums (seminars, discussions,
workshops, etc.)
Promote the diffusion of information on climate change in curricula of Delaware‟s schools.
Develop activities specifically aimed at utilizing the mass media (TV, radio, and press) to help
public education and outreach.
#2 Long term goals to limit sprawl, reduce greenhouse gas emissions and enhance sink capacity
Develop policies aimed at changing land use patterns.
Reform Delaware‟s land use planning.
Expand Delaware‟s mass transit options and opportunities.
Investigate a broader-based renewable energy policy initiative.
#3 Increase participation in voluntary programs.
Promote auditing and benchmarking, especially for small- and medium-scale industries.
Increase Delaware‟s participation in existing Federal programs for industrial, residential, and
commercial energy efficiency.
Among the Institutional Priorities, the most striking is the emphasis on public education and outreach,
even adding climate change to public school curricula. As the report notes in Chapter 8, “A well-
conceived public education and outreach program will be critical to efforts to implement the Climate
Change Action Plan.” Public education and outreach received much less emphasis in subsequent state
energy reports.
Bright Ideas for Delaware’s Energy Future was prepared by a Delaware Energy Task Force that issued
its Final Report to the Governor in September 2003.44
The Task Force, chaired by Michael McCabe, was
established by Governor Minner in 2002 and had 17 members in addition to McCabe, including: Senator
McDowell, Andrea Kreiner (Office of the Governor), Arnetta McRae (PSC), Chris Coons (W.L Gore),
John Hughes (DNREC) and Ralph DiNigro (Applied Energy Group), Dave Bacher (NRG), Joseph Rigby
(Connective), Paul Bienvenue (DE Elec. Coop.), Phil Barefoot (Eastern Shore Natural Gas), and Gary
Patterson (Delaware Petroleum Council). It‟s mission was to address Delaware‟s short- and long-term
energy challenges.
The Task Force addressed the following goals:
• The expansion of the diversity of fuels used to meet Delaware's current and future energy needs.
• The development of conservation programs to reduce the need to build more electricity generation facilities.
• Ensuring that energy infrastructure will meet Delaware's future needs for efficiently transporting energy
resources.
• Encouraging producers of clean energy technologies and producers of energy efficient products to locate their
business operations in Delaware.
Reducing greenhouse gas emissions was not one of the goals.

12
The Task Force came up with nine strategies, each with a number of prioritized recommendations. (See
the full report for details.)
Strategy 1: Reduce environmental and economic costs of energy consumption through
improvements in end-use efficiency and conservation.
Strategy 2: Reduce the environmental impacts of electricity generation by encouraging clean and
renewable energy generation.
Strategy 3: Reduce the economic impacts of transmission congestion.
Strategy 4: Promote clean distributed generation.
Strategy 5: Enhance availability of natural gas.
Strategy 6: Promote alternative transportation fuels.
Strategy 7: Promote economic development by encouraging advanced energy technology
development.
Strategy 8: Implement energy efficiency, conservation and renewable energy in state government.
Strategy 9: Continue the planning effort to ensure that long-term goals are met.
Strategy 1 had a number of recommendations related to public education and outreach, including:
• Implement a comprehensive education program to inform residential consumers about how they can achieve
the economic and environmental benefits of more efficient energy use.
• More completely disclose information about fuel sources, emissions, and costs to consumers to better
inform their purchasing decisions.
• Develop an aggressive consumer education program to promote Energy Star appliances and equipment
to builders and consumers in the Residential and Commercial sectors.
There was no mention of changing public school curricula or of involving the media.
The discussion of Strategy 2 included: “Renewable energy resources that can reduce dependence on fossil
fuels for electric power generation, including solar, wind and biomass, are available in Delaware. While
the initial costs of renewables are often higher than conventional energy supplies, the benefits of
increased renewable use are significant. Renewable energy resource and technology development also
have positive implications for economic growth.” The recommendations under Strategy 2 included:
• Re-assess photovoltaic system rebates from the state's Green Energy Fund with a goal of having 500
photovoltaic systems in Delaware by 2010.
• Establish a study group to determine the types and quantities of sustainable biomass resources and their
best use.
• Establish a renewable energy goal for electricity consumed in the state.
There was no mention of Delaware‟s offshore wind resource.
The third and most recent plan was the Delaware Energy Plan 2009-2014. It was prepared by the
Governor‟s Energy Advisory Council (GEAC), chaired by David Hodas (Widener University School of
Law), and published in March 2009.45
In addition to Hodas, the GEAC had 18 members, including: Seth
Ross (DNS), John Hughes (DNREC), Arnetta McRae (PSC), Gary Stockbridge (Delmarva Power),
Stephen Thompson (Chesapeake Utilities), Bill Andrew (DE Electric Coop.), Patrick McCullar (DE

13
Municipal Electric Coop.), and Alan Levin (DE Economic Development Office).
“The goal for the energy plan was to identify where Delaware‟s energy system should be headed over the next 20
– 30 years, and to identify what can and ought to be done over the next five years to move Delaware in that
direction.” The process of developing the plan was governed by the following Guiding Principles:
• Increasing energy end‐ use efficiency and conservation
• Reducing the environmental impacts (footprint) of energy used and generated in Delaware
• Reducing energy used for transportation
• Maximizing clean energy economic development opportunities
• Maintaining and improving the reliability and security of Delaware‟s energy systems
• Minimizing energy‐ related costs and impacts on Delaware citizens
There were five Work Groups dealing with various aspects of the plan:
1. Reducing Delaware‟s Energy Use
2. Reducing the Environmental Footprint of the Energy Delawarean‟s Use
3. Transmission & Distribution
4. Reducing Transportation Energy Use
5. Clean Energy Businesses
In the Council Chair‟s Introduction Hodas wrote, “This energy plan represents the emergence of a new
generation of energy policy that will begin to move us from a fossil fuel dependent society to a
sustainable energy future. Several energy storms are headed in our direction. First, global warming
requires that we drastically reduce our greenhouse gas emissions from burning fossil fuels. Second, we
need to worry about our dependence on foreign oil. The price of oil has dropped, due to a collapse of
demand in response to the global recession, but as the world‟s economy picks up, demand will rapidly
rise, and oil prices will soar again. We must face the fundamental fact that the global demand for
petroleum in a healthy world economy will rapidly bump up against real limits on the total oil supply.”
Each of the Work Groups made a number of recommendations. Climate change was addressed by the
Footprint (FP) Work Group 2, which made seven recommendations:
FP‐ 1: Establish a greenhouse gas reduction goal and a Climate Change Commission to develop a
detailed Climate Action Plan for Delaware.
FP‐ 2: Align the Green Energy Program to complement other state and federal programs to help achieve
Delaware‟s renewable energy goals.
FP‐ 3: Enact legislation to eliminate forfeiture provisions from the Net Metering Law.
FP‐ 4: Enact legislation addressing deed restrictions and/or covenants that unduly prohibit the use of
renewable energy sources.
FP‐ 5: Examine and revise the Renewable Energy Portfolio Standards.
FP‐ 6: Gather updated supply data and remove legislative restriction on environmentally beneficial
Biomass Energy utilization.
FP‐ 7: Reduce the carbon emissions from the State‟s existing coal facilities.

14
Energy education and outreach involved recommendations from a couple of groups:
EO‐ 1: Develop and implement a comprehensive Energy Education and Outreach Program.
CE‐ 2: Develop and implement a Comprehensive Energy Workforce Training Strategy.
CE‐ 4: Facilitate public and private sector funding for Clean Energy Research at Delaware‟s universities.
Other important recommendations included:
G‐ 1: Create a Governor‟s Executive Office for Energy Policy.
EE‐ 1: Adopt an Energy Reduction Goal & Vision to achieve energy self‐ sufficiency and
carbon neutrality in Delaware‟s built environment by 2030.
LU‐ 2: Promote Transit‐ Oriented Development.
CE‐ 3: Fund targeted Wind and Solar industry business development initiatives.
Carolyn Snyder has been hired by DNREC as their new Director of Clean Energy & Climate Policy. Ellis
Morgan, who reports to Dr. Snyder, is tracking the recommendations in the Delaware Energy Plan 2009-
2014.46
The plan should be updated in 2015.
SECTION 7. WHAT OTHER STATES ARE DOING ABOUT GHG EMISSIONS
Many states have been proactive in looking for solutions to the mitigation challenges of climate change.
The Pew Center on Global Climate Change has documented a plethora of climate change efforts.47
The
site points out the happy coincidence between the need for action and the concomitant perks of such
action: as states reduce their greenhouse gas (GHG) emissions, they simultaneously reduce traffic
congestion, develop domestic clean energy supplies, improve air quality, receive income from selling
GHG emission reduction credits and attract high-tech business.
Selling GHG emission reduction credits is the well-known “cap and trade” action discussed in Section 5
of this report, and described in a Wikipedia article.48
15
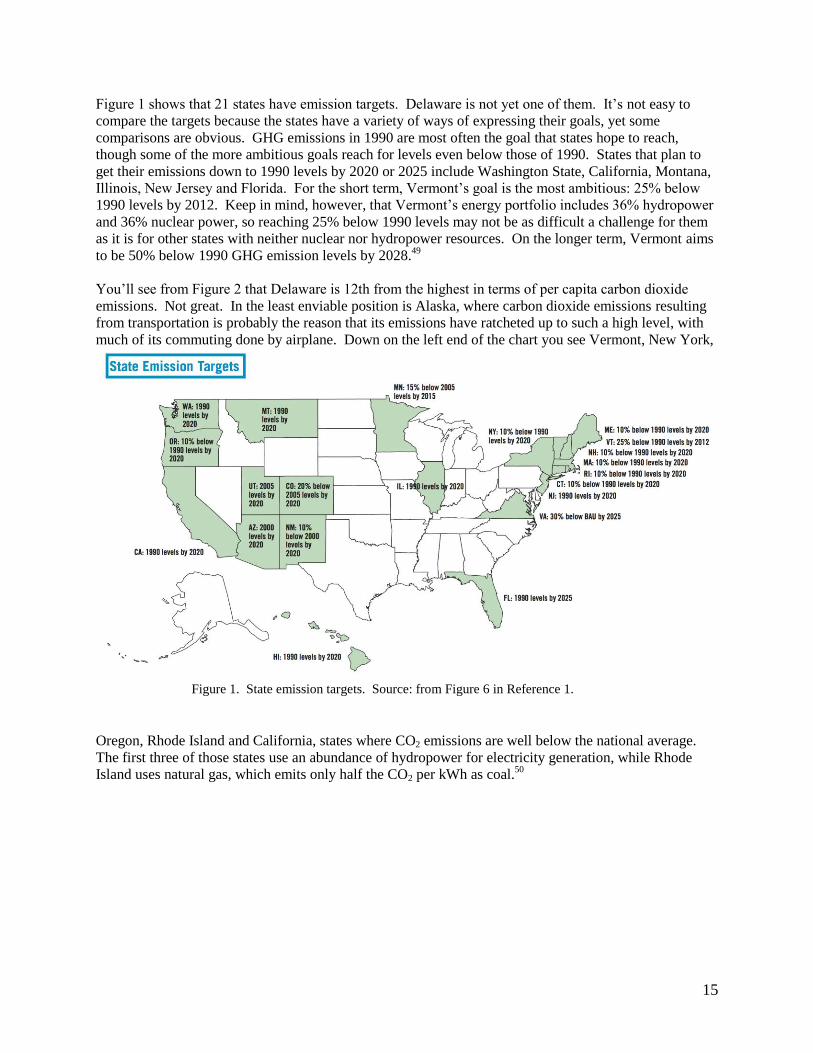
Figure 1 shows that 21 states have emission targets. Delaware is not yet one of them. It‟s not easy to
compare the targets because the states have a variety of ways of expressing their goals, yet some
comparisons are obvious. GHG emissions in 1990 are most often the goal that states hope to reach,
though some of the more ambitious goals reach for levels even below those of 1990. States that plan to
get their emissions down to 1990 levels by 2020 or 2025 include Washington State, California, Montana,
Illinois, New Jersey and Florida. For the short term, Vermont‟s goal is the most ambitious: 25% below
1990 levels by 2012. Keep in mind, however, that Vermont‟s energy portfolio includes 36% hydropower
and 36% nuclear power, so reaching 25% below 1990 levels may not be as difficult a challenge for them
as it is for other states with neither nuclear nor hydropower resources. On the longer term, Vermont aims
to be 50% below 1990 GHG emission levels by 2028.49
You‟ll see from Figure 2 that Delaware is 12th from the highest in terms of per capita carbon dioxide
emissions. Not great. In the least enviable position is Alaska, where carbon dioxide emissions resulting
from transportation is probably the reason that its emissions have ratcheted up to such a high level, with
much of its commuting done by airplane. Down on the left end of the chart you see Vermont, New York,
Oregon, Rhode Island and California, states where CO2 emissions are well below the national average.
The first three of those states use an abundance of hydropower for electricity generation, while Rhode
Island uses natural gas, which emits only half the CO2 per kWh as coal.50
Figure 1. State emission targets. Source: from Figure 6 in Reference 1.

16
Stanton et al.51
point out that the American predilection for high energy use is based on the false
assumption that high emissions are related to a high standard of living. Although we see from Figure 2
that there is a six-fold variation from the lowest emitting states to the highest, per capita income varies
only two-fold: from
$37,600 in
Washington, D.C.,
to $18,000 in
Mississippi. While
accounting for wide
variations in climate,
the writers conclude
that two factors
seriously affect
state-to-state
differences in per
capita CO2
emissions: energy
prices (including
gasoline taxes) and
public transit
infrastructure. They
find that the
following factors are
common among
low-emitting states:
Citizens drive less per person
Use less electricity per person in their homes
Have higher gasoline and electricity prices
Rely more on public transportation
Use less oil for heating and less coal for electricity generation
And finally, Stanton and her colleagues find that states with the lowest per capita transportation and
residential emissions (New York, Washington, D.C., Oregon, California, Rhode Island, Washington,
Vermont, New Hampshire) are all above average in per capita income.
Figure 2. Source: Ackerman et al, Greenhouse Gases and the American
Lifestyle: Understanding the Interstate Differences in Emissions. April
2009.)

17
Figure 3 indicates that twenty-nine states and the District of Columbia have statutes that establish
compulsory Renewable Portfolio Standards (RPS), requiring that some fraction of total electrical energy
used be generated by renewable energy sources, such as wind and solar. A Delaware law signed in 2010
requires that 25% of the electricity produced in the state by 2025 come from renewable sources, with
3.5% from solar.52
California, on the other hand, had a goal of buying 20% of its energy from renewable
sources by 2010. Maine, another state on the forefront in this area, pledged that 30% of their energy
would come from renewable sources by 2000, with an additional 10% by 2017. Although these Maine
goals seem ambitious, they are not a serious challenge for the state, since renewable energy---largely
hydropower---currently makes up 50% of its electricity portfolio.53
Texas and a number of other southern
states do not support any initiatives to increase energy from renewable sources or to reduce GHG
emissions, nor do Idaho, Wyoming and several Midwestern states.
A state with intriguing activity in the climate change mitigation arena is California. California, you will
recall from Figure 2, is 5th from the bottom in carbon dioxide emissions per capita. Since it is the lowest-
ranking per capita CO2 emitter without a majority of its electricity generation coming from renewables
(14% in 2010), it is more comparable to Delaware in terms of its renewable portfolio. In 2006 California
passed Assembly Bill (AB) 32, the Global Warming Solutions Act. This act requires that California
reduce its GHG emissions to 1990 levels by 2020. A separate Executive Order calls for bringing the
emissions down even further - to an ambitious 80% below 1990 levels by 2050.54
Recently court
challenges to AB 32 have proved to be a setback, though the complaints are procedural in nature, and will
probably just delay its implementation. Proposition 23, an attempt to repeal AB 32, was rejected by
voters in 2010.55
Figure 3. Renewable Portfolio Standards. Source: from Figure 2 in Reference 1.

18
Lawmakers may have looked at the projections we see in the graph below and realized that without a
significant land use element in their planning, they would not meet their goals. Lowering the carbon fuel
standard (purple) and improving the energy efficiency of vehicles (green line) would not do the trick,
given the dramatic projected rise in vehicle miles traveled (VMT), represented by the red line. SB 375
became law in 2008. This legislation recognizes that transportation contributes 40% of California‟s GHG
emissions. The bill is designed to reduce these emissions by improving land use patterns and offering
more housing and transportation choices to Californians. In September of 2010 the California Air
Resources Board determined targets for
GHG reductions for each region in the
state. Each of the 18 metropolitan
planning organization regions, in turn,
will work with local government to
design a Sustainable Communities Strategy (SCS) for achieving the regional target. An SCS will detail
how and where growth and development will take place, and how the region‟s transportation system can
support that growth in a way that reduces GHG emissions.
Central to the concept of SB 375 is that compact, walkable communities require less infrastructure and
consume less electricity, water, and natural gas than sprawling, car-centric communities. Figure 5 shows
how households in areas with fewer transportation choices and longer driving distances emit much more
transportation-related CO2 per household in a year. In compact, mixed-use communities, the trips are
usually shorter. In addition to cutting down on GHG emissions, planners find that better land use
practices reduce growth pressure on open space and working farms, and residents of walkable
communities are 2.4 times more likely to get in a daily half-hour walk.56
Incentives built into SB 375 include streamlining the environmental approval process and some
transportation funding. Penalties include legal sanctions and court-imposed jurisdictions for those regions
that do not comply with the regulations.57
Figure 4. Projected Growth in CO2 Emissions from Cars and Light Trucks, Assuming More
Stringent Nationwide Vehicle and Fuel Standards. Source: Ewing, Reid, et al, Growing Cooler,
Urban Land Institute, 2008.

19
Many Delawareans hope that we can renew our original role as “The First State” by assuming leadership
in the area of reducing per capita GHG emissions. A number of states are already well ahead of us, so
attaining such a goal will not be easy. Though Delaware is small, it could lead by example---showing that
we can improve our economy while protecting our future from the worst consequences of climate change.
SECTION 8. DELAWARE’S RENEWABLE ENERGY RESOURCES
Introduction
This section documents three critical ideas for the development of renewable energy - especially from
wind and solar PV (photovoltaic) power - for Delaware‟s energy future. They are: 1) these technologies
are technically mature and capable of providing significant amounts of clean energy; 2) they can produce
a significant amount of electricity without disrupting electrical grids, while reducing CO2 and other
emissions; and 3) their manufacture is being aggressively pursued worldwide. States or nations that fail to
encourage their development will miss out on the greatest new economic engine of the 21st century.
Delaware has two excellent resources for electricity that do not involve burning natural gas or coal, which
can release CO2 and other pollutants such as nitrogen oxides (NOx), sulfur dioxide (SO2) and mercury, or
fissioning uranium, which creates radioactive waste. These are off-shore wind, and solar PV. Delaware
has negligible on-shore wind or hydropower resources, and only a small biomass resource. Willett
Kempton did an analysis of Delaware‟s renewable energy resources for a 2009 report of the Governor‟s
Energy Advisory Council, comparing them to the average power the state uses for electricity and
transportation. The results are shown in Figure 1.
Figure 1. Delaware‟s average power use for electricity and transportation and its available power in
megawatts (MW) from its renewable energy resources.58
The power used for transportation (Trans.) in Figure 1 comes from the burning of gasoline and diesel fuel.
The Solar PV resource is assumes the tops of all buildings in the state with flat or south-facing roofs, for
which Kempton esimated an average potential power source of 288 MWa.59
He found an additional 59

20
MWa on about 1000 acres of fallow agricultural land not suitable for development. The dashed line
labeled BWW on the Offshore Wind bar is the 200 MW going from Bluewater Wind to Delmarva Power
– clearly only a small fraction of the available resource.
Environmental benefits
Once installed, solar and wind systems generate negligible CO2 emissions. Within 1-2 years, a solar
array „pays back‟ the energy required for its manufacture. For off-shore wind, this energy pay back time
is less than a year. Thus, for the rest of their 20 (wind) or 25-30 (solar) year lifetimes, every kWh60
they
generate is emission free energy. Thus, they are ideal technologies to prevent CO2 and other harmful
emissions.
There are data to support this. In 2010, the American Wind Energy Association used the U.S. Department
of Energy‟s (DOE‟s) data on emissions from Colorado‟s power plants over time. Table 1 shows that as
wind energy increased from providing 2.5% of Colorado‟s electricity in 2007 to 6.1% in 2008, CO2
emissions fell by 4.4%, nitrogen NOx and SO2 emissions fell by 6%, coal use fell by 3% (571,000 tons),
and electric sector natural gas use fell by 14% (DOE citations for each data point are listed in the
hyperlink).
Table 1. Reductions in Emissions from Colorado as wind power increased
Requirements for Wind and Solar PV in Delaware
In 2010, the Governor signed Renewable Portfolio Standard (RPS) legislation requiring Delaware to
obtain 25% of its electricity from renewable sources by 2025. A minimum of 3.5% must be from solar
PV within the state. This will require installing about 350 MW of PV.61
To meet this 3.5% goal will
require only 0.1% of our land area - about a quarter of the area covered by DE golf courses. As of 2010,
Delaware had about 10 MW of grid connected PV installed. This will double with the completion in
2011 of the 10 MW Dover Solar Park. Delaware receives plentiful sunlight - about 75-80% as much as
California or Florida.
When completed, the Bluewater Wind/NRG project will supply up to 200 MW to Delmarva Power, or
about 15% of Delaware‟s average electrical power. Figure 1 shows that the resource is much larger than
that. Additional transmission lines will be needed to carry the energy from off-shore to on-shore and then
to distribute across the peninsula. Google has offered to invest in a 350 mile 6,000 MW underwater
transmission line off the coast from New Jersey to Virginia to help kick-start the industry.62
The
Department of Energy estimates that the U.S. has 54,000 MW of offshore wind capacity.
Small scale solar PV does not require additional transmission lines because it is a distributed energy
source, with the energy used near where it is generated. In fact it reduces grid congestion on hot summer
days. Wind farms require additional transmission lines because much more power is produced. Most
economic analyses of solar fail to account for its two main advantages from a utility perspective. First, as
a distributed source, solar arrays avoid some transmission and distribution (T+D) losses. Second, the peak
generation nearly coincides with summer peak demand, driven by late afternoon air conditioning. Thus,
21
solar provides premium value energy. As we evolve into time-of-use rate charges, solar electricity will be
valued even more. One of the nation‟s largest utilities, Pacific Gas and Electric of California, studied the
value of distributed solar generation from a 500 kW PV installation and concluded that the value of the
plant to the utility was nearly double the value of the electricity generated once external costs, avoided
maintenance, avoided T+D losses, and reduced peaking congestion issues were accounted for63
. A much
more recent study of the US energy picture state-by-state concluded the same thing using different
criteria: namely, small scale distributed energy sources like residential or commercial solar arrays have an
economic impact which is more than double centralized, outsider-owned facilities, partially due to the
increased employment and services it supports64
. Studies performed by University of Delaware for
Delmarva Power and Light in the early 90‟s similarly highlighted the value of PV as a demand-reduction
(called demand side management) tool to offset peak summer demand.65
Solar Installation Issues
Potential residential or commercial PV customers often worry “Does my roof have the right slope? Does
my house have good solar exposure?” Other experts ask “Can roof-top mounted solar make a significant
impact on our electricity generation?”
In fact, solar modules can be installed at a wide range of tilts and south-facing orientation with little
difference in output. Many people are surprised to find that annual output is only weakly dependent on
tilt, hence the slope of their roof. In fact, nearly any reasonable tilt - even no tilt (horizontal on flat roofs) -
is good. The reason is that the sun‟s angle varies from 27º to 72º between winter solstice (Dec. 21) to
summer solstice (June 21) at our latitude.
What about orientation? For solar installations in the northern hemisphere, the optimum orientation is
„true south‟. But again, output is not very sensitive to small deviations because an array oriented to the
southeast will get more sunlight in the morning and less in the afternoon.
A recent study by the University of Delaware concluded that roof-top solar arrays in Newark could supply
75% of the city‟s total daylight (9 AM-6 PM) electricity demand, taking into account tree shading, roof
orientation, and structural limits66
. It did not consider installations over parking lots or ground mounted
arrays. Regarding costs, the report concludes “The results of the modeling of the PV installations in the
City show financial feasibility of PV installations for all building sectors – residential,
commercial/industrial and university. All configurations are found to be viable, attaining positive net
present values (NPV) and benefit-cost ratios (BCR) of greater than 1.00 at both SREC values of $150 and
$250.”67
You can install modules on motorized supports that track the sun in its daily East to West motion across
the sky or its daily and seasonal variation in angle of elevation. However, while these can increase the
sunlight collected by 15-40%, they require 5-10 times more land space than stationary arrays. This might
be a deterrent in a small state like Delaware. Of course, costs for tracking arrays are higher than for fixed
mount arrays. Fortunately, we can easily utilize roof-mounted and small ground-mounted systems instead
of large tracking power stations (on the order of 1-20 MW capacity) that are being installed with
increasing frequency in California and Nevada.
So are there any limits to the location for the installation of an array on a roof or in a field? Yes! The
array must not have much shadowing on it during the peak production hours from 9 AM to 3 PM (solar
time). Even a slight shadow, such as due to a thin pole or leafy tree, on a corner or edge of a module could
dramatically reduce the output from the shadowed module and also from the entire array. The shadow
issue may present a significant limit in cities or towns with lots of trees or tall buildings, like Newark or
Wilmington. A proper pre-installation design will include a shading analysis.

22
A legal barrier to more widespread application of solar arrays is their ban by most deed-restricted
communities, presumable for aesthetic reasons. A significant fraction of Delaware‟s housing stock is in
such communities. Across the country, concerned homeowners have fought such restrictions in court, and
won. Last year, Delaware passed legislation preventing future deed-restricted contracts from banning
solar arrays, but it did not address the existing covenants. Lifting these would be a significant benefit for
solar installation in the state.
Below in Figure 2 are examples of typical rooftop and ground mounted solar installations in Delaware.

23
Figure 2. Roof mounted and ground mounted residential and commercial PV systems in Delaware. The
residential homes are 6.2 kW and 1.8 kW (upper left and right, respectively); the church is Limestone
Presbyterian (18 kW). The ground mount is 2.4 kW, all in New Castle County. The bottom photo is a
poultry farm (63 kW) in Ellendale in Sussex County.
Large scale wind and solar grid integration issues
Wind and solar are intermittent resources. The time scale for variability can be minutes (e.g., a cloud
passing over a solar panel), hours or days. The ability of the grid to reliably accept intermittent energy
generation is of great concern to utilities, grid managers, and consumers alike. It is widely recognized the
grid needs significant modernization, especially to evolve into the „smart grid‟ that includes customer
initiated demand reduction, consumer choice, remote monitoring and control of individual appliances, and
the integration of intermittent energy sources. Many studies have been done to estimate the maximum
penetration of intermittent sources into the grid before problems occur. Generally, these studies find that
there is no problem with 10-15% wind or solar generation, and even higher levels can be achieved.
Energy storage would allow even higher levels of solar and wind power, but no cheap storage method
appears on the horizon. Pumped hydro storage68
such as Muddy Run near Conowingo MD is already used
and compressed air69
, grid-tied electric vehicle batteries (when parked and plugged in) called V2G
(Vehicle to Grid)70
, and new battery technologies are being actively explored. The problem of electricity
storage is not specific to the intermittent production of electricity; it is a general need for grid
management. Electricity demand is quite variable with the hour of the day and the season; differences of
60% are possible between daily peak (maximum) load and base (minimum) load. Thus, the electric
operators, who have a knowledge of the demand behavior, plan the connection or disconnection of power
plants to produce enough energy to approximately match demand. In Spain and Denmark, there have
been days when wind has provided nearly 100% of the electricity. In Spain and Germany, two countries
with a large fraction of wind and solar, it is common for them to provide 10-20% of the power on a given
day without any loss of reliability.
Baseload coal or nuclear power generators are normally connected 24/7 (except for occasional full shut
downs for repairs or replacing nuclear fuel) and run at full power. As the wind/solar fraction grows
(assuming no storage), on windy/sunny days when the intermittent generation alone can meet the demand,
some of the wind/solar generation will have to be shut down, because conventional baseload plants cannot

24
be disconnected or decreased quickly. A cheap storage, such as pumped hydro plants, would permit more
penetration of intermittent renewable electricity. Either way, in any grid (even without intermittent
renewable energy) there is always some idle generation capacity and the associated financial losses but
this can be increased by excessive intermittent generation. Researchers at the US NREL in Golden
Colorado have shown that PV might provide 10-20% of the load of a traditional grid system71
while grid
modernization and storage might to allow up to 50% penetration of PV.72
Mark Jacobson and Mark
Delucci at Stanford have shown how California could get all of the electricity it needs by 2030 with a
combination of wind, solar, water and geothermal power.73
Of course the availability of renewable
energy sources can vary a lot by region. The U.S. Department of Energy provides resource maps for the
United States.74
Worldwide Solar Installation
Solar energy installation has been growing at 40-50% per year for over a decade. Despite the worldwide
recession, it continued strong growth in 2009 and 2010, largely due to various national subsidies and the
explosive growth of inexpensive highly automated factories in China.
As of 2011, there is at least 25 gigawatts (GW)75
of PV installed worldwide, with at least 15 GW installed
just last year (2010). Taking into account cycles of day and night, and cloudiness, this PV generates
about as much energy annually as about 5 coal fired power plants. Clearly much greater capacity is
needed to offset more coal plants but at the current rate we will double our installed capacity in just
another 2 years.
Although we have extolled the value of small (<1 MW) PV installations, the worldwide trend is toward
much larger plants. There are over a 1000 plants in the world of ≥1 MW, totaling 4.5 GW. There are 45
plants larger than 20 MW - mostly in Spain, Germany, Italy, Korea, Canada and China. The U.S. has only
three that large, despite our having more sunny non-agricultural land than most other countries. In 2009 it
took less than a year to install 60 MW at Olmedilla de Alarcón , Spain. A typical 1000 MW nuclear plant
would require at least 10 years to build, so utility scale PV can be built much faster.
Economic Impact
A 2008 report from the Department of Energy‟s National Renewable Energy Laboratory identified the
direct and indirect jobs created by the solar industry, and projected their needs to 203076
. Table 2
shows that nearly half the jobs per MW of installed power in 2008 were in installation. These are local
jobs that cannot be outsourced. However, this cost and those for project construction and those for cell
and module manufacture must be reduced for much lower cost solar energy to be achieved.
Improvements include standardization of design and installation practices, and less complex mounting
methods. Even with these improvements, solar is a strong net job generator, creating far more jobs per
MW than burning fossil fuels.
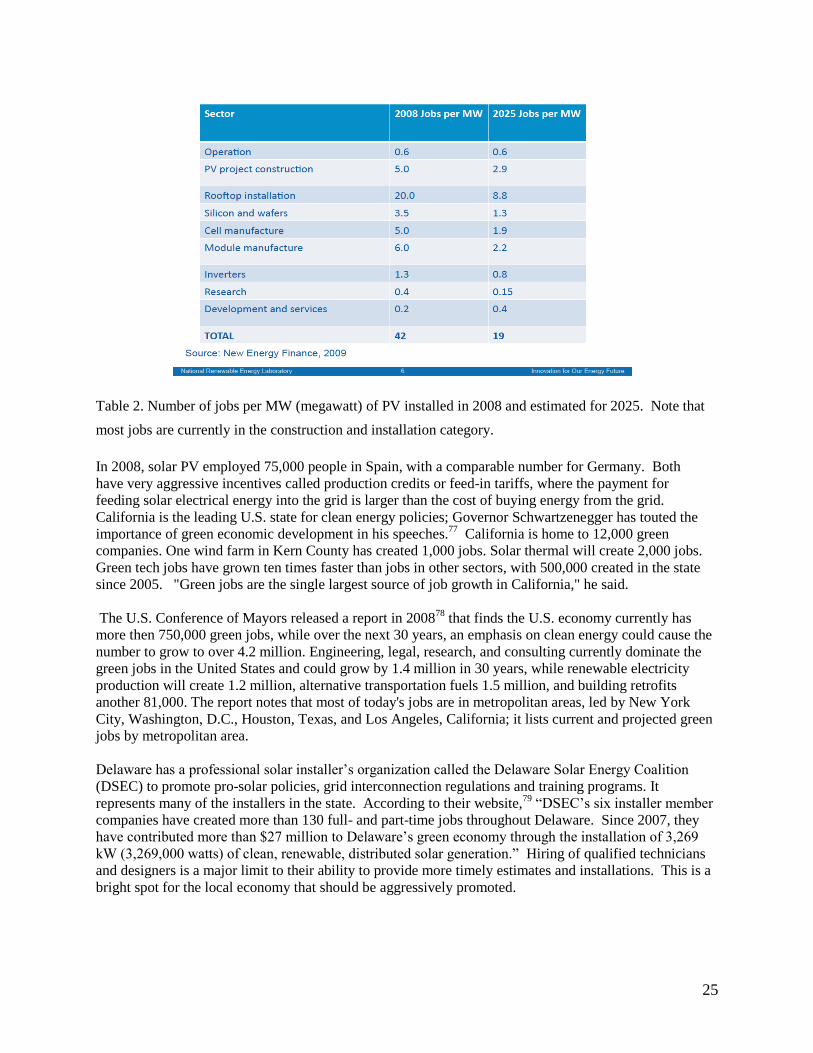
25
Table 2. Number of jobs per MW (megawatt) of PV installed in 2008 and estimated for 2025. Note that
most jobs are currently in the construction and installation category.
In 2008, solar PV employed 75,000 people in Spain, with a comparable number for Germany. Both
have very aggressive incentives called production credits or feed-in tariffs, where the payment for
feeding solar electrical energy into the grid is larger than the cost of buying energy from the grid.
California is the leading U.S. state for clean energy policies; Governor Schwartzenegger has touted the
importance of green economic development in his speeches.77
California is home to 12,000 green
companies. One wind farm in Kern County has created 1,000 jobs. Solar thermal will create 2,000 jobs.
Green tech jobs have grown ten times faster than jobs in other sectors, with 500,000 created in the state
since 2005. "Green jobs are the single largest source of job growth in California," he said.
The U.S. Conference of Mayors released a report in 200878
that finds the U.S. economy currently has
more then 750,000 green jobs, while over the next 30 years, an emphasis on clean energy could cause the
number to grow to over 4.2 million. Engineering, legal, research, and consulting currently dominate the
green jobs in the United States and could grow by 1.4 million in 30 years, while renewable electricity
production will create 1.2 million, alternative transportation fuels 1.5 million, and building retrofits
another 81,000. The report notes that most of today's jobs are in metropolitan areas, led by New York
City, Washington, D.C., Houston, Texas, and Los Angeles, California; it lists current and projected green
jobs by metropolitan area.
Delaware has a professional solar installer‟s organization called the Delaware Solar Energy Coalition
(DSEC) to promote pro-solar policies, grid interconnection regulations and training programs. It
represents many of the installers in the state. According to their website,79
“DSEC‟s six installer member
companies have created more than 130 full- and part-time jobs throughout Delaware. Since 2007, they
have contributed more than $27 million to Delaware‟s green economy through the installation of 3,269
kW (3,269,000 watts) of clean, renewable, distributed solar generation.” Hiring of qualified technicians
and designers is a major limit to their ability to provide more timely estimates and installations. This is a
bright spot for the local economy that should be aggressively promoted.

26
Costs of Solar and Wind Power
Establishing prices for electrical energy from solar PV and wind is complicated and depends on many
factors. In both cases there are economies of scale; larger installations cost less per kWh than small ones.
Costs of both technologies have been dropping as market shares have increased and improvements in
component manufacturing have been made.
For solar installations installed costs depend on: the type of installation, the size, competitive demand
(prices are lower in states with active solar programs due to competition), financing, permitting fees, etc.
Component prices vary with demand and by country of manufacture.
Prices for both components and installation have been decreasing steadily for decades.
The critical economic parameter in comparing electrical generation technologies is not the installed price
in $/Watt but the levelized cost of energy (LCOE), which is the average amount of energy generated over
the lifetime of the system divided by the total costs over that same time. For a solar or wind system you
are essentially paying for 25 years of energy up-front, since there is no monthly fuel bill. LCOE
calculations take into account the initial cost, available sunlight or average wind speed, the annual
degradation rate (typically 1% annually for solar PV), replacement of any parts, maintenance (negligible
with solar, larger for wind), financing charges, depreciation, and the length of service (typically 25 years).
Figure 3 shows the solar PV LCOE (shown as SYSTEM PRICE RANGE) vs year from 1990 (historical)
to 2020 (projected). The LCOE decreases steadily over time due to decreased manufacturing and
installation costs. Note that the figure shows the utility rates constant over time, when in fact they are
increasing. So the break-even point where solar and conventional electricity will cross can be expected
sooner than shown. But all such projections are based on assumptions, it is clear that solar PV electricity
is destined to achieve cost equivalence with grid power within 10 years.
Figure 3. LCOE (SYSTEM PRICE RANGE), utility electric rates vs year for solar PV. The installed U.S.
capacity in GW is shown on the right axis.80
27
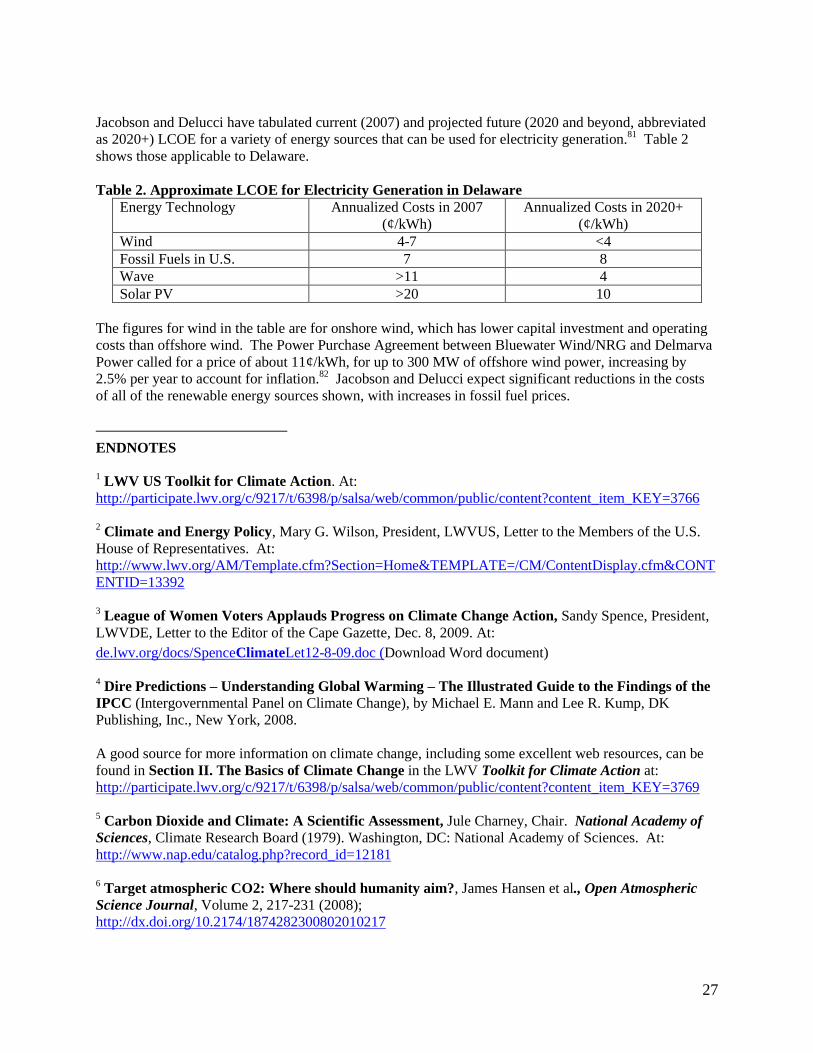
Jacobson and Delucci have tabulated current (2007) and projected future (2020 and beyond, abbreviated
as 2020+) LCOE for a variety of energy sources that can be used for electricity generation.81
Table 2
shows those applicable to Delaware.
Table 2. Approximate LCOE for Electricity Generation in Delaware
Energy Technology Annualized Costs in 2007
(¢/kWh)
Annualized Costs in 2020+
(¢/kWh)
Wind 4-7 <4
Fossil Fuels in U.S. 7 8
Wave >11 4
Solar PV >20 10
The figures for wind in the table are for onshore wind, which has lower capital investment and operating
costs than offshore wind. The Power Purchase Agreement between Bluewater Wind/NRG and Delmarva
Power called for a price of about 11¢/kWh, for up to 300 MW of offshore wind power, increasing by
2.5% per year to account for inflation.82
Jacobson and Delucci expect significant reductions in the costs
of all of the renewable energy sources shown, with increases in fossil fuel prices.
ENDNOTES
1 LWV US Toolkit for Climate Action. At:
http://participate.lwv.org/c/9217/t/6398/p/salsa/web/common/public/content?content_item_KEY=3766
2 Climate and Energy Policy, Mary G. Wilson, President, LWVUS, Letter to the Members of the U.S.
House of Representatives. At:
http://www.lwv.org/AM/Template.cfm?Section=Home&TEMPLATE=/CM/ContentDisplay.cfm&CONT
ENTID=13392
3 League of Women Voters Applauds Progress on Climate Change Action, Sandy Spence, President,
LWVDE, Letter to the Editor of the Cape Gazette, Dec. 8, 2009. At:
de.lwv.org/docs/SpenceClimateLet12-8-09.doc (Download Word document)
4 Dire Predictions – Understanding Global Warming – The Illustrated Guide to the Findings of the
IPCC (Intergovernmental Panel on Climate Change), by Michael E. Mann and Lee R. Kump, DK
Publishing, Inc., New York, 2008.
A good source for more information on climate change, including some excellent web resources, can be
found in Section II. The Basics of Climate Change in the LWV Toolkit for Climate Action at:
http://participate.lwv.org/c/9217/t/6398/p/salsa/web/common/public/content?content_item_KEY=3769
5 Carbon Dioxide and Climate: A Scientific Assessment, Jule Charney, Chair. National Academy of
Sciences, Climate Research Board (1979). Washington, DC: National Academy of Sciences. At:
http://www.nap.edu/catalog.php?record_id=12181
6 Target atmospheric CO2: Where should humanity aim?, James Hansen et al., Open Atmospheric
Science Journal, Volume 2, 217-231 (2008);
http://dx.doi.org/10.2174/1874282300802010217

28
7 Delaware Sea Level Rise Advisory Committee, Delaware Coastal Programs, DNREC. At:
http://www.swc.dnrec.delaware.gov/coastal/Pages/DESLRAdvisoryCommittee.aspx
8 Positive Feedbacks and Climate Runaway – The Need to Act Without Delay, Chad Tolman,
LWVUS Climate Change Task Force. At:
http://www.lwv.org/Content/ContentGroups/StudyTaskforces/GlobalClimateChange/CCTF_BP_PostiveF
eedback.pdf
9 Data from: http://www.eia.doe.gov/states/sep_sum/plain_html/rank_use_per_cap.html
10
Delaware Energy Plan 2009-2014, Governor‟s Energy Advisory Council, March 2010, p. 27. At:
http://sites.energetics.com/madri/pdfs/DE_Final_Energy_Plan.pdf
11
From: http://switchboard.nrdc.org/blogs/ljohnson/interstate_differences_in_gree.html
This graph was posted in 2009 and probably refers to data from 2008.
12
Data from: http://en.wikipedia.org/wiki/List_of_countries_by_carbon_dioxide_emissions_per_capita
13
UD's V2G technology takes national stage, UDaily, Feb. 23, 2010. At:
http://www.udel.edu/udaily/2010/feb/aaasv2g022310.html
14
Environmental Protection Agency, “Future Temperature Changes,” 2010.
http://www.epa.gov/climatechange/science/futuretc.html
15
Delaware Department of Natural Resources and Environmental Control, “Climate Change: Delaware‟s
Agriculture.”
http://www.dnrec.delaware.gov/ClimateChange/Pages/ClimateChangeDelawareAgriculture.aspx
16
Climate Change Science Program, 2009: Coastal Sensitivity to Sea-Level Rise: A Focus on the Mid-
Atlantic Region. A report by the U.S. Climate Change Science Program and the Subcommittee on Global
Change Research. James G. Titus (Coordinating Lead Author), K. Eric Anderson, Donald R. Cahoon,
Dean B. Gesch, Stephen K. Gill, Benjamin T. Gutierrez, E. Robert Thieler, and S. Jeffress Williams
(Lead Authors)]. U.S. Environmental Protection Agency, Washington D.C., USA, 320pp.
http://www.epa.gov/climatechange/effects/coastal/slrmaps_ma_db.html (map showing lands susceptible
to sea level rise)
17
Wilmington Area Planning Council, “Air Quality Conformity,” 2010. http://www.wilmapco.org/aq/
18
Op. cit., “Climate change and Delaware.”
19
Ibid.
20
Doug Denison, “Group warns global warming promotes severe weather,” Dover Post, Sept.10, 2010.
21
Dee Ross, “Making Resources „Climate Ready‟ the Subject of New Report,” Estuary News, Summer,
2010.
22
Molly Murray, “The State We Know Is in Peril,” Wilmington News Journal, Feb. 22, 2009.
23
Op. cit., “Climate Change and Delaware.”

29
24
Peter Schultz, Principal with ICF International, October 2010, conversation.
25
Delaware Department of Natural Resources and Environmental Control, “Climate Change: Shoreline
erosion and migration.”
http://www.dnrec.delaware.gov/ClimateChange/Pages/ClimateChangeShorelineErosion.aspx
26
Kenneth McGill, “How Important is Tourism to Delaware?” 2008.
http://dedo.delaware.gov/information/tourism/Delaware-TSA-final_Feb2008.pdf
27
Bill Swiatek, “Sea-level Rise: Transportation Vulnerability Assessment,” presentation before the
Technical Advisory Committee of the Wilmington Area Planning Council, Sept.16, 2010.
28
Environmental Protection Agency, “Climate Change: Health and Environmental Effects; Health,” 2010.
http://www.epa.gov/climatechange/effects/health.html
29
http://www.dnrec.delaware.gov/News/Pages/GovernorMinnerSignsRGGIInitiative.aspx
30
http://www.standardsolar.com/blog/?tag=rps
31
http://legis.delaware.gov/LIS/lis145.nsf/vwLegislation/SS+1+for+SB+119/$file/legis.html?open
32
http://camddataandmaps.epa.gov/gdm/index.cfm?fuseaction=emissions.wizard
33
http://bcap-energy.org/node/415
34
Climate Change and Delaware. EPA 230-F-97-008h (1997). At:
http://www.awm.delaware.gov/Info/Regs/Documents/de_impct1.pdf
35
http://www.swc.dnrec.delaware.gov/coastal/Documents/SeaLevelRise/DNREC_SLR_Policy.pdf 36
http://www.swc.dnrec.delaware.gov/coastal/Documents/SLR%20Advisory%20Committee/SLR%20Advisory
%20Cmte%20Member%20without%20contact%20info.pdf
37
http://www.swc.dnrec.delaware.gov/coastal/Pages/DESLRAdvisoryCommittee.aspx
38
http://www.swc.dnrec.delaware.gov/coastal/Pages/SeaLevelRiseAdaptation.aspx
39
Delaware Climate Change Action Plan. Available in PDF format at:
http://www.udel.edu/ceep/publications/energy/reports/energy_delaware_climate_change_action_plan/dec
cap.htm
40
Table ES-1 of the Delaware Climate Change Action Plan (2000)
41
State by State Carbon Dioxide Emissions by Year 2000-2008. At:
www.eia.doe.gov/oiaf/1605/ggrpt/excel/tbl_statetotal.xls
42
The term „CO2-equivalents‟ was used because methane, a powerful GHG, can be generated by bacteria
in landfills containing organic waste. A ton of methane has the global warming potential of 25 tons of
CO2.

30
43
Amardeep Dhanju, Phillip Whitaker, Willett Kempton, Assessing offshore wind resources: An
accessible methodology, Renewable Energy (2008). At:
http://www.ceoe.udel.edu/windpower/docs/DhanjuWhitKemp-proof-RE07.pdf
44
Bright Ideas for Delaware’s Energy Future, Sept. 2003. At:
http://www.dnrec.delaware.gov/Admin/Documents/Delaware%20Energy%20Task%20Force%20full%20
text%20version.pdf
45
Delaware Energy Plan 2009-2014, published on behalf of the Governor‟s Energy Advisory Council
March 26, 2009. At:
http://www.dnrec.delaware.gov/energy/Documents/Energy%20Plan%20Council%20report%20-
%20Final.pdf
46
Conversation with Morgan Ellis, who supplied the LWV DE Energy Committee with an Excel table
tracking the recommendations in early 2011.
47
Pew Center on Global Climate Change, Climate Change 101: State Action, Jan.2009.
http://www.pewclimate.org/docUploads/Climate101-State-Jan09_1.pdf
48
Emissions Trading, Wikipedia. At: http://en.wikipedia.org/wiki/Emissions_trading
49
Vermont Agency of Natural Resources, Department of Environmental Conservation, Air Pollution
Control Division, Vermont Greenhouse Gas Emissions Inventory Update 1990-2008. Sept. 2010. At:
http://www.anr.state.vt.us/anr/climatechange/Pubs/Vermont%20GHG%20Emissions%20Inventory%20U
pdate%201990-2008%20FINAL_09272010.pdf
50
Institute for Energy Research, Rhode Island, Select Economic and Energy Data [date unknown]
http://www.instituteforenergyresearch.org/states/rhode-island/
51
Stanton, E., F. Ackerman and K. Sheeran, Why Do State Emissions Differ So Widely? Economics
for Equity and Environment. December 2010.
http://www.e3network.org/papers/Why_do_state_emissions_differ_so_widely.pdf
52
Delaware Senate Substitute 1 for Senate Bill 119, at:
http://www.legis.delaware.gov/LIS/lis145.nsf/vwLegislation/SS+1+for+SB+119/$file/legis.html?open
See also: http://www.acore.org/files/pdfs/states/Delaware.pdf
53
American Wind Energy Association, “State-Level Renewable Energy Portfolio Standards (RPS),” [date
unknown]. At:
http://api.ning.com/files/7u1eapyLI6jqSyq7JVXPVxmYUipTwVYRs4cpvYTXF22hftW3qe4TMxjrwJE
McwPWqgktaGS83T75VGhQ5EYXYLuasOvYTT3V/AWEAStateLevelRenewableEnergyPortfolioStan
dardsFactSheet.pdf
54
ClimatePlan Partners, ClimatePlan: Strategic Plan, 2009-2011, [date unknown].
http://www.climateplanca.org/StrategicPlan_web.pdf
55
Proposition 23 Rejection Legitimizes Climate Policy, Verdantix, Nov. 3, 2010. At:
http://www.verdantix.com/index.cfm/papers/Products.Details/product_id/172/proposition-23-rejection-
legitimizes-climate-policy/-

31
56
ClimatePlan Partners, ClimatePlan: addressing the land use decisions that shape our climate and
our lives. glossy brochure [date unknown].
57
Mintier-Harnish, Regional Planning and Climate Change: Understanding SB 375, [date unknown]. At:
http://www.mintierharnish.com/_pdfs/SB375_2010-05-02.pdf
58
The figure was made using data from Willett Kempton, Reducing the Environmental Footprint of
the Energy Delawareans Use Work Group, Report to the Governor‟s Energy Advisory Council,
Appendix C, pp. 48-61. At:
http://www.dnrec.delaware.gov/Admin/Documents/Footprint%20Work%20Group%20-
%20Final%20Report%20rev%201-21-09a.pdf
59
MWa is the average power in MW over a period of a year.
60
A kilowatt hour (kWh) is a unit of energy and is what you pay for on your utility bill.
61
The 350 MW of peak power assumes that the average electrical power consumed in 2025 will be 1600
MW and that the Capacity Factor for PV in Delaware is 0.16. The Capacity Factor is the power, averaged
over a year, that one actually gets divided by the maximum power possible (sun directly overhead on a
cloudless day in the case of PV).
62
Offshore Wind Power Line Wins Praise, and Backing, NY Times, Oct. 12, 2001. At:
http://www.nytimes.com/2010/10/12/science/earth/12wind.html
63
T. Hoff, H. Wenger “The value of photovoltaics in the distrubution system: PVUSA‟s Kerman Grid
Support Project” Final Report 007.5-94-15 to US DOE (1994).
64
Farrell, Morris “Energy Self-Reliant States”, published on-line by the New Rules Project (May 2010),
http://www.newrules.org/energy/publications/energy-selfreliant-states-second-and-expanded-edition
65
Two reports are available at: http://ceep.udel.edu/energy/publications/index.html
They are:
“Photovoltaic Technology as a Dispatchable, Peak-Shaving Option.” 1995. John Byrne, Ralph Nigro and
Young-Doo Wang. Public Utilities Fortnightly (Sept. 1), and
“Photovoltaics as a Demand-Side Management Technology: An Analysis of Peak-Shaving and Direct
Load Control Options.” 1994. John Byrne, Young-Doo Wang and Steven Hegedus. Progress in
Photovoltaics, Vol. 2: 235-48.
66
“CREATING A SOLAR CITY : Determining the Potential of Solar Rooftop Systems in the City of
Newark” Final Report August 2009, Renewable Energy Applications for Delaware Yearly (READY)
Project (http://ceep.udel.edu/energy/publications/index.html)
67
SRECs (Solar Renewable Energy Credits) earn payments from utilities to owners of solar PV systems
for the energy they generate, in units of $ per MWh of electricity. A MWh (megawatt hour) is 1000 kWh,
so an SREC of $150/MWh would pay 15¢/kWh.
68
Fthenakis V., Kim H., Alsema E., Environmental Science Technology 42 (2008) 2168-2174.

32
69
Fthenakis V.M., Mason J., Hansen T., Zweibel K., Proc. 33rd
IEEE Photovoltaic Specialists
Conference, (2008 San Diego).
70
Kempton, W. and J. Tomić, J. Power Sources 44 (2005), 268-279.
71
Denholm P., Margolis R., Energy Policy 35 (2007) 2852-2861.
72
Denholm P., Margolis R., Energy Policy 35 (2007) 4424-4433.
73
Mark Jacobson and Mark Delucchi, Scientific American, Nov. 2009, A Path to Sustainable Energy
by 2030. At: http://www.stanford.edu/group/efmh/jacobson/sad1109Jaco5p.indd.pdf
74
U.S. Dept. of Energy, Energy Efficiency and Renewable Energy, Maps and Data. At:
http://www1.eere.energy.gov/maps_data/renewable_resources.html
75
1 GW = 1000 MW, and 1 MW = 1000 kW.
76
Barry Friedman “NREL PV Jobs/labor Intensity Project” available at http://irecusa.org
77
http://www.greentechmedia.com/articles/read/arnold-lashes-out-at-valero-prop-23-opponents
78
U.S. Conference of Mayors, Green Jobs in U.S. Metro Areas, October 2008. At:
http://www.scribd.com/doc/9666206/US-Conference-of-Mayors-Green-Jobs-in-US-Metro-Areas-
October-2008
79
Delaware Solar Energy Coalition. At: www.delsec.org
80
Innovation & Commercialization: What’s Being Done? Presentation by John Lushetsky, Manager
U.S. Department of Energy Solar Energy Technology Program at Solar Leadership Summit 2010
(solartech.org)
81
From Table 6 in Mark Jacobson and Mark Delucchi, Evaluating the Feasibility of a Large-Scale
Wind, Water, and Sun Energy Infrastructure. At:
http://www.stanford.edu/group/efmh/jacobson/WindWaterSun1009.pdf
82
Report on Final Power Purchase Agreement between Delmarva Power and Bluewater Wind LLC,
Delaware Public Service Commission Docket No. 06-241, July 3, 2008. At:
http://www.ceoe.udel.edu/Windpower/DE-Qs/NEO%20Report%207-3-08%20FINAL.pdf