supplementary information protein a cartridge” acid ... · pdf file1 supplementary...
TRANSCRIPT
1
Supplementary information
Enzyme free detection of Staphylococcal Enterotoxin B (SEB) using ferrocene carboxylic
acid labeled monoclonal antibodies: An electrochemical approach
Arun Sharma, Vepa Kameswara Rao*, Dev Vrat Kamboj, Ritu Gaur, Mahabul Shaik, Anchal Roy Shrivastava
Defence Research and Development Establishment, Gwalior (M.P.), India – 474002
1. Affinity chromatography based purification, estimation and SDS-PAGE analysis of SEB
and IgG samples
Unpurified rabbit anti-SEB polyclonal IgG and mice anti-SEB monoclonal IgG was
purified by affinity chromatography based method as per details given by the manufacturer. In
this method, unpurified serum sample was first mixed properly with the binding buffer. After
that the “Protein A Cartridge” was washed with regeneration buffer. For this purpose,
regeneration buffer was passed through the cartridge at the approx flow rate of 1mL/min. Then
the cartridge was equilibrated by binding buffer by passing the binding buffer through the
cartridge at the same flow rate. Then, we had loaded the sample-binding buffer mixture by
passing it to the “Protein A Cartridge” at the approx flow rate of 0.5mL/min. Binding buffer was
passed through the cartridge after the sample loading at the flow rate of about 1mL/min.
Desalting cartridge was washed with [N-(2-hydroxyethyl)peiperazine-N’-(2-ethanesulfonic
acid)] i.e. (HEPES) buffer by passing it through the cartridge at an approximate flow rate of
1mL/min. Then we had attached the one end of the “Protein A Cartridge” to another end of the
desalting cartridge. Then, we had eluted the cartridges with elution buffer by passing it through
the cartridges at an approximate flow rate of 0.5mL/minute. Elute was contained the purified IgG
at physiological pH. After it, we had detached both the cartridges and regenerate them. “Protein
A Cartridge” was regenerated by regeneration buffer by passing it through the cartridge. HEPES
buffer was passed through the desalting cartridge and was regenerated. These cartridges are
ready and can be used for another affinity chromatographic purification.
Electronic Supplementary Material (ESI) for New Journal of Chemistry.This journal is © The Royal Society of Chemistry and the Centre National de la Recherche Scientifique 2016

2
(a) (b)
Figure S1. (a) Shows the standard graph obtained for the estimation of rabbit anti-SEB IgG (b)
shows for estimation of mice anti-SEB IgG using BCA-protein estimation method
Bicinchoninic acid protein assay kit and spectrophotometric method was utilized for the
estimation of purified rabbit anti-SEB polyclonal IgG and mice anti-SEB monoclonal IgG
concentration. For this purpose, bicinchoninic acid (BCA) working reagent was prepared by
mixed with 50 parts of reagent A (containing bicinchonic acid, sodium carbonate, sodium
tartrate, and sodium bicarbonate in 0.1N NaOH, pH 11 with 1 part of reagent B (containing 4%
(w/v) copper(II) sulfate pentahydrate). In the standard procedure, BCA working reagent was
taken in 200µL are mixed with 0, 2, 4, 6, 8, 10µL part of a standard protein (BSA) solution of
known concentration. 10µL of water without protein was used as blank. Unknown purified IgG
sample was assayed with the known concentration of BSA protein standard. After that, the plate
was incubated at 37°C for 30min. In the next step, absorbance was recorded at 562nm and the
unknown protein concentration was determined by comparison to the standard curve. It was
estimated that 2.4mg/mL IgG is present in rabbit-IgG of SEB and 1.0mg/mL IgG was present in
mice-IgG of SEB.
2. SDS-PAGE analysis of purified rSEB, mouse anti-SEB IgG and rabbit anti-SEB IgG
Figure S2. 12% SDS-PAGE gel image of Molecular weight marker (lane-1), purified rSEB (lane
2), purified polyclonal rabbit anti-SEB IgG (lane 3) and purified monoclonal mice anti-SEB IgG
(lane 4).

3
Sodium dodecylsulphate-polyacrylamide gel electrophoresis (SDS-PAGE) protocol was
followed as per details given by the manufacturer. SDS-PAGE was performed to check the
purity of SEB, rabbit anti-SEB IgG and mouse anti-SEB IgG. Two bands are observed that
corresponding to heavy and light chain of the purified rabbit and mice IgG raised against SEB
(lane 3 & 4 respectively in fig.S2). A sharp band around 28.4 kDa (lane 2 in fig.S2) clearly
indicates the presence of SEB. In this experiment, separating gel mixture (12% final
concentration in 5mL) was prepared by mixing the stock solution of 30% acryl amide (2mL),
1.5M Tris-buffer, pH 8.8 (1.25mL), 10% SDS (50µL) and distilled water (1.65mL) and then
N,N,N´,N´-tetramethylethylenediamine (TEMED) (5µL) and 10% ammonium persulphate
(50µL) was added. This mixture was transferred into the gel mould and overlay it with 50µL of
butanol and then kept for 40min for polymerization. In the next step, 2.5mL of 5% stacking gel
was prepared by mixing 415µL of 30% acrylamide, 315µL of 1M Tris-buffer, pH 6.8, 25µL of
10% SDS and 1.7mL distilled water and then 5µL TEMED and 25µL ammonium persulphate
was added. After that, stacking gel was transferred into the gel mould that contains the already
polymerized separating gel. At the same time, suitable comb was carefully inserted without any
air bubbles to make slots or loading wells for sample application. After complete polymerization,
PAGE apparatus was appropriately filled with 1x running buffer (composition of 10x running
buffer in 500mL is 93.75gm glycine, 5gm SDS and 15.125gm Tris). Then, the comb was
carefully removed and the samples such as purified rSEB (lane 2), purified polyclonal rabbit
anti-SEB IgG (lane 3) and purified monoclonal mice anti-SEB IgG (lane 4) were loaded in
separate wells. Standard protein molecular weight marker was loaded in separate slot for the
accurate molecular weight determination of protein samples. After that 10mA fixed current was
applied till the samples crossed the stacking gel and then the electric current was increased to
20mA. It was performed until the molecular weight marker reaches at the bottom of the gel.
3. Validation of antibodies by Western blot

4
Figure.S3. (A) shows the western blot of SEB with monoclonal mice anti-SEB IgG and (B) is
the western blot of SEB with polyclonal rabbit anti-SEB IgG.
In the present study, affinity purified SEB was used to raise antibodies in mice and rabbit
models. These antibodies were evaluated by western blot. It is found that the antibodies are pure
and bind with SEB [Fig.S3 (A) & (B)]. Furthermore, we can state that the antiserum raised in
this study was found to be more specific for SEB detection compare to other commercial
antiserum available from M/s Toxin Technology, USA [Kamboj et al., 2006].
4. Animal care and use
Female BALB/c mice (6-8 weeks old) were obtained from Defence Research and
Development Establishment’s animal facility and were given water and food ad libitum. All mice
were housed and used in accordance with the recommendations of the committee for the purpose
of control and supervision of experiments on animals (CPCSEA), India. The study had the
approval of Institutional Animal Ethics Committee (IAEC).
5. SEM characterization
(A) (B)
5
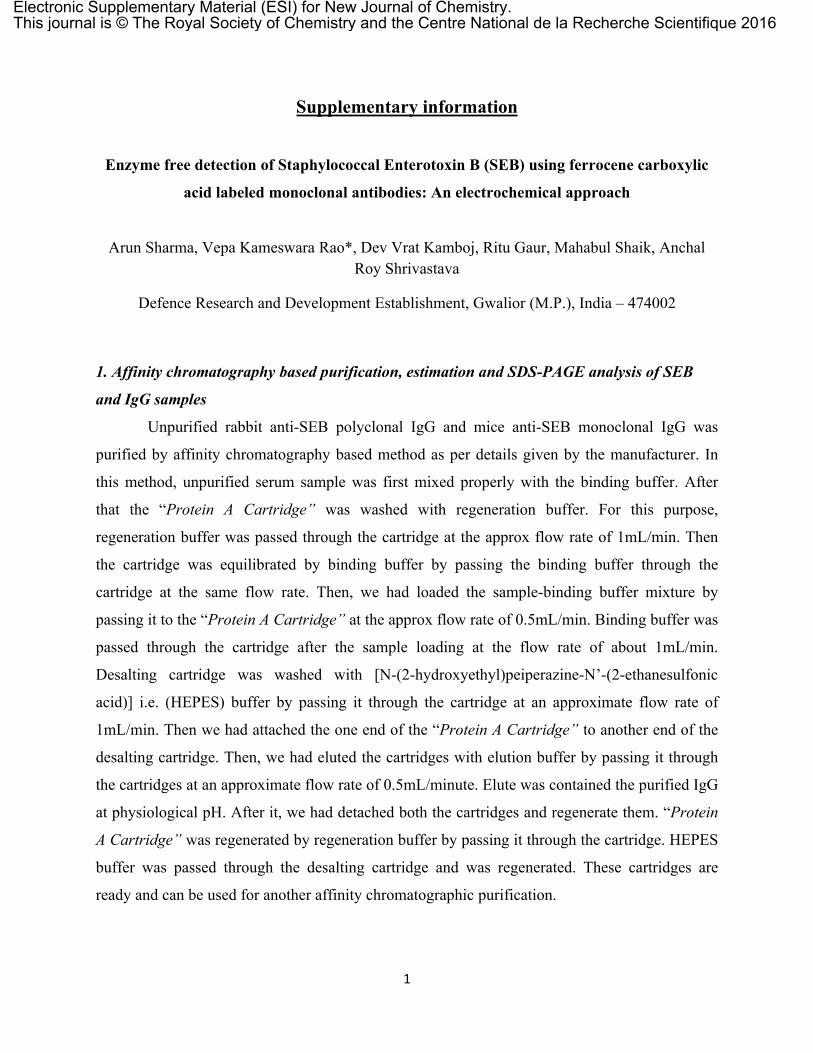
(C) (D)
Figure S4.(A) SEM-image of graphene (GR) sheets, (B) for graphene-Ch-Au NPs, (C) for
MWNCTs and (D) for MWCNTs-Ch-Au NPs nanocomposites
GR, GR-Ch-Au NPs, MWCNTs and MWCNTs-Ch-Au NPs were characterized by
SEM. Graphene (GR) is giving overlapped multiple layered with fairly smooth-sheet like
morphology and due to nanoscale sheet interlocking it is having good film-forming ability [Xu et
al., 2008]. The lateral dimensions of the graphene sheets were around 300nm which indicates its
atomic thickness composition [Fig.1S(A)]. Due to presence of small cracks on the crumpled
island like structure of graphene it can provide a suitable platform for the immobilization of
biomolecules for immunosensing applications. After treatment of graphene with chitosan and Au
NPs formation on its surface are clearly seen in the SEM-image [Fig.1S(B)]. It can be observed
from [Fig.1S(B)] that gold nanoparticles with the average size of 20-50nm were uniformly
distributed on the chitosan modified graphene surface. The diameters of carbon nanotubes were
ranging from 20 to 60 nm and length range from 1 to 3μ. Moreover, no residuals can be found
and the surface of nanotubes was smooth and tidy [Fig.1S(C)]. MWCNTs were successfully
functionalized with gold nanoparticles (Au NPs) seen in [Fig.1S(D)]. This confirms that the
synthesized materials are falling under the category of nanocompounds.
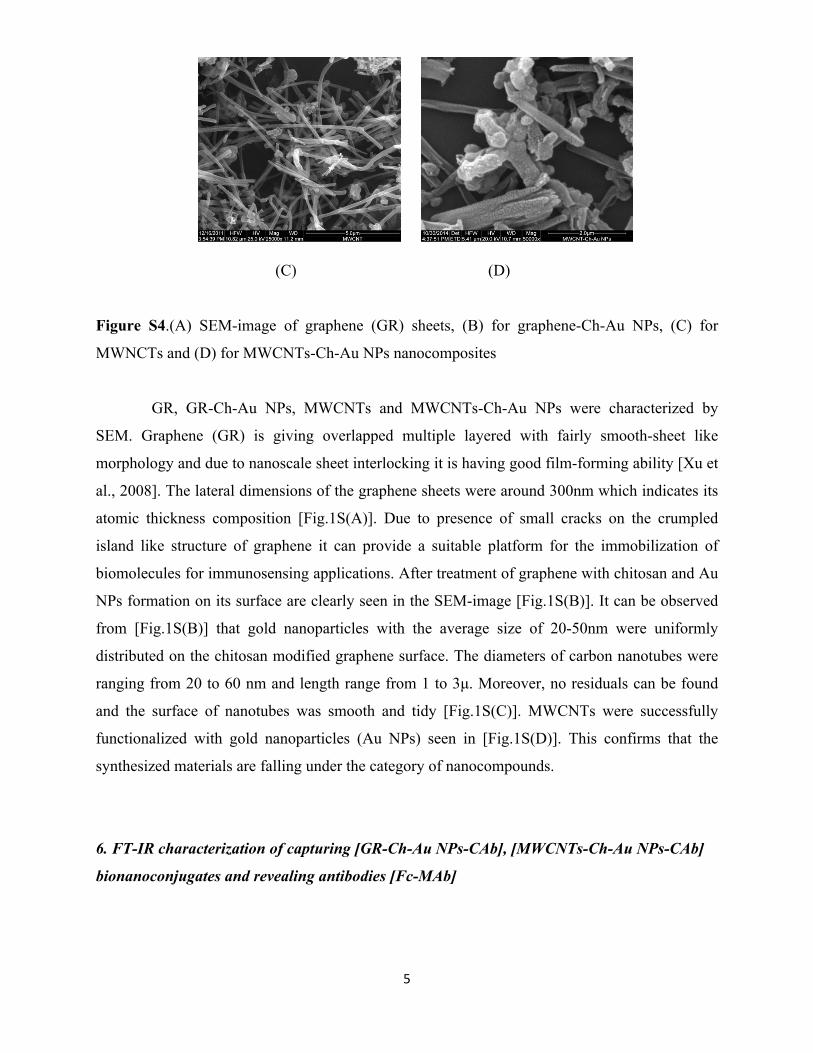
6. FT-IR characterization of capturing [GR-Ch-Au NPs-CAb], [MWCNTs-Ch-Au NPs-CAb]
bionanoconjugates and revealing antibodies [Fc-MAb]
6
(a) (b) (c)
Figure S5. (a) FT-IR characterization of [MWCNTs-Ch-Au NPs-CAb], (b) for [GR-Ch-Au NPs-
CAb] bionanoconjugates and (c) for revealing antibodies [Fc-MAb].
In this work, the formation of the GR-Ch-AuNPs-CAb, MWCNTs-Ch-AuNPs-CAb
bionanoconjugates and revealing antibodies [Fc-MAb] was checked by FTIR-characterization
method. The FTIR spectra of MWCNTs, chitosan, rabbit anti-SEB polyclonal IgG and
[MWCNTs-Ch-Au NPs-CAb] bionanoconjugates are shown in Fig. S5(a). For MWCNTs, the
peak at 1653cm−1 belongs to the C=O stretching vibration of the -COOH group, which can also
be observed in [MWCNTs-Ch-Au NPs-CAb] bionanoconjugates. More importantly, for
MWCNTs hybrid, the sharp peak located at 2085 cm−1 is attributed to the C stretching
vibration [Li et al., 2007]. Besides this in the FTIR- spectrum of graphene solution is shown in
Figure S5(b). The absence of graphite and graphene oxide peaks is a strong indication of the
obtaining of graphene sheets [Mohammed et al., 2012]. The characteristic absorption of the
chitosan is the band at 1559.17 cm-1 which is assigned to the stretching vibration of amino group
of chitosan and 1333.5cm-1 assigned to vibration of C-H. Another band at 3367.1cm-1 is due to
amine NH symmetric vibration. The peak of 2927.41 cm-1 is typical C-H vibration. Chitosan
characteristic peaks are coming around 896.73 and 1154.19 cm-1 which correspond to saccharide
structure of chitosan. The broad peak at 1080.91cm-1 indicates C-O stretching vibration [Krishna
Rao et al. 2006]. The FT-IR of capturing antibodies bionanoconjugates indicates that it was
successfully formed.
In the FT-IR spectrum of ferrocene carboxylic acid fig.S5(c), C–O stretch appears in
the region 1320-1210 cm-1, O-H stretch from 3300-2500cm-1, C=O stretch from 1760-1690cm-1
and the O–H bend is in the region 1440-1395 cm-1 and 950-910cm-1. The secondary structure of
IgG samples were examined by FTIR given in fig.S5(c). The spectrum displays a predominantly
7
β-sheet structure with a typical minimum at 1636 cm−1. The peptide group, the structural repeat
unit of proteins, gives up to 9 characteristic bands named amide A, B, I, II ... VII. Amide A is
with more than 95% due to the N-H stretching vibration. This mode of vibration does not depend
on the backbone conformation but is very sensitive to the strength of a hydrogen bond. It has
vibrations between 3225 and 3280 cm-1 for hydrogen bond lengths between 2.69 to 2.85 Å,
[Krimm et al., 1986]. The amide A band (about 3500cm-1) and amide B (about 3100cm-1)
originate from a Fermi resonance between the first overtone of amide II and the N-H stretching
vibration. Amide I and amide II bands are two major bands of the protein infrared spectrum. The
amide I band (between 1600 and 1700 cm-1) is mainly associated with the C=O stretching
vibration (70-85%) and is directly related to the backbone conformation. Amide II results from
the N-H bending vibration (40-60%) and from the C-N stretching vibration (18-40%). This band
is conformationally sensitive. Amide III and IV are very complex bands resulting from a mixture
of several coordinate displacements. The out-of-plane motions are found in amide V, VI and VII.
FTIR analysis of ferrocene conjugated antibodies indicated that the conjugated antibodies
maintain the significant native-like secondary structure suggesting that labeling of antibodies led
to the minimal structure changes [Brych et al., 2010]. It shows that ferrocene carboxylic acid was
successfully tagged with antibodies.
7. Optimization of various parameters
BCA, SDS-PAGE and SWV method was used for the optimization of concentration of
polyclonal rabbit anti-SEB IgG (capturing antibodies) attached with GR-Ch-Au NPs and
MWCNTs-Ch-Au NPs nanocomposites. The same method is also used for the optimization of
monoclonal mice anti-SEB IgG which were conjugated with ferrocene carboxylic acid. In brief,
250µg/mL and 150µg/mL capturing antibodies were optimized and used for the
bionanoconjugation with GR-Ch-Au NPs and MWCNTs-Ch-Au NPs nanocomposites
respectively. Furthermore, 200µg/mL monoclonal mice anti-SEB IgG were optimized and used
for the conjugation with ferrocene carboxylic acid. The details of these optimizations were given
in the coming sections.
8
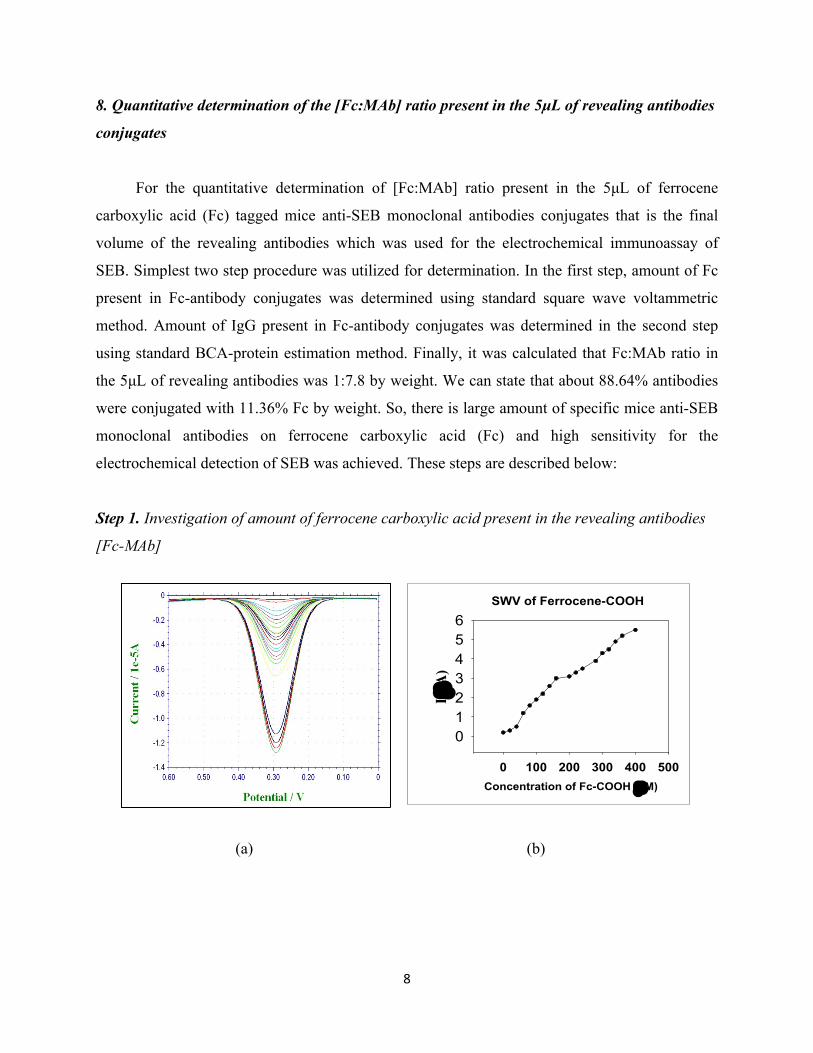
SWV of Ferrocene-COOH
Concentration of Fc-COOH (M)0 100 200 300 400 500
I(A
)
0123456
8. Quantitative determination of the [Fc:MAb] ratio present in the 5μL of revealing antibodies
conjugates
For the quantitative determination of [Fc:MAb] ratio present in the 5μL of ferrocene
carboxylic acid (Fc) tagged mice anti-SEB monoclonal antibodies conjugates that is the final
volume of the revealing antibodies which was used for the electrochemical immunoassay of
SEB. Simplest two step procedure was utilized for determination. In the first step, amount of Fc
present in Fc-antibody conjugates was determined using standard square wave voltammetric
method. Amount of IgG present in Fc-antibody conjugates was determined in the second step
using standard BCA-protein estimation method. Finally, it was calculated that Fc:MAb ratio in
the 5μL of revealing antibodies was 1:7.8 by weight. We can state that about 88.64% antibodies
were conjugated with 11.36% Fc by weight. So, there is large amount of specific mice anti-SEB
monoclonal antibodies on ferrocene carboxylic acid (Fc) and high sensitivity for the
electrochemical detection of SEB was achieved. These steps are described below:
Step 1. Investigation of amount of ferrocene carboxylic acid present in the revealing antibodies
[Fc-MAb]
(a) (b)

9
Figure S6. (a). SWV obtained at different concentrations of ferrocene carboxylic acid and (b)
shows the standard curve for the determination of ferrocene carboxylic acid present in its
antibody conjugates
For the quantitative determination of ferrocene carboxylic acid present in the 5µL of
revealing antibodies [Fc-MAb] bioconjugates which was used for the electrochemical
immunoassay of SEB. Amount of ferrocene carboxylic acid in revealing antibodies [Fc-MAb]
was determined by square wave voltammetric (SWV) analysis. For this purpose, SWV was
performed at various concentrations of ferrocene carboxylic acid on bare GCE fig.S6(a) and the
standard graph is plotted between the obtained voltammetric peak current and concentration fig.
S6(b). Then, 5µL of revealing antibodies [Fc-MAb] is put on GCE surface and kept in the
incubator for 15min at 370C. After incubation SWV was performed and the corresponding
concentration (i.e. 113.5µM) for the observed peak current (i.e. 2.15µA) was found on the bare
GCE. It is estimated that 113.5µM of ferrocene carboxylic acid present in the 5µL of revealing
antibodies [Fc-MAb] monoclonal antibodies conjugates. Finally, 130.5ng ferrocene carboxylic
acid was present in 5μL of revealing antibodies [Fc-MAb]. After modification of GCE the signal
is greatly enhanced for the same amount of ferrocene carboxylic acid labeled antibodies and it
was 7.13µA and 2.99µA for GR-Ch-Au NPs and MWCNTs-Ch-Au NPs modified GCE. It is
verified that the signal amplification strategy was successfully achieved on modified GCE.
Step 2. Determination of amount of mice anti-SEB IgG present and its confirmatory binding in
the revealing antibodies [Fc-MAb]
(a) (b)
10
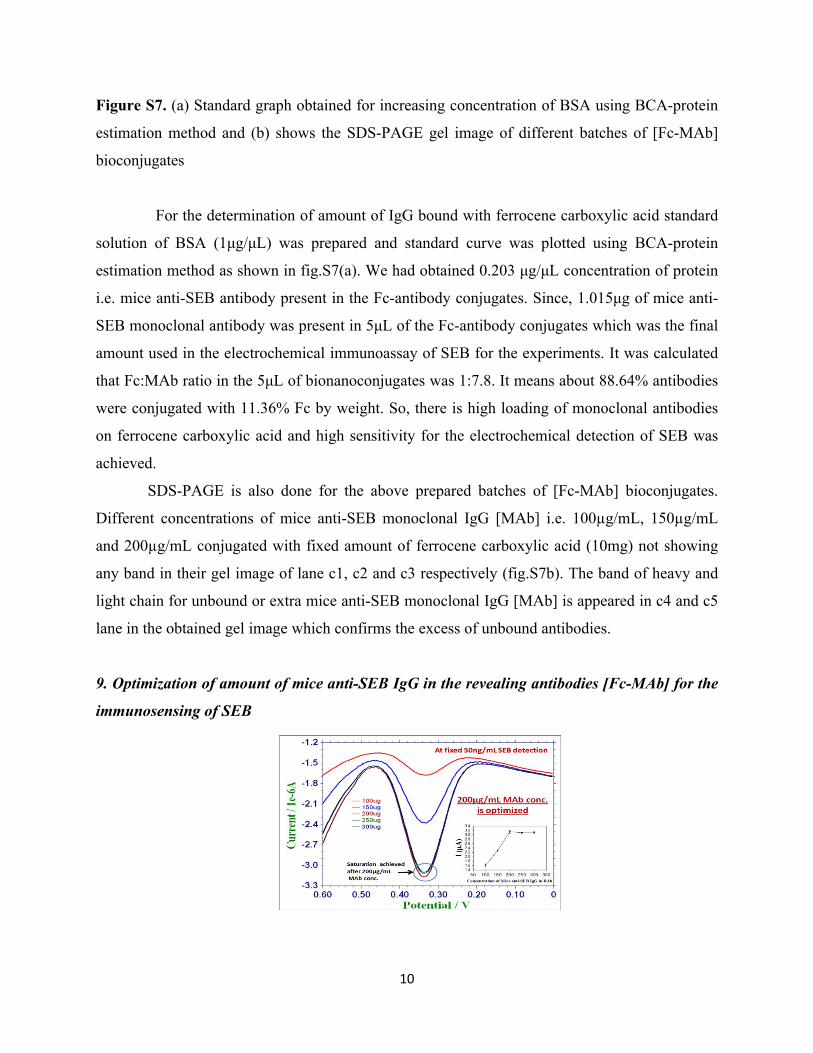
Figure S7. (a) Standard graph obtained for increasing concentration of BSA using BCA-protein
estimation method and (b) shows the SDS-PAGE gel image of different batches of [Fc-MAb]
bioconjugates
For the determination of amount of IgG bound with ferrocene carboxylic acid standard
solution of BSA (1μg/μL) was prepared and standard curve was plotted using BCA-protein
estimation method as shown in fig.S7(a). We had obtained 0.203 μg/μL concentration of protein
i.e. mice anti-SEB antibody present in the Fc-antibody conjugates. Since, 1.015μg of mice anti-
SEB monoclonal antibody was present in 5μL of the Fc-antibody conjugates which was the final
amount used in the electrochemical immunoassay of SEB for the experiments. It was calculated
that Fc:MAb ratio in the 5μL of bionanoconjugates was 1:7.8. It means about 88.64% antibodies
were conjugated with 11.36% Fc by weight. So, there is high loading of monoclonal antibodies
on ferrocene carboxylic acid and high sensitivity for the electrochemical detection of SEB was
achieved.
SDS-PAGE is also done for the above prepared batches of [Fc-MAb] bioconjugates.
Different concentrations of mice anti-SEB monoclonal IgG [MAb] i.e. 100µg/mL, 150µg/mL
and 200µg/mL conjugated with fixed amount of ferrocene carboxylic acid (10mg) not showing
any band in their gel image of lane c1, c2 and c3 respectively (fig.S7b). The band of heavy and
light chain for unbound or extra mice anti-SEB monoclonal IgG [MAb] is appeared in c4 and c5
lane in the obtained gel image which confirms the excess of unbound antibodies.
9. Optimization of amount of mice anti-SEB IgG in the revealing antibodies [Fc-MAb] for the
immunosensing of SEB
11
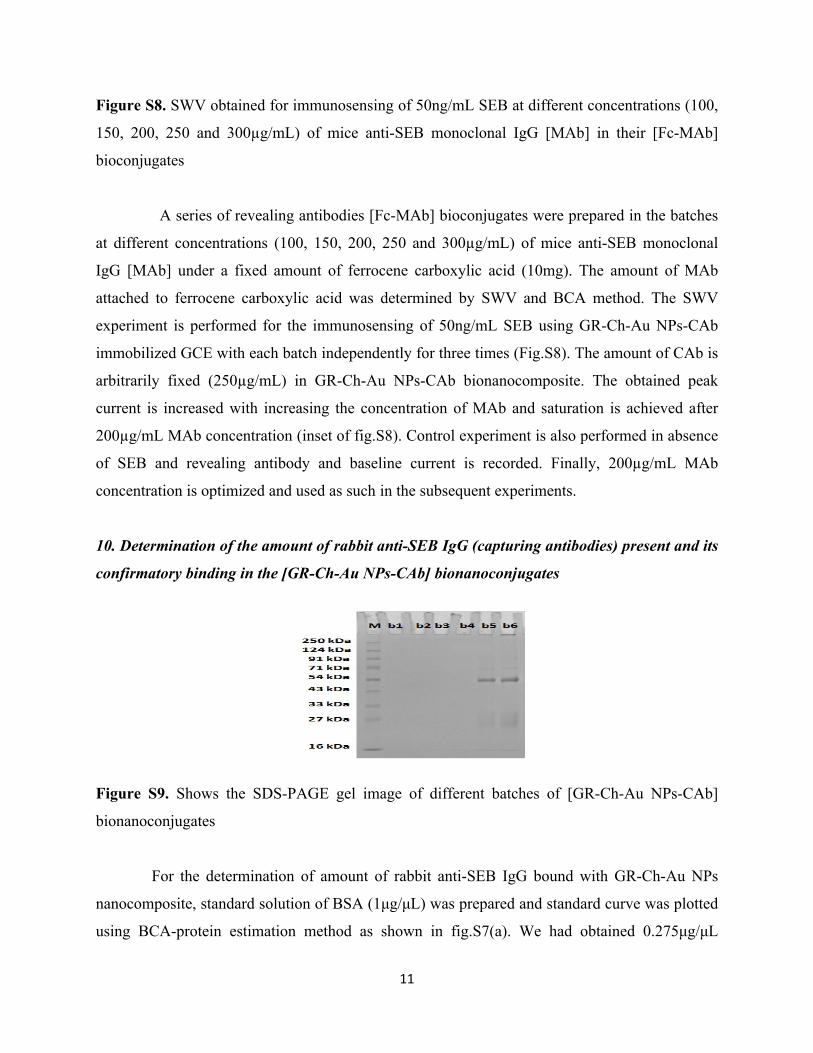
Figure S8. SWV obtained for immunosensing of 50ng/mL SEB at different concentrations (100,
150, 200, 250 and 300µg/mL) of mice anti-SEB monoclonal IgG [MAb] in their [Fc-MAb]
bioconjugates
A series of revealing antibodies [Fc-MAb] bioconjugates were prepared in the batches
at different concentrations (100, 150, 200, 250 and 300µg/mL) of mice anti-SEB monoclonal
IgG [MAb] under a fixed amount of ferrocene carboxylic acid (10mg). The amount of MAb
attached to ferrocene carboxylic acid was determined by SWV and BCA method. The SWV
experiment is performed for the immunosensing of 50ng/mL SEB using GR-Ch-Au NPs-CAb
immobilized GCE with each batch independently for three times (Fig.S8). The amount of CAb is
arbitrarily fixed (250µg/mL) in GR-Ch-Au NPs-CAb bionanocomposite. The obtained peak
current is increased with increasing the concentration of MAb and saturation is achieved after
200µg/mL MAb concentration (inset of fig.S8). Control experiment is also performed in absence
of SEB and revealing antibody and baseline current is recorded. Finally, 200µg/mL MAb
concentration is optimized and used as such in the subsequent experiments.
10. Determination of the amount of rabbit anti-SEB IgG (capturing antibodies) present and its
confirmatory binding in the [GR-Ch-Au NPs-CAb] bionanoconjugates
Figure S9. Shows the SDS-PAGE gel image of different batches of [GR-Ch-Au NPs-CAb]
bionanoconjugates
For the determination of amount of rabbit anti-SEB IgG bound with GR-Ch-Au NPs
nanocomposite, standard solution of BSA (1μg/μL) was prepared and standard curve was plotted
using BCA-protein estimation method as shown in fig.S7(a). We had obtained 0.275μg/μL
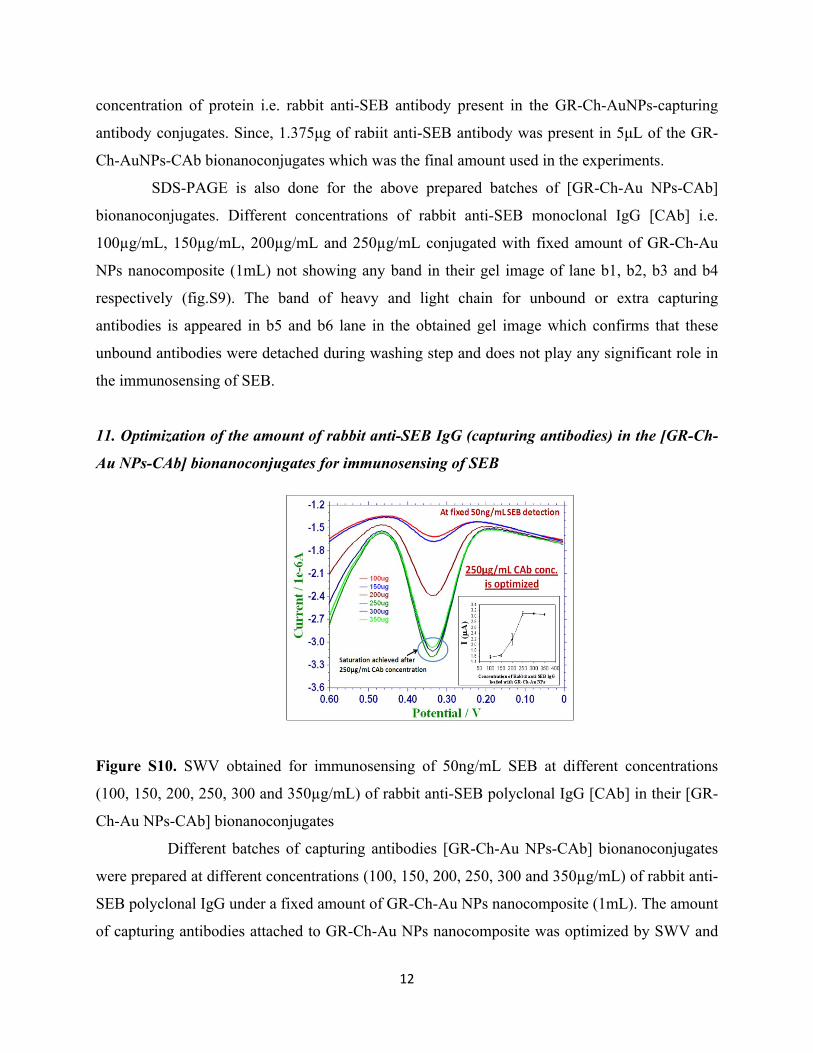
12
concentration of protein i.e. rabbit anti-SEB antibody present in the GR-Ch-AuNPs-capturing
antibody conjugates. Since, 1.375μg of rabiit anti-SEB antibody was present in 5μL of the GR-
Ch-AuNPs-CAb bionanoconjugates which was the final amount used in the experiments.
SDS-PAGE is also done for the above prepared batches of [GR-Ch-Au NPs-CAb]
bionanoconjugates. Different concentrations of rabbit anti-SEB monoclonal IgG [CAb] i.e.
100µg/mL, 150µg/mL, 200µg/mL and 250µg/mL conjugated with fixed amount of GR-Ch-Au
NPs nanocomposite (1mL) not showing any band in their gel image of lane b1, b2, b3 and b4
respectively (fig.S9). The band of heavy and light chain for unbound or extra capturing
antibodies is appeared in b5 and b6 lane in the obtained gel image which confirms that these
unbound antibodies were detached during washing step and does not play any significant role in
the immunosensing of SEB.
11. Optimization of the amount of rabbit anti-SEB IgG (capturing antibodies) in the [GR-Ch-
Au NPs-CAb] bionanoconjugates for immunosensing of SEB
Figure S10. SWV obtained for immunosensing of 50ng/mL SEB at different concentrations
(100, 150, 200, 250, 300 and 350µg/mL) of rabbit anti-SEB polyclonal IgG [CAb] in their [GR-
Ch-Au NPs-CAb] bionanoconjugates
Different batches of capturing antibodies [GR-Ch-Au NPs-CAb] bionanoconjugates
were prepared at different concentrations (100, 150, 200, 250, 300 and 350µg/mL) of rabbit anti-
SEB polyclonal IgG under a fixed amount of GR-Ch-Au NPs nanocomposite (1mL). The amount
of capturing antibodies attached to GR-Ch-Au NPs nanocomposite was optimized by SWV and

13
BCA-method. The SWV experiment is performed for the immunosensing of 50ng/mL SEB using
different batches of [GR-Ch-Au NPs-CAb] immobilized GCE independently for three times
(fig.S10). The obtained peak current is increased with increasing the concentration of capturing
antibodies and saturation is achieved after 250µg/mL capturing antibodies concentration (inset
fig.S10). Control experiment is also performed in absence of SEB and revealing antibody and
baseline current is recorded. Finally, 250µg/mL capturing antibodies concentration is optimized
and used as such throughout the experiments.
12. Determination of the amount of rabbit anti-SEB IgG (capturing antibodies) present and its
confirmatory binding in the [MWCNTs-Ch-Au NPs-CAb] bionanoconjugates
Figure S11. Shows the SDS-PAGE gel image of different batches of [MWCNTs-Ch-Au NPs-
CAb] bionanoconjugates
For the determination of amount of rabbit anti-SEB IgG bound with MWCNTs-Ch-Au
NPs nanocomposite, standard solution of BSA (1μg/μL) was prepared and standard curve was
plotted using BCA-protein estimation method as shown in fig.S7(a). We had obtained
0.145μg/μL concentration of protein i.e. rabbit anti-SEB antibody present in the GR-Ch-AuNPs-
capturing antibody conjugates. Since, 0.725μg of rabbit anti-SEB antibody was present in 5μL of
the MWCNTs-Ch-AuNPs-CAb bionanoconjugates which was the final amount used in the
electrochemical immunoassay of SEB for the experiments.
SDS-PAGE is also done for the above prepared batches of [MWCNTs-Ch-Au NPs-
CAb] bionanoconjugates. The band of heavy and light chain for unbound or extra capturing

14
antibodies is appeared in a4 and a5 lane in the obtained gel image (fig.S11) which confirms that
these unbound antibodies were detached during washing step and does not play any significant
role in the immunosensing of SEB.
13. Optimization of the amount of rabbit anti-SEB IgG (capturing antibodies) in the
[MWCNTs-Ch-Au NPs-CAb] bionanoconjugates for immunosensing of SEB
Figure S12. SWV obtained for immunosensing of 50ng/mL SEB at different concentrations (50,
100, 150, 200 and 250µg/mL) of rabbit anti-SEB polyclonal IgG [CAb] in their [MWCNTs-Ch-
Au NPs-CAb] bionanoconjugates
Different batches of capturing antibodies [MWCNTs-Ch-AuNPs-CAb]
bionanoconjugates were prepared at different concentrations (50, 100, 150, 200 and 250µg/mL)
of rabbit anti-SEB polyclonal IgG under a fixed amount of MWCNTs-Ch-Au NPs
nanocomposite (1mL). The amount of capturing antibodies attached to MWCNTs-Ch-Au NPs
nanocomposite was optimized by SWV and BCA-method. The SWV experiment is performed
for the immunosensing of 50ng/mL SEB using different batches of [MWCNTs-Ch-Au NPs-
CAb] immobilized GCE independently for three times (fig.S12). The obtained peak current is
increased with increasing the concentration of capturing antibodies and saturation is achieved
after 150µg/mL capturing antibodies concentration (inset fig.S12). Control experiment is also
performed in absence of SEB and revealing antibody and baseline current is recorded. Finally,

15
150µg/mL capturing antibodies concentration is optimized and used in the subsequent
experiments.
14. Cyclic voltammetric characteristics of ferrocene-based immunosensor
(a) (b)
Figure S13. (a) Cyclic voltammograms at different scan rates for ferrocene carboxylic acid and
(b) is the cyclic voltammograms at different concentrations of SEB at [GR-Ch-Au NPs-CAb-
SEB-Fc-MAb] modified electrode at 50mV/s scan rate.
The key components in the immunosensor included the GR-Ch-Au NPs-CAb and
MWCNTs-Ch-Au NPs-CAb biofilm that fix the SEB toxin on GCE surface and the Ferrocene-
labeled antibody for signal generation. The electrochemical properties of Fc-MAb for SEB
detection in PBS were investigated with cyclic voltammetric measurements. When the sandwich
format reaction was completed, a pair of stable and well-defined redox peaks (Figure S13b)
could be observed at the [GR-Ch-Au NPs-CAb-SEB-Fc-MAb] modified electrode which may
recommend the efficient electrochemical activity of the ferrocene–mice anti-SEB IgG
bioconjugate labels. Since, there is fine electron communication between the ferrocene moieties
and the modified GC-electrode. However, no peaks could be found in the control experiments
(i.e. without SEB). By exploiting the unique structure and electronic properties of ferrocene, a
specific target antigen can be sensitively detected. Additionally, the cyclic voltammograms is
varied at different scan rates (Figure S13a), which corresponded to the oxidation of the ferrocene
moiety into the ferricinium cation [Dou et al., 2012]. In addition, both the anodic and cathodic

16
peak currents increased linearly with the square root of the scan rate within the range from 1 to
100mV/s (inset of Figure S13a), which confirmed the diffusion-controlled nature of the redox
species in this process. We observed the charge transfer mechanism in our present system which
may be due to the flexibility of the ferrocene moieties on the [GR-Ch-Au NPs-CAb-SEB-Fc-
MAb] immunocomplex. This immunocomplex may physically impinge the ferrocene moieties
on the electrode surface and provide a sufficiently high current signal [Lu et al., 2012].
15. References:
[1] J. Li, J.D. Qiu, J.J. Xu, H.Y. Chen, X.H. Xia, The synergistic effect of prussian-blue-grafted
carbon nanotube/poly(4-vinylpyridine) composites for amperometric sensing, Adv. Funct. Mater.
17 (2007) 1574–1580.
[2] Mohammed Khenfouch, Mimouna Baïtoul, Hassane Aarab, Malek Maaza, Morphological,
Vibrational and Thermal Properties of Confined Graphene Nanosheets in an Individual
Polymeric Nanochannel by Electrospinning. Graphene, 2012, 1, 15-20.
[3] Krishna Rao K.S.V., Vijaya Kumar Naidu B., Subha M.C.S., Sairam M., Aminabhavi T.M.,
2006, Novel chitosan-based pH-sensitive interpenetrating network microgels for the controlled
release of cefadroxil, Carbohydrate Polymers, 66, 333–344.
[4] Brych SR1, Gokarn YR, Hultgen H, Stevenson RJ, Rajan R, Matsumura M., J Pharm Sci.
2010 Feb;99(2):764-81. doi: 10.1002/jps.21868.
[5] Krimm & Bandekar Adv Protein Chem 1986;38:181-364.
[6] Dou, Y. H., Haswell, S. J., Greenman, J. & Wadhawan, J. Voltammetric immunoassay for the
detection of protein biomarkers. Electroanalysis 24, 264–272 (2012).
[7] Lu, N., Pei, H., Ge, Z. L., Simmons, C. R., Yan, H. & Fan, C. H. Charge transport within a
three-dimensional DNA nanostructure framework. J. Am. Chem. Soc. 134, 13148–13151 (2012).