supplementary information - nature · ils were stored under an inert atmosphere and baked at 80 °c...
TRANSCRIPT

Supplementary Methods
I. Chemicals and materials.
Inorganic salts: LiCl (ultra dry, 99.9%, metal basis, Alfa Aesar), LiBr (99+%, anhydrous, Strem),
LiI (ultra-dry, 99.999%, metal basis, Alfa Aesar), NaCl (puratronic, 99.999%, metal basis, Alfa Aesar),
KCl (99.999%, trace metal basis, Aldrich), KBr (FTIR grade, Alfa Aesar), KI (ultra dry, 99.998%, Alfa
Aesar), CsBr (99.999%, metal basis, Alfa Aesar), ZnCl2 (anhydrous powder, 99.995+%, metal basis,
Aldrich), AlCl3 (99.99%, trace metal basis, Aldrich), AlBr3 (extra pure, 98+%, anhydrous, ACROS),
NaSCN (≥99.99%, trace metal basis, Aldrich), KSCN (ACS reagent, ≥99.0%, Aldrich), LiNO3
(anhydrous, 99%, Alfa Aesar), NaNO3 (ACS, 99% min, Alfa Aesar), NaNO2 (99.999%, metal basis,
Alfa Aesar), KNO3 (ReagentPlus, ≥99.0%, Aldrich), CsNO3 (99.8%, metal basis, Alfa Aesar),
Ca(NO3)2∙4H2O (≥99.0%, Aldrich). AlCl3 was purified by sublimation in a N2-filled glove box (sub-1
ppm O2 and H2O) prior to use. NaSCN and KSCN were dried under vacuum according to reported
protocols1. Anhydrous Ca(NO3)2 was obtained by the dehydration of Ca(NO3)2∙4H2O2. Other nitrates
and NaNO2 were dried in a vacuum oven at about 150 °C prior to use2,3. The eutectic nitrate or
nitrate/nitrite salts can also be prepared in the way described by Cordaro et al.4. Cautious: Most of the
salts used in this work are highly hygroscopic and should be kept and handled in a N2-filled glovebox.
Molten inorganic salts with various compositions (Extended Data Table 1) were prepared by hand-
grinding, followed by heating at temperatures slightly above the melting points of the molten mixtures.
Ionic liquids (ILs): 1-butyl-3-methylimidazolium chloride ([BMIM]+Cl–, 98%), 1-butyl-3-
methylimidazolium tetrafluoroborate ([BMIM]+BF4–, 98%), 1-ethyl-3-methylimidazolium ethylsulfate
([EMIM]+[EtSO4]–, 98%), 1-butyl-3-methylimidazolium octylsulfate ([BMIM]+[OctSO4]
–, 98%),
trihexyl(tetradecyl)phosphonium bis(2,4,4-trimethylpentyl)phosphinate (P+P–, min. 95%) were
purchased from Strem. 1-butyl-3-methyl iodide ([BMIM]+I–, 99%) was purchased from Aldrich. All
ILs were stored under an inert atmosphere and baked at 80 °C under vacuum for 24 h prior to use.
Metal alloys: Gallium–Indium eutectic (Ga–In, Ga0.755In0.245 (weight ratio), melting point ~ 15 °C,
99.99%, trace metal basis, Aldrich), Wood’s alloy (Bi0.5Pb0.267Sn0.133Cd0.1 (weight ratio), melting point
~ 70 °C, stick, Aldrich) were used as received.
WWW.NATURE.COM/NATURE | 1
SUPPLEMENTARY INFORMATIONdoi:10.1038/nature21041
Organic solvents and organic ligands: Tri-n-octylphosphine oxide (TOPO, 99%), oleic acid (OA,
90%), oleylamine (OLA, 70%), N,N-dimethylformamide (DMF, anhydrous, 99.8%), toluene
(anhydrous, ≥99.8%), acetonitrile (anhydrous, ≥99.8%), acetone (≥99.5%), methanol (anhydrous,
99.8%), ethanol (anhydrous, 200 proof, ≥99.5%), diethyl ether (anhydrous, ≥99.0%), tetrahydrofuran
(THF, anhydrous, ≥99.9%), hexane (anhydrous, 95%), octane (anhydrous, ≥99%), decane (anhydrous,
≥99%), heptadecane (99%), dichloromethane (CH2Cl2, ≥99.9%) were purchased from Sigma Aldrich.
Tri-n-octylphosphine (TOP, 97%) and N-methylformamide (NMF, 99%) were purchased from Alfa
Aesar. OA, OLA, heptadecane, and NMF were dried prior to use in the glovebox.
II. Syntheses of nanocrystals capped by coordinating organic ligands.
Nanocrystal (NC) syntheses were performed according to reported protocols using conventional
air-free techniques including Schlenk line and N2-filled glovebox. Pt NCs (mean size about 5.5 nm)5,
Pd NCs (4.0 nm)6, FePt NCs (3.5 nm)7, Fe3O4 NCs (about 20 nm)8, InP NCs (3.5 nm)9,10, CdSe NCs
(wurtzite, 4 nm)11, and alpha-NaYF4:Yb,Er@CaF2 upconverting nanoparticles (UCNPs, about 23 nm)12
were synthesized. CdSe/CdZnS core/shell quantum dots (QDs, about 6 nm, capped with phosphonic
acid or carboxylic acid ligands) were provided by QD Vision, Inc.
WWW.NATURE.COM/NATURE | 2
SUPPLEMENTARY INFORMATIONRESEARCHdoi:10.1038/nature21041

Supplementary Discussions
I. Continuum theory for interacting surfaces in molten salts.
In this section we introduce a phenomenological theory to explain the colloidal stability observed in
suspensions of various nanocrystals in inorganic molten salts. We use this phenomenological theory to
predict and rationalize the layering seen in simulations purely in terms of physical interactions
ubiquitous in both inorganic molten salts and organic room temperature ionic liquids: short-range steric
(present in all liquids13) and long-range electrostatic (Coulomb) interactions between ions. Such a
phenomenological theory has been used successfully to describe experimentally observed capacitive
transitions at electrode-room temperature ionic liquid interfaces14,15. But to our knowledge, this is the
first instance of its application to colloidal interactions in inorganic molten salts.
In the traditional Derjaguin–Landau–Verwey–Overbeek (DLVO) theory of interactions between
colloidal particles, double-layer or electrostatic forces lead to a repulsion between charged surfaces in a
solution16. Due to the high density of ions in a molten salt, the electrostatic forces between charged
surfaces are expected to be screened out over very short distances 15. The colloidal particles are
therefore expected to aggregate because of attractive van der Waals or solute-mediated interactions.
Fluctuation mediated critical Casimir-like forces between surfaces are also usually attractive (and
strongly sensitive to temperature)17.
Here we show that colloidal stabilization in molten salts can be explained by interactions not
accounted within DLVO theory. We consider a scenario where surface-induced ordering or layering in
the molten salt18,19 contributes to the colloidal stability, as observed both in experiments and
simulations. Such layering is expected to be pronounced and extend a long distance into the bulk if the
salt is reasonably close to its crystallization temperature. In addition to surface-induced layering,
interionic correlations can extend the effective screening length in highly concentrated electrolytes,20-22
which may also contribute to colloidal stabilization in molten inorganic salts. In the following, we
present our calculation for the free energy of interaction between two planar, infinite surfaces in an
inorganic molten salt from a continuum Ginzburg-Landau theory perspective, taking into account both
the short-range steric and long-range electrostatic interactions23. We first derive the oscillatory
interaction energy (per unit area) between a pair of symmetric, parallel surfaces. We then show that a
relative tilt between the two surfaces can lead to a repulsive free energy profile superimposed on the
oscillatory profile. Such a tilt is important to account for faceting, curvature, and also surface roughness
on real nanocrystal (NC) surfaces. The effects of curvature, faceting and roughness are expected to
frustrate the layering and attenuate the oscillations in free energy. But it still maintains large repulsive
WWW.NATURE.COM/NATURE | 3
SUPPLEMENTARY INFORMATIONRESEARCHdoi:10.1038/nature21041

barriers between two approaching NCs, as shown in our simulations. Finally, the force between two
plane surfaces can be generalized to that between two finite, spherical colloidal particles by using the
Derjaguin approximation. It is important to note that this theory is general for investigating the
interactions between particles in a solvent composed solely of ions, including colloidal NCs in
inorganic molten salts. As an example, we choose CdSe NCs in molten KCl and analyze their
interactions using this theory.
1. Approximate continuum Hamiltonian for density ordering.
The layering of ions normal to a flat nanocrystal (NC) surface (yz-plane) can be described using a
Ginzburg-Landau model for the free energy above the critical temperature. The bulk free energy of the
system (per unit area) including the effect of long-range interactions in the solvent is24,
𝐹[𝜓(𝑥)] = ∫ 𝑑𝑥 [𝐵(∇𝜓(𝑥))2
+ 𝑏𝜓2(𝑥) + 𝜓(𝑥) ⋅ ∫ 𝑑𝑥′𝑉(𝑥 − 𝑥′)𝜓(𝑥′)] (1)
In Eq. (1), ψ(x) is the local charge density of the solvent expressed as the difference in number
density of cations and anions normalized by the total number density of salt ions, ns: 𝜓(𝑥) ≡ (𝑛+(𝑥) −
𝑛−(𝑥))/𝑛𝑠. B & b are phenomenological parameters in the theory corresponding to short-range
interactions and entropy. 𝑉(𝑥 − 𝑥′) = (𝑒2𝑛𝑠2/𝜖𝜖0) |𝑥 − 𝑥′| is the long-range effective Coulomb
interaction between ions in the solvent at positions, x and 𝑥′ (the problem is effectively one-
dimensional as the density profile varies in the x-direction alone for infinite surfaces in the yz-plane),
where e is the unit charge (on each monovalent ion), ε0 and ε are the permittivity of free space and the
relative permittivity of the solvent medium (KCl in this case). The free energy F[ψ(x)] in Eq. (1) is the
effective one-dimensional Hamiltonian for describing the molten salt. We ignore the ψ(x)4 and higher
order terms because the molten salt (KCl) is above its bulk melting temperature and is a disordered
liquid far from the colloidal interface. The effect of long-range interactions is simplified in Fourier-
space. By expanding around the wave-vector, q0, at which the free energy is minimized, the free energy
of Eq. (1) can be approximated as,
𝐹[𝜓(𝑥)] ≃|𝑏|𝑙𝑐
2
8𝑞02 ∫ 𝑑𝑥 [((∇2 + 𝑞0
2)𝜓(𝑥))2
+ 4𝑞02𝑙𝑐
−2𝜓2(𝑥)] (2)
where q0 is the preferred wavenumber of layering and 𝑙𝑐, the decay length of the layering, is related
to the Ginzburg-Landau correlation length (√𝐵/|𝑏|). The preferred wavenumber of layering is given
by15, q0 = (1/ lc ls )1/2, where lc can be of order of several nanometers (nm), and ls is the Debye screening
length (within the Debye-Hückel theory applicable to dilute electrolytes), which is around 0.1 nm
(comparable to ionic radius) in inorganic molten salts. The wavelength of ordering can then be a few
WWW.NATURE.COM/NATURE | 4
SUPPLEMENTARY INFORMATIONRESEARCHdoi:10.1038/nature21041

angstroms which is about one ionic layer thick as expected. The solvent can thus exhibit layering up to
a long length-scale (much longer than the classical Debye screening length) as a result of the
competition between steric and Coulomb interactions. Indeed, estimates of the screening length
obtained by analyzing the poles of the structure factor are much larger than the Debye length (even in
the Gaussian approximation used here).
Such an effective Hamiltonian has been used to describe a variety of materials whose ordering is
governed by a competition between short- and long-range interactions24 – for example, magnetic films,
diblock copolymers, Langmuir monolayers, and more recently, ionic liquids14,15,25 – and the
corresponding phase diagram has been extensively studied and characterized23,26. This is richer than
that for a simple liquid: as the temperature is lowered towards the bulk ordering temperature, the liquid
can go from being disordered to an intermediate regime characterized by local structural order before
long-range crystalline order is established. In Eq. (2), we consider the molten salt to be above its
ordering temperature, so that while the bulk is disordered, a nanocrystal surface can template local
order in its vicinity24,27.
An Euler-Lagrange minimization of this Hamiltonian in the bulk results in a fourth-order linear
differential equation that can be solved analytically,
𝑑4𝜓
𝑑𝑥4 + 2𝑞02 𝑑2𝜓
𝑑𝑥2 + 𝑞02. (𝑞0
2 + 4𝑙𝑐−2)𝜓(𝑥) =0 (3)
With the appropriate surface boundary condition (determined by the chemical interaction of the surface
with ions) and charge neutrality conditions, one can solve the charge density profile, ψ(x). An
approximate solution for ψ(x) induced by one surface that satisfies a simple boundary condition that a
fixed number of anions bind to the surface, 𝜓(0) = 𝜓0, and global charge neutrality, is given by
𝜓(𝑥) = 𝜓0 sec(𝜙) 𝑒−𝑥/𝑙𝑐cos (𝑞0𝑥 + 𝜙) (4)
where 𝜓0 is the ion density at the surface fixed by the strong surface-binding affinity. The phase,
𝜙 = tan−1( 1/(𝑞0𝑙𝑐)), ensures charge neutrality in the bulk of the solvent. This form of the charge
density arises since the NC (e.g., Cd-terminated CdSe NCs) surface has a strong preference for one
type of ions (i.e., Cl−) in the melt, which in turn leads to successive alternating layers of cations and
anions (with wavenumber 𝑞0) decaying with distance from the surface (with a range of 𝑙𝑐).
2. Density order and free energy in two-surface geometry.
Having solved the charge density ordering near one surface, we now solve for the corresponding
order between two surfaces. This can be used to calculate a free energy profile for the interaction
WWW.NATURE.COM/NATURE | 5
SUPPLEMENTARY INFORMATIONRESEARCHdoi:10.1038/nature21041

between two NC surfaces as a function of their distance of separation. Colloidal stability may result
from large barriers (compared to kBT) in this free energy landscape.
1) Parallel surfaces. The Euler-Lagrange differential equation, Eq. (3) corresponds to the approximate
model Hamiltonian that describes the competition between short- and long-range interactions (Eq. (2)).
It is analytically solvable and can be generalized easily to the case where there are two symmetric
surfaces in parallel (located at x = L and x = −L) that induce order as,
𝜓∥(𝑥) = 𝜓1𝑐𝑜𝑠(𝑞0𝑥)𝑐𝑜𝑠ℎ (𝑥
𝑙𝑐) + 𝜓2𝑠𝑖𝑛(𝑞0𝑥)𝑠𝑖𝑛ℎ (
𝑥
𝑙𝑐) (5)
where the solution is symmetric about the mid-plane (x = 0) by construction and the two constants 𝜓1
and 𝜓2 are to be determined from two conditions: the surface boundary value and charge neutrality.
Fig. S1. Theoretical analysis of two symmetric parallel surfaces. (A) Free energy of interaction per
unit area of two parallel plane surfaces (expressed as a ratio of the phenomenological energy scale
(𝐹0 ∼ 𝑏𝑙𝑐𝜓02) as a function of the distance of separation (D) between them, expressed in units of the
correlation length lc (around 1 nm). The wavenumber of layering, q0 = (1/ lc ls )1/2 is estimated to be 10
nm−1, (wavelength of layering in KCl ~ 6 Å). An estimation of the energy scale for 𝐹0 is available on
Page S11 and from the simulation result (Fig. S8A). Charge density profiles, ψ(x), corresponding to a
free energy (B) maximum and (C) minimum. This illustrates that configurations where an integer
number of layers can be fit in between two surfaces are energetically favorable.
WWW.NATURE.COM/NATURE | 6
SUPPLEMENTARY INFORMATIONRESEARCHdoi:10.1038/nature21041

The charge neutral symmetric solution in Eq. (5) can be reduced to the simplified, intuitive form
when the separation between the surfaces, D = 2L , is large,
𝜓∥(𝑥) = 𝜓0[exp [−𝐿−𝑥
𝑙𝑐] cos(𝑞0(𝐿 − 𝑥) + 𝜙) + exp [−
𝐿+𝑥
𝑙𝑐] cos(𝑞0(𝐿 + 𝑥) + 𝜙) ] (6)
where the pre-factor, 𝜓0, is determined from the surface boundary condition. This solution is simply
interpreted as the superposition of two single-surface solutions originating from x = L and x = −L
respectively with equal weight (since the surfaces are identical). We use this simpler expression to plot
the symmetric density profile in Fig. S1, and calculate the total free energy by inserting the expression
in Eq. (6) into Eq. (1),
𝐹∥(𝐷) ≃ − (1
2) 𝑏𝑙𝑐𝜓0
2 ⋅ 𝑒−
𝐷
𝑙𝑐cos (𝑞0𝐷 + 𝜙) (7)
2) Tilted surfaces.
Our simulations show that there is an exponentially decaying repulsive component over and above
the oscillatory features in the free energy, particularly apparent in the 20° tilted plates (Figs. 3e &S8B).
This is related to the large energy cost of removing the last few remaining ionic layers as the two NC
surfaces approach very close to each other28. A qualitative way of understanding this repulsion in terms
of the phenomenological theory is presented here.
An obvious effect of tilting one surface with respect to the other is that the separation between the
two plates is different at different positions, leading to an averaging out of the oscillatory interactions
to some extent. By integrating Eq. (7) over the range of separation: 𝐷𝑚𝑎𝑥 − 𝐷𝑚𝑖𝑛 = 𝑙𝑝𝑠𝑖𝑛𝜃, where 𝑙𝑝 is
the size of the plate (corresponding to the size of the NC facet) and 𝜃 is the angle of tilt, one can obtain
the factor by which the oscillations are attenuated: for large facet areas and/or large angles of tilt, the
oscillations are averaged out to a large extent and an approximate form for the attenuation factor is 𝜂 ∼
𝑞0𝑙𝑝𝑠𝑖𝑛𝜃, whereas for small plates tilted at small angles, i.e., in the limit 𝑙𝑝𝑠𝑖𝑛𝜃 ≪ 𝑙𝑐, the attenuation
factor scales as 𝜂 ∼ 1 + 𝑙𝑝𝑠𝑖𝑛𝜃/𝑙𝑐. We indeed see an attenuation in the free energy oscillations in the
simulation results for plates tilted at larger angles (Fig. S8B). However, for NCs of small size, such as
used in this experiment, and strong surface-induced layering (i.e., high energy peaks), the attenuation is
not strong enough to completely wash out these oscillatory features (Fig. S8B).
When one of the order-inducing surfaces is tilted with respect to the other, the order is induced
along different axes (See cartoon in Fig. S2A). This can be analyzed as an effective one-dimensional
problem by considering variations of the charge density along the x-axis, assuming the two surfaces
induce different effective layering wavenumbers, ql and qr, respectively, where 𝑞𝑙 = 𝑞𝑟 𝑐𝑜𝑠𝜃. The
WWW.NATURE.COM/NATURE | 7
SUPPLEMENTARY INFORMATIONRESEARCHdoi:10.1038/nature21041
S9
density profile can be approximately calculated by superposing the one-surface solutions from the left
and the right,
𝜓𝑡𝑖𝑙𝑡(𝑥) = 𝜓0[exp [−𝐿−𝑥
𝑙𝑐] cos(𝑞𝑟(𝐿 − 𝑥) + 𝜙𝑟) + exp [−
𝐿+𝑥
𝑙𝑐] cos(𝑞𝑙(𝐿 + 𝑥) + 𝜙𝑙)] (8)
where the asymmetry between the surfaces leads to different preferred wavelength of order induced by
left and right surfaces. We expect this Ansatz to be more accurate when the plate separation, D = 2L, is
significantly larger than the correlation length, lc.
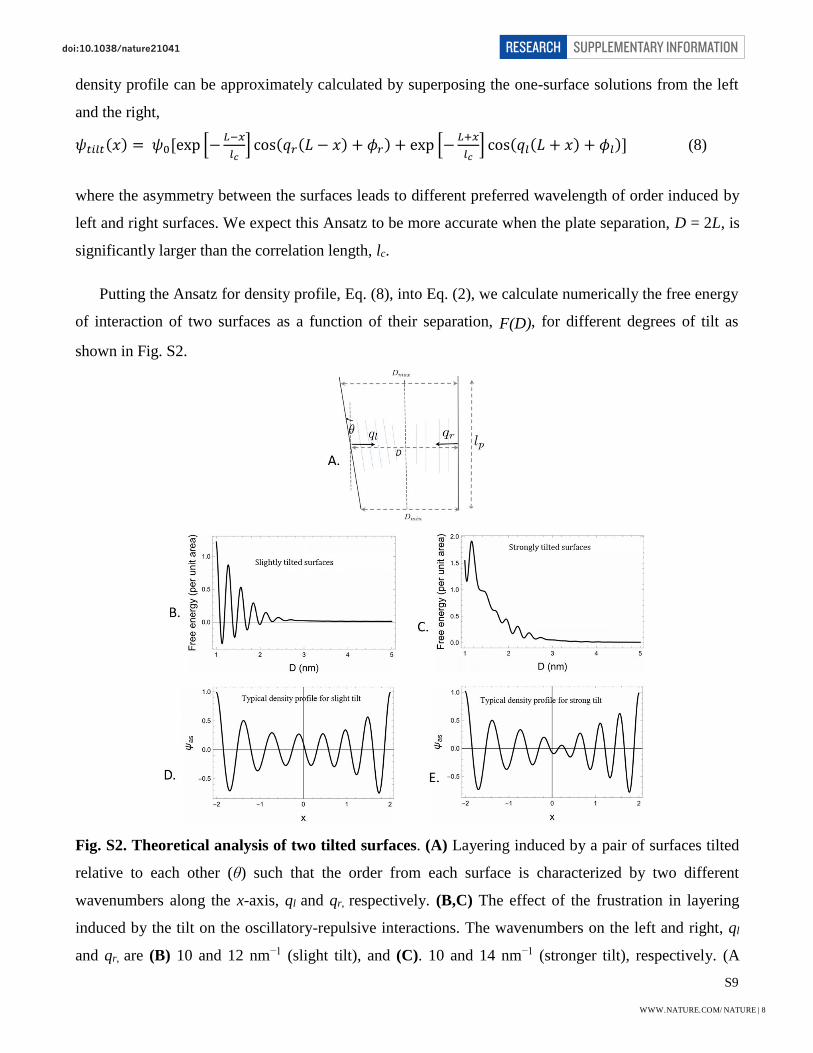
Putting the Ansatz for density profile, Eq. (8), into Eq. (2), we calculate numerically the free energy
of interaction of two surfaces as a function of their separation, F(D), for different degrees of tilt as
shown in Fig. S2.
Fig. S2. Theoretical analysis of two tilted surfaces. (A) Layering induced by a pair of surfaces tilted
relative to each other (θ) such that the order from each surface is characterized by two different
wavenumbers along the x-axis, ql and qr, respectively. (B,C) The effect of the frustration in layering
induced by the tilt on the oscillatory-repulsive interactions. The wavenumbers on the left and right, ql
and qr, are (B) 10 and 12 nm−1 (slight tilt), and (C). 10 and 14 nm−1 (stronger tilt), respectively. (A
WWW.NATURE.COM/NATURE | 8
SUPPLEMENTARY INFORMATIONRESEARCHdoi:10.1038/nature21041

wavenumber of 10 nm−1 corresponds roughly to layering in KCl.) All lengths in the plots are in terms of
the correlation length, lc = 1 nm, and the energy scale is 𝐹0 ∼ 𝑏𝑙𝑐𝜓02, the same as in the case of parallel
surfaces. The corresponding charge density profiles, ψ(x), at a plate separation given by L = 2, for (D)
the small angle tilted and (E) large angle tilted cases, respectively.
The relative tilt between the ordering from the right and left surfaces (Fig. S2A) is reminiscent of a
grain boundary in a crystalline ordered phase. The creation of a grain boundary, which is a defect in the
ordering, requires a positive free energy cost. The energy cost increases with the tilt angle29 as has been
shown in the context of defects in lamellar ordering in block copolymers30. The two surfaces would
therefore tend to move away from each other to reduce this free energy cost (which scales as square of
the amplitude of order parameter), therefore resulting in an effective repulsion. We expect this
repulsive free energy cost to scale as, 𝐹𝑡𝑖𝑙𝑡(𝐷, 𝜃) ∼ 𝐹0𝑒−
𝐷
𝑙𝑐(𝑙𝑐𝑞0)−1𝜃2.
To summarize, the interaction between two parallel flat surfaces is a decaying and oscillatory
function of their distance of separation (D), being minimized at the special separations where
commensurate layering can occur, i.e., an integer number of ionic layers can fit in between the two
plates. On top of this, there are repulsive interactions between two tilted plates which is an effective
function of the angle of tilt (θ). The total free energy of interaction between two mutually tilted flat
surfaces, for a small angle of tilt, can then be captured by the following semi-empirical expression
where the effect of the tilt is taken into account
𝐹(𝐷, 𝜃) = 𝐹∥(𝐷) + 𝐹𝑡𝑖𝑙𝑡(𝐷, 𝜃) ∼ 𝐹0𝑒−𝐷/𝑙𝑐(cos(𝑞0𝐷) + 𝑓(𝜃)), (9)
where 𝑓(𝜃) ∼ (𝑞0𝑙𝑐)−1𝜃2 is the tilt-dependent repulsive part (square of angle of tilt for small angles
since the direction of tilt is unimportant).
3) Curved surfaces.
Given the detailed results for interactions of flat surfaces (parallel or tilted) from both continuum
theory and atomistic simulations, we now generalize them to spherical NCs. The approximation
developed by Derjaguin is commonly used to calculate the force of interaction between curved
surfaces28, given a theoretical expression for free energy of interaction between flat surfaces. We
outline this procedure in its most standard form and then adapt it to the free energy for the oscillatory
tilt-dependent interactions in molten salts. The interaction between two identical spheres (of radius R)
WWW.NATURE.COM/NATURE | 9
SUPPLEMENTARY INFORMATIONRESEARCHdoi:10.1038/nature21041

separated by a distance D is calculated by integrating over ring-like circular surface elements of
thickness dr and area 2πrdr. The relevant geometry is sketched in Fig. S3A. The distance between rings
at position r is given by, z(r) = D+2R(1−cos(θ)) ∼ D+r2/R. When D < R, the effective interaction
between the spheres can then be written as,
𝑉𝑒(𝐷) = 2 𝜋 ∫ 𝐹(𝑧)𝑟𝑑𝑟 = 𝜋𝑅 ∫ 𝐹(𝑧)𝑑𝑧∞
𝐷
∞
0 (10)
where F(z) is the interaction energy of a circular surface element with the opposite surface, assumed to
be locally flat. The above analysis can be applied directly to the interaction between parallel surfaces.
With necessary integrals, we get,
𝑉∥(𝐷) = 𝜋𝑅 ∫ 𝐹∥(𝑧)𝑑𝑧 =𝜋𝑅𝐹0
(𝑞02+𝑙𝑐
−2)1/2 𝑒−𝐷/𝑙𝑐
∞
𝐷 cos (𝑞0𝐷) (11)
which for rapidly oscillatory interactions, 𝑞0 ≫ 𝑙𝑐−1, simplifies to: 𝑉∥(𝐷) ≃ 𝜋𝑅𝑞0
−1𝐹∥(𝐷).
The above form of the approximation is appropriate for the typical layering/solvent structuring
interactions between colloids. However, DLVO forces, electrostatic or van der Waals, depend only on
the distance of separation of the surfaces and their area. To compare the layering force with the DLVO
forces, we have to modify this procedure to effectively account for the tilt. We integrate over the same
circular surface elements shown in Fig. S3A, bearing in mind that the average angle of tilt in each
circle is θ, being related to the distance of separation as, z(θ) = D + 2R (1−cos2 θ) D + Rθ2, for small
angles. The total interaction energy is then found by performing the integral of Ftilt introduced in Eq.
(9) over these surface elements as,
𝑉𝑡𝑖𝑙𝑡(𝐷) = 2𝜋𝐹0 ∫ 𝑒−𝑧/𝑙𝑐 𝜃2 𝑟 𝑑𝑟 ≃ 𝜋𝑙𝑐2𝐹0𝑒−𝐷/𝑙𝑐
∞
0(12)
The contribution to the free energy of interaction from the tilt, scales differently (and with a lower
power) with R than the interaction between parallel surfaces. The physical meaning of this is apparent
when we write the total effective energy of interaction between spherical surfaces by combining Eq.
(11) and (12), as:
𝑉𝑒(𝐷) ≃ 𝜋𝑅𝑙𝑐 𝐹0𝑒−𝐷/𝑙𝑐(cos (q0𝐷) + 𝑙𝑐/𝑅) (13)
Eq. (13) shows that the oscillatory (and symmetric) interactions between parallel surfaces become
more pronounced as R is increased, i.e., the surfaces approach the flat limit, while the repulsive
component increases when R is small, as now the surface elements sample greater tilt angles. This R-
dependence is as per our physical expectations and is illustrated in Fig. S3B. Note the free energy (in
kBT) in Fig. S3B was estimated from the free energy per unit area, F0, as described below. We also
compare the typical DLVO forces (See more details in the estimation of DLVO forces in the Appendix)
WWW.NATURE.COM/NATURE | 10
SUPPLEMENTARY INFORMATIONRESEARCHdoi:10.1038/nature21041

with the layering interactions for a typical spherical particle (4 nm diameter) used in experiment in Fig.
S3C. The dependence of the colloidal interactions on the size of the colloidal nanoparticles suggested
in Eq. (13) would be interesting to probe in subsequent experiments. Particularly, kinetic trapping by
large oscillatory barriers may become increasingly relevant for larger colloidal particles where the
repulsive component becomes relatively smaller.
A
B
D (nm)
F (
kBT
)
C
D (nm)
F (
kBT
)
Fig. S3. Theoretical analysis of two curved surfaces. (A) Relevant geometry for Derjaguin
approximation. (B) Free energy of layering as a function of the distance of separation (D) between two
spherical particles, calculated from the simplified expression given in Eq. (13) for parameter values in
the free energy scale, 𝐹0 ∼ 𝑏𝑙𝑐𝜓02, estimated from simulation (Fig. S8A) to be about 20 kBT/nm2. This
illustrates that the repulsive interactions become more important relative to the oscillatory interactions
for smaller particle radius. (C) Layering/solvation interaction between spherical particles (4 nm in
diameter) compared to DLVO interactions. Note that DLVO forces become significant enough
compared to the layering forces only at very short sub-nm separations. This is also shown explicitly for
a 10 nm diameter quasi-sphere from simulations (Fig. 3f in the Main Text).
Estimate for energy scale The free energy (per unit area) scale, 𝐹0 ∼ 𝑏 𝑙𝑐𝜓02, is in terms of
phenomenological parameters that need to be determined from experiment or a more microscopic
WWW.NATURE.COM/NATURE | 11
SUPPLEMENTARY INFORMATIONRESEARCHdoi:10.1038/nature21041

theory. However, an estimate for the free energy scale can be made by relating the coarse-grained
parameters to a picture of particles on a lattice: 𝑏 ∼ 𝑘𝐵𝑇/𝑎3, where a is the lattice constant related to
the size of the ions in molten salt (a ~ 5 Å). The ionic density, ns, is related to the lattice constant, 𝑛𝑠 ∼
1/𝑎3. Assuming lc ~ 1 nm and a strong binding to the surface, ψ0 = 1, we get a free energy scale of 10
kBT/nm2. Using this on a 2×2 nm NC surface, and the expression for interaction energy versus distance
between parallel plates in Eq. (7), we estimate an interaction energy of the order of 10 kBT at a
separation of about 1 nm comparable to the energy scale seen in the simulations of flat surfaces (Fig.
S8A).
II. Molecular dynamics (MD) simulations of CdSe NCs in molten KCl.
In addition to the analysis with continuum Ginzburg-Landau theory, we ran MD simulations of
CdSe NCs in KCl solvent31. The details for MD simulations are included in the Appendix. Along the
same lines as the theory discussed above, we start our MD simulations by considering ion layering
around a single CdSe NC surface. Then we simulate the interactions between two parallel surfaces in
molten salts, especially along the axis normal to NC surface. We generalize such interactions to two
tilted surfaces and finally quasi-spherical NCs. For comparison, we also run simulations of
structureless, or chemically inert, walls in molten KCl. There have been several reports on the influence
of molecular layering on forces between colloids and nanoparticles using continuum theory and MD
simulations in room temperature ionic liquids32. However, to the best of our knowledge, there has been
no quantitative theoretical studies for the forces between colloids induced by an inorganic molten salt.
In general, solid surfaces are expected to induce liquid density oscillations13,33. In densely charged
liquids, solid surfaces with surface charge are known to induce even longer range charge density
oscillations15,27. As expected, we observed robust layering of the K+ and Cl− ions near the surfaces of
the nanoparticles (normal to the NC surface: Fig. S4). In addition to ion layering in the direction
normal to the interface, significant in-plane ordering of K+ and Cl− ions was observed near the crystal
surface (Fig. S5C–F), because of a good match between the in-plane periodicity of the CdSe surface
and the diameters of ions in the molten salt. The in-plane correlation functions describe the statistically-
averaged, in-plane distances between particles and their neighbors. As in-plane ordering increases, the
peaks will become sharper and will decay less with distance. For example, a system with no in-plane
ordering will display a constant value for all separations, while a solid will have sharp peaks that
extend as far as desired without decay.
WWW.NATURE.COM/NATURE | 12
SUPPLEMENTARY INFORMATIONRESEARCHdoi:10.1038/nature21041

We quantified the net interaction between two rectangular cuboid zinc-blende CdSe NCs (hereon
referred to as “nanocubes”) of dimension 2.45×1.85×1.85 nm3 in solution along the axis normal to NC
surface using standard enhanced sampling techniques (specifically umbrella sampling)34-36. In addition,
we fit the charge density profile shown in Fig. S4 with the Ginzburg-Landau theory. In detail, we
extracted the length-scales, the correlation length (lc) and the oscillation frequency (q0) from the density
profile in Fig. S4 by fitting the expression for the charge density with Eq. (4). Using lc and q0, we were
able to find correspondence between simulation and theory using a two-parameter fit of Eq. (9) for the
amplitude, F0, and f(θ).
We focused on interactions between Cd-terminated CdSe [001] facets, but also collected data for
the interaction of a [001] Cd-terminated facet interacting with a [111] Cd-terminated facet; the
nanocube interactions were indistinguishable (Fig. S6). We conclude that the main effect here is
solvent layering along the surface normal, and that in-plane ordering effects due to surface atom
arrangement is less important. For simplicity, we fixed the orientation of the nanocubes, and only
allowed motion along one axis, which is normal to the NC surface.
Fig. S4. The chemical affinity between Cd-terminated [001] CdSe surface and Cl− induces charge
density oscillations in molten KCl. (Left) A snapshot of layering of ions around the [001] surface of a
CdSe nanocube (2.45×1.85×1.85 nm3); (Right) The simulated charge density as a function of the
distance away from CdSe surface (black dots) and the fit with Ginzburg-Landau theory (solid line);
note the first Cd-bound Cl− peak has been omitted from the charge density profile. Color code in the
snapshot: Orange: Cd, yellow: Se, green: K+, and blue: Cl−.
WWW.NATURE.COM/NATURE | 13
SUPPLEMENTARY INFORMATIONRESEARCHdoi:10.1038/nature21041

A BCl– K+
Cl− K+ Cl− K+
001 111
0 5 10 15 20 25
0
1
2
3
4 Cl-
K+
ρp
lan
e(r
)/ρ
pla
ne
0
Distance [Å]
0 5 10 15 20 25 30
0
1
2
3 Cl-
K+
ρpla
ne(r
)/ρ
pla
ne
0
Distance [Å]
001 111
001 001
B
C D
E F
Fig. S5. MD simulations of CdSe crystal in molten KCl. Snapshots of MD simulations showing the
distributions of (A) Cl− and (B) K+ ions near [001] surface of zinc-blende CdSe crystal. (C,D)
Snapshots of MD simulations and (E,F) in-plane density profiles showing significant in-plane ordering
in the first layer of Cl− and K+ ions near (C,E) the [001] surface and (D,F) the Cd-terminated [111]
surface of the zinc-blende CdSe crystal. Color code for the snapshots in (A–D): Blue: Cd; white: Se,
green: Cl−, red: K+.
WWW.NATURE.COM/NATURE | 14
SUPPLEMENTARY INFORMATIONRESEARCHdoi:10.1038/nature21041

Fig. S6. Simulated free energies of layering between two surfaces of CdSe nanocubes, [001]-[001]
(blue) and [001]-[111] (red), in molten KCl. The indistinguishable free energies of interactions
between different facets indicate the ion layering is the dominant factor.
Fig. S7. An example of parallel CdSe nanocubes in molten KCl and the corresponding charge
density profile. (Left) A snapshot of layering of ions between two [001] surfaces of CdSe nanocubes
(2.45×1.85×1.85 nm3); (Right) Simulated charge density as a function of the distance between two
surfaces; note the Cd-bound Cl− peaks have been omitted from the charge density profile. Color code in
the snapshot: Orange: Cd, yellow: Se, green: K+, and blue: Cl−. Here, the density profiles templated by
the nanocubes constructively interfere, and so this configuration is at a free energy trough. Note that the
bound layer of Cl− ions are not shown in the charge density profile.
WWW.NATURE.COM/NATURE | 15
SUPPLEMENTARY INFORMATIONRESEARCHdoi:10.1038/nature21041

Parallel nanocubes induced charge density oscillations in the KCl solvent which interfered at the
midplane when the nanocubes came close together (Fig. S7). The interference leads to a decaying,
oscillatory energy of interaction between nanocubes as a function of separation, D (Fig. S8A). If we
envision two nanocubes coming together along a shared surface normal, there will be certain distances
where the charge density templated by each cube align and reinforce (Figs. S8C,D). There will also be
certain distances where the charge densities will be perfectly anti-aligned, leading to destructive
interference of the charge density wave (Figs.S8E,F). Intuitively, destructive interference is
energetically costly because planes of like charges interact without screening. As seen in Figs. S8E,F,
the charge density at the midplane is near zero, indicating an equal mixture of charges, leading to a
strong, repulsive interaction between the planes of like charge adjacent to the midplane. As will be
discussed later, the high energy penalty for destructive interference leads to a unique phenomenology.
A decaying oscillatory interaction energy (Fig. S8A) will preclude nanocube flocculation since
particles cannot assemble closer than a certain separation where the free energy maximum (peak)
overpowers the thermal energy. However, such an energy profile also presents the possibility that
nanocubes might become kinetically trapped (also known as reversible coagulation28) in local minima
(e.g., point c in Fig. S8A). On the other hand, our simulations show that the colloidal stability can be
increased by introducing slight tilting. In detail, we introduced frustration into the system by varying
the nanocube surface normals. A relative tilt between nanocubes washes out the peaks and troughs of
the interaction energy to some extent. Two nanocubes with a relative tilt can be thought of as a linear
combination of many parallel plates at slightly different separations, since the effect of tilt is to
introduce a range of separations between the plates (see Fig. S2A). So the energy of interaction of two
tilted plates is just the average of the energies of many parallel plates at slightly different separations. A
larger relative tilt introduces a larger range of separations over which the average must be taken,
decreasing the oscillatory character of the interaction compared to that of the parallel case. Thus, a
purely repulsive interaction without much oscillatory character can be observed (Fig. S8B). Note there
is a significant difference in energy scales shown in Figs. S8A,B due to the diminishing oscillatory
contribution. Allowing rotations of the nanocubes in simulations would lead to additional repulsive free
energy beneficial for colloidal stability. This and other possibilities will be explored in future work.
WWW.NATURE.COM/NATURE | 16
SUPPLEMENTARY INFORMATIONRESEARCHdoi:10.1038/nature21041

Fig. S8. Simulated free energies of layering (blue dots with error range) for two parallel (A) and
tilted (B) nanocubes (2.45×1.85×1.85 nm3), and fit (solid lines) by the Ginzburg-Landau theory
with Coulomb interactions (Eq. (13)). (C–F) Simulated charge densities between two parallel
nanocubes located at troughs (C,D) and peaks (E,F) as marked in (A); the Cd-bound Cl− peaks have
been omitted from the charge density profiles. Note that constructively interfering charge density
profiles are low energy configurations and destructively interfering ones are high energy
configurations.
Real NCs typically have spheroidal shape truncated with various low-index planes. Thus, we use a
linear combination of differently tilted nanocubes as a first approximation to these spheroid NC facets
in the spirit of the Derjaguin approximation. There are a few important points to address with regards to
the approximation made here. In a real spheroidal NC, different facets have different surface
compositions. In our simulations, we only consider Cd-terminated facets. As mentioned above,
WWW.NATURE.COM/NATURE | 17
SUPPLEMENTARY INFORMATIONRESEARCHdoi:10.1038/nature21041

interactions between [001] and [111] facets are equivalent to those between [001] and [001] facets (Fig.
S6). Thus, we simplified the interactions between various Cd-terminated facets by replacing them with
[001]-[001] interactions. In addition, we will be combining parallel nanocube and small tilt angle
nanocube interactions only, which means we can treat these as interactions between flat plates, ignoring
all nanocube faces except for the closest ones. Informed by the geometry of a faceted spheroidal zinc-
blende CdSe NC, we show quasi-spheres formed from one parallel plate and four, six, or eight tilted
plates (e.g., there are four [111]-like and four [011]-like facets for each [001]-like facet), as shown in
Fig. S9. For CdSe NCs with a diameter of 10 nm (close to the upper limit of NC size used in our
experiments), we find that the troughs are significantly reduced, while the peaks remain high compared
to thermal energy (10–20 kBT) as the two NCs begin to approach within around 1 nm between the
closest facets. Such high energy peaks are estimated to be capable to provide long term colloidal
stability. These simulation results support our experimentally observed colloidal stability of NCs with
finite curvature in molten inorganic salts.
Fig. S9. Simulated free energy of layering between two quasi-spherical CdSe NCs (10 nm in
diameter) in molten KCl. The quasi-spheres are formed by one parallel facet and 4, 6, or 8 tilted
facets. Inset shows an example of quasi-spherical particle. The highlighted facets have four and six
adjacent tilted facets contributing to the repulsive force between NCs.
In all the above simulations, we chose a temperature of 1250 K because it is well above the
hysteresis loop for our molten salt model and still near the melting point of KCl (~1000 K). Note that
WWW.NATURE.COM/NATURE | 18
SUPPLEMENTARY INFORMATIONRESEARCHdoi:10.1038/nature21041

our molten salt model does not account for polarization fluctuations. However, we expect the above
results such as the layering effect and the charge density profile should be general for a wide range of
temperatures. In Fig. S10, we extract the density profiles near CdSe nanocubes at 1150 and 1200 K and
measured the correlation lengths and peak heights. Our theory predicts that the amplitude of the energy
of interaction should go as the square of the density at the NCs. Therefore these density profiles allow
us to predict how to scale the free energy profiles for systems at these temperatures (Table S1).
Fig. S10. Temperature dependence of charge ordering induced by CdSe nanocubes
(2.45×1.85×1.85 nm3) in molten KCl. Note the first Cd-bound Cl− peak has been omitted from each
charge density profile.
Table S1. Theory fits for CdSe nanocubes in molten KCl at various temperatures. F scaling indicates
the appropriate factor to scale the interaction energy at 1250 K in order to find the interaction energy
for a system at that temperature. The scaling is found simply by dividing the square of the amplitude, A
at the desired temperature by the square of the amplitude at 1250 K.
T (K) A (nm−3) lc (nm) q0 (nm−1) φ F scaling
1150 0.7454 0.496 15.3728 1.6758 1.139
1200 0.7161 0.4806 15.4125 1.6715 1.051
1250 0.6986 0.4783 15.3696 1.6673 1
lc: Ginzburg-Landau correlation length; q0: preferred wavenumber of layering; φ: phase shown in Eq.
(4); F scaling: free energy per unit area
WWW.NATURE.COM/NATURE | 19
SUPPLEMENTARY INFORMATIONRESEARCHdoi:10.1038/nature21041

Simulations of ion layering on a structureless (or chemically inert) wall
For comparison, we also ran MD simulations on a system with structureless surfaces without
chemical affinity to either ion in the molten KCl. The system has Lennard–Jones (L–J) interactions
between the solvent and the structureless NC surfaces, and unmodified L–J and Coulomb interactions
between the ions. We find that the ion density profiles templated by the structureless NC surfaces are
similar to the density profiles of hard sphere templated by a hard wall. The interaction between the
structureless NC surfaces is also very similar to the hard sphere-hard wall system. Without surface
charge and/or different chemical affinity for different solvent, oscillatory ion layering observed earlier
in the simulation study does not occur. Since much of solvation theory is based on the hard sphere-hard
wall system and our control system behaves analogously to the hard sphere-hard wall system, we will
briefly compare the phenomenology of the molten salt-NC system (with chemical affinity) and the hard
sphere-hard wall system.
In the absence of surface charge or chemical affinity, ion layers still form, but not the alternating
oscillations that occur in the presence of surface charge or chemical affinity. Near a hard wall, the
density profile of a hard sphere fluid oscillates about the bulk density. The correlation length of these
oscillations is related to the radius of the spheres. The solvent-mediated (hard sphere-mediated)
interaction between two hard walls is oscillatory, but the source of the oscillations is related to the
packing of the hard spheres between the walls (Fig. S11). The important factor for the hard sphere-hard
wall interaction energy is the space available to the hard spheres to move, i.e., the entropy of the hard
spheres. The peaks and troughs of this energy profile are based on the density of hard spheres at the
midplane between the two hard walls. When the midplane density is less than the bulk density, the hard
wall energy is near a trough; when the midplane density is above bulk, the energy is near a peak.
Beyond this oscillating regime (<0.5 nm), the forces of interaction are usually attractive as
demonstrated by our simulations and phenomenological theory (Fig. S11). These simulations on a
structureless wall are in accordance with our experimental observations of destabilization of NCs in
molten salts when there is no chemical affinity between NCs and the ions. We note that Ginzburg-
Landau theory predicts repulsion between walls which each bind to a different component of the
solvent, but we expect such interactions to be much weaker than the energy scales associated with
frustration in inorganic molten salts.37
Returning to the NC in molten salt system, troughs and peaks correspond to, as discussed above,
coherence and decoherence of the templated molten salt charge density. NC interaction energy is at a
minimum when the charge density at the midplane is a peak or a trough. Peak energies occur when
WWW.NATURE.COM/NATURE | 20
SUPPLEMENTARY INFORMATIONRESEARCHdoi:10.1038/nature21041

there is suboptimal shielding between like-charged solvent layers, i.e., when the charge density at the
midplane is zero. The dominant energy contribution determines how the energy depends on the density
profiles, and in molten salts, the Coulomb interaction between templated solvent layers is by far the
most dominant.
Fig. S11. Structureless walls are purely attractive. (Left) Density profiles of K+ (green) and Cl−
(blue) around a hard wall. (Right) Simulated free energy between two structureless walls in molten
KCl and the fit by Ginzburg-Landau theory. Structureless walls do not induce charge oscillations. As a
result, the free energy is as predicted by the Ginzburg-Landau theory for solutes which perturb a field
in a symmetric manner.
Details of Molecular dynamics (MD) simulation
We used the LAMMPS MD package31 to simulate a molten salt-nanoparticle model system,
specifically KCl salt with a CdSe NC. We adapted the models developed by Aguado et al. for molten
salts38 and by Grunwald et al. for solid CdSe39. These two models have different forms for the steric
and dispersion interactions, with the molten salt using a Born-Mayer-Huggins form and the CdSe
crystal using a 6–12 Lennard-Jones form40. We chose to use the Born-Mayer-Huggins potential, and
adapted parameter values from Grunwald's force field by finding σ and ε for the Cd and Se ions. The
parameters used for our model are displayed in Table S2. We simulated an NVT ensemble, with
temperature at 1250 K (the melting point for our model is around 1000 K) and with KCl density of
20.681 nm−3. We chose box sizes so that neighboring images of the CdSe nanocubes would have
negligible interactions: the axis of allowed motion was 21.2 nm in length while the other two axes were
8.9 nm in length. Since the cubes were of size 2.45×1.85×1.85 nm3 and the largest sampled separation
WWW.NATURE.COM/NATURE | 21
SUPPLEMENTARY INFORMATIONRESEARCHdoi:10.1038/nature21041

was ~3 nm, this box size leaves more than 16 nm between nearest nanocube images along the axis of
motion. We used the LAMMPS-implemented particle-particle particle-mesh solver to implement the
long-range Coulomb interactions. We implemented enhanced sampling using the PLUMED code
plugin34. As a control, we simulated a structureless wall, with no charge and which interacted with
solvent only through the 6–8 Lennard-Jones potential. The structureless walls displayed a standard
solvent density profile. But long range charge-density oscillations were not observed as there was no
surface charge to prefer one ion over the other. Two structureless walls assembled as predicted by the
Ginzburg-Landau theory for solutes with a symmetric effect on the order parameter.
Table S2. MD model parameterization
𝐸𝑑𝑖𝑠𝑝 = 𝐴 exp(−𝑟/ 𝜌) −𝐶
𝑟6 +𝐷
𝑟8
Parameterization of CdSe NCs at 1250 K
A (kBT) ρ (Å) D (kBT Å8) C (kBT Å6) ε (kBT) σ (Å)
K–K 13763 0.339 −139 141 146 0.994
Cl–Cl 18019 0.337 −1448 721 89 1.417
K–Cl 14579 0.342 −423 278
Cd–K 14087 0.2 66 30
Se–K 14087 0.5 23284 2391
Cd–Cl 14087 0.1 152 151
Se–Cl 14087 0.5 31158 2810
Parameterization of structureless wall at 1250 K
A (kBT) ρ (Å) D (kBT Å8) C (kBT Å6) ε (kBT) σ (Å)
K–K 13763 0.339 −139 141 146 0.994
Cl–Cl 18019 0.337 −1448 721 89 1.417
K–Cl 14579 0.342 −423 278
Wall–K 0 0 14087 1409
Wall–Cl 0 0 14087 1409
WWW.NATURE.COM/NATURE | 22
SUPPLEMENTARY INFORMATIONRESEARCHdoi:10.1038/nature21041

III. Derjaguin-Landau-Verwey-Overbeek (DLVO) calculations and screening length
Here we describe how the double layer repulsion, Udl, and the van der Waals attraction, UvdW, as
presented in Fig. S3C and Fig. 3f in the main text were estimated for the CdSe NCs in molten KCl.
The non-retarded van der Waals interaction between two flat surfaces interacting across the solvent
medium separated by a distance D is given (per unit area) by
𝑢𝑣𝑑𝑊𝑓𝑙 (𝐷) = −
𝐴
12 𝜋
1
𝐷2 , (14a)
and between two spherical particles of radius R separated by a distance D at the point of closest
approach:
𝑈𝑣𝑑𝑊𝑠𝑝 (𝐷) = −
𝐴
6 [
2𝑅2
(4𝑅+𝐷)𝐷+
2𝑅2
(2𝑅+𝐷)2 + ln(4𝑅+𝐷)𝐷
(2𝑅+𝐷)2 ] , (14b)
where A is the Hamaker constant, a material parameter whose value is specific to the nanocrystal-
solvent system11. Typically, this is estimated from the Lifshitz theory and optical absorption spectra of
the material.
A commonly used convenient approximate expression for the Hamaker constant (valid when
retardation effects are absent, i.e., small D) and the spectrum is characterized by one dominant
absorption peak11,
𝐴 ≃3
4𝑘𝐵𝑇 (
𝜖𝑝−𝜖𝑠
𝜖𝑝+ 𝜖𝑠)
2
+ 3 ℎ𝜈𝑒
16 √2
(𝑛𝑝2 −𝑛𝑠
2)2
( 𝑛𝑝2 +𝑛𝑠
2)32
, (15)
where 𝜀P and 𝜀S are the relative dielectric constants of particles and solvent media, 𝑛P and 𝑛S are the
refractive indices of particles and solvent media, h is the Planck constant (6.63×10⁻³⁴ J s), and ve is the
frequency of the main electronic absorption of the dielectric perimittivity, taken as 3×10¹⁵ Hz for ILs.
The static contribution to the Hamaker constant, i.e., the first term in Eq.(15), is very small as
conducting media like molten inorganic salts largely screen out the static dipole contributions. The
Hamaker constant evaluated with the typical values for electronic absorption frequency and refractive
indices, is A ~ 5×10⁻²⁰ J.
We now show that the Hamaker constant can be obtained for the specific case of CdSe interactions
KCl from values known in the literature, and show that the above approximation results in a value that
is reasonably accurate. For this we use a combination formula for the Hamaker constants, 𝐴121 ∼
2(√𝐴11 − √𝐴22) , where Aii indicates interaction of two particles of type i across vacuum, and Aiji
indicates interactions of two particles of type i interacting across the medium of material j. Using
values for Hamaker constant for CdSe interacting in vacuum41,42, A11 = 11×10−20 J, and KCl interacting
in vacuum42, A22 = 6.2×10⁻²⁰ J, and using the combination formula, we arrive at the relevant Hamaker
WWW.NATURE.COM/NATURE | 23
SUPPLEMENTARY INFORMATIONRESEARCHdoi:10.1038/nature21041

constant for CdSe particles interacting in KCl medium, A121 = 7×10⁻²¹ J, which is an order of
magnitude lower than that estimated from Eq. (15) for generic dielectric. However, the value used here
is for crystalline KCl and we expect 𝐴22 to be somewhat lower in molten KCl. The value of Hamaker
constant in practice should not be so different from A ~ 5×10⁻²⁰ J estimated above for generic solutes in
molten salts.
The electric double layer forces are estimated within the context of the mean-field Poisson-
Boltzmann theory where the Debye screening length, ls, depends on the number density of the salt ions,
𝑛𝑠, as 𝑙𝑠−2 = 𝑛𝑠
𝑒2
𝜖0𝜖𝑘𝐵𝑇= 𝑛𝑠𝑙𝐵, where 𝑙𝐵 ≡
𝑒2
(𝜖𝜖0𝑘𝐵𝑇) is the Bjerrum length. The density of ions for
molten salt at this temperature (ns, 20.7 nm−3) suggests a very small Debye length (0.06 nm), assuming
a relative permittivity (ε) of 4. This suggests that double layer forces are effectively screened out and
insignificant. The free energy of double layer interactions can be expressed in terms of the surface
potential (measured to be 𝑣𝑠 = 50 𝑚𝑉 for the CdSe NC used in the experiments) as11:
𝑈𝑑𝑙(𝐷) = 2 𝜖 𝜖0𝑣𝑠2𝑙𝑠
−1𝑒−
𝐷
𝑙𝑐 (16)
As a word of caution, the Debye-Hückel approximation is strictly valid only for dilute electrolytes
and does not account for finite size and correlation effects of the ions that are more important in
concentrated electrolytes. These effects may be explained within a more general theoretical
framework22 that should also predict long-range charge density layering in concentrated electrolytes
consistent with our phenomenological theory and simulations. To account for the possibility of long-
range double layer repulsion due to interionic correlations, we measured the screening length from the
atomistic simulations by extracting the bulk charge-charge correlation function43. The effective
screening length in our simulated molten salt at a temperature of 1250 K and 1 bar pressure was found
to be 0.63 nm (Fig. S12), which is about an order of magnitude larger than the Debye length estimated
from the Debye-Hückel approximation. This estimate is in agreement with results from previous
simulations43 and suggests that our calculations are in a regime where the importance of ionic
correlations is high. Recent experiments on concentrated aqueous electrolytes21 and room temperature
organic ionic liquids20 also indicate significantly longer effective screening lengths than those predicted
within the Debye-Hückel approximation. Large effective screening length is expected to further
improve the colloidal stability of particulates in molten inorganic salts. We anticipate that it will be
possible to extend our phenomenological theory to explain such effects by including higher order ionic
correlations22,44. This work is in progress.
WWW.NATURE.COM/NATURE | 24
SUPPLEMENTARY INFORMATIONRESEARCHdoi:10.1038/nature21041

Fig. S12. Charge-charge correlations in a simulated molten salt. The screening length is identified
as the exponential decay length of the oscillating charge-charge correlations43. The screening length is
0.627 nm at 1250 K temperature and the pressure 1 bar.
IV. Characterization of nanocrystal dispersions in organic ionic liquids (ILs)
CdSe NCs recovered from P+P− IL show vibration peaks similar to those of NCs with original
ligands (OA/TOP/TOPO) rather than P+P−, indicating the preservation of the NC ligand shell when
dispersed in P+P− (Fig. S13A and B). On the contrary, the FTIR features of NCs recovered from
[BMIM]+Cl− resembled those of pure [BMIM]+Cl−, which suggests the replacement/removal of
original organic ligands by [BMIM]+Cl− solvent molecules. The assignment of resonances to different
protons in free OA and OA bound on CdSe NCs45 is shown in Fig. S13C and D. The resonances of
protons in TOP and TOPO ligands are within the range of 1.0 to 1.8 ppm and mostly overlap with those
of the methylene and methyl (–CH2– and –CH3) groups in OA. The characteristic resonance for alkene
protons (position 5) in free OA is at 5.45 ppm (C); this broadens and shifts to a lower field (5.57 ppm)
when bound on CdSe NC surfaces (Fig. S13D)45. This resonance is also observed in CdSe NCs in P+P−
diluted with d8-toluene (P+P−/d8-toluene = 1:10 v/v) (inset in (Fig. S13F)). The amount of OA ligands
in CdSe NC colloids (calibrated by the concentration of CdSe NCs) remains almost unchanged when
WWW.NATURE.COM/NATURE | 25
SUPPLEMENTARY INFORMATIONRESEARCHdoi:10.1038/nature21041

dispersed in toluene or P+P−, as shown in (Fig S13H). To check the existence of OA ligands in CdSe
NCs in [BMIM]+Cl−, the IL matrix was dissolved with DI water. The insoluble CdSe NCs were
digested by half-concentrated aqua regia and then the OA ligands, if any, were extracting using diethyl
ether. This solution was dried under vacuum, and then diluted in d8-toluene for NMR measurements.
No resonances from OA ligands were observed (Fig.S13G), indicating the complete removal of native
ligands during the phase transfer of CdSe NCs from octane to [BMIM]+Cl−.
Fig. S13. Surface chemistry of nanocrystals in ionic liquids. FTIR spectra of CdSe NCs with organic
ligands (OA/TOP/TOPO) and recovered from their stable colloids in (A) P+P− and (B) [BMIM]+Cl−. In
both cases, the spectra of pure ILs (red curves) are shown for reference. Intensities of recovered NC
spectra are magnified 20 times. 1H-NMR of (C) OA in d8-toluene and (D) CdSe NCs with original
organic ligands (OA/TOP/TOPO) in d8-toluene (25 mg/mL, 1.0 mL). The assignment of resonances to
different protons in OA and OA on the CdSe NC surface is indicated in the inset in (D). (E) P+P− in d8-
toluene, (F) CdSe NCs in P+P− diluted by d8-toluene (2.5 mg/mL, 1.0 mL, P+P−/d8-toluene = 1:10 v/v).
Inset in (F) compares the OA alkene protons resonances of CdSe NCs in P+P− (red curve,
overshadowed by the strong resonances from P+P− solvent in D) versus pure P+P− (blue curve). (G)
Residue recovered from digested CdSe NCs in [BMIM]+Cl−. No OA resonance is present (inset in (G)).
(H) Comparison of 1H NMR of CdSe NCs with organic ligands in d8-toluene (black curve) and in
P+P−/d8-toluene (1:10 v/v) (red curve). (*) indicates the residual solvent resonances in (C–H).
WWW.NATURE.COM/NATURE | 26
SUPPLEMENTARY INFORMATIONRESEARCHdoi:10.1038/nature21041

ICP–OES analysis suggests almost no change in the amount of the P-containing surfactants (TOP
and TOPO) for CdSe NCs in toluene (Cd:Se = 1.2, P:Se = 0.037 in moles) and recovered from P+P−
(Cd:Se = 1.1, P:Se = 0.030 in moles). In contrast, TOP and TOPO ligands were replaced/removed
during the phase transfer of CdSe NCs from octane to the Lewis basic [BMIM]+Cl− (no P detected).
Thus, CdSe NCs are stabilized in [BMIM]+Cl− purely by solvent molecules.
The above analysis depicts the fate of native organic ligands on CdSe NCs in different types of ILs.
The organic ligands of CdSe NCs remained in the hydrophobic P+P−, but were completely removed and
replaced before being transferred in [BMIM]+Cl− or [BMIM]+I−. In another experiment, naked CdSe or
QDs NCs did not disperse well in P+P−, emphasizing the importance of native organic ligands in the
stabilization of NCs in P+P−. However, we cannot rule out the possibility that the anionic part of P+P−
(bis(2,4,4-trimethylpentyl)phosphinate) may also behave like additional NC ligands due to its
nucleophilicity46. In addition, the equilibrium of free and bound OA ligands on CdSe NCs may change
in P+P−.
Supplementary References
S1 Igarashi, K. et al. Properties of KSCN-rich molten NaSCN-KSCN mixtures. Z. Naturforsh. 46a,
540–544 (1991).
S2 Dancy, E. A. & Nguyen-Duy, P. Calorimetric determination of the thermodynamic properties of
the binary eutectics in the NaNO3–Ca(NO3)2 and KNO3–Ca(NO3)2 systems. Thermochimica
Acta 42, 59–63 (1980).
S3 Janz, G. J. & Truong, G. N. Melting and premelting properties of the KNO3–NaNO2–NaNO3
eutectic system. J. Chem. Eng. Data 28, 201–202 (1983).
S4 Cordaro, J. G., Kruizenga, A. M., Altmaier, R., Sampson, M. & Nissen, A. in SolarPACES
(Granada, Spain, 2011).
S5 Wang, C., Daimon, H., Onodera, T., Koda, T. & Sun, S. A general approach to the size- and
shape-controlled synthesis of platinum nanoparticles and their catalytic reduction of oxygen.
Angew. Chem. Int. Ed. 47, 3588–3591 (2008).
S6 Dirin, D. N. et al. Lead halide perovskites and other metal halide complexes as inorganic
capping ligands for colloidal nanocrystals. J. Am. Soc. Chem. 136, 6550–6553 (2014).
S7 Son, J. S., Lee, J.-S., Shevchenko, E. V. & Talapin, D. V. Magnet-in-the-semiconductor
nanomaterials: High electron mobility in all-inorganic arrays of FePt/CdSe and FePt/CdS core–
shell Heterostructures. J. Phys. Chem. Lett. 4, 1918–1923 (2013).
S8 Park, J. et al. Ultra-large-scale syntheses of monodisperse nanocrystals. Nat. Mater. 3, 891–895
(2004).
S9 Baek, J., Allen, P. M., Bawendi, M. G. & Jensen, K. F. Investigation of indium phosphide
WWW.NATURE.COM/NATURE | 27
SUPPLEMENTARY INFORMATIONRESEARCHdoi:10.1038/nature21041

nanocrystal synthesis using a high-temperature and high-pressure continuous flow microreactor.
Angew. Chem. Int. Ed. 50, 627–630 (2011).
S10 Battaglia, D. & Peng, X. Formation of high quality InP and InAs nanocrystals in a
noncoordinating solvent. Nano Lett. 2, 1027–1030 (2002).
S11 Zhang, H., Jang, J., Liu, W. & Talapin, D. V. Colloidal nanocrystals with inorganic halide,
pseudohalide, and halometallate ligands. ACS Nano 8, 7359–7369 (2014).
S12 Punjabi, A. et al. Amplifying the red-emission of upconverting nanoparticles for biocompatible
clinically used prodrug-induced photodynamic therapy. ACS Nano 8, 10621–10630 (2014).
S13 Hansen, J.-P. & McDonald, I. R. Theory of Simple Liquids. 4th Ed., (Elsevier Academic Press,
2013).
S14 Bazant, M. Z., Storey, B. D. & Kornyshev, A. A. Double layer in ionic liquids: Overscreening
versus crowding. Phys. Rev. Lett. 106, 046102 (2011).
S15 Limmer, D. T. Interfacial ordering and accompanying divergent capacitance at ionic liquid-
metal interfaces. Phys. Rev. Lett. 115, 256102 (2015).
S16 Derjagin, B. V. & Landau, L. Theory of the stability of strongly charged lyophobic sols and of
the adhesion of strongly charged particles in solution of electrolytes. Acta Physicochimica
USSR 14, 633–662 (1941).
S17 Hertlein, C., Helden, L., Gambassi, A., Dietrich, S. & Bechinger, C. Direct measurement of
critical casmir forces. Nature 451, 172–175 (2008).
S18 Di Cicco, A. et al. Short-range order in solid and liquid KBr probed by EXAFS. J. Phys.:
Condens. Matter. 8, 10779– 10797 (1996).
S19 Heyes, D. M. & Clarke, J. H. R. Computer simulation of molten-salt interphases. Effect of a
rigid boundary and an applied electric field. J. Chem. Soc., Faraday Trans. 2 77, 1089–1100
(1981).
S20 Gebbie, M. A., Dobbs, H. A., Valtiner, M. & Israelachvili, J. N. Long-range electrostatic
screening in ionic liquids. Proc. Natl. Acad. Sci. U.S.A. 112, 7432–7437 (2015).
S21 Smith, A. M., Lee, A. A. & Perkin, S. The electrostatic screening length in concentrated
electrolytes increases with concentration. J. Phys. Chem. Lett. 7, 2157–2163 (2016).
S22 Lee, B. P. & Fisher, M. E. Charge oscillations in Debye-Hückel theory. Europhys. Lett. 39,
611–616 (1997).
S23 Low, U., Emery, V. J., Fabricius, K. & Kivelson, S. A. Study of an Ising model with competing
long- and short-range interactions. Phys. Rev. Lett. 72, 1918 (1994).
S24 Fredrickson, G. H. Surface ordering phenomena in block copolymer melts. Macromolecules 20,
2535–2542 (1987).
S25 Gavish, N. & Yochelis, A. Theory of phase separation and polarization for pure ionic liquids. J.
Phys. Chem. Lett. 7, 1121–1126 (2016).
S26 Seul, M. & Andelman, D. Domain shapes and patterns: The phenomenology of modulated
phases. Science 267, 476–483 (1995).
S27 Mezger, M. et al. Molecular layering of fluorinated ionic liquids at a charged sapphire (0001)
surface. Science 322, 424–428 (2008).
S28 Israelachvili, J. N. Intermolecular and surface forces, third ed., 1–674 (Elsevier Academic
Press, 2011).
S29 Chaikin, P. M. & Lubensky, T. C. Principles of Condensed Matter Physics. (Cambridge Univ.
Press, 2000).
S30 Tsori, Y., Andelman, D. & Schnick, M. Defects in lamellar diblock copolymers: Chevron- and
Ω-shaped tilt boundaries. Phys. Rev. E 61, 2848 (2000).
S31 Plimpton, S. Fast parallel algorithms for short-range molecular dynamics. J. Comput. Phys. 117,
1–19 (1995).
S32 Pensado, A. S. & Padua, A. A. H. Solvation and stabilization of metallic nanoparticles in ionic
WWW.NATURE.COM/NATURE | 28
SUPPLEMENTARY INFORMATIONRESEARCHdoi:10.1038/nature21041

liquids. Angew. Chem. Int. Ed. 50, 8683–8687 (2011).
S33 Zobel, M., Neder, R. B. & Kimber, S. A. J. Universal solvent restructuring induced by colloidal
nanoparticles. Science 347, 292–294 (2015).
S34 Tribello, G. A., Bonomi, M., Branduarda, D., Camilloni, C. & Bussi, G. PLUMED 2: New
feathers for an old bird. Comput. Phys. Commun. 185, 604–613 (2014).
S35 Shirts, M. R. & Chodera, J. D. Statistically optimal analysis of samples from multiple
equilibrium states. J. Chem. Phys. 129, 124105 (2008).
S36 Frenkel, D. & Smit, B. Understanding molecular simulation, second ed., 165–199 (Elsevier
Academic Press, 2002).
S37 Marcelja, S. & Radic, N. Repulsion due to boundary water. Chem. Phys. Lett. 42, 129–130
(1976).
S38 Aguado, A. & Madden, P. A. Molecular dynamics simulations of the liquid-vapor interface of a
molten salt. III. Size asymmetry effects and binary mixtures. J. Chem. Phys. 117, 7659–7668
(2002).
S39 Grünwald, M., Zayak, A., Neaton, J. B., Geissler, P. L. & Rabani, E. Transferable pair
potentials for CdS and ZnS crystals. J. Chem. Phys. 136, 234111 (2012).
S40 Fumi, F. G. & Tosi, M. P. Ionic sizes and Born repulsive parameters in the NaCl-type alkali
halides–I: The Huggins-Mayer and Pauling forms. J. Phys. Chem. Solids 25, 31–43 (1964).
S41 Jana, S. et al. Stacking and colloidal stability of CdSe nanoplatelets. Langmuir 31,
10532−10539 (2015).
S42 Bergström, L. Hamaker constants of inorganic materials. Adv. in Colloid Interface Sci. 70,
125−169 (1997).
S43 Keblinski, P., Eggebrecht, J., Wolf, D. & Phillpot, S. R. Molecular dynamics study of screening
in ionic fluids. J. Chem. Phys. 113, 282−291 (2000).
S44 Leote de Carvalho, R. J. F. & Evans, R. The decay of correlations in ionic fluids. Molecular
Physics 83, 619−654 (1994).
S45 Fritzinger, B., Capek, R. K., Lambert, K., Martins, J. C. & Hens, Z. Utilizing self-exchange to
address the binding of carboxylic acid ligands to CdSe quantum dots. J. Am. Chem. Soc. 132,
10195–10201 (2010).
S46 Green, M., Rahman, P. & Smyth-Boyle, D. Ionic liquid passivated CdSe nanocrystals. Chem.
Commun., 574–576 (2007).
WWW.NATURE.COM/NATURE | 29
SUPPLEMENTARY INFORMATIONRESEARCHdoi:10.1038/nature21041