supplementary information for charge transfer …supplementary information for charge transfer...
TRANSCRIPT
Supplementary Information
For
Charge transfer complexes as colour changing and
disappearingreappearing colour materials
Durgam Sharada, Arijit Saha and Binoy K. Saha*
Department of Chemistry, Pondicherry University, Puducherry, India 605014
E-mail: [email protected], [email protected]
Contents
Experimental Details
Table S1. Crystallization experiment table.
Figure S1. ORTEP diagrams of the systems drawn at 50 % probability level.
Figure S2. Change in colour after physical mixing and grinding of the two components of NP and DR
complexes.
Table S2. Crystallographic table.
Powder XRD Plots.
1H-NMR Spectra.
References.
Electronic Supplementary Material (ESI) for New Journal of Chemistry.This journal is © The Royal Society of Chemistry and the Centre National de la Recherche Scientifique 2019

Experimental Details:
Naphthalene (NP) and picric acid (PA) were purchased from Loba Chemie, durene (DR), mesitylene
(MS), tetraflurobenzoquinone (TF) and tetracyanobenzene (TC) were purchased from Sigma Aldrich.
Crystallization solvents were purchased from SD Fine-chem. All these chemicals were used as such
without further purification. Trinitrobenzne (TN) S1
was synthesized by following the reported procedure.
Proton NMR Spectra:
1H NMR spectra were recorded by using 400 MHz Bruker spectrometer. All chemical shift values are
quoted in ppm.
Thermogravimetric analysis:
The thermal stability evaluation was carried out using a thermogravimetric analyzer model Q500 Hi-
Res TGA (TA instrument). The samples were heated from 27 to 400 °C at the rate of 10 °C/min. air
atmosphere.
Crystallography:
Single crystal X-ray data were collected on a Rigaku-Oxford Xcalibur Eos single crystal X-ray
diffractometer with Mo-Kα radiation (λ = 0.71073 Å. Structure solution and refinement were performed
using SHELXS-97S2
and XL,S3
respectively, in the Olex 2.1-2 package.S4
In all the structures, hydrogen
atoms have been placed at calculated positions.
The PXRD experiments were performed at room temperature using Cu Kα radiation (30mA, 40KV) on
X-pert Panalytical X-ray diffractometer. The spectrum was recorded with 2θ ranging from 9° to 50°
and a step size of 0.02°.
Table S1: Crystallization experiment table:
Charge transfer crystals were obtained by solvent slow evaporation method and details were given in the
below table
Complex Ratio Crystallization
solvent
Crystallization
time Crystal shape Crystal colour
NP-PA
1:1
Chloroform
Five days
Block Dark yellow
NP-TQ
1:1 Acetonitrile
Seven days
Plate Dark brown
NP-TN
1:1 Ethanol
Six days
Needle Pale green
NP-TC
1:1 Acetone
Four days
Block Pale green
NP-TF
1:1 Ethyl acetate
Five days
Plate Dark orange
DR-TC
1:1 Acetone
Five days
Block Bright green
DR-TN
1:1
Acetone
Six days
Block Yellowish green
DR-TF 1:1 Dichloromethane Four days
Plate Dark orange
MS-PA 1:1 Chloroform Five days Block Yellowish green
MS-TF 1:1 Ethyl acetate Seven days Needle Yellow

Figure S1. ORTEP diagrams drawn at 50 % probability level
DR-TF complex NP-TN complex DR-TN complex
NP-TF complex MS-PA complex
Figure S2. Change in colour after physical mixing and grinding of the two components of the NP and DR
complexes.
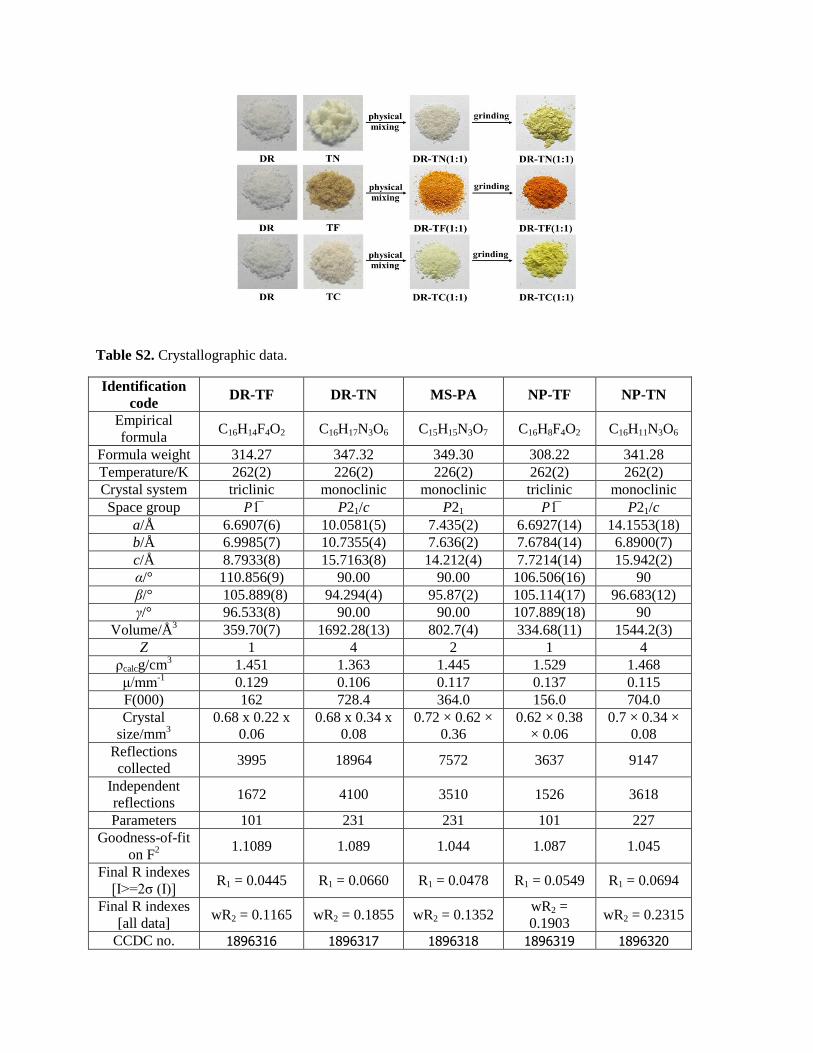
Table S2. Crystallographic data.
Identification
code DR-TF DR-TN MS-PA NP-TF NP-TN
Empirical
formula C16H14F4O2 C16H17N3O6 C15H15N3O7 C16H8F4O2 C16H11N3O6
Formula weight 314.27 347.32 349.30 308.22 341.28
Temperature/K 262(2) 226(2) 226(2) 262(2) 262(2)
Crystal system triclinic monoclinic monoclinic triclinic monoclinic
Space group 𝑃1̅ P21/c P21 𝑃1̅ P21/c
a/Å 6.6907(6) 10.0581(5) 7.435(2) 6.6927(14) 14.1553(18)
b/Å 6.9985(7) 10.7355(4) 7.636(2) 7.6784(14) 6.8900(7)
c/Å 8.7933(8) 15.7163(8) 14.212(4) 7.7214(14) 15.942(2)
α/° 110.856(9) 90.00 90.00 106.506(16) 90
β/° 105.889(8) 94.294(4) 95.87(2) 105.114(17) 96.683(12)
γ/° 96.533(8) 90.00 90.00 107.889(18) 90
Volume/Å3 359.70(7) 1692.28(13) 802.7(4) 334.68(11) 1544.2(3)
Z 1 4 2 1 4
ρcalcg/cm3 1.451 1.363 1.445 1.529 1.468
μ/mm-1
0.129 0.106 0.117 0.137 0.115
F(000) 162 728.4 364.0 156.0 704.0
Crystal
size/mm3
0.68 x 0.22 x
0.06
0.68 x 0.34 x
0.08
0.72 × 0.62 ×
0.36
0.62 × 0.38
× 0.06
0.7 × 0.34 ×
0.08
Reflections
collected 3995 18964 7572 3637 9147
Independent
reflections 1672 4100 3510 1526 3618
Parameters 101 231 231 101 227
Goodness-of-fit
on F2
1.1089 1.089 1.044 1.087 1.045
Final R indexes
[I>=2σ (I)] R1 = 0.0445 R1 = 0.0660 R1 = 0.0478 R1 = 0.0549 R1 = 0.0694
Final R indexes
[all data] wR2 = 0.1165 wR2 = 0.1855 wR2 = 0.1352
wR2 =
0.1903 wR2 = 0.2315
CCDC no. 1896316 1896317 1896318 1896319 1896320

Simulated and experimental (after grinding of the two solid components in 1:1 ratio) Powder XRD
plots of the complexes.
NP-PA complex simulated
NP-PA complex experimental
NP-TQ complex simulated
NP-TQ complex experimental
NP-TN complex simulated
NP-TN complex experimental
NP-TF complex simulated
NP-TF complex experimental
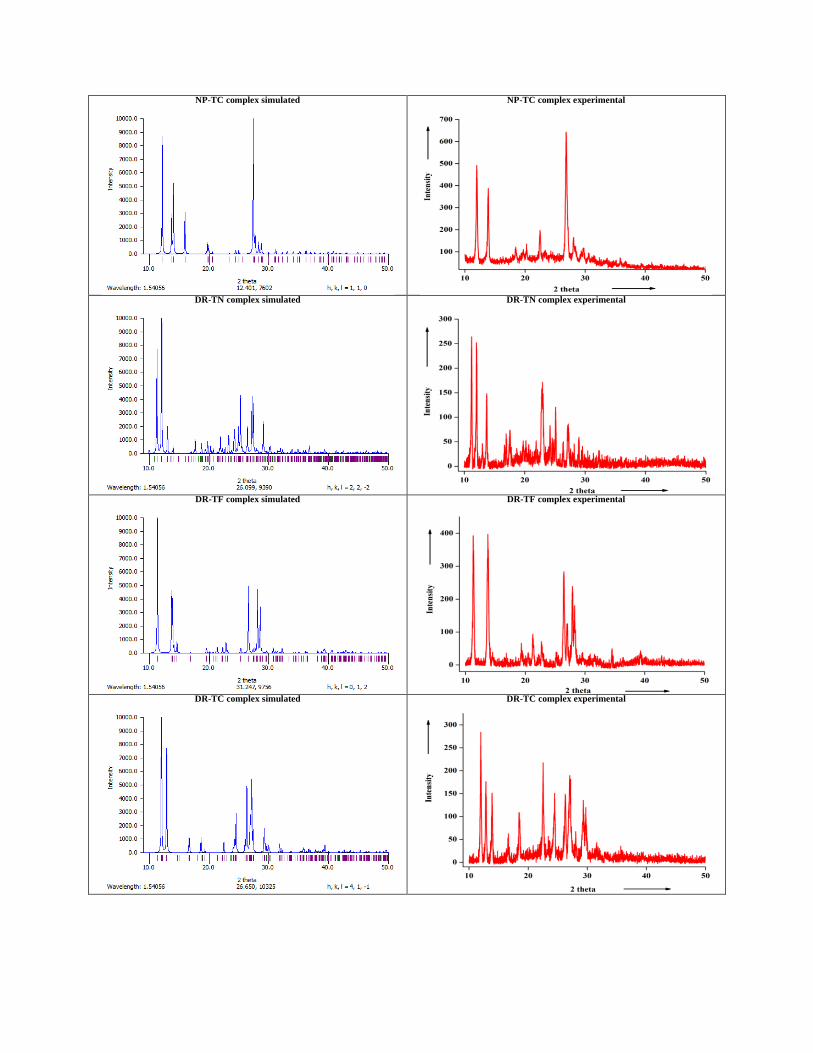
NP-TC complex simulated
NP-TC complex experimental
DR-TN complex simulated
DR-TN complex experimental
DR-TF complex simulated
DR-TF complex experimental
DR-TC complex simulated
DR-TC complex experimental
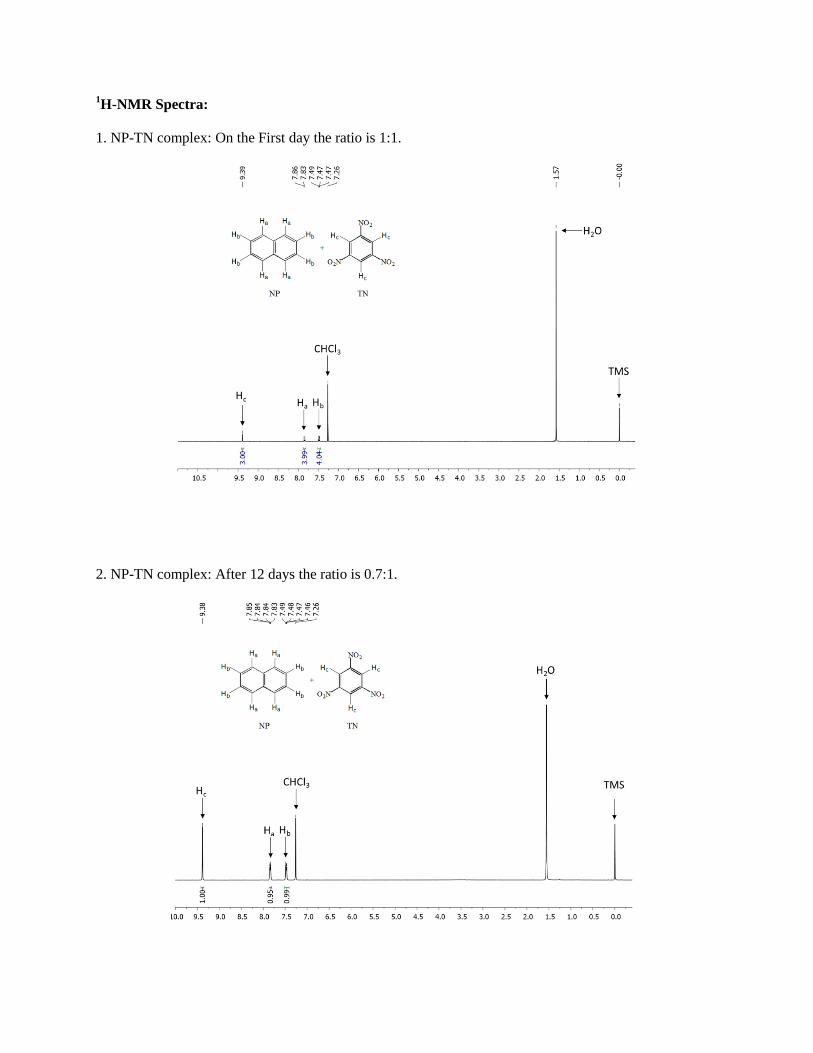
1H-NMR Spectra:
1. NP-TN complex: On the First day the ratio is 1:1.
2. NP-TN complex: After 12 days the ratio is 0.7:1.
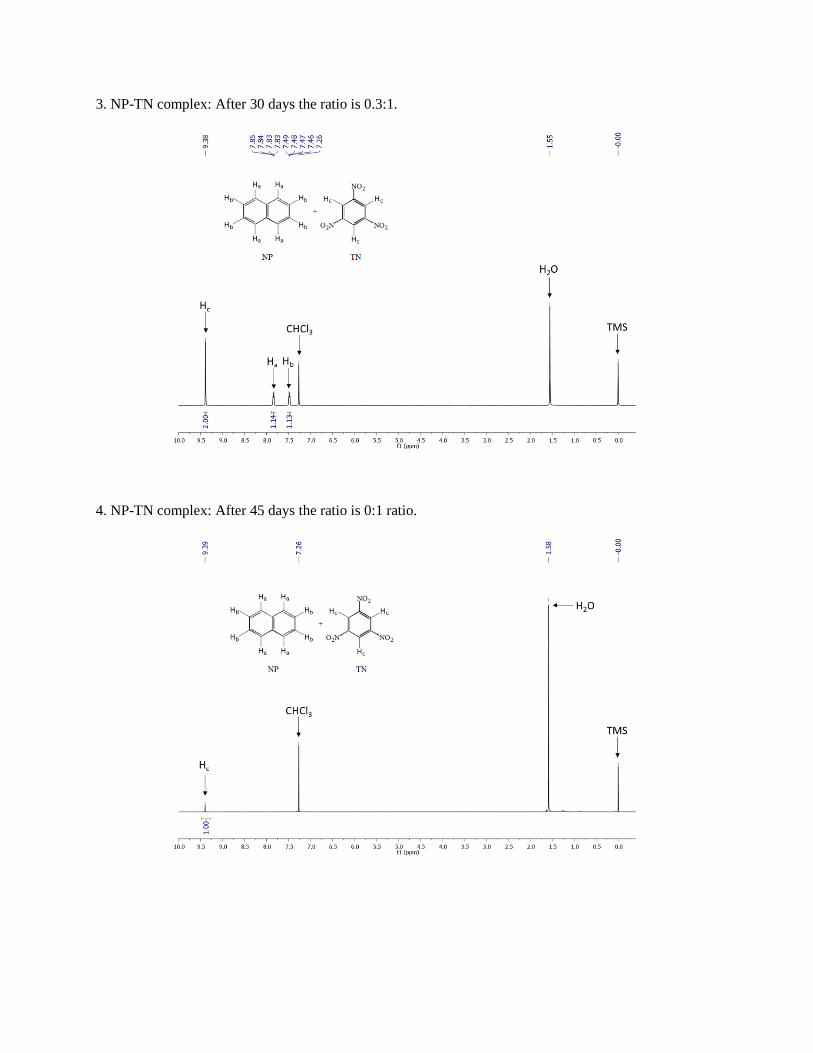
3. NP-TN complex: After 30 days the ratio is 0.3:1.
4. NP-TN complex: After 45 days the ratio is 0:1 ratio.

5. NP-TN colour reappeared: The ratio is 1:1 ratio.
6. NP-TF complex NMR: On the first day (ratio is 1:1 from crystal structure).

7. NP-TF complex: After 10 days.
After 12 days NP-TF complex completely sublimed.
8. NP-TC complex: On the first day the ratio is 1:1.
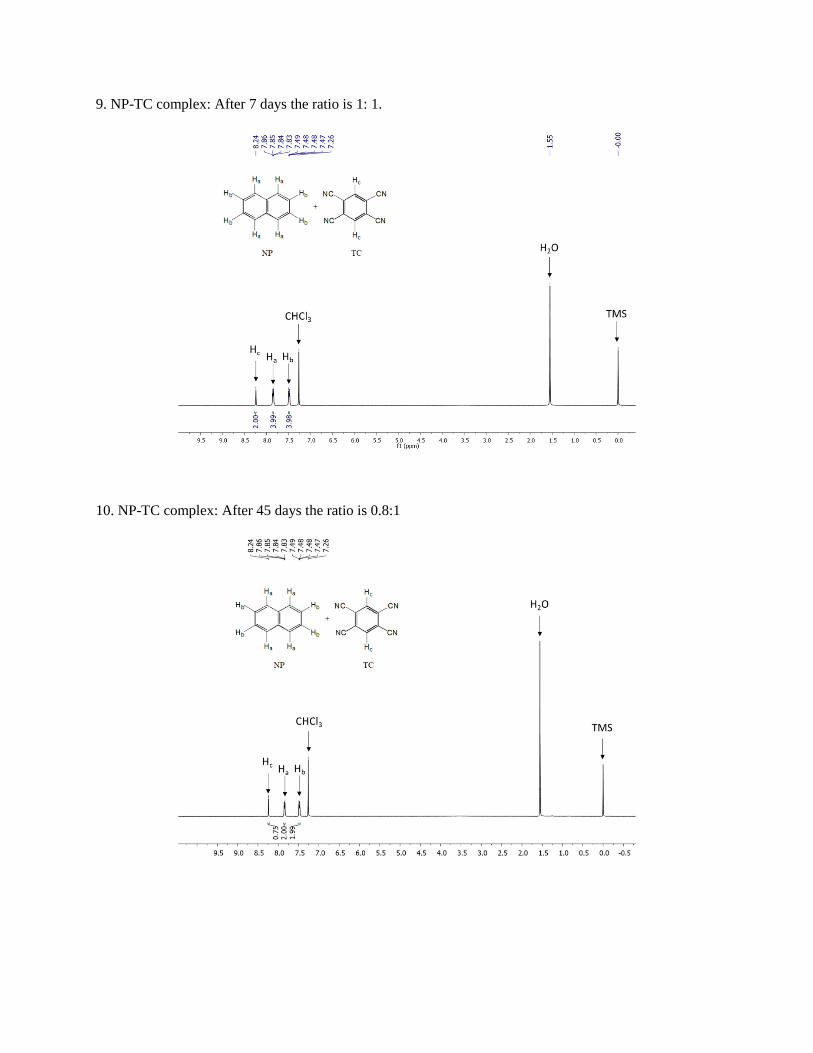
9. NP-TC complex: After 7 days the ratio is 1: 1.
10. NP-TC complex: After 45 days the ratio is 0.8:1
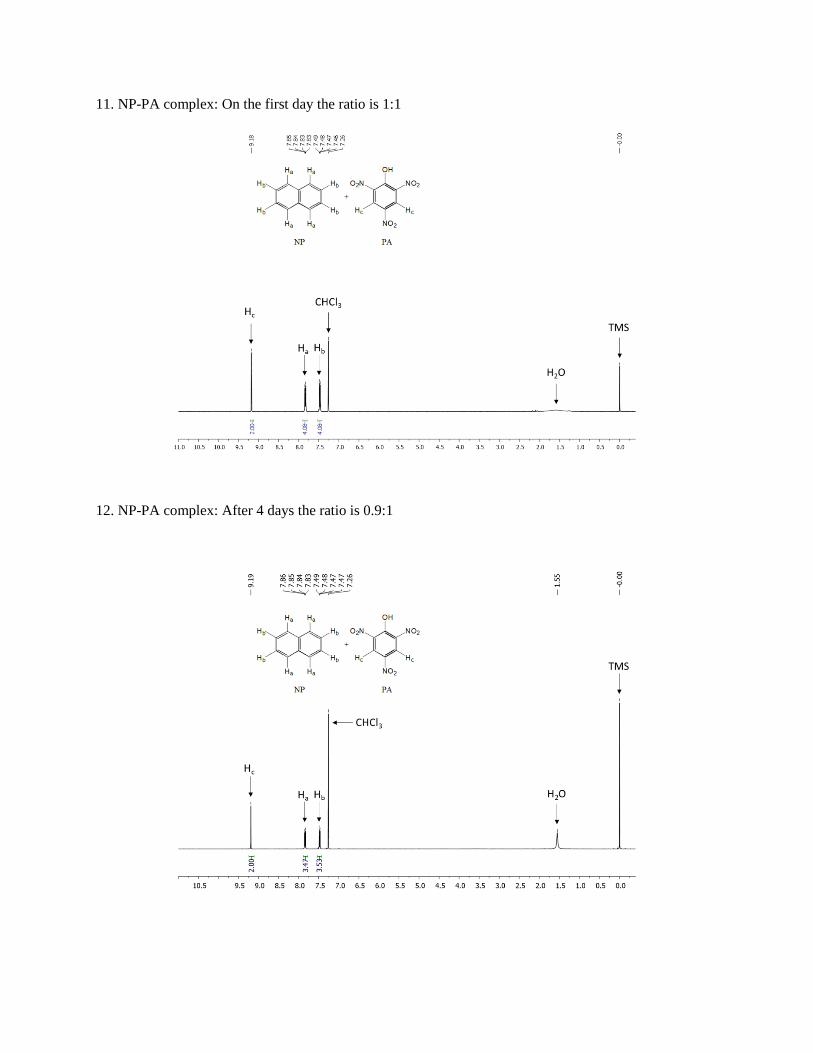
11. NP-PA complex: On the first day the ratio is 1:1
12. NP-PA complex: After 4 days the ratio is 0.9:1

13. NP-PA complex: After 8 days the ratio is 0.8:1.
14. NP-PA complex: After 12 days the ratio is 0.6:1

15. NP-PA complex: After 16 days the ratio is 0.3: 1
16. NP-PA complex: After 20 days the ratio is 0.2:1
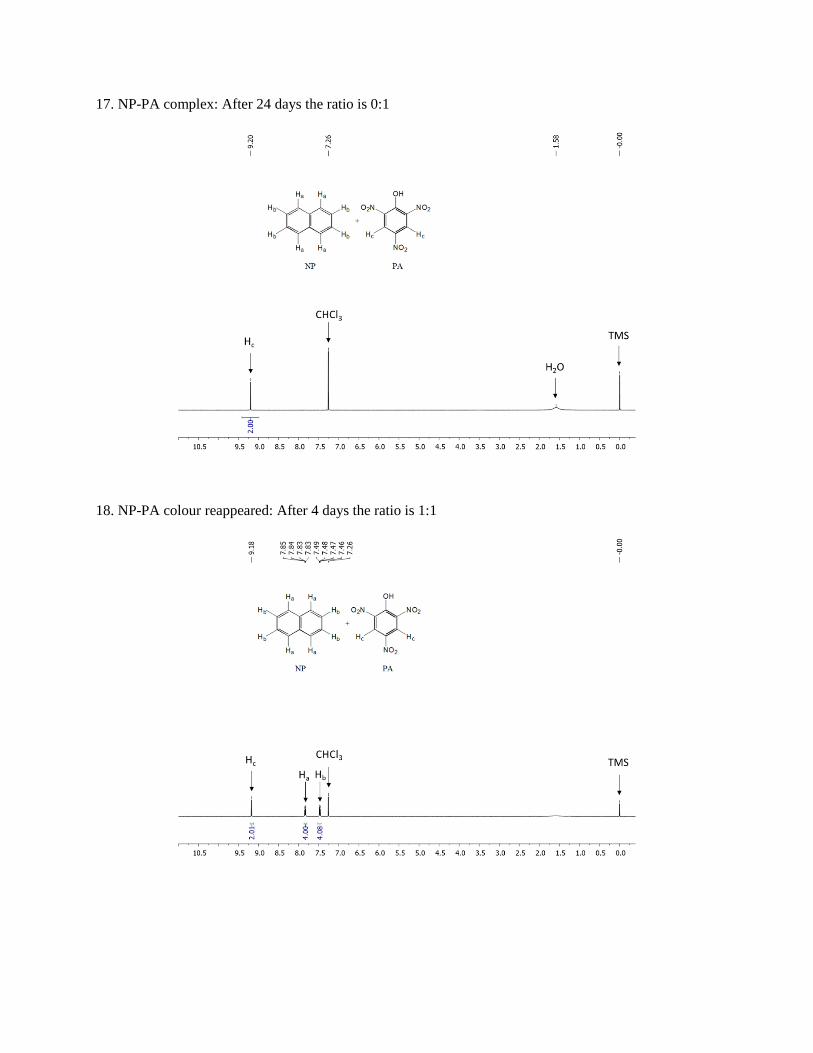
17. NP-PA complex: After 24 days the ratio is 0:1
18. NP-PA colour reappeared: After 4 days the ratio is 1:1

19. NP-TQ complex: On the first day the ratio is 1:1.
20. NP-TQ complex: After 3 days the ratio is 0.8:1.
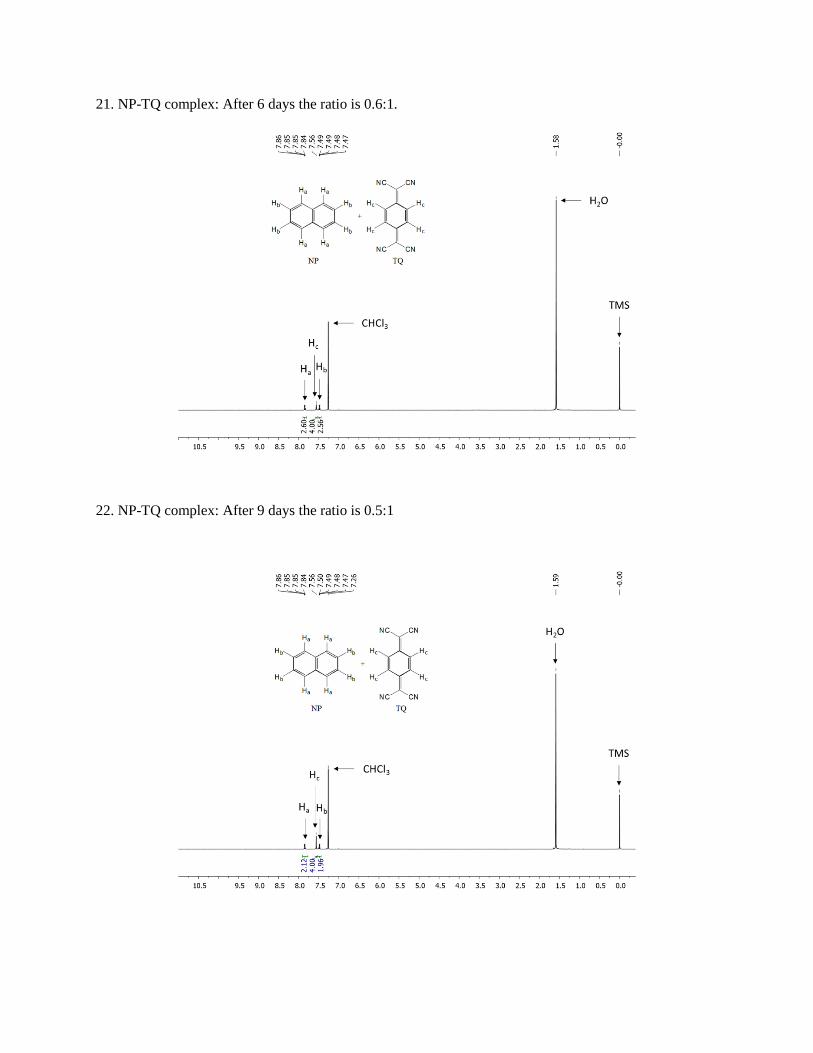
21. NP-TQ complex: After 6 days the ratio is 0.6:1.
22. NP-TQ complex: After 9 days the ratio is 0.5:1
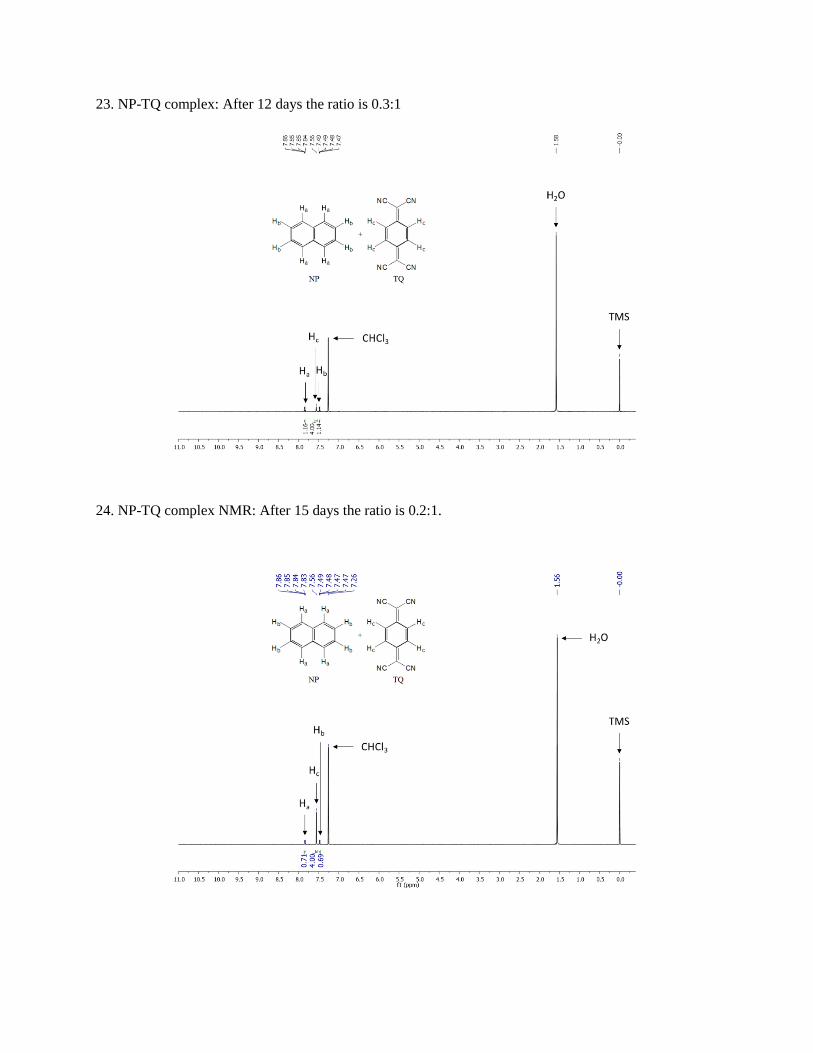
23. NP-TQ complex: After 12 days the ratio is 0.3:1
24. NP-TQ complex NMR: After 15 days the ratio is 0.2:1.
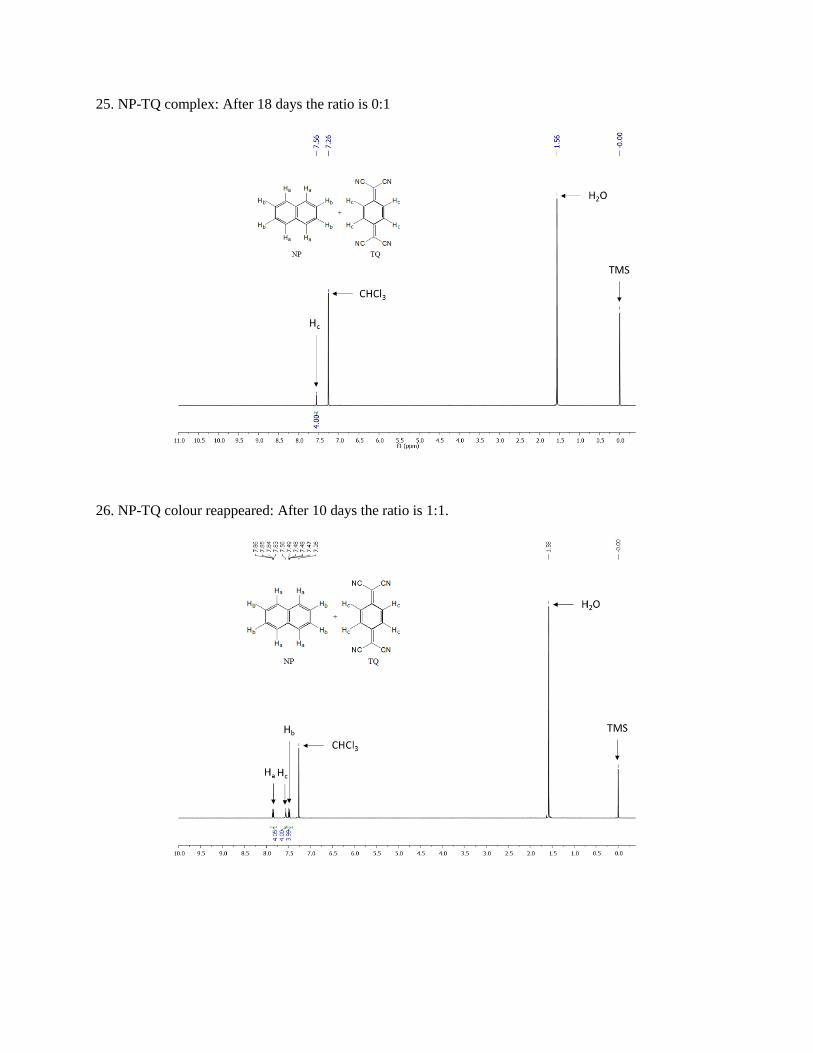
25. NP-TQ complex: After 18 days the ratio is 0:1
26. NP-TQ colour reappeared: After 10 days the ratio is 1:1.

27. DR-TF complex: On the first day (ratio is 1:1 from crystal structure).
28. DR-TF complex: After 9 days.
After 10 days DR-TF complex completely disappeared.

29. DR-TC complex: On the first day the ratio is 1:1.
30. DR-TC complex: After 25 days the ratio is 0.5:1
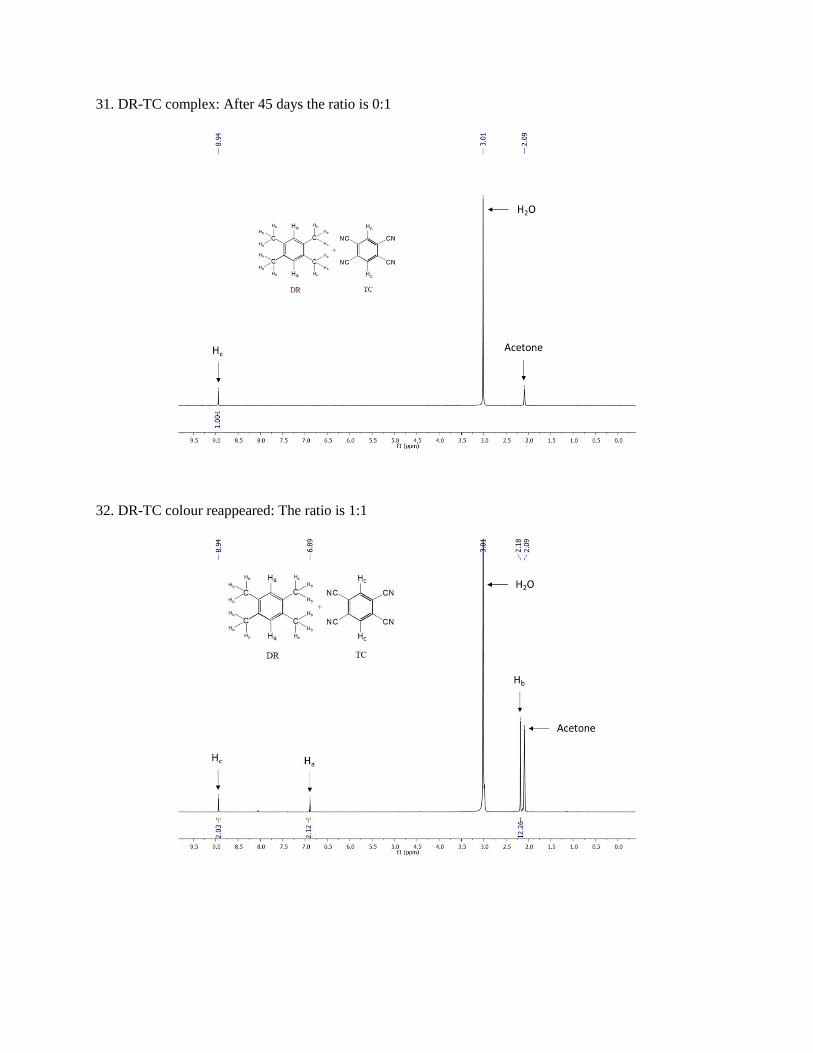
31. DR-TC complex: After 45 days the ratio is 0:1
32. DR-TC colour reappeared: The ratio is 1:1
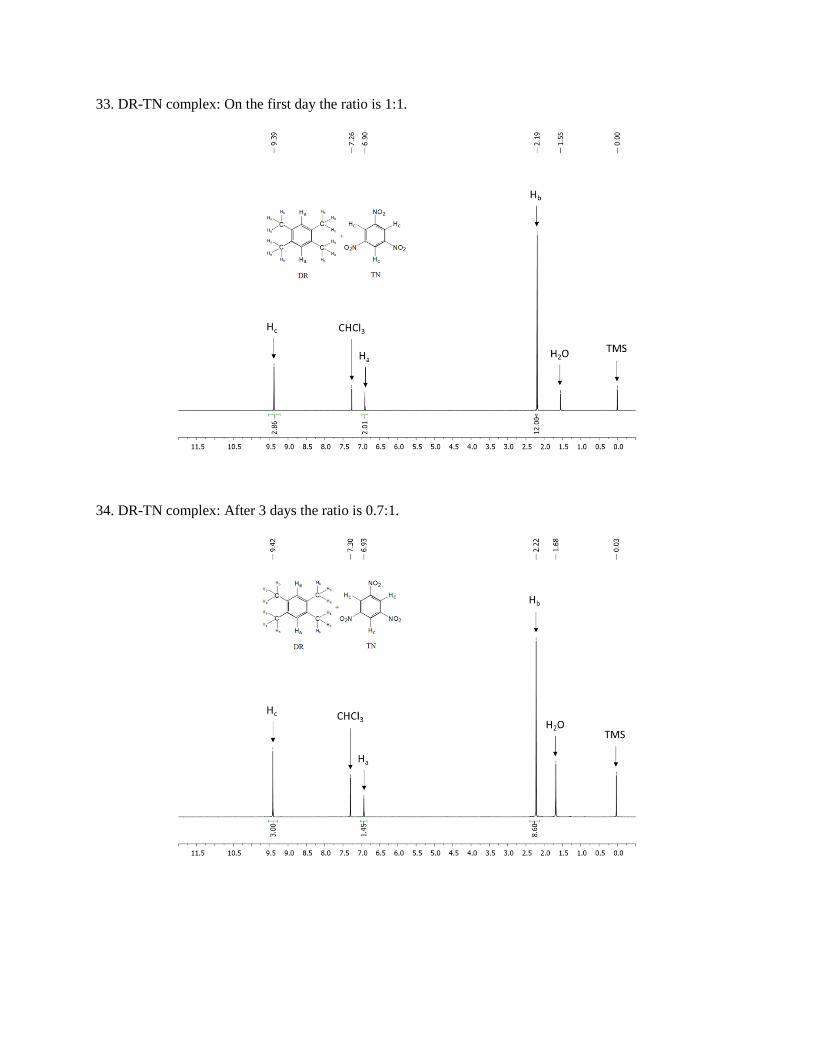
33. DR-TN complex: On the first day the ratio is 1:1.
34. DR-TN complex: After 3 days the ratio is 0.7:1.
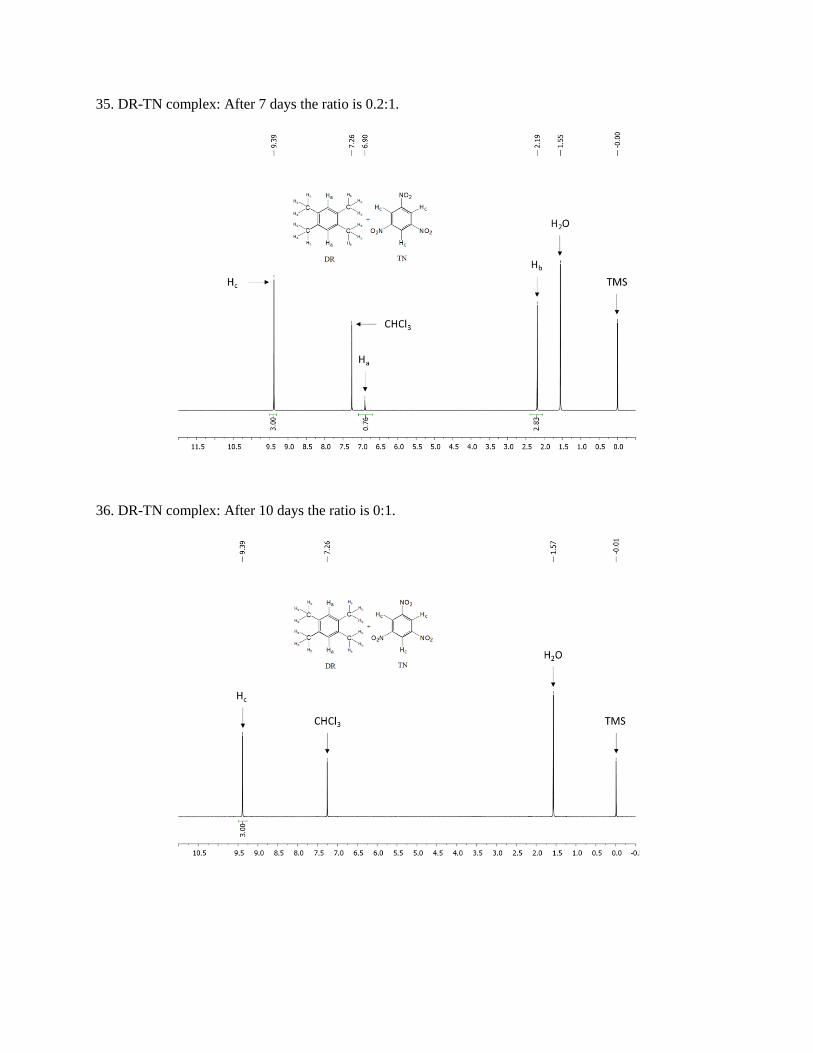
35. DR-TN complex: After 7 days the ratio is 0.2:1.
36. DR-TN complex: After 10 days the ratio is 0:1.

37. DR-TN colour reappeared: The ratio is 1:1.
38. MS-TF complex: Before exposure to open atmosphere the ratio is 1:1 (From crystal structure).

39. MS-TF complex: After 10 hours the ratio is 0:1.
40. MS-TF colour reappeared: Mesitylene is present.

41. MS-PA complex: Before exposure to open atmosphere the ratio is 1:1.
42. MS-PA complex: After 30 minutes the ratio is 0:1

43. MS-PA colour reappeared: After 3 days the ratio is 1:1.
44. MS-PA+DR-TF NMR: On the first day the ratio of the four components is 1:1:1:1.

45. MS-PA+DR-TF NMR: After 4 days the ratio for DR: PA is 0.7:1 (TF does not appear in 1H-NMR).
46. MS-PA+DR-TF NMR: After 7 days only PA peak observed in 1H-NMR.

47. NP-PA+NP-TF NMR: On the first day the ratio of the four components is 1:1:1:1.
48. NP-PA+NP-TF NMR: After 7 days from 1H-NMR 1:1 ratio of NP-PA was observed.
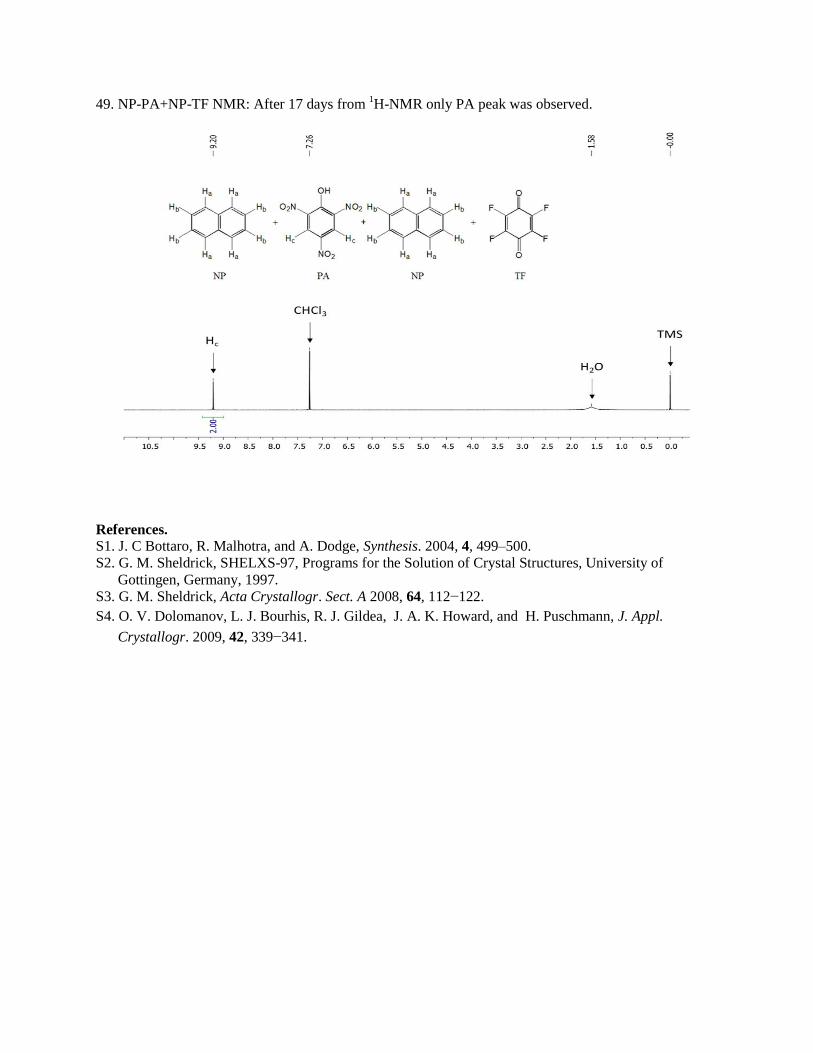
49. NP-PA+NP-TF NMR: After 17 days from 1H-NMR only PA peak was observed.
References.
S1. J. C Bottaro, R. Malhotra, and A. Dodge, Synthesis. 2004, 4, 499–500.
S2. G. M. Sheldrick, SHELXS-97, Programs for the Solution of Crystal Structures, University of
Gottingen, Germany, 1997.
S3. G. M. Sheldrick, Acta Crystallogr. Sect. A 2008, 64, 112−122.
S4. O. V. Dolomanov, L. J. Bourhis, R. J. Gildea, J. A. K. Howard, and H. Puschmann, J. Appl.
Crystallogr. 2009, 42, 339−341.