supplementary information a selective inhibitor of prmt5 ... · elayne chan-penebre1 ... thau f...
TRANSCRIPT

Supplementary Information
A Selective Inhibitor of PRMT5 with In Vivo and In Vitro Potency in MCL Models
Elayne Chan-Penebre1†, Kristy G Kuplast1†, Christina R Majer2, P Ann Boriack-Sjodin1,
Tim J Wigle2, L Danielle Johnston1, Nathalie Rioux1, Michael J Munchhof1, Lei Jin3,
Suzanne L Jacques1, Kip A West1, Trupti Lingaraj1, Kimberly Stickland1, Scott A Ribich1,
Alejandra Raimondi1, Margaret Porter Scott4, Nigel J Waters1, Roy M Pollock2, Jesse J
Smith1, Olena Barbash5, Melissa Pappalardi5, Thau F Ho6, Kelvin Nurse6, Khyati P
Oza6, Kathleen T Gallagher7, Ryan Kruger5, Mikel P Moyer8, Robert A Copeland1,
Richard Chesworth1, Kenneth W Duncan1*†
1Epizyme, Inc., Departments of Biology and Molecular Discovery, Cambridge,
Massachusetts, USA. 2Warp Drive Bio, Cambridge, Massachusetts, USA. 3Agile
Biostructure Solutions, Cambridge, Massachusetts, USA. 4Genentech, San Francisco,
California, USA. 5Cancer Epigenetics DPU, GlaxoSmithKline, Collegeville,
Pennsylvania, USA. 6Department of Biological Reagents and Assay Development,
GlaxoSmithKline, Collegeville, Pennsylvania, USA. 7Discovery Core Technologies and
Capabilities, GlaxoSmithKline, Collegeville, Pennsylvania, USA. 8Raze Therapeutics,
Cambridge, Massachusetts, USA.
[†]These authors contributed equally.
[*]Corresponding Author email: [email protected]
1
Nature Chemical Biology: doi:10.1038/nchembio.1810

Supplementary Results
Supplementary Figures
Supplementary Figure 1. Correlation plots of high throughput assay data from
lead series. (a) Correlation of biochemical IC50 from PRMT5:MEP50 radioactive
Flashplate assay against cell biochemical IC50 with a high throughput (HT) In-Cell
Western format (ICW) assay following symmetric methylation of SmD3 with SMY11
antibody in Z-138 cells over 4 days. (b) Correlation of HT ICW assay IC50 against HT
cell proliferation IC50 using a 96 well format in Z-138 cells over a 5 day continuous
treatment. All data points were determined using a minimum 8 point dose response
curve with n≥2.
2
Nature Chemical Biology: doi:10.1038/nchembio.1810

a
Parameter EPZ015666
IV Bolus PO Dose (mg/kg) 2 10 Cmax (ng/mL) 3500 (1133) tmax (h) 0.333 (0.144) AUC0-t (ng.h/mL) 1110 (91.7) 3847 (1014) AUC0-inf (ng.h/mL) 1113 (90.7) 3850 (1010) t1/2 (h) 1.38 (0.445) 1.62 (0.396) MRT0-inf (h) 0.928 (0.082) 1.35 (0.181) VDss (L/kg) 1.67 (0.210) CL (mL/min/kg) 30.0 (2.37) F (%) 69.2 (18.1)
Supplementary Figure 2. Preclinical pharmacokinetics in CD-1 mouse. (a) Table of
EPZ015666 pharmacokinetic (PK) parameters as determined in mouse. All values
3
Nature Chemical Biology: doi:10.1038/nchembio.1810

reported as mean ± standard deviation (SD), n=3. PK data analysis was performed
using noncompartmental analysis and WinNonlin Phoenix 6.2.1 software. Calculated PK
parameters show low clearance (CL) and high oral bioavailability (%F) for EPZ015666.
Volume of distribution at steady state (VDss) was greater than total body water of 0.7
L/kg. Mean terminal half-life (t1/2) and residence time (MRT) ranged from 0.9 to 1.6
hours. Cmax, the maximum plasma concentration, was determined at time tmax. AUC0-t
and AUC0-inf are the areas under the curve to the last measurable data point and
extrapolated to infinity, respectively. (b) EPZ015666 data are shown graphically as
concentration vs. time profile of mean ± SD (n=3) plasma concentrations following i.v.
bolus (2 mg/kg) or oral gavage (po; 10 mg/kg) administration to CD-1 mouse
(formulated in 20% N-N-dimethylacetamide in water).
4
Nature Chemical Biology: doi:10.1038/nchembio.1810
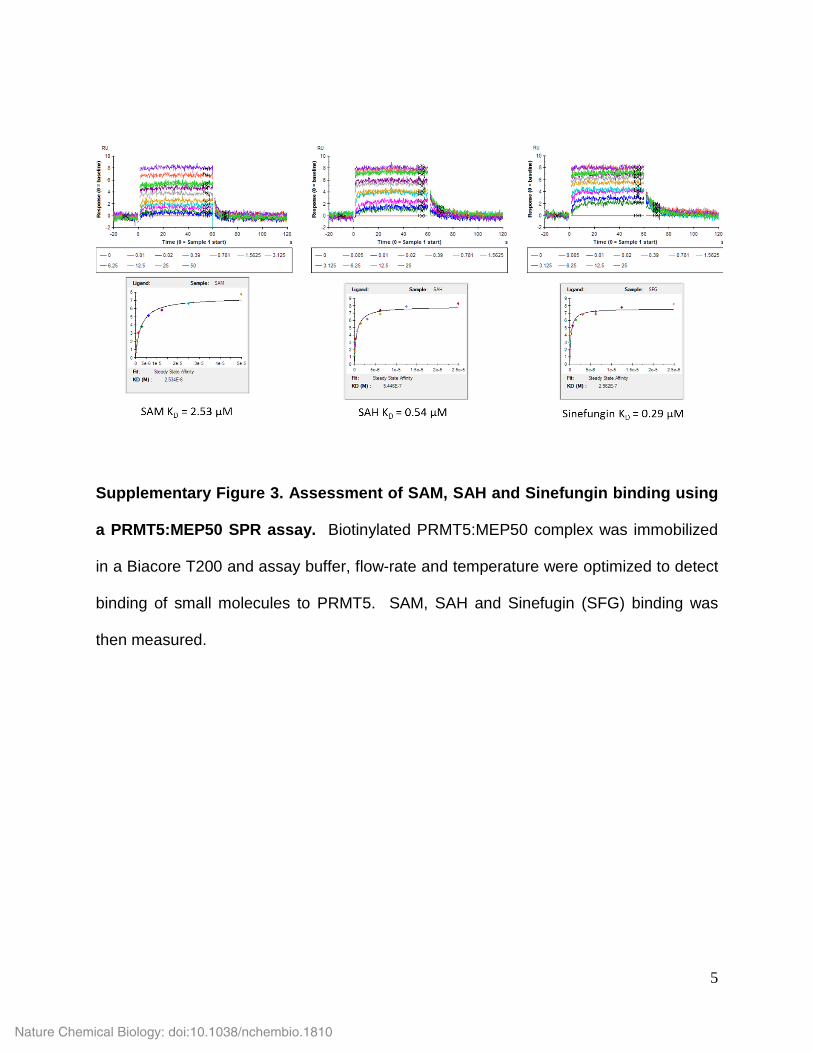
Supplementary Figure 3. Assessment of SAM, SAH and Sinefungin binding using
a PRMT5:MEP50 SPR assay. Biotinylated PRMT5:MEP50 complex was immobilized
in a Biacore T200 and assay buffer, flow-rate and temperature were optimized to detect
binding of small molecules to PRMT5. SAM, SAH and Sinefugin (SFG) binding was
then measured.
5
Nature Chemical Biology: doi:10.1038/nchembio.1810

Supplementary Figure 4. Complex of PRMT5:MEP50-SAM-EPZ015666 is stable
upon withdrawal of SAM from SPR running buffer indicating that EPZ015666 must
dissociate first or simultaneously with SAM. Injections of a saturating amount of
SAM (20 µM) (blue) or co-injections of saturating SAM (20 µM) + saturating EPZ015666
(0.5 µM) (green) were performed against apo PRMT5:MEP50 for 60s then dissociation
rates were monitored. SAM underwent rapid and complete dissociation from
PRMT5:MEP50, while the co-injected sample of SAM and EPZ015666 demonstrated
very slow dissociation from PRMT5:MEP50.
6
Nature Chemical Biology: doi:10.1038/nchembio.1810

Supplementary Figure 5. Surface plasmon resonance analysis of half-life of
EPZ015666 for PRMT5:MEP50 complex measured using a fast-on/fast-off tracer
molecule by SPR and by single-cycle kinetics. The tracer EPZ007345 (2 µM) was
injected with SAM (20 µM) to measure the dissociation of EPZ015666 and SAM. (a)
The tracer method gave a t1/2 of 94 min, while (b) the single-cycle kinetic method gave a
t1/2 of 130 min.
7
Nature Chemical Biology: doi:10.1038/nchembio.1810

Supplementary figure 6. PRMT5 levels in cancer cell lines. Western blot analysis of
whole cell lysates from MCL cell lines and cancer cell lines from other indications.
PRMT5, SDMA and alpha-tubulin (loading control) levels were assessed as shown. Cell
lines “453” and “468” refer to MDA-MB-453 and MDA-MB-468 respectively. Uncut
western blots for PRMT5 and Tubulin can be seen in Supplementary Figure 7.
8
Nature Chemical Biology: doi:10.1038/nchembio.1810

Supplementary Figure 7. Uncut western blots from Supplementary Figure 6.
9
Nature Chemical Biology: doi:10.1038/nchembio.1810

Supplementary Figure 8. Uncut western blots from Figure 3a.
10
Nature Chemical Biology: doi:10.1038/nchembio.1810

Supplementary Figure 9. Effects of EPZ015666 on cellular symmetric dimethyl
arginine substrate SmD3 in MCL cell lines. Concentration-dependent inhibition of
SmD3me2s after four days of treatment with a dose-titration from 0.0003 to 5µM of
EPZ015666 in MCL cell lines Granta-519, Maver-1, Mino, and Jeko-1. SmD3me2s
panel is cropped and the intensity decreased from the uncropped SDMA panel above to
more clearly distinguish changes in this specific band. Uncut western blots for SmD3
can be seen in Supplementary Figure 10.
11
Nature Chemical Biology: doi:10.1038/nchembio.1810

Supplementary Figure 10. Uncut western blots from Supplementary Figure 9.
12
Nature Chemical Biology: doi:10.1038/nchembio.1810

Supplementary Figure 11. Effects of EPZ015666 and control compound 3 on
cellular control protein using CETSA. A375 cells treated for 18 hours with either (a)
1uM EPZ015666 or (b) the inactive compound 3 in cellular thermal shift analysis of
whole cell lysates. No shift in melting temperatures was observed for β-Actin in the
presence of either compound as any changes observed are within SEM. All data
analyzed using a Boltzmann Sigmoidal fit. Each point represents the mean of three
replicates for each temperature ± SEM.
13
Nature Chemical Biology: doi:10.1038/nchembio.1810
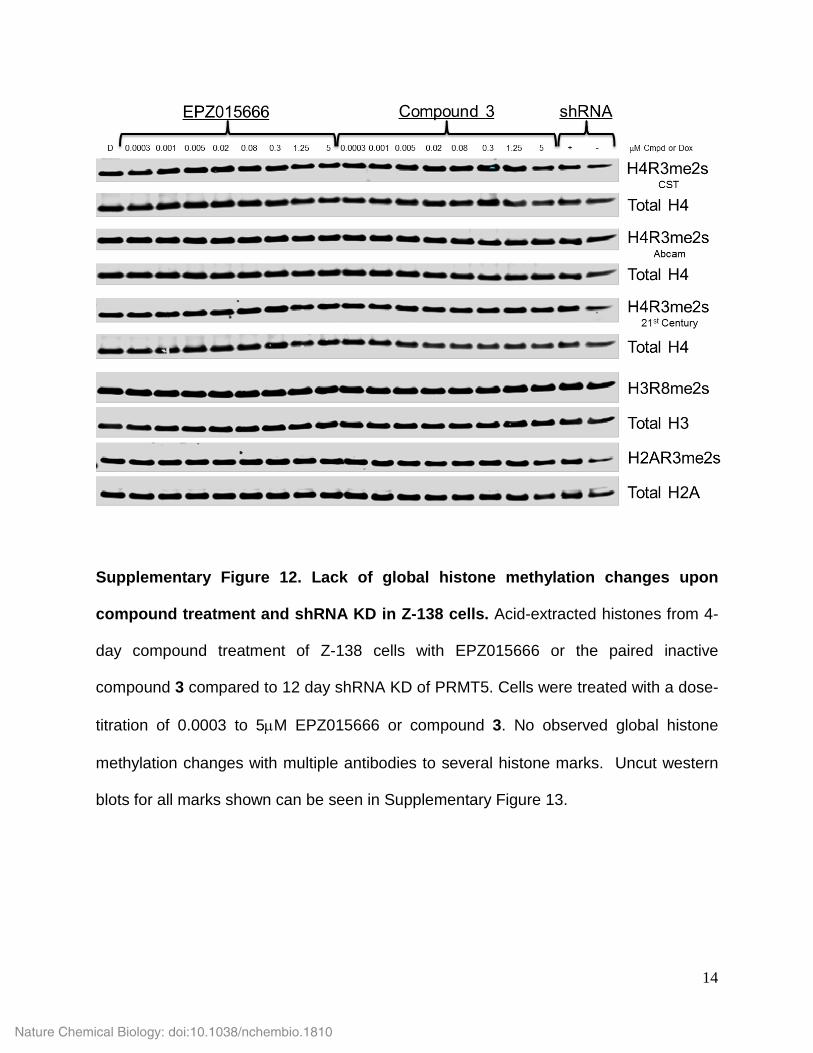
Supplementary Figure 12. Lack of global histone methylation changes upon
compound treatment and shRNA KD in Z-138 cells. Acid-extracted histones from 4-
day compound treatment of Z-138 cells with EPZ015666 or the paired inactive
compound 3 compared to 12 day shRNA KD of PRMT5. Cells were treated with a dose-
titration of 0.0003 to 5µM EPZ015666 or compound 3. No observed global histone
methylation changes with multiple antibodies to several histone marks. Uncut western
blots for all marks shown can be seen in Supplementary Figure 13.
14
Nature Chemical Biology: doi:10.1038/nchembio.1810

Supplementary Figure 13. Uncut western blots from Supplementary Figure 12.
15
Nature Chemical Biology: doi:10.1038/nchembio.1810
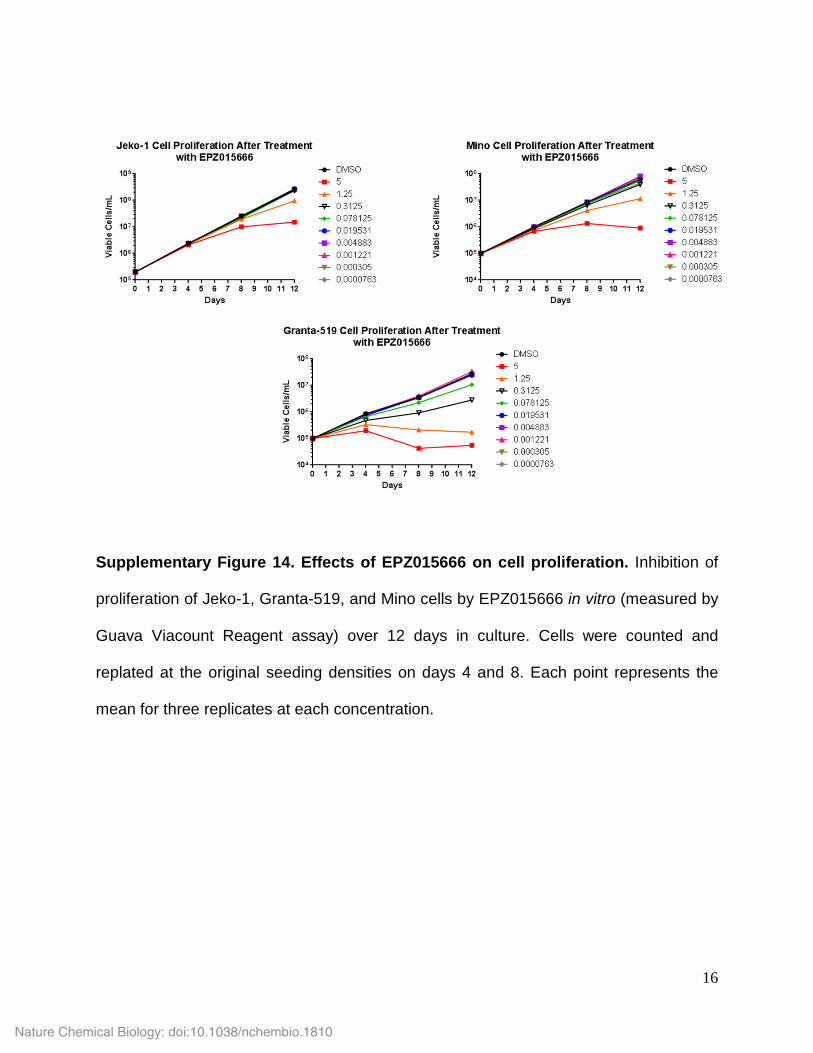
Supplementary Figure 14. Effects of EPZ015666 on cell proliferation. Inhibition of
proliferation of Jeko-1, Granta-519, and Mino cells by EPZ015666 in vitro (measured by
Guava Viacount Reagent assay) over 12 days in culture. Cells were counted and
replated at the original seeding densities on days 4 and 8. Each point represents the
mean for three replicates at each concentration.
16
Nature Chemical Biology: doi:10.1038/nchembio.1810

Supplementary Figure 15. Anti-tumor activity of EPZ015666 in Granta-519
xenografts in SCID mice. (a) Anti-tumor activity induced by twice daily (BID)
administration of EPZ015666 for 18 days at the indicated doses. Compound
administration was stopped on day 18, and tumors were harvested for PD analysis
(data shown as mean values ± SEM, n=10 mice per group). (b) PRMT5 target inhibition
in Granta-519 xenograft tumor tissue collected from mice euthanized on day 18. Each
point represents the ratio of SDMA to total SmD3 normalized to the vehicle control,
measured by ELISA. The horizontal lines represent group mean values ± SD for 2
replicates per sample (10 mice per group). **** P < 0.0001, versus vehicle, 1-way
ANOVA with a Tukey Test.
17
Nature Chemical Biology: doi:10.1038/nchembio.1810

Supplementary Figure 16. Bodyweight change (%) of mice in EPZ015666-Treated
(a) Z-138 Xenograft Mice and (b) Maver-1 xenograft mice in 21-Day and (c) Granta-
519 xenograft mice in 18-day Efficacy Studies. Mean body weight changes induced
by twice daily (BID) administration of EPZ015666 for 21 or 18 days at the indicated
doses. Compound administration was stopped on day 21 (or 18), and tumors were
harvested for PD analysis (data shown as mean values ± SEM, n=10 mice per group).
All doses were well tolerated, with no group experiencing greater than 8.3% body
weight loss over the course of these studies.
18
Nature Chemical Biology: doi:10.1038/nchembio.1810

19
Nature Chemical Biology: doi:10.1038/nchembio.1810

Supplementary Figure 17. EPZ015666 decreases cellular methylation of SmD3 in
tumors of Z-138 xenograft SCID mice collected on day 21. (a) Western blots
performed on whole cell lysates of tumors from 6 representative animals for each group.
SmD3me2s panel is cropped and the intensity decreased from the uncropped SDMA
panel above to more clearly distinguish changes in this specific band.
(b) Quantification performed by comparing SmD3me2s to total SmD3 signal for each
individual tumor and normalizing to vehicle average. The horizontal lines represent
group mean values ± SD for 6 mice per group. Uncut western blots for SmD3 can be
seen in Supplementary Figure 18.
20
Nature Chemical Biology: doi:10.1038/nchembio.1810

Supplementary Figure 18. Uncut western blots from Supplementary Figure 17a.
21
Nature Chemical Biology: doi:10.1038/nchembio.1810

Supplementary Figure 19. EPZ015666 decreases cellular methylation of SmD3 in
tumors of Maver-1 xenograft SCID mice collected on day 22. (a) Western blots
22
Nature Chemical Biology: doi:10.1038/nchembio.1810

performed on whole cell lysates of tumors from 6 representative animals for each group.
SmD3me2s panel is cropped and the intensity decreased from the uncropped SDMA
panel above to more clearly distinguish changes in this specific band.
(b) Quantification performed by comparing SmD3me2s to total SmD3 signal for each
individual tumor and normalizing to vehicle average. The horizontal lines represent
group mean values ± SD for 6 mice per group. Uncut western blots for SmD3 can be
seen in Supplementary Figure 20.
23
Nature Chemical Biology: doi:10.1038/nchembio.1810
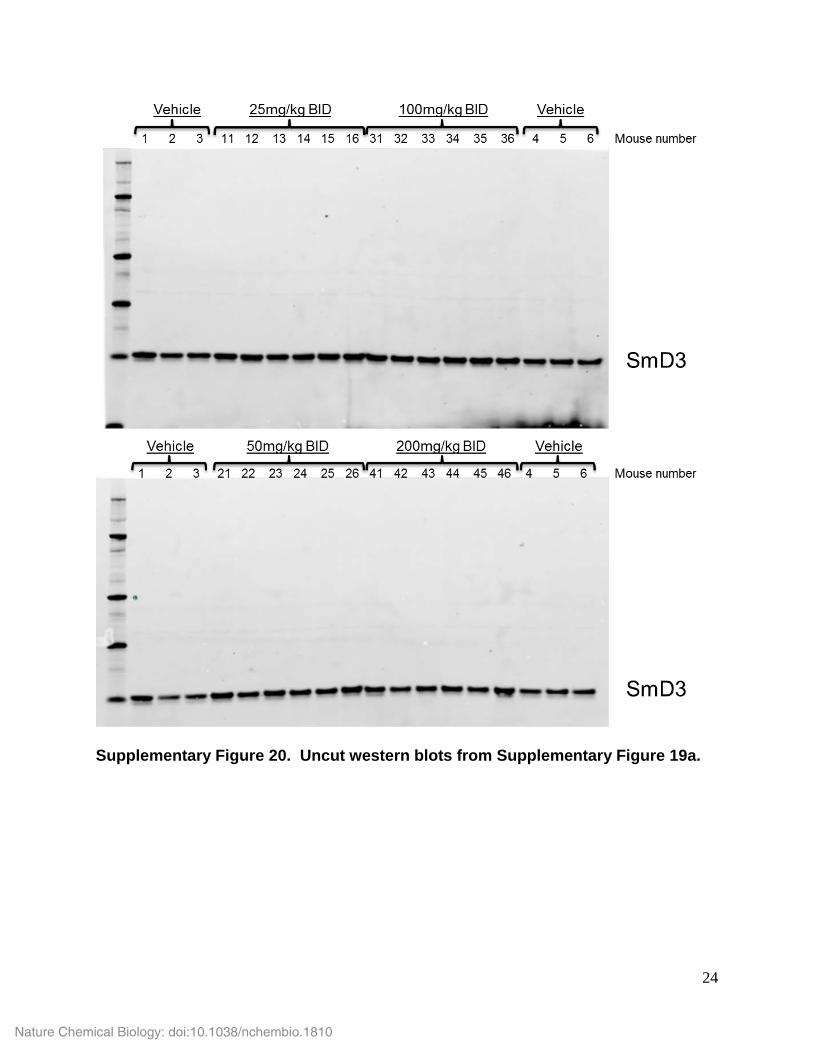
Supplementary Figure 20. Uncut western blots from Supplementary Figure 19a.
24
Nature Chemical Biology: doi:10.1038/nchembio.1810

Supplementary Figure 21. EPZ015666 decreases cellular methylation of SmD3 in
tumors of Granta-519 xenograft SCID mice collected on day 18. (a) Western blots
25
Nature Chemical Biology: doi:10.1038/nchembio.1810

performed on whole cell lysates of tumors from 6 representative animals for each group.
SmD3me2s panel is cropped and the intensity decreased from the uncropped SDMA
panel above to more clearly distinguish changes in this specific band.
(b) Quantification performed by comparing SmD3me2s to total SmD3 signal for each
individual tumor and normalizing to vehicle average. The horizontal lines represent
group mean values ± SD for 6 mice per group. Uncut western blots for SmD3 can seen
in Supplementary Figure 22.
26
Nature Chemical Biology: doi:10.1038/nchembio.1810
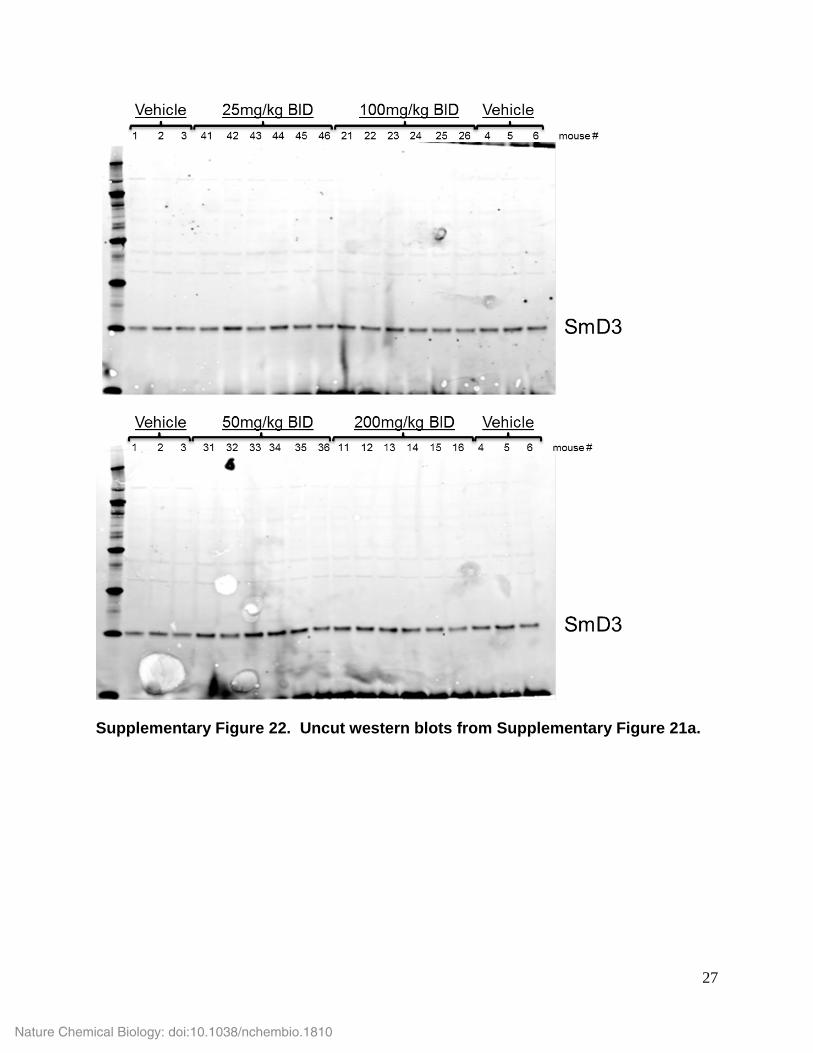
Supplementary Figure 22. Uncut western blots from Supplementary Figure 21a.
27
Nature Chemical Biology: doi:10.1038/nchembio.1810

Supplementary Figure 23. Specificity of custom H3R8me2s antibody against full-
length synthetic histones with alternative modifications. Western blot of full-length
single-modification synthetic histones (1µg per lane loaded) probed with H3R8me2s
affinity-purified antibody (1:5000 dilution).
28
Nature Chemical Biology: doi:10.1038/nchembio.1810

Supplementary Tables
Supplementary Table 1: Summary of high throughput screening data
Category Parameter Description
Assay Type of assay In vitro, Homogeneous Time Resolved Fluorescence (HTRF) assay
Target PRMT5:MEP50 Complex
Primary measurement Detection of time resolved fluorescence
Key reagents PRMT5:MEP50 enzyme complex, peptide, Streptavidin-D2, Anti-Rabbit IgG-Cryptate, Anti-Histone H3 mono-methyl R3 antibody
Assay protocol Compound was incubated for 30 min with 2 µL per well of 8nM PRMT5/MEP50 (final assay concentration in 4 μL) and 50nM of peptide representing human histone H4 residues 1-15 (final assay concentration in 4 μL) in 1X assay buffer (20 mM Bicine [pH 7.6], 0.010% Tween-20, 0.005% Bovine Skin Gelatin, and 2 mM DTT, 25mM NaCl). A total of 1 µL per well of substrate mix comprised of assay buffer with 200nM SAM (final assay concentration in 4 μL) was added to initiate the reaction. Reactions were incubated for 90 min at room temperature and quenched with 1 µL per well of 3nM Streptavidin-D2, 3nM Anti-Rabbit IgG-Cryptate, 1x Anti-Histone H4 mono-methyl R3 antibody, and 200 mM potassium flouride (all final concentrations in 4ul of assay buffer). After an incubation time of 30 minutes, the plate was read on an Envision.
Additional comments N/A
Library Library size 370,000
Library composition 350,000 lead-like compounds & 20,000 fragments Source Confidential Additional comments N/A
Screen Format 1536 well plates
Concentration(s) tested 10 uM, 1% DMSO Plate controls DMSO for 0% Inhibition, SAH at IC50 for 50%
Inhibition, and SAH at 100X IC50 for 100% Inhibition Reagent/ compound dispensing system Multiflo peristaltic pump
Detection instrument and software PerkinElmer, Envision Assay validation/QC 50% Inhibition between 30%-70%, Z’ > 0.5 Correction factors N/A
Normalization N/A
Additional comments N/A
Post-HTS analysis Hit criteria 30% Inhibition and above Hit rate 0.7%
Additional assay(s) After removal of compounds containing pan-assay interference structures (PAINS) and additional known frequent hitter substructures, a subset of 800 compounds were selected for follow-up activity confirmation in enzyme based flashplate assay and a redox assay to identify reactive compounds that inhibit the enzyme in an intractable manner.
Confirmation of hit purity and structure Compounds were repurchased, re-synthesized and verified by LC/MS, and potency was confirmed at every step.
Additional comments N/A
29
Nature Chemical Biology: doi:10.1038/nchembio.1810

Supplementary Table 2: Data collection and refinement statistics for EPZ015666 complexes in PRMT5-MEP50 SAM SFG SAH Data collection Space group I222 I222 I222 Cell dimensions a, b, c (Å) 102.3, 138.2, 178.0 103.7, 138.0, 178.0 102.4, 138.1, 178.3 α, β, γ (°) 90.0, 90.0, 90.0 90.0, 90.0, 90.0 90.0, 90.0, 90.0 Resolution (Å) 50.00-2.85
(2.95-2.85) 44.75-2.35 (2.41-2.35)
50.00-3.05 (3.16-3.05)
Rsym or Rmerge 0.117 (0.576) 0.045 (0.646) 0.148 (0.653) I / σI 13.8 (2.2) 21.0 (2.5) 11.3 (2.2) Completeness (%) 96.5 (78.0) 99.6 (99.4) 95.1 (75.8) Redundancy 5.9 (4.9) 5.0 (5.0) 5.8 (5.3) Refinement Resolution (Å) 50.00-2.85 44.75-2.35 50.00-3.05 No. reflections 27160 48418 21785 Rwork / Rfree 0.206/0.260 0.202/0.254 0.214/0.274 No. atoms Protein 7358 7412 7402 EPZ015666/Cofactor/Glycerol 28/27/6 28/27/18 28/26/0 Water 61 140 1 B-factors Protein 65.8 63.3 83.7 EPZ015666/Cofactor/Glycerol 49.3/50.8/82.8 46.2/42.6/76.3 87.0/66.8/- Water 45.0 51.0 36.2 R.m.s. deviations Bond lengths (Å) 0.005 0.008 0.004 Bond angles (°) 0.972 1.242 0.927 1 crystal was used for each structure. *Values in parentheses are for highest-resolution shell.
30
Nature Chemical Biology: doi:10.1038/nchembio.1810

Supplementary Table 3. Long term proliferation IC50/IC90 values and SmD3me2s (SDMA) western IC50 values in MCL cell lines dosed with EPZ015666. A panel of 5 MCL cell lines were treated with EPZ015666 for 12 days in the long-term proliferation assay. IC50s and IC90s were calculated in GraphPad Prism (non-linear regression analysis, top and bottom of the curves were fixed to 100 and 0%, respectively) for each line using split-adjusted cell counts at day 12. IC50s and IC90s ranged from 4-347nM across all types of MCL cell lines tested (n=1 for all cell lines). SDMA western blot IC50s for 4-day EPZ015666 treatment are shown for the MCL cell line panel. Western blot images for this data are available in Supplementary fig. 7.
EPZ015666
Cell Line LTP IC50
(nM) LTP IC90 (nM)
SDMA Western Blot IC50 (nM)
Z-138 96 208 44
Granta-519 61 243 4
Maver-1 450 3060 42
Mino 103 2080 78
Jeko-1 904 3430 347
31
Nature Chemical Biology: doi:10.1038/nchembio.1810

Supplementary Note
Many of the intermediates have previously been described in WO2014100719.
Unless otherwise noted, intermediates were characterized by LC-MS to confirm the
mass matched the structure and carried on to the next step without further purification.
Compound 1, EPZ007345, 1-(3-((cyclopentylamino)methyl)phenoxy)-3-(3,4-
dihydroisoquinolin-2(1H)-yl)propan-2-ol was purchased from ChemBridge, Catalog
#39852262, 98% HPLC purity.
Compound 2, EPZ015666, (S)-N-(3-(3,4-dihydroisoquinolin-2(1H)-yl)-2-hydroxypropyl)-
6-(oxetan-3-ylamino)pyrimidine-4-carboxamide.
Step 1: (R)-2-(oxiran-2-ylmethyl)-1,2,3,4-tetrahydroisoquinoline
NO
To a solution of 1,2,3,4-tetrahydroisoquinoline (400g, 6mol) in tetrahydrofuran (THF)
(4000mL) was added potassium fluoride (KF) (880g, 9mol) and (S)-oxiran-2-ylmethyl 3-
nitrobenzenesulfonate (856g, 6.8mol) at 0°C. After the addition was complete, the
resulting mixture was stirred at 20°C for 16 h then filtered. The filtrate was concentrated
in vacuum to give the desired product (400g, crude) which was used for next step
without the further purification. LCMS (m/z): 190.1 (M+1).
Step 2: (S)-1-amino-3-(3,4-dihydroisoquinolin-2(1H)-yl)propan-2-ol
NH2N
OH
32
Nature Chemical Biology: doi:10.1038/nchembio.1810

A solution of (R)-2-(oxiran-2-ylmethyl)-1,2,3,4-tetrahydroisoquinoline (80g, 0.42mol) in
NH3/EtOH (10L) was sealed and stirred at 80°C for 3 h. After completion, the reaction
mixture was concentrated under vacuum. The residue was purified by column
chromatography separation to afford desired product (48g, Yield 55%) which was used
for the next step without further purification. LCMS (m/z): 207.1 (M+1).
Step 3: (S)-6-chloro-N-(3-(3,4-dihydroisoquinolin-2(1H)-yl)-2-hydroxypropyl)pyrimidine-
4-carboxamide
NNH
OH
O
N
N
Cl
To a stirred and cooled (0 oC) solution of (S)-1-amino-3-(3,4-dihydroisoquinolin- 2(1H)-
yl) propan-2-ol (7.15 g, 34.7 mmol) and triethylamine (Et3N) (14.0 g, 138.8 mmol) in
dichloromethane (DCM) (100 mL) was added 6-chloropyrimidine-4-carbonyl chloride
(5.5 g, 34.7 mmol). After addition, the resulting mixture was stirred at 25 oC for 16 h, at
which time LCMS showed the completion of the reaction. The solvent was evaporated
and the residue purified by flash chromatography to give the (S)-6-chloro-N- (3-(3,4-
dihydroisoquinolin-2(1H)-yl)-2-hydroxypropyl)pyrimidine-4-carboxamide (7.2 g, yield:
60 %). LCMS (m/z): 347.0 [M+H]+
Step 4: (S)-N-(3-(3,4-dihydroisoquinolin-2(1H)-yl)-2-hydroxypropyl)-6-(oxetan-3-
ylamino)pyrimidine-4-carboxamide
NNH
OH
O
N
N
NH
O
33
Nature Chemical Biology: doi:10.1038/nchembio.1810

To a solution of (S)-6-chloro-N-(3-(3,4-dihydroisoquinolin-2(1H)-yl)-2-hydroxy
propyl)pyrimidine-4-carboxamide (347 mg, 1 mmol) in iso-propylamine (i-PrOH) (5 mL)
was added oxetan-3-amine (73.1 mg, 1 mmol) and diisopropyl ethylamine (DIPEA) (129
mg, 1 mmol). The resulting mixture was stirred at 110 ºC for 16 hours, at which time
LCMS showed the completion of the reaction. After evaporation of the solvent, the
residue was purified by preparative HPLC to give the target compound (S)-N-(3-(3,4-
dihydroisoquinolin-2(1H)-yl)-2-hydroxypropyl)-6-(oxetan-3-ylamino)pyrimidine-4-
carboxamide (62.5 mg, yield: 16.3 %). 1H NMR (400MHz, MeOD-d4) δ 8.24 (s, 1H), 7.15
- 7.05 (m, 4H), 7.02 - 6.98 (m, 1H), 5.09 (s, 1H), 4.95 (t, J=6.8 Hz, 2H), 4.59 (t, J=6.3
Hz, 2H), 4.10 - 4.03 (m, 1H), 3.72 (s, 2H), 3.56 - 3.46 (m, 2H), 2.96 - 2.91 (m, 2H), 2.87
- 2.80 (m, 2H), 2.65 (d, J=6.3 Hz, 2H); 13C NMR (101 MHz, DMSO-d6) δ ppm 29.7, 45.7,
47.4, 52.8, 57.6, 63.7, 68.1, 79.4, 104.9, 126.8, 127.4, 127.6, 129.6, 135.2, 135.5, 155.
8, 158.8, 164.1, 165.9 HRMS; HRMS (m/z): [M+H]+ Calcd. for C20H26N5O3. 384.2036;
found 384.2027.
Compound 3, EPZ019896, (S)-N-(2-hydroxy-3-(piperidin-1-yl)propyl)-6-(oxetan-3-
ylamino)pyrimidine-4-carboxamide
Step 1: (R)-1-(oxiran-2-ylmethyl)piperidine
NO
A solution of (S)-oxiran-2-ylmethyl 3-nitrobenzenesulfonate (18.3g, 70.6mmol),
piperidine (5g, 58.8mmol) and potassium fluoride (6.7g, 117.6mmol) was combined in
THF (50mL) and stirred at 20oC. After 24 hrs, the solid was filtered off and filtrate
34
Nature Chemical Biology: doi:10.1038/nchembio.1810
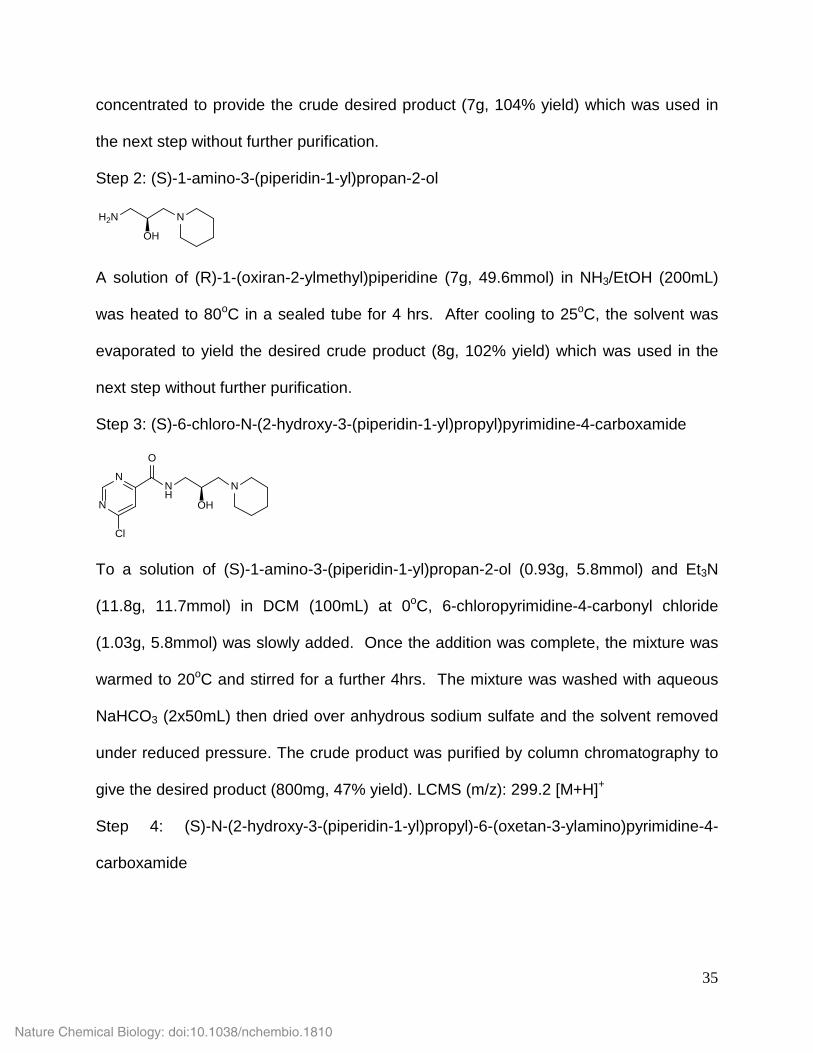
concentrated to provide the crude desired product (7g, 104% yield) which was used in
the next step without further purification.
Step 2: (S)-1-amino-3-(piperidin-1-yl)propan-2-ol
NH2N
OH
A solution of (R)-1-(oxiran-2-ylmethyl)piperidine (7g, 49.6mmol) in NH3/EtOH (200mL)
was heated to 80oC in a sealed tube for 4 hrs. After cooling to 25oC, the solvent was
evaporated to yield the desired crude product (8g, 102% yield) which was used in the
next step without further purification.
Step 3: (S)-6-chloro-N-(2-hydroxy-3-(piperidin-1-yl)propyl)pyrimidine-4-carboxamide
NNH
OH
O
N
N
Cl
To a solution of (S)-1-amino-3-(piperidin-1-yl)propan-2-ol (0.93g, 5.8mmol) and Et3N
(11.8g, 11.7mmol) in DCM (100mL) at 0oC, 6-chloropyrimidine-4-carbonyl chloride
(1.03g, 5.8mmol) was slowly added. Once the addition was complete, the mixture was
warmed to 20oC and stirred for a further 4hrs. The mixture was washed with aqueous
NaHCO3 (2x50mL) then dried over anhydrous sodium sulfate and the solvent removed
under reduced pressure. The crude product was purified by column chromatography to
give the desired product (800mg, 47% yield). LCMS (m/z): 299.2 [M+H]+
Step 4: (S)-N-(2-hydroxy-3-(piperidin-1-yl)propyl)-6-(oxetan-3-ylamino)pyrimidine-4-
carboxamide
35
Nature Chemical Biology: doi:10.1038/nchembio.1810

NNH
OH
O
N
N
NH
O
To a solution of (S)-6-chloro-N-(2-hydroxy-3-(piperidin-1-yl)propyl)pyrimidine-4-
carboxamide (300mg, 1.004mmol) in isopropanol (15mL) was added oxetan-3-amine
(73.4mg, 1.004mmol) and DIPEA (254mg, 2.008mmol) and the reaction mixture was
stirred and heated at 80oC for 18 hrs. The reaction mixture was concentrated under
reduced pressure and purified by preparative HPLC to yield the desired compound
(10mg, 0.03 mmol, 3% yield). 1H NMR (400MHz, MeOD-d4) δ 8.45 (s, 1H), 7.14 (s, 1H),
5.11 (m, 1H), 4.96 (t, 2H, J=6.4 Hz), 4.61 (t, 2H, J=6.4Hz), 3.94 (m, 1H), 3.47 (dd, 1H,
J=5.2, 5.2Hz), 3.41 (dd, 1H, J=6.8, 6.8Hz), 2.47 (m , 4H), 2.40 (d, 2H, J=6.4Hz), 1.59
(m, 4H), 1.47 (m, 2H); 13C NMR (101 MHz, DMSO-d6) δ ppm:25.3, 26.8, 45.6, 47.4,
56.3, 64.7, 68.0, 79.4, 104.9, 155.8, 158.9, 164.2, 165.9; HRMS (m/z): [M+H]+ calcd.
for C16H26N5O3, 336.2036; found 336.2040.
36
Nature Chemical Biology: doi:10.1038/nchembio.1810