supplementary figure 1 1,000,000 p=0 - springer static …10.1186... · ·...
TRANSCRIPT

1
Supplementary Figure 1
Supplementary Figure 1: Aligned reads number for each sample. Each dot represents one sample pair. The number of the aligned reads for the diagnosis sample of the pair was shown on the x-axis, and the number for the aligned reads for the relapse sample for the pair was shown on the y-axis.
Diagnosis
Relapse
0
200,000
400,000
600,000
800,000
1,000,000 p=0.64N
umbe
r of
Map
ped
Rea
ds

2
Supplementary Figure 2
Supplementary Figure 2: Normalized VDJ counts (per 1000 mapped reads) of each sample.
Diagnosis
Relapse
0
5
10
1515
20
25
30 p=0.85N
orm
aliz
ed V
DJ
Cou
nt (#
VD
J pe
r 10
00 m
appe
d re
ads)

3
Supplementary Figure 3
Supplementary Figure 3: Cumulative frequency of non-major VDJ rearrangements in a pair of bone marrow and lymphoma samples.
010
020
030
040
00
20
40
60
80
100
Non-Major VDJ Recombination (Ordered by abundance, most to least)
Cum
ulat
ive
Freq
uenc
y
LYM7BM7
4
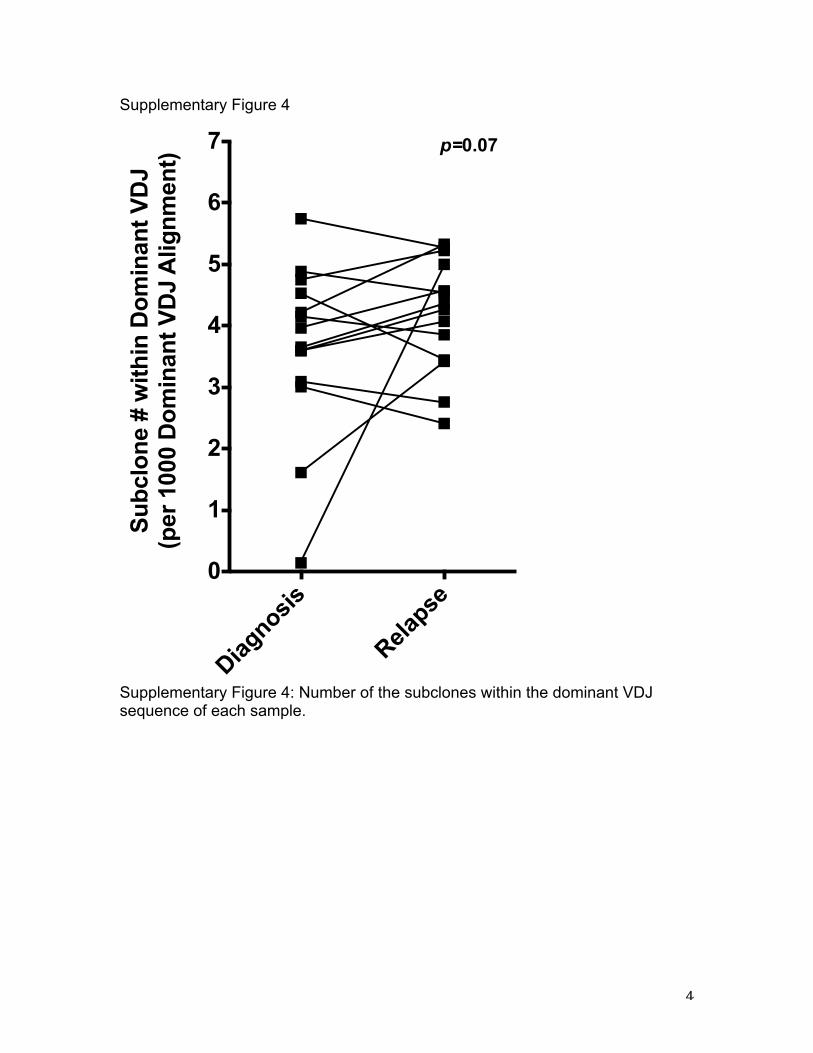
Supplementary Figure 4
Supplementary Figure 4: Number of the subclones within the dominant VDJ sequence of each sample.
Diagnosis
Relapse
0
1
2
3
4
5
6
7 p=0.07S
ubcl
one
# w
ithin
Dom
inan
t VD
J (p
er 1
000
Dom
inan
t VD
J A
lignm
ent)

5
Supplementary Figure 5. Phylogenetic Trees. A. Pair 1
Patient 1 around region IGHV4-34*02 IGHD3-22*01 IGHJ5*02
1D clones 1R1 clonesScale for clone counts
0 1k 10k 100k 1m
V D J

6
Patient 1 around region IGHV4-34*02 IGHD3-22*01 IGHJ5*02
1D clones 1R3 clonesScale for clone counts
0 1k 10k 100k 1m
V D J

7
B. Pair 2
germline
Patient 2 around region IGHV4-59*01 IGHD6-19*01 IGHJ5*02
2D clones 2R clonesScale for clone counts
0 1k 10k 100k 1m
V D J

8
C. Pair 3
germline
Patient 3 around region IGHV3-49*05 IGHD2-8*01 IGHJ4*02
3D1 clones 3R2_1 clonesScale for clone counts
0 1k 10k 100k 1m
V D J

9
germline
Patient 3 around region IGHV3-49*04 IGHD3-22*01 IGHJ4*02
3D1 clones 3R2_2 clonesScale for clone counts
0 1k 10k 100k 1m
V D J

10
D. Pair 4
Patient 4 around region IGHV3-7*03 IGHD4-17*01 IGHJ6*04
4D clones 4R clonesScale for clone counts
0 1k 10k 100k 1m
V D J

11
E. Pair 5
germline
Patient 9 around region IGHV4-34*08 IGHD6-13*01 IGHJ6*03
9D clones 9R_1 clonesScale for clone counts
0 1k 10k 100k 1m
V D J

12
F. Pair 7
germline
Patient 13 around region IGHV3-23*04 IGHD3-9*01 IGHJ6*02
13D1 clones 13R clonesScale for clone counts
0 1k 10k 100k 1m
V D J

13
germline
Patient 13 around region IGHV3-23*04 IGHD3-9*01 IGHJ6*02
13D2 clones 13R clonesScale for clone counts
0 1k 10k 100k 1m
V D J

14
G. Pair 8
germline
Patient 14 around region IGHV4-34*02 IGHD6-13*01 IGHJ6*03
14D clones 14R_1 clonesScale for clone counts
0 1k 10k 100k 1m
V D J

15
germline
Patient 14 around region IGHV1-18*01 IGHD6-13*01 IGHJ2*01
14D clones 14R_2 clonesScale for clone counts
0 1k 10k 100k 1m
V D J

16
H. Pair 9
germline
Patient 15 around region IGHV3-48*02 IGHD2-2*03 IGHJ4*02
15D2 clones 15PR_2 clonesScale for clone counts
0 1k 10k 100k 1m
V D J

17
I. Pair 10
germline
Patient 16 around region IGHV4-34*02 IGHD6-13*01 IGHJ6*03
16D1 clones 16R_1 clonesScale for clone counts
0 1k 10k 100k 1m
V D J
18
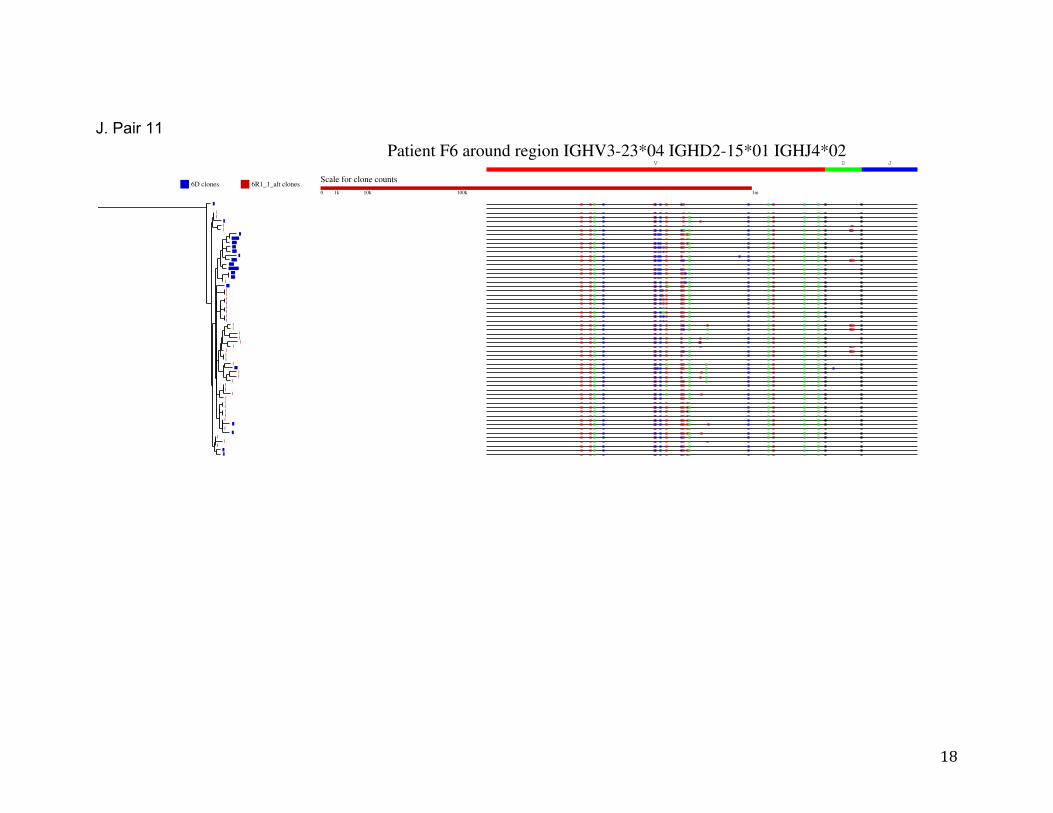
J. Pair 11
Patient F6 around region IGHV3-23*04 IGHD2-15*01 IGHJ4*02
6D clones 6R1_1_alt clonesScale for clone counts
0 1k 10k 100k 1m
V D J

19
germline
Patient F6 around region IGHV3-23*04 IGHD3-22*01 IGHJ4*02
6D clones 6R1_2 clonesScale for clone counts
0 1k 10k 100k 1m
V D J
20
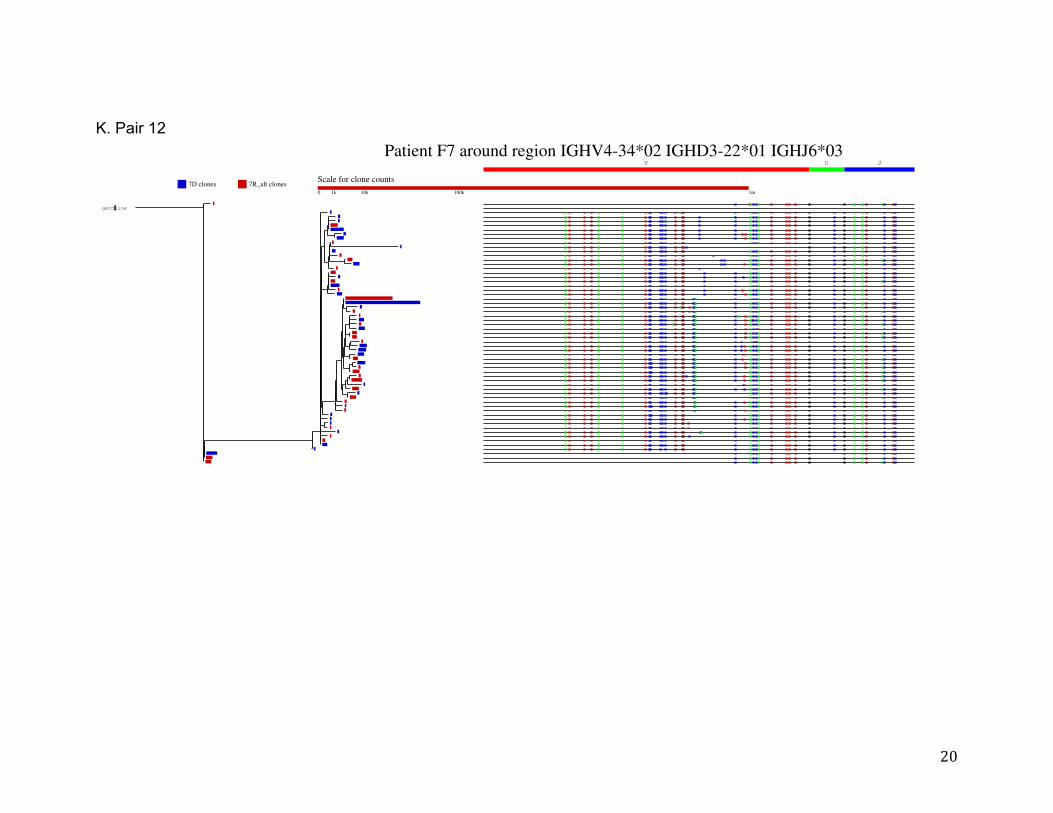
K. Pair 12
germline
Patient F7 around region IGHV4-34*02 IGHD3-22*01 IGHJ6*03
7D clones 7R_alt clonesScale for clone counts
0 1k 10k 100k 1m
V D J

21
L. Pair 13
germline
Patient SPF6 around region IGHV3-7*03 IGHD3-10*02 IGHJ4*02
6-2_1 clones 6-3_1 clonesScale for clone counts
0 1k 10k 100k 1m
V D J

22
M. Pair 14
Supplementary Figure 5: Phylogenetic trees for each diagnosis/relapse pair. Phylogenetic analysis of the SHM profiles of the major VHDJH rearrangements between each diagnosis and relapse pair was presented in each figure. The blue bar represents the diagnosis rearrangement and the red bar represents the relapse rearrangement. The length of the bar indicates the abundance of the rearrangement.
germline
Patient SPF10 around region IGHV3-49*04 IGHD3-10*01 IGHJ5*02
10-1_1 clones 10-2_1 clonesScale for clone counts
0 1k 10k 100k 1m
V D J
23
Supplementary Figure 6 A. B.
C.
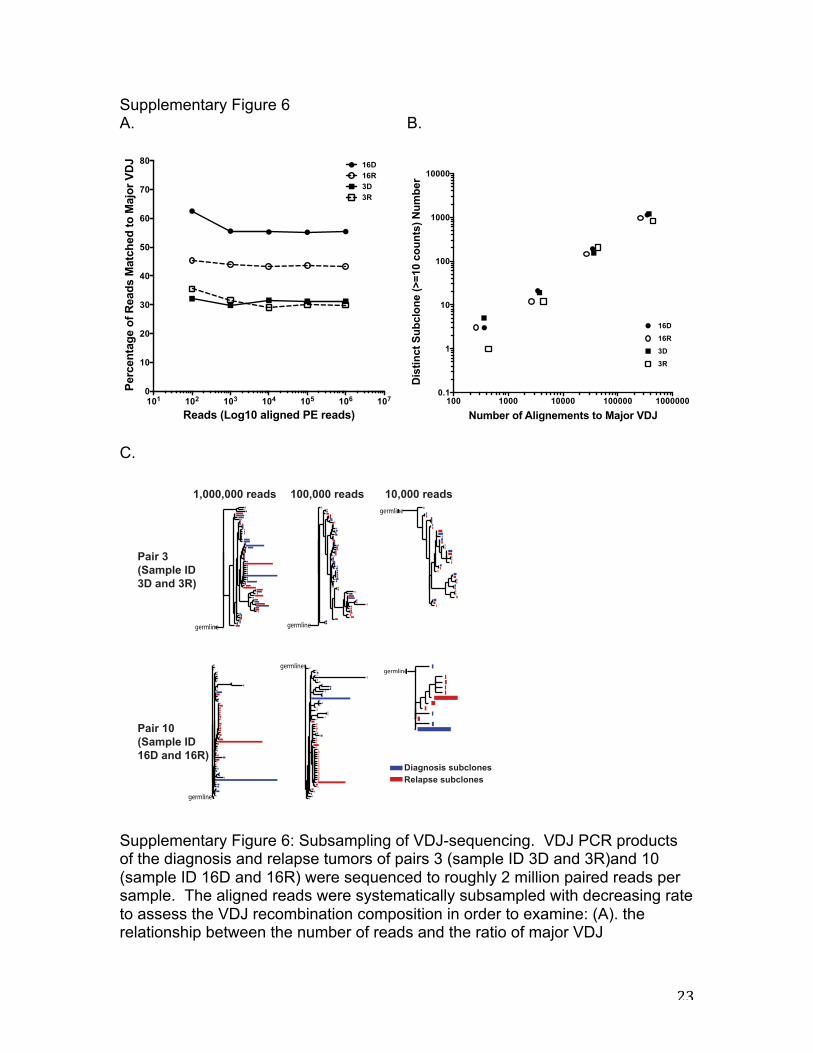
Supplementary Figure 6: Subsampling of VDJ-sequencing. VDJ PCR products of the diagnosis and relapse tumors of pairs 3 (sample ID 3D and 3R)and 10 (sample ID 16D and 16R) were sequenced to roughly 2 million paired reads per sample. The aligned reads were systematically subsampled with decreasing rate to assess the VDJ recombination composition in order to examine: (A). the relationship between the number of reads and the ratio of major VDJ
101 102 103 104 105 106 1070
10
20
30
40
50
60
70
80
Reads (Log10 aligned PE reads)
Per
cent
age
of R
eads
Mat
ched
to M
ajor
VD
J 16D16R3D3R
100 1000 10000 100000 10000000.1
1
10
100
1000
10000
Number of Alignements to Major VDJD
istin
ct S
ubcl
one
(>=1
0 co
unts
) Num
ber
3D
16R
3R
16D
germline
germline
germline germline
germline
germline
1,000,000 reads 100,000 reads 10,000 reads
Pair 3(Sample ID3D and 3R)
Pair 10(Sample ID16D and 16R)
Diagnosis subclonesRelapse subclones

24
rearrangement; (B). the relationship between the number of aligned reads to major VDJ rearrangement and the number of the subclones within the major VDJ rearrangement; and (C). the phenogenetic trees at different reads number cutoffs.

25
Supplementary Figure 7:
Supplementary Figure 7: Distance of relapse subclones and diagnosis subclones from the major diagnosis subclone. Each bar represents either one diagnosis subclone (red) or relapse subclone (blue). Numbers on X-axis indicate the number of the mutations in that subclone that were different from the major diagnosis subclone.
0 3 6 9 13 17 21 25 29 33 37 41 45 49 53 57
Pair 10
Distance from Major Diagnosis Clonal Alignment (number of mutations)
Num
ber o
f Map
ped
VDJ
Sequ
ence
s
010
000
2000
030
000
4000
0
DiagnosisRelapse
0 3 6 9 13 17 21 25 29 33 37 41 45 49 53 57
Pair 16
Distance from Major Diagnosis Clonal Alignment (number of mutations)
Num
ber o
f Map
ped
VDJ
Sequ
ence
s
050
000
1000
0015
0000 Diagnosis
Relapse
0 3 6 9 13 17 21 25 29 33 37 41 45 49 53 57
Pair 2
Distance from Major Diagnosis Clonal Alignment (number of mutations)
Num
ber o
f Map
ped
VDJ
Sequ
ence
s
050
000
1000
0015
0000 Diagnosis
Relapse
0 3 6 9 13 17 21 25 29 33 37 41 45 49 53 57
Pair 12
Distance from Major Diagnosis Clonal Alignment (number of mutations)
Num
ber o
f Map
ped
VDJ
Sequ
ence
s
010
000
2000
030
000
4000
050
000
6000
070
000
DiagnosisRelapse
Pair 7 Pair 13
Pair 2 Pair 9

26
Supplementary Figure 8
Supplementary Figure 8. The relationship between clonal diversity at diagnosis (measured by entropy) and time to relapse. Red triangles represent diagnosis samples of the early-divergent mode. Green circles represent diagnosis samples of the late-divergent mode.
0.0 0.1 0.2 0.3 0.4 0.5 0.6 0.7 0.8 0.9 1.00
1
2
3
4
5
6
7
8
9
10
11
12
Entropy
Tim
e to
Rel
aspe
(yr)
R2=0.009, p=0.4595
27
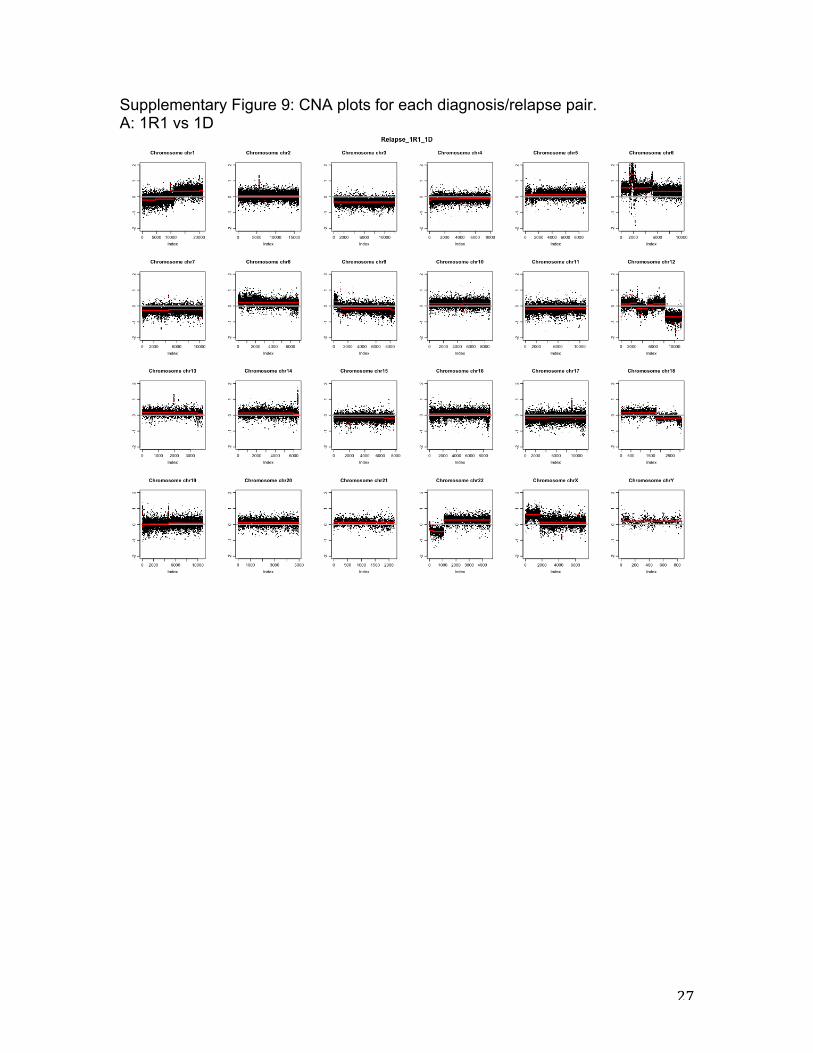
Supplementary Figure 9: CNA plots for each diagnosis/relapse pair. A: 1R1 vs 1D

28
B: 1R2 vs 1D:

29
C: 1R3 vs 1D:

30
D: 2R vs 2D:

31
E: 3R vs 3D:

32
F: 13R vs 13D2:

33
G: 14R vs 14D:

34
H: 15R vs 15D:
Supplementary Figure 9: CNA plots for each diagnosis/relapse pair. Copy number ratio was calculated between the diagnosis and relapse samples for each exon (represents by black dots, see Methods). The red lines represent the smoothed ratio along each chromosome.
35
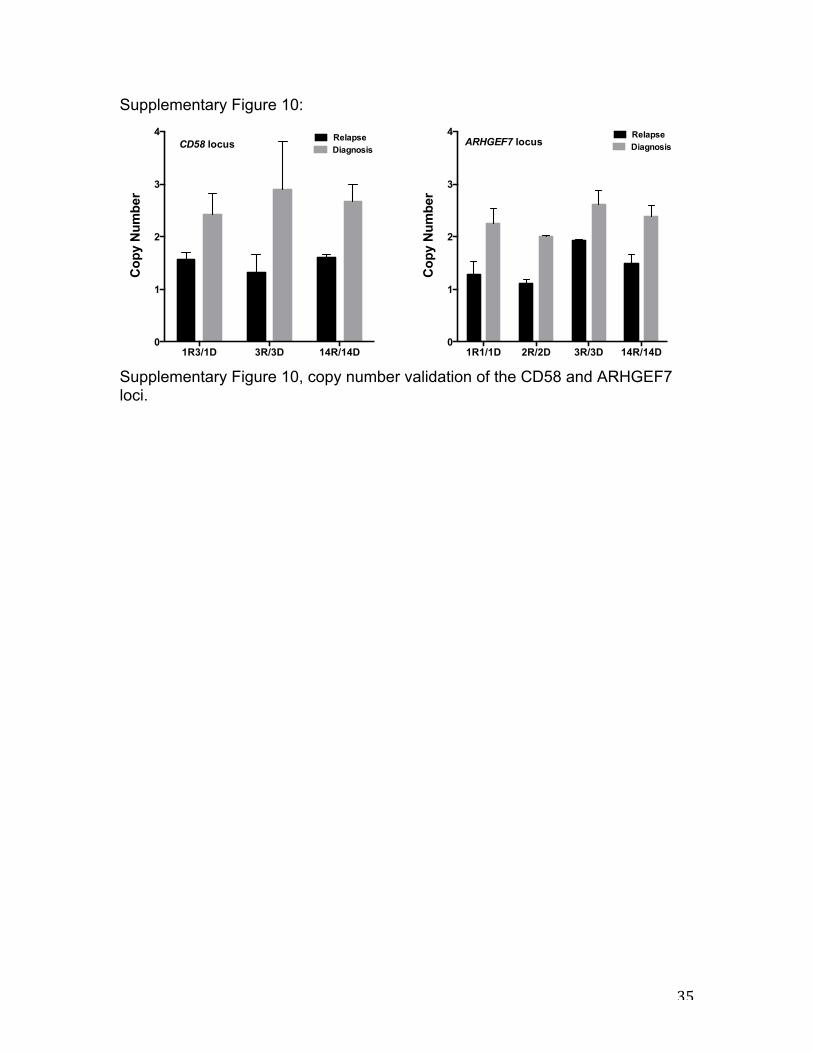
Supplementary Figure 10:
Supplementary Figure 10, copy number validation of the CD58 and ARHGEF7 loci.
1R3/1D 3R/3D 14R/14D0
1
2
3
4C
opy
Num
ber
RelapseDiagnosisCD58 locus
1R1/1D 2R/2D 3R/3D 14R/14D0
1
2
3
4
Cop
y N
umbe
r
RelapseDiagnosisARHGEF7 locus

36
Supplementary Figure 11: 2D and 2R, chr12: 49433882, G-> A, (CCG)P2557L(CTG),
Supplementary Figure 11: Sanger sequencing validation of MLL2 mutation in sample pair 2. Sanger sequencing traces centering around chr12: 49433882 (hg19) were shown for the control DNA sample from liver (top panel), the diagnosis sample (middle panel), and the relapse sample (bottom panel) of patient 2. The shaded area highlights the G to A mutation seen in the diagnosis and relapse samples, but not in the normal control sample.