supplementary data · web view2018-09-10 · email: [email protected] email:...
TRANSCRIPT

BBA-Molecular Basis of Disease
Supplementary Data
for
Histone methyltransferase G9a modulates hepatic insulin signaling
via regulating HMGA1
Weili Xuea, Jin Huanga, Hong Chenb, Yu Zhangb, Xiuqin Zhua, Jianshuang Lia,
Wenquan Zhanga, Yangmian Yuana, Yan Wanga, Ling Zhenga,*, Kun Huangb,*
a Hubei Key Laboratory of Cell Homeostasis, College of Life Sciences, Wuhan
University, Wuhan, 430072, China
b Tongji School of Pharmacy, Huazhong University of Science and Technology, Wuhan,
430030, China
* Correspondence to:
Ling Zheng, Ph.D. Kun Huang, Ph.D.
College of Life Sciences Tongji School of Pharmacy
Wuhan University Huazhong Univ. of Sci & Tech.
Wuhan, 430072, China Wuhan, 430030, China
Email: l [email protected] Email: [email protected]
1

Tel/Fax: +86 027-68755559 Tel/Fax: +86 027-83691499
Table S1. Antibodies used in the present study.
Antibodies Vendor Catalog numberG9a Abcam 31874-actin Abcam 133626pan-methyl-K Abcam 7315H3K9me2H3K9me1
AbcamAbcam
12209045
H3K4me2 Abcam 1109H3K4me3GLPHSP70
ABclonalBiossBD Biosciences
23571678903719
IR Santa Cruz Biotechnology 710IR Santa Cruz Biotechnology 711HMGA1PEPCKPFKL
Santa Cruz BiotechnologySanta Cruz BiotechnologySanta Cruz Biotechnology
898232879292523
Histone H3 Cell Signaling Technology 9715Total AKT Cell Signaling Technology 4691p-AKTSer473 Cell Signaling Technology 9271p-GSK3 Cell Signaling Technology 9323
2
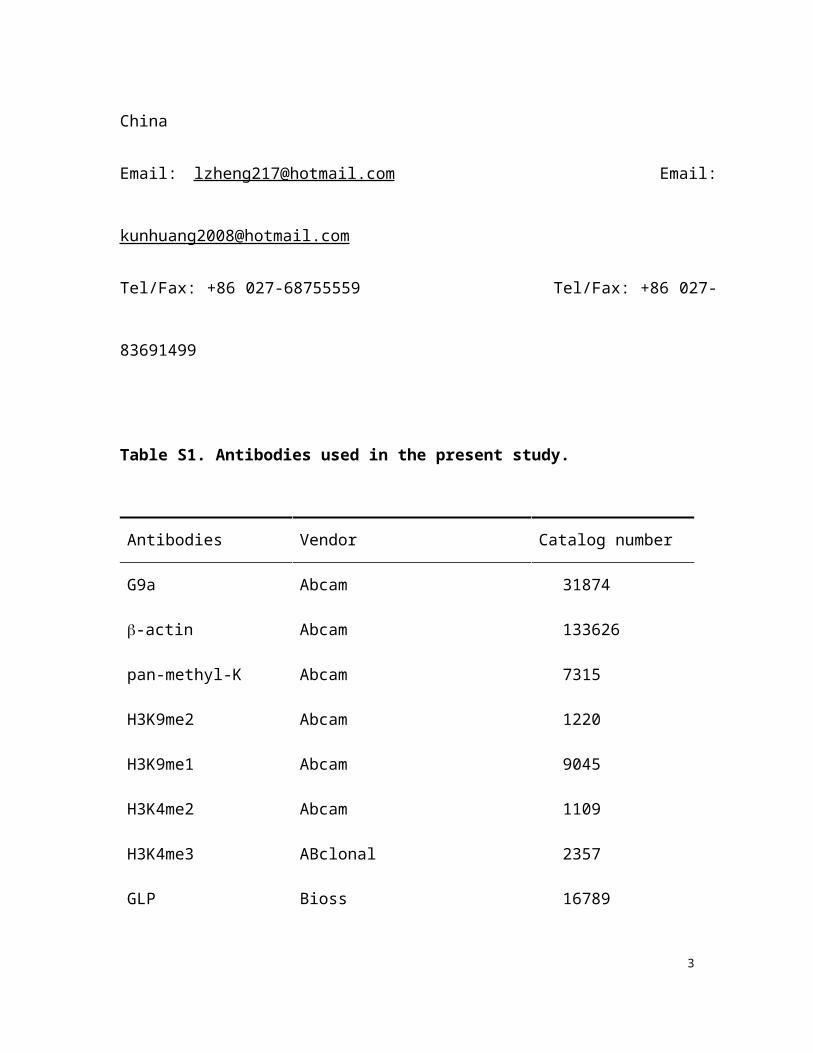
Table S2. qPCR primers used in the present study.
Genes Species Sequences
EHMT2 Human F:5’- CGAGGGGACCCTCTCCCCCAAC-3’
EHMT1 HumanR:5’- TGCAGCCTGACAGCTCTCCGT-3’
F:5’- TTGTCTGCGAGTATGTTGGG-3’
R:5’- CCCGTCCTTATTGTCGAGAT-3’
INSR Human F:5’- ACTCGGCCTCTACAACCTGAT-3’
IRS-2 HumanR:5’- TACGGGACCAGTCGATAGTGG-3’
F:5’- GCAGAACATCCACGAGACCAT-3’
R:5’- GGAACTCGAAGAGCTCCTTGAG-3’
HMGA1 Human F:5’- GGCACCAATAACAAGGAG-3’
R:5’- AGGCAATGAGGATGAACA-3’
-actin Human F:5’- TGCGTGACATTAAGGAGAA-3’
R:5’- GAAGGAAGGCTGGAAGAG-3’
Ehmt2 Mouse F:5’- TCGGGCAATCAGTCAGACAG-3’
Ehmt1 MouseR:5’- TGAGGAACCCACACCATTCAC-3’
F:5’- GAACAGGAGTCTCCCGACAC-3’
R:5’- GGGCTGTCAGTCTTCCCTC-3’-actin Mouse F:5’- GGCTGTATTCCCCTCCATCG-3’
R:5’- CCAGTTGGTAACAATGCCATGT-3’
3

4

Table S3. Physiological characteristics of the db/db and wildtype mice used.
+/+ db/db
BMI (Kg/m2) 2.58 ± 0.13 4.98 ± 0.50 *
FBG (mmol/L) 10.3 ± 1.28 23.4 ± 7.67 *
Liver weight (g) 1.01 ± 0.05 2.69 ± 0.64 *
+/+, wildtype mice; db/db, lepr-/- mice; BMI, body mass index; FBG, fasted blood
glucose; n = 5 per group; * p < 0.05 compared to wildtype mice.
5

Table S4. Physiological characteristics of male C57BL/6 mice fed with normal chow
or HFD.
Chow HFD 26 Weeks HFD 36 Weeks
BMI (Kg/m2)
FBG (mmol/L)
Liver weight (g)
3.40 ± 0.25
5.71±0.68
1.47±0.16
4.67±0.20 *
6.90±0.94 *
2.35±0.70 *
5.01±0.23 *
9.53±0.64 *
3.76±0.43 *
Chow, mice fed normal chow; HFD 26/36 Weeks, mice fed HFD for 26 or 36 weeks;
BMI, body mass index; FBG, fasted blood glucose; n = 4-5 per group; * p < 0.05
compared to mice fed normal chow.
6

Figure S1. Downregulated insulin receptors and HMGA1 in the liver of db/db mice.
Western blots (left) and densitometric results (right) for IR, IR and HMGA1 in the
liver of db/db and wildtype mice. HSP70 was used as a loading control. n = 5 per group,
*p < 0.05 compared with +/+ group.
7

Figure S2. Adenovirus-mediated G9a overexpression for 7 days has no obvious
improvement on hepatic lipid accumulation in db/db mice. Representative pictures for
H&E staining for liver sections. +/+ +Ad-Con, wildtype mice injected with Ad-Con;
db/db+Ad-Con, db/db mice injected with Ad-Con; db/db+Ad-G9a, db/db mice injected
with Ad-G9a; n=4-5 per group; scale bar, 100 μm.
8

Figure S3. G9a knockdown induces lipid accumulation in cultured HepG2 cells. Oil
red O staining on HepG2 cells. shScram, HepG2 cells stably transfected with pSUPER-
shScram; shG9a, HepG2 cells stably transfected with pSUPER-shG9a. Experiments were
repeated 2 times with n=2 per group each time; scar bar, 50 μm.
9