supplementary appendix - the lancet · supplementary appendix ... garvan institute of medical...
TRANSCRIPT

Supplementary appendixThis appendix formed part of the original submission and has been peer reviewed. We post it as supplied by the authors.
Supplement to: Ballinger ML, Goode DL, Ray-Coquard I, et al, for the International Sarcoma Kindred Study. Monogenic and polygenic determinants of sarcoma risk: an international genetic study. Lancet Oncol 2016; published online Aug 4. http://dx.doi.org/10.1016/S1470-2045(16)30147-4.

1
Appendix 1
Monogenic and polygenic determinants of sarcoma risk: an international genetic
study Corresponding author: Prof David Thomas, FRACP, PhD; Garvan Institute of Medical Research, The Kinghorn Cancer Centre and Cancer Division, 370 Victoria Street, Darlinghurst, NSW, Australia 2010; Email: [email protected] TABLE OF CONTENTS
AUTHOR LIST ......................................................................................................................................... 2 Authors .................................................................................................................................................. 2 Author affiliations ................................................................................................................................. 2
INTERNATIONAL SARCOMA KINDRED STUDY (ISKS) ................................................................. 3 ISKS Collaborators ............................................................................................................................... 3 ISKS Technical Support ........................................................................................................................ 3 ISKS Sponsor ........................................................................................................................................ 3
ACKNOWLEDGEMENTS ....................................................................................................................... 3 METHODS ................................................................................................................................................ 3
Study populations and datasets ............................................................................................................. 3 Clinical review of proband pedigrees ................................................................................................... 4 Cancer risk to relatives analysis ........................................................................................................... 4 Sequencing ............................................................................................................................................ 4 Processing and mapping sequencing reads .......................................................................................... 5 Variant calling and filtering ................................................................................................................. 5 Assessing true positive and false positive SNV call rates ..................................................................... 5 Variant annotation and identification of deleterious variants .............................................................. 6 Notifiable autosomal dominant cancer gene list .................................................................................. 6 Tumour-free survival analysis .............................................................................................................. 6 Rare Variant Burden Analysis (RVBA) ................................................................................................. 6 Statistical Analysis for RVBA ................................................................................................................ 7 Addressing potential confounders ......................................................................................................... 7
Population stratification .................................................................................................................. 7 Known sarcoma genes ...................................................................................................................... 7 Therapy induced sarcomas .............................................................................................................. 7 Effects of other clinical covariates on association between C3/C4/C5 variants and age at first diagnosis .......................................................................................................................................... 7
ERCC2 functional assay ....................................................................................................................... 8 Cell lines ........................................................................................................................................... 8 Generation of ERCC2 mutants and lentiviral transductions ........................................................... 8 In vitro cisplatin sensitivity assays ................................................................................................... 8
ERCC2 bioinformatics analysis ............................................................................................................ 8 Class 5 variants ................................................................................................................................ 9 Class 4 variants ................................................................................................................................ 9 Class 3 variants ................................................................................................................................ 9
TABLES .................................................................................................................................................. 11 Table S1. Participating cohorts & datasets ........................................................................................ 11 Table S2. International Sarcoma Kindred Study contributing sites ................................................... 11 Table S3. Sequencing gene list ........................................................................................................... 12 Table S4. Sequencing batches ............................................................................................................. 15 Table S5. Summary of sequencing coverage ...................................................................................... 16 Table S6. Results of validation of predicted SNVs by Sanger sequencing ......................................... 17 Table S7. Identification of TP53 rs1042522 minor allele by Haloplex capture, sequencing and variant calling process ........................................................................................................................ 17

2
Table S8. Odds ratio of the deleterious:synonymous ratios .............................................................. 18 Table S9. Deleterious and synonymous variants in sarcoma probands and the control cohorts ...... 18 Table S10. Burden of deleterious variants and low-frequency synonymous SNVs per gene, per cohort. ................................................................................................................................................. 19 Table S11. Deleterious and synonymous burden in TCGA and Norway probands and LifePool and ISKS controls. ..................................................................................................................................... 23 Table S12. Results of multivariate Cox regression of factors influencing age at first cancer diagnosis. ............................................................................................................................................ 24
FIGURES ................................................................................................................................................. 25 Figure S1. Age at first cancer diagnosis for sarcoma probands. ....................................................... 25 Figure S2. TCGA and Norwegian Sarcoma Consortium cohort profiles .......................................... 26 Figure S3. Filtering scheme for variants ............................................................................................ 27 Figure S4. Adaptor read-through artefact of the Haloplex library preparation process ................... 28 Figure S5. Total variant burden and number of variant sites per cohort ........................................... 29 Figure S6. RVBA in the Caucasian subset of the sarcoma patients after exclusion of known sarcoma risk genes ............................................................................................................................................ 30 Figure S7. RVBA in the Caucasian subset of the sarcoma patients after exclusion of post-therapy tumours ............................................................................................................................................... 31 Figure S8. Deviance residuals and Martingale residuals from Cox regression analysis of age at first cancer diagnosis. ................................................................................................................................ 32 Figure S9. ERCC2 variants in sarcoma cases. ................................................................................... 33
REFERENCES ........................................................................................................................................ 34 AUTHOR LIST
Authors
Mandy L. Ballinger PhD,1,2,3* David L. Goode PhD,2,3* Isabelle Ray-Coquard MD,4 Paul A. James MBChB,2,5,6 Gillian Mitchell PhD,2,5 Eveline Niedermayr BSc,2,3 Ajay Puri MS,7 Joshua D. Schiffman MD,8 Gillian S. Dite PhD,9 Arcadi Cipponi PhD,1 Robert G. Maki MD,10 Andrew S. Brohl MD,11 Ola Myklebost DPhil,12 Eva W. Stratford PhD,12 Susanne Lorenz PhD,12 Sung-Min Ahn MD,13 Jin-Hee Ahn MD,14 Jeong Eun Kim MD,14 Sue Shanley MD,2,5 Victoria Beshay PhD,15 Robert Lor Randall MD,16 Ian Judson MD,17 Beatrice Seddon PhD,18 Ian G. Campbell PhD,2,3,6 Mary-Anne Young MSc,2,5 Rajiv Sarin FRCR,19 Jean-Yves Blay MD,4 Seán I. O’Donoghue PhD, 20,21 and David M. Thomas FRACP,1 for the International Sarcoma Kindred Study. Author affiliations 1The Kinghorn Cancer Centre and Cancer Division, Garvan Institute of Medical Research, Darlinghurst, NSW, Australia; 2Sir Peter MacCallum Department of Oncology, University of Melbourne, Victoria, Australia; 3Research Division, Peter MacCallum Cancer Centre, Melbourne, Victoria, Australia; 4Department of Adult Medical Oncology, Centre Leon Berard, University Claude Bernard, Lyon, France; 5Familial Cancer Centre, Peter MacCallum Cancer Centre, Melbourne, Victoria, Australia; 6Department of Pathology, University of Melbourne, Parkville, Victoria, Australia; 7Department of Orthopedic Oncology, Tata Memorial Hospital, Mumbai, India; 8Division of Pediatric Hematology/Oncology, Department of Pediatrics, Huntsman Cancer Institute, University of Utah, Salt Lake City, Utah, USA; 9Centre for Epidemiology and Biostatistics, Melbourne School of Population and Global Health, University of Melbourne, Melbourne, Victoria, Australia; 10Tisch Cancer Institute, Mount Sinai Medical Center, New York, NY, USA; 11Sarcoma Department, Moffitt Cancer Center, Tampa, FL, USA; 12Department of Tumor Biology, Oslo University Hospital, Norwegian Radium Hospital, Oslo, Norway and the Norwegian Cancer Genomics Consortium; 13Gachon Institute of Genome Medicine and Science, Gachon University Gil Medical Center, Incheon, South Korea; 14Department of Oncology, Asan Medical Centre, Seoul, Korea; 15Department of Pathology, Peter MacCallum Cancer Centre, Melbourne, Victoria, Australia; 16Sarcoma Services, Department of Orthopaedics, Huntsman Cancer Institute, University of Utah, Salt Lake City, Utah, USA; 17Sarcoma Unit, The Royal Marsden NHS Foundation Trust, London, UK; 18Sarcoma Unit, University College Hospital, London, UK; 19Cancer Genetics Unit, ACTREC, Tata Memorial Centre, Mumbai, India; 20Commonwealth Scientific and Industrial Research Organisation (CSIRO), Sydney, Australia;

3
21Genomics and Epigenetics Division, Garvan Institute of Medical Research, Darlinghurst, NSW, Australia. *equal first author INTERNATIONAL SARCOMA KINDRED STUDY (ISKS)
ISKS Collaborators
Australia Martin Tattersall (Royal Prince Alfred Hospital, Sydney), Susan Neuhaus (Royal Adelaide Hospital, Adelaide), Craig Lewis (Prince of Wales Hospital, Sydney), Kathy Tucker (Prince of Wales Hospital, Sydney), Richard Carey-Smith (Hollywood Private Hospital, Perth), David Wood (Hollywood Private Hospital, Perth), Sandro Porceddu (Princess Alexandra Hospital, Brisbane), Ian Dickinson (The Wesley Hospital, Brisbane), Heather Thorne (Peter MacCallum Cancer Centre, Melbourne), Laura Forrest (Peter MacCallum Cancer Centre, Melbourne), Gillian Dite (University of Melbourne, Melbourne), Paul James (Peter MacCallum Cancer Centre, Melbourne), Mary-Anne Young (Peter MacCallum Cancer Centre, Melbourne), Gillian Mitchell (Peter MacCallum Cancer Centre, Melbourne); France Isabelle Ray-Coquard (Centre Leon Berard, Lyon), Jean-Yves Blay (Centre Leon Berard, Lyon), Philippe Cassier (Centre Leon Berard, Lyon), Axel Lecesne (Institut Gustave Roussy, Villejuif), Florence Duffaud (Assistance Publique Hopitaux de Marseille, Marseille), Olivier Penel (Centre de Lutte Contre le Cancer Oscar Lambret, Lille), Nicolas Isambert (Centre Regional de Lutte Contre le Cancer Georges Francois Leclerc, Dijon), Jean-Emmanuel Kurtz (Strasbourg Hopital, Strasbourg); India Ajay Puri (Tata Memorial Centre, Mumbai), Rajiv Sarin (Tata Memorial Centre, Mumbai); Korea Sung-Min Ahn (Asan Medical Centre, Seoul), Jin-Hee Ahn (Asan Medical Centre, Seoul), Jeong Eun Kim (Asan Medical Centre); New Zealand Iain Ward (Canterbury Regional Cancer and Haematology Service, Christchurch); UK Ian Judson (Royal Marsden Hospital, London), Beatrice Seddon (University College London Hospital, London), Conoor Chandrasekar (Royal Liverpool and Broadgreen University Hospital); USA Robert Maki (Mount Sinai Hospital, New York), Angela Cioffi (Mount Sinai Hospital, New York), Joshua Schiffman (Huntsman Cancer Institute, Salt Lake City), Lor Randall (Huntsman Cancer Institute, Salt Lake City) ISKS Technical Support
Australia Tina Thorpe, Jessica MacDonald, Kim Riddell, Jasmine Mar, Vicki Fennelly, Allison Wicht, Belinda Zielony, Emma Galligan, Genna Glavich, Johanna Stoeckert, Lynda Williams, Lana Djandjgava, Carla Osinki, Sonya Stephens; France Muriel Rogasik, Laure Bouclier, Magali Girodet, Amandine Charreton, Yohan Fayet; India Saniya Crasto, Bhanupriya Sandupatla; Korea Yeon Yoon, Noda Je; New Zealand Liz Thompson; USA Trent Fowler, Bella Johnson; UK Galina Petrikova, Thomas Hambridge, Angela Hutchins, Diego Bottero, Deborah Scanlon, Jo Stokes-Denson ISKS Sponsor
Australasian Sarcoma Study Group ACKNOWLEDGEMENTS
We thank Leonardo Meza-Zepeda for expert assistance with the Norwegian NoSarc data. We thank Tiffany Pang, Soroor Hediyeh Zadeh, Paul Leo, Simone Rowley, Lisa Devereux, Joseph Powell, Melanie Bahlo, Else Munthe, Heidi A Korsmo, Stine Naess, Carol Tran, Uyen Nguyen and Paul Stalley for helpful discussions, advice and technical assistance. METHODS
Study populations and datasets Whole exome datasets from TCGA (n=224) and the Norwegian Sarcoma Consortium (NoSarc, n=93) were used as independent validation sets (table S1). TCGA samples were collected from sites in the USA, had a median age at diagnosis of 62·7 years (interquartile range 53·5–72·5 years) and were predominantly diagnosed with leiomyosarcoma, undifferentiated pleomorphic sarcoma or dedifferentiated liposarcoma (figure S2A and S2B). The Norwegian samples were collected from sarcoma clinics and included a broad range of sarcoma subtypes. The median age at diagnosis was 62 years (interquartile range 44–70 years; figure S2C and S2D). Only samples from participants whose race was listed as Caucasian and clustered with Caucasians in principal component analysis were included in our analyses.

4
Clinical review of proband pedigrees
Family pedigrees were assessed according to recognized clinical criteria and algorithms. Families were considered clinically actionable if they met criteria for Li Fraumeni Syndrome (LFS)(1, 2), had ≥10% mutation carrier probability using BOADICEA (BWA v3)(3) for hereditary breast or ovarian cancer, Amsterdam I/II or Bethesda criteria for hereditary non-polyposis colorectal cancer(4-6), GenoMEL criteria for familial melanoma(7), or other recognized clinical classifications (neurofibromatosis type 1 and 2, retinoblastoma, familial adenomatous polyposis, McCune Albright syndrome, multiple schwannomatosis, hereditary paraganglioma, familial papillary thyroid cancer, multiple endocrine neoplasia type 1 or Gorlin syndrome). Cancer risk to relatives analysis
Australian population incidence rates for all cancers combined (except non-melanoma skin cancer) were obtained from the Australian Institute of Health and Welfare(8-13). This data includes annual cancer incidence rates for 1982 to 2011 that are specific for gender and age (in 5-year groups). The standardized incidence ratio was estimated by comparing the number of affected first-degree relatives of the case probands with the number expected to be affected using the gender- and age-specific population incidence rates as described previously(14). Living unaffected relatives were censored at the earliest of their age at the date of proband questionnaire completion or 100 years, while deceased unaffected relatives were censored at age at death. Population cumulative cancer incidence was based on Australian data(8). All statistical analyses were performed with Stata version 13 (StataCorp, 2013. Stata statistical software, release 13. College Station, TX: StataCorp LP). All statistical tests were two-sided and, following convention, p-values less than 0.05 were considered statistically significant.
Sequencing
The HaloPlex Enrichment System (Agilent) was used to capture exonic sequences from 72 genes with known or suspected links to cancer (table S3) from 1162 sarcoma probands and 235 controls from the ISKS. Genes were chosen based on reviewing existing commercially available germline genetic cancer panels (Accession dates 2011: Illumina’s TruSight Cancer Panel; Ambry Genetics panels: BRCAPlus, GynPlus, OvaNext, BreastNext, PancNext, RenalNext, ColoNext), with the addition of several genes linked to sarcoma (IDH1, NF1, IDH2, EXT1, EXT2, WRN, BLM, RECQL4)(15-21). The amplicons for the Haloplex sequence capture reagents were designed by the authors using Agilent’s SureDesign online software tool (https://earray.chem.agilent.com/suredesign/). Two overlapping batches of capture reagents were used (table S4). The first batch (00990) contained amplicons targeting the introns and promoter regions of ATR, TP53 and CDKN2A. However, these amplicons were found to perform poorly in terms of variability in coverage between samples and off-target capture. Therefore, a second batch of Haloplex capture reagents (07649) was designed to exclude these non-coding amplicons, provide better coverage of exons and target an additional 2 genes: AXIN2 and TP53BP1. The 07649 capture reagents cover a total of 1·02 Mb of sequence from 1257 exons of 72 genes. The 00990 capture reagents were used on 295 probands while the 07649 capture reagents were used on a total of 1090 samples (855 probands and 235 controls). Genomic DNA (225ng) was processed for up to 95 samples at a time using the automated HaloPlex workflow (HaloPlex Enrichment System, Automation Protocol for Illumina Sequencing, Agilent) in a Bravo NGS Workstation (Agilent Automation Solutions). Briefly, genomic DNA was digested with 16 restriction enzymes and hybridized to the biotinylated HaloPlex probe library that targeted the regions of interest. Hybridized DNA fragments were circularized and captured with streptavidin-coated magnetic beads. Captured fragments were polymerase chain reaction amplified to produce a sequencing-ready library. Tape Station (Agilent) was used to assess the enriched library size distribution and Qubit (Life Technologies) to assess yield. Successfully amplified libraries were pooled at equimolar concentrations, and the pool diluted to 2nM before sequencing. Pooled libraries were sequenced on a HiSeq2500 (Illumina) with 100bp or 150bp paired-end reads.
5
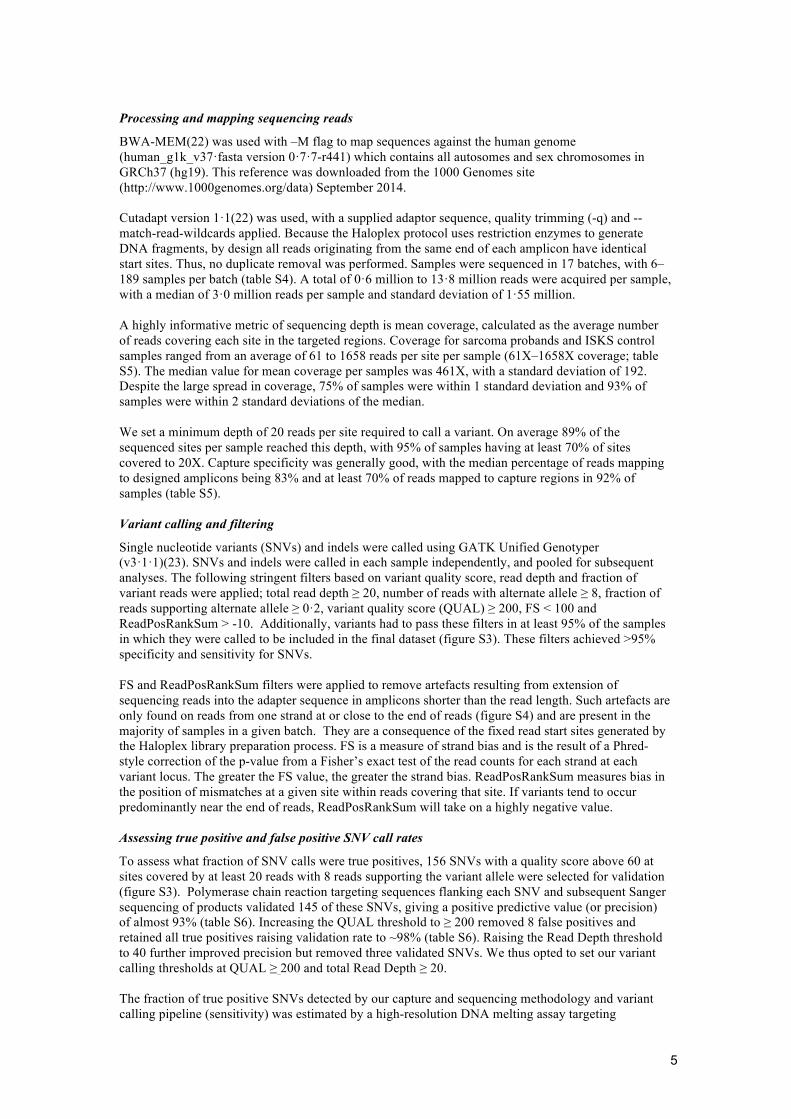
Processing and mapping sequencing reads
BWA-MEM(22) was used with –M flag to map sequences against the human genome (human_g1k_v37·fasta version 0·7·7-r441) which contains all autosomes and sex chromosomes in GRCh37 (hg19). This reference was downloaded from the 1000 Genomes site (http://www.1000genomes.org/data) September 2014. Cutadapt version 1·1(22) was used, with a supplied adaptor sequence, quality trimming (-q) and --match-read-wildcards applied. Because the Haloplex protocol uses restriction enzymes to generate DNA fragments, by design all reads originating from the same end of each amplicon have identical start sites. Thus, no duplicate removal was performed. Samples were sequenced in 17 batches, with 6–189 samples per batch (table S4). A total of 0·6 million to 13·8 million reads were acquired per sample, with a median of 3·0 million reads per sample and standard deviation of 1·55 million. A highly informative metric of sequencing depth is mean coverage, calculated as the average number of reads covering each site in the targeted regions. Coverage for sarcoma probands and ISKS control samples ranged from an average of 61 to 1658 reads per site per sample (61X–1658X coverage; table S5). The median value for mean coverage per samples was 461X, with a standard deviation of 192. Despite the large spread in coverage, 75% of samples were within 1 standard deviation and 93% of samples were within 2 standard deviations of the median. We set a minimum depth of 20 reads per site required to call a variant. On average 89% of the sequenced sites per sample reached this depth, with 95% of samples having at least 70% of sites covered to 20X. Capture specificity was generally good, with the median percentage of reads mapping to designed amplicons being 83% and at least 70% of reads mapped to capture regions in 92% of samples (table S5).
Variant calling and filtering
Single nucleotide variants (SNVs) and indels were called using GATK Unified Genotyper (v3·1·1)(23). SNVs and indels were called in each sample independently, and pooled for subsequent analyses. The following stringent filters based on variant quality score, read depth and fraction of variant reads were applied; total read depth ≥ 20, number of reads with alternate allele ≥ 8, fraction of reads supporting alternate allele ≥ 0·2, variant quality score (QUAL) ≥ 200, FS < 100 and ReadPosRankSum > -10. Additionally, variants had to pass these filters in at least 95% of the samples in which they were called to be included in the final dataset (figure S3). These filters achieved >95% specificity and sensitivity for SNVs. FS and ReadPosRankSum filters were applied to remove artefacts resulting from extension of sequencing reads into the adapter sequence in amplicons shorter than the read length. Such artefacts are only found on reads from one strand at or close to the end of reads (figure S4) and are present in the majority of samples in a given batch. They are a consequence of the fixed read start sites generated by the Haloplex library preparation process. FS is a measure of strand bias and is the result of a Phred-style correction of the p-value from a Fisher’s exact test of the read counts for each strand at each variant locus. The greater the FS value, the greater the strand bias. ReadPosRankSum measures bias in the position of mismatches at a given site within reads covering that site. If variants tend to occur predominantly near the end of reads, ReadPosRankSum will take on a highly negative value. Assessing true positive and false positive SNV call rates
To assess what fraction of SNV calls were true positives, 156 SNVs with a quality score above 60 at sites covered by at least 20 reads with 8 reads supporting the variant allele were selected for validation (figure S3). Polymerase chain reaction targeting sequences flanking each SNV and subsequent Sanger sequencing of products validated 145 of these SNVs, giving a positive predictive value (or precision) of almost 93% (table S6). Increasing the QUAL threshold to ≥ 200 removed 8 false positives and retained all true positives raising validation rate to ~98% (table S6). Raising the Read Depth threshold to 40 further improved precision but removed three validated SNVs. We thus opted to set our variant calling thresholds at QUAL ≥ 200 and total Read Depth ≥ 20. The fraction of true positive SNVs detected by our capture and sequencing methodology and variant calling pipeline (sensitivity) was estimated by a high-resolution DNA melting assay targeting

6
rs1042522, a common SNV in TP53. Hi-res melting involves cooling denatured DNA strands and observing the temperature at which the strand re-anneals. Sequence variants will cause subtle but detectable changes to the re-annealing temperature. In total, 197 sarcoma probands were detected as carrying the minor allele of rs1042522, 121 in the heterozygous state and 76 in the homozygous state. All high resolution melting predictions were validated by Sanger sequencing. Our variant calling and filtering criteria identified all 76 of the minor allele homozygotes and 120/121 heterozygotes (table S7). Thus, we believe this study has >99% sensitivity for heterozygous and homozygous minor allele genotypes. Variant annotation and identification of deleterious variants
For the purpose of variant burden analyses, the automated algorithm was developed to assign pathogenicity to both cases and controls. Variants were mapped to canonical transcripts in the Ensembl DB version 73(24) and their functional effects assessed using Ensembl Variant Effect Predictor (VEP v73)(25). Variants annotated as missense, frameshift, stop_gained, splice_acceptor or splice_donor were taken forward as putative protein-damaging germline variants. Under the assumption truly deleterious variants are more likely to be rare, SNVs and indels were only included in the analysis if present in ≤1% of the individuals from the Non-Finnish European, South Asian, East Asian and African populations in the Exome Aggregation Consortium database v0.3. We used a version of the ExAC database where variants from samples sequenced by TCGA had been excluded. To remove potential artefacts, variants were also excluded unless they were found in ≤ 1% of the sarcoma probands and the control cohorts. Putatively deleterious SNVs and indels were then stratified into three classes, approximating to the IARC classification of genetic variants(26) to the extent possible without manual curation. Our variant classification is based on the strength of evidence supporting a functional impact on protein sequence: • Class 5 (C5) – variants with an established association with cancer in the HGMDPro database
(accession March 4, 2014). Variants with independent evidence for neutrality, including in vivo or in vitro assays for protein function, were excluded.
• Class 4 (C4) – variants annotated as initiator codon variant, or frameshift, stop_gained, splice_acceptor or splice_donor in Ensembl.
• Class 3 (C3) – residual missense SNVs classified as deleterious by the Condel algorithm (score ≥ 0·46).
Notifiable autosomal dominant cancer gene list
The American College of Medical Genetics defined a list of genes considered notifiable where a pathogenic variant was identified in the course of clinical genetic testing(27). This list comprises 20 autosomal dominant tumor suppressor genes (TP53, RB1, BRCA1, BRCA2, STK11, MLH1, MSH2, MSH6, PMS2, APC, VHL, MEN1, PTEN, SDHB, SDHC, SDHD, TSC1, TSC2, WT1, and NF2). We extended this list to include CDH1, NF1, PTCH1, and PALB2. Tumour-free survival analysis
The effect of genotype on age at first cancer diagnosis was undertaken using a Kaplan-Meier survival analysis in GraphPad Prism v7. In these comparisons, time is the age at first cancer diagnosis for each proband stratified by genotypes as indicated in each figure. Univariate curve comparisons were performed using the Gehan-Breslow-Wilcoxon test, and Hazard ratios generated by the method of Mantel-Haenszel. For estimation of the effect of cumulative burden of C3 variants in figure 4A, a logrank test for trend was used. In all cases, p-values are two sided. Rare Variant Burden Analysis (RVBA)
Each gene was tested for an excess of deleterious variants in probands by comparing the dN/dS ratios between probands and control sets (table S8), where dN was calculated as the sum of C3, C4 and C5 variants in each gene in a given cohort and dS as the sum of all variants annotated as synonymous_variant only, to control for bias in ascertainment of rare variants between cases and controls (table S9). Synonymous SNVs were subjected to the same quality, read depth and bias filters as the missense and nonsense variants, but at a higher frequency threshold (<5% in ExAC, cases and control cohorts) was applied to improve power and reduce noise.

7
Statistical Analysis for RVBA
Proband counts were restricted to only variants from samples with self-reported Caucasian ancestry that could be confirmed by principal component analysis to reduce the influence of population stratification. One-sided Fisher’s Exact test was used to compare dN/dS ratios between probands and controls, testing the alternative hypothesis this ratio was higher in cases versus the null hypothesis of equal ratios. Only C3, C4 and C5 SNVs were used for the comparisons between ISKS probands and the EVS European American, owing to the apparent excess in indel calls in the EVS (figure S5). Overall p-values were obtained by Kost’s method(28) for combining dependent tests. Plotting and comparison of age of onset curves was performed using the R package survival (version 2·38-1). All analyses were performed with GraphPad Prism (version 6.0f). or R version 3·02. Addressing potential confounders
Population stratification
To limit the effects of population stratification, all with self-reported ancestry outside of Europe were excluded from the RVBA. To deal with incomplete or incorrect self-reported ancestry, principal component analysis (PCA) was performed for the remaining samples using all segregating SNVs covered by our gene capture panel to confirm the homogeneity in our cases and controls with respect to genetic ancestry, removing an additional 9 ISKS cases and 2 ISKS controls with extreme values in Principal Component 2. PCA was performed using Plink 1.07 (12) and shellfish 0.0.8 (http://www.stats.ox.ac.uk/~davison/software/shellfish/shellfish.php; June 13, 2014) on all SNVs that passed variant calling filters and were called in two or more samples. Known sarcoma genes
To assess the contribution of genes not previously associated with sarcoma risk to enrichment of overall burden of deleterious variation in our cohort, RVBA was repeated excluding all variants from TP53, NF1, RB1, SDHA, SDHB, SDHC, and SDHD, genes with well-established links with sarcoma risk (figure S6). They are broadly consistent with results from the full gene panel (figure 1). The excess burden of C4/5 variants remains significantly enriched (OR 1.22, compared to 1.72 in the original analysis). C3 variants were also enriched, but here the OR favors the analysis excluding known sarcoma risk genes: OR 1.43, compared to 1.34 in the original analysis. We speculate C5 variants (defined as those variants already reported to be pathogenic) will be enriched in those genes that have been already extensively studied while the large majority of coding variants in putative novel risk genes remain to be characterized. Therapy induced sarcomas
Sarcomas can be induced by prior radiotherapy and/or chemotherapy, potentially confounding the analysis by assigning genetic cause to tumours caused by exposure to intense DNA damaging agents. Thus, RVBA was repeated after removal of 52 samples who had received treatment for a primary tumour prior to sarcoma diagnosis (figure S7). The odds ratios and Fisher Exact p-values were consistent with results from the whole cohort (figure 1). We also looked at the genotypes of individuals with multiple cancers who had a sarcoma first (S1: n=75) compared to those in whom the sarcoma arose as a subsequent event (S2: n=99). Please note that 3 cases had two independent sarcomas, explaining the overlap. The distribution of C4/5 variants was no different in S1 than S2 (13/75 cf 21/99), nor C3-5 variants (39/75 cf 52/99). The genes implicated were also strikingly similar (for example, ACMG C4/5 variants: S1 TP53 x 2, BRCA2 x 2, PALB2, MSH6; S2 TP53 x 4, BRCA2 x 3, PALB2 and MSH6). Effects of other clinical covariates on association between C3/C4/C5 variants and age at first diagnosis
A multivariate Cox regression analysis was performed to test C3/C4/C5 carrier status, gender, prior radio/chemotherapy and sarcoma subtype as predictors of age at first cancer diagnosis. While some sarcoma subtypes showed strong association with age of onset, C3/C4/C5 carrier status was still a significant predictor of age at diagnosis on its own (p<0.005) in this model (table S12). This indicates a strong effect of inherited genotype on risk of early onset sarcoma independent of other clinical correlates including gender (p=0.04) and exposure to therapy (p=0.09). The hazard ratio for C3/C4/C5 carrier status showed strong linearity for younger subjects, departing from linearity for subject >60 years old (figure S8A), as might be expected, given risk of cancer later in life is often driven more by

8
environmental and physiological factors than by germline genetics. Deviance residuals were consistent between carrier groups (figure S8B). ERCC2 functional assay
We confirmed the loss-of function of nine of the 12 tested ERCC2 variants, many involving the functionally critical C-terminal helicase domain, in an assay for resistance to cisplatin-induced cell death in an ERCC@-null human cell line. Cell lines
The human fibroblast cell line GM08207, harbouring compound heterozygous mutations in the ERCC2 gene c.2047C>T+106_183del78, was purchased from Coriell Cell Repositories (Camden, NJ). GM082017 and HEK 293T cells, used for lentiviral packaging, were maintained in Dulbecco's modified Eagle's medium (DMEM; Gibco BRL) supplemented with 10% FCS, 20 mM Hepes, 2mM L-glutamine, 100 µg/mL penicillin/streptomycin and grown at 37oC and 5% CO2.
Generation of ERCC2 mutants and lentiviral transductions
The pLX304 lentiviral expression plasmid harboring the entire wild-type human ERCC2 open reading frame (ORF), driven by a CMV promoter, was a kind gift of Dr J.E. Rosenberg (Urology Service, Department of Surgery, Memorial Sloan Kettering Cancer Center, New York). Mutant ERCC2 ORF were generated by gene synthesis (DNA 2.0, Menlo Park, CA) and cloned into the pD2109-CMV lentiviral expression vector. VSV-pseudotyped lentiviral particles were produced by cotransfecting each of the ERCC2 expression vectors into HEK 293T cells with the virus packaging plasmids pCAG-VSVG and psPAX2 (Addgene, Cambridge, MA). Viral titers were determined by end-point dilution assays, assessing the number of colony forming units following 36h of puromycin selection (1µg/ml). GM08207 were transduced by adding the lentiviral supernatants to the cell cultures in the presence of 8µg/ml of polybrene (Sigma). 36h later, infected cells were selected by incubation with 1µg/ml puromycin for 2 days. To have the same number of viral genomes integrations for all the constructs, GM08207 cells were infected using the same multiplicity of infection (MOI).
In vitro cisplatin sensitivity assays
1x10^3 GM08207 cells, engineered with mutant and control ERCC2 constructs, were seeded in triplicate conditions in 96 well plates. Twenty-four hours later, different concentrations of cisplatin (Sigma) were added to the wells. After 96h, the growth inhibition was assessed using the CellTiter 96 AQueous cell proliferation assay MTS (Promega, Australia) according to the manufacturer’s protocol. Plates were scanned and the absorbance at 490nm was recorded using a microplate reader (BMG Labtech, Germany). The metabolic activity of each mutant ERCC2 line was obtained by subtracting the values of the mock control and plotted as percentage of the wild-type. Standard errors of the percent changes were calculated using the values of the variance obtained by the delta method. ERCC2 bioinformatics analysis
ERCC2 mutations in this study were converted into a JSON file, available online at http://bit.ly/ERCC2-ISKS. These data were then integrated with the Aquaria(29) resource, which enables the mutations to be mapped onto any 3D structure with detectable sequence similarity to ERCC2. This makes it possible to examine the spatial context of each mutation, which can help in interpreting possible functional consequences. According to Aquaria, the best matching 3D structure currently available is PDB 3CRV from Fan et al.(30), which contains the XPD helicase catalytic core from the archaeon Sulfolobus acidocaldarius. To provide further context for interpreting mutation consequences, the above URL also includes sequence annotations from other sources: (1) all UniProt (31) features for ERCC2, (2) domains annotations derived from InterPro(32); (3) domains annotations derived from Fan et al.(30), and (4) for each residue, SNAP2(33) predictions of the consequence of each possible single amino acid

9
polymorphism. The SNAP2 scores have also been aggregated to show an overall sensitivity score for each residue position: mapping this score onto 3CRV revealed that most mutationally sensitive residues are clustered together, buried, and are part of the Rad51/RecA-like helicase domains HD1 and HD2. In contrast, mutationally insensitive residues are dispersed around the protein surface. The resulting set of integrated ERCC2 features was then used to investigate the molecular and functional consequences for each variants in this study, as outlined below. Overall, where the functional or clinical consequence of variants are known, the results are in broad agreement with the bioinformatics analyses below, suggesting that this approach may be useful for interpreting novel ERCC2 variants observed clinically.
Class 5 variants
R112H is predicted to be deleterious by Condel(34), SIFT(35), SNAP2, and PolyPhen(36), and is reported in UniProt to be causally implicated in photosensitive trichothiodystrophy 1 (TTD1) and xeroderma pigmentosum complementation group D (XPD). Based on the 3CRV structure, this mutation is believed to disrupt the binding of iron to ERCC2, which, in turn, affects DNA-damage sensing(30). R616W and R616P are predicted to be deleterious by Condel, SIFT, SNAP2, and PolyPhen, and both mutations have very strong effects on function, as assessed by cisplatin (figure 3). They are also reported in UniProt to be causally implicated in XP-D, TTD1 (R616P only), and Cerebro-oculo-facio-skeletal syndrome 2 (COFS2; R616W only). In the 3CRV structure, this residue is part of the cluster of mutationally sensitive residues, suggesting that mutations may have critical effects. This residue occurs in the HD2 domain; disruptions to this domain are believed to affect DNA binding(30). R658C is predicted to be deleterious by Condel, SIFT, SNAP2, and PolyPhen, and has a significant effect on function, as assessed by cisplatin (figure 3). This mutation is also reported in UniProt to be causally implicated in TTD1. In 3CRV this residue is part of the cluster of mutationally sensitive residues. This residue is buried at the interface between the HD1 and HD2 domains, which bind and hydrolyse ATP, thus driving ssDNA translocation and helicase activity(30); thus R658 is likely to affect these processes. G675R is predicted to be deleterious by Condel, SIFT, SNAP2, and PolyPhen, and reported in UniProt to be causally implicated in a severe phenotype combining XP-D and Cockayne syndrome (XP-D/CS). In 3CRV this residue is part of the cluster of mutationally sensitive residues. This mutation is believed to reduce the conformational flexibility of HD2, thereby DNA binding(30).
Class 4 variants
The stop-gained variant R156* removes most of the protein, leaving only the first HD1 domain; as expected, this mutation has a strong effect on function, as assessed by cisplatin (figure 3). The stop-gained variant W696* removes only part of the HD2 domain - thus affecting DNA binding - as well as the C-terminal extension (CTE, residues 702-760); this strongly effects cisplatin sensitivity (figure 3), and may also affect interaction with TFIIH p44(30) and basal transcription. Similarly, the stop-gained variant T749* would have even less effect as only the CTE region is modified, likely affecting interaction with TFIIH p44(30) and basal transcription. The frame-shift mutations L652fs and V664fs both strongly affect cisplatin sensitivity (figure 3) and are also likely to affect interaction with TFIIH p44(30) and basal transcription. The presence of a C-terminal ~100 residue stretch of ‘non-sense’ sequence is also likely to have dramatic effects in vivo. The splice variants beginning at E160 and I239 both remove part of the second HD1 domain, thus are likely to affect ATP binding, ssDNA translocation, and hence helicase activity.
Class 3 variants
V231M is predicted to be deleterious by Condel, SIFT, SNAP2, and PolyPhen. In 3CRV this residue is buried and closely adjacent to the cluster of mutationally sensitive residues. Since this mutation in the second HD1 domain it is likely to affect ATP binding, ssDNA translocation, and helicase activity.

10
T301M is predicted to be deleterious by Condel and PolyPhen, but not SNAP2 or SIFT. This mutation had no significant functional effect, as assessed by cisplatin (figure 3). In 3CRV there is no residue aligned to T301, since it is part of a sequence insertion in ERCC2 that is not present in XPD helicase from S. acidocaldarius – hence this position may not be critical for overall folding. Since this residue is in the middle of the ARCH domain(30) (also known as the HBB domain in InterPro), mutations to this residue may affect DNA binding. N307K is predicted to be deleterious by Condel, SIFT, and PolyPhen but not by SNAP2. This residue position is also part of in the same sequence insertion in the ARCH domain as T301, so may have a similar affect on DNA binding. L399F is predicted to be deleterious by Condel, SIFT, and PolyPhen but not by SNAP2. This mutation had a significant – but not strong – effect on function, as assessed by cisplatin (figure 3). In 3CRV, this residue is part of a conserved helix in the ARCH domain that is direct contact with the second HD1 domain. Thus, L399F may affect binding to DNA and also to ATP. L406V is predicted to be deleterious by Condel, SIFT, SNAP2, and PolyPhen. In 3CRV, this residue is part of the same conserved helix as L399F; in contrast, however, this position is physically adjacent to many residues that are highly sensitive to mutation (predicted by SNAP2), so L406V may have a stronger effect on binding to DNA or ATP. S441L is predicted to be deleterious by Condel, SIFT, SNAP2, and PolyPhen. In 3CRV, this residue occurs on the protein surface, and is adjacent to the cluster of mutationally sensitive residues. This residue occurs close to the beginning of the third HD1 domain, thus the S441L mutation may affect ATP binding. R686S is predicted to be deleterious by Condel, SIFT, and SNAP2, and possibly damaging by PolyPhen. In 3CRV there is no residue aligned to R686, since it is part of a sequence insertion not present in XPD helicase from S. acidocaldarius – hence this residue may not be critical for overall folding. This residue occurs in the HD2 domain, hence the R686S mutation may affect DNA-binding(30). R690Q is predicted to be deleterious by Condel, SIFT, and SNAP2, and possibly damaging by PolyPhen. This mutation had no significant effect on function, as assessed by cisplatin (figure 3). This residue position is also part of in the same sequence insertion in the ARCH domain as R686S, so the R690Q mutation may have a similar affect on DNA binding. L744P is predicted to be deleterious by Condel, SIFT, SNAP2, and PolyPhen. This mutation had no significant effect on function, as assessed by cisplatin (figure 3). The residue is part of the C-terminal extension, which is missing in 3CRV (suggesting that this region may not be not be critical for overall folding); hence, the L744P mutation may affect interaction with TFIIH p44(30) and thereby basal transcription. L461V is not included in the RVBA, because its minor allele frequency in South Asian populations (1.3%) is above the definitional threshold for a rare variant (1%) in our algorithm. Two Caucasian probands carry this variant, which is predicted to be deleterious by Condel, SIFT, and SNAP2, and possibly damaging by PolyPhen. It has been associated with trichothiodystrophy and XPD in ClinVar and OMIM. This mutation has a significant effect on function, as assessed by cisplatin (figure 3). This variant affects the third HD1 domain, and is predicted to affect ATP binding.

11
TABLES
Table S1. Participating cohorts & datasets
Study Name Probands Controls Validation
International Sarcoma Kindred Study (ISKS) 966 235
Project GENESIS (Genetics of Ewing Sarcoma International
Study) 48
Asan Bio-Resource Center, Korea Biobank Network 138
kConFab 10
LifePool 2010
NHLBI Exome Sequencing Project (ESP) 4300
Norwegian Sarcoma Consortium (NoSarc) 93
The Cancer Genome Atlas (TCGA) 224
Total 1162 6545 317
Table S2. International Sarcoma Kindred Study contributing sites
Site Site investigator Number of
probands
Peter MacCallum Cancer Centre, Australia David Thomas 306
Centre Leon Berard, France Isabelle Ray-Coquard 287
Royal Prince Alfred Hospital, Australia Martin Tattersall 134
Princess Alexandra Hospital, Australia Sandro Porceddu 89
Tata Memorial Hospital, India Ajay Puri 77
Royal Adelaide Hospital, Australia Susan Neuhaus 42
Huntsman Cancer Institute, USA Joshua Schiffman 18
Hollywood Private Hospital, Australia Richard Carey-Smith 8
Christchurch Hospital, New Zealand Iain Ward 5

12
Table S3. Sequencing gene list
HUGO Gene Nomenclature Committee identifiers and Ensembl Gene IDs and Transcript IDs for all
genes for which targeted sequencing was performed. The Ensembl transcript marked as canonical was
used for all genes, except for CDKN2A, due to the distinct mechanisms activity of non-canonical
isoforms of this gene. Ensembl's canonical transcript for CDKN2A is highlighted in bold.
HGNC Gene Symbol HGNC Gene Name
HGNC ID Ensembl Gene ID Ensembl Transcript ID
APC adenomatous polyposis coli 583 ENSG00000134982 ENST00000457016
ATM ataxia telangiectasia mutated 795 ENSG00000149311 ENST00000278616
ATR ataxia telangiectasia and Rad3 related 882 ENSG00000175054 ENST00000350721
AXIN1 axin 1 903 ENSG00000103126 ENST00000262320
AXIN2 axin 2 904 ENSG00000168646 ENST00000307078
BARD1 BRCA1 associated RING domain 1 952 ENSG00000138376 ENST00000260947
BLM Bloom syndrome, RecQ helicase-like 1058 ENSG00000197299 ENST00000355112
BRCA1 breast cancer 1, early onset 1100 ENSG00000012048 ENST00000471181
BRCA2 breast cancer 2, early onset 1101 ENSG00000139618 ENST00000544455
BRIP1 BRCA1 interacting protein C-terminal helicase 1 20473 ENSG00000136492 ENST00000259008
BUB1B BUB1 mitotic checkpoint serine/threonine kinase B 1149 ENSG00000156970 ENST00000287598
CDH1 cadherin 1, type 1, E-cadherin (epithelial) 1748 ENSG00000039068 ENST00000261769
CDKN2A (ARF) cyclin-dependent kinase inhibitor 2A 1787 ENSG00000147889
ENST00000579755, ENST00000530628
CDKN2A (INK4A) cyclin-dependent kinase inhibitor 2A 1787 ENSG00000147889
ENST0000049812, ENST00000479692
CHEK1 checkpoint kinase 1 1925 ENSG00000149554 ENST00000534070
CHEK2 checkpoint kinase 2 16627 ENSG00000183765 ENST00000382580
DDB2 damage-specific DNA binding protein 2, 48kDa 2718 ENSG00000134574 ENST00000256996
ERCC2
excision repair cross-complementing rodent repair deficiency, complementation group 2 3434 ENSG00000104884 ENST00000391945
ERCC3
excision repair cross-complementing rodent repair deficiency, complementation group 3 3435 ENSG00000163161 ENST00000285398
ERCC4
excision repair cross-complementing rodent repair deficiency, complementation group 4 3436 ENSG00000175595 ENST00000311895
ERCC5
excision repair cross-complementing rodent repair deficiency, complementation group 5 3437 ENSG00000134899 ENST00000355739
EXT1 exostosin glycosyltransferase 1 3512 ENSG00000182197 ENST00000378204
EXT2 exostosin glycosyltransferase 2 3513 ENSG00000151348 ENST00000395673
FAM175A family with sequence similarity 175, member A 25829 ENSG00000163322 ENST00000321945
FANCA Fanconi anemia, complementation group A 3582 ENSG00000187741 ENST00000389301
FANCB Fanconi anemia, complementation group B 3583 ENSG00000181544 ENST00000398334
FANCC Fanconi anemia, complementation group C 3584 ENSG00000158169 ENST00000289081
FANCD2 Fanconi anemia, complementation group D2 3585 ENSG00000144554 ENST00000287647
FANCE Fanconi anemia, complementation group E 3586 ENSG00000112039 ENST00000229769

13
FANCF Fanconi anemia, complementation group F 3587 ENSG00000183161 ENST00000327470
FANCG Fanconi anemia, complementation group G 3588 ENSG00000221829 ENST00000378643
FANCI Fanconi anemia, complementation group I 25568 ENSG00000140525 ENST00000310775
FANCL Fanconi anemia, complementation group L 20748 ENSG00000115392 ENST00000402135
FANCM Fanconi anemia, complementation group M 23168 ENSG00000187790 ENST00000267430
FH fumarate hydratase 3700 ENSG00000091483 ENST00000366560
IDH1 isocitrate dehydrogenase 1 (NADP+), soluble 5382 ENSG00000138413 ENST00000415913
IDH2 isocitrate dehydrogenase 2 (NADP+), mitochondrial 5383 ENSG00000182054 ENST00000330062
MEN1 multiple endocrine neoplasia I 7010 ENSG00000133895 ENST00000337652
MLH1 mutL homolog 1, colon cancer, nonpolyposis type 2 (E. coli) 7127 ENSG00000076242 ENST00000231790
MLH3 mutL homolog 3 (E. coli) 7128 ENSG00000119684 ENST00000355774
MRE11A MRE11 meiotic recombination 11 homolog A (S. cerevisiae) 7230 ENSG00000020922 ENST00000323929
MSH2 mutS homolog 2, colon cancer, nonpolyposis type 1 (E. coli) 7325 ENSG00000095002 ENST00000233146
MSH6 mutS homolog 6 (E. coli) 7329 ENSG00000116062 ENST00000234420
MUTYH mutY homolog (E. coli) 7527 ENSG00000132781 ENST00000372098
NBN nibrin 7652 ENSG00000104320 ENST00000265433
NF1 neurofibromin 1 7765 ENSG00000196712 ENST00000358273
NF2 neurofibromin 2 (merlin) 7773 ENSG00000186575 ENST00000338641
PALB2 partner and localizer of BRCA2 26144 ENSG00000083093 ENST00000261584
PMS1 PMS1 postmeiotic segregation increased 1 (S. cerevisiae) 9121 ENSG00000064933 ENST00000441310
PMS2 PMS2 postmeiotic segregation increased 2 (S. cerevisiae) 9122 ENSG00000122512 ENST00000265849
PTCH1 patched 1 9585 ENSG00000185920 ENST00000331920
PTEN phosphatase and tensin homolog 9588 ENSG00000171862 ENST00000371953
RAD50 RAD50 homolog (S. cerevisiae) 9816 ENSG00000113522 ENST00000265335
RAD51C RAD51 paralog C 9820 ENSG00000108384 ENST00000337432
RAD51D RAD51 paralog D 9823 ENSG00000185379 ENST00000590016
RB1 retinoblastoma 1 9884 ENSG00000139687 ENST00000267163
RECQL4 RecQ protein-like 4 9949 ENSG00000160957 ENST00000428558
SDHA succinate dehydrogenase complex, subunit A, flavoprotein (Fp) 10680 ENSG00000073578 ENST00000264932
SDHB succinate dehydrogenase complex, subunit B, iron sulfur (Ip) 10681 ENSG00000117118 ENST00000375499
SDHC
succinate dehydrogenase complex, subunit C, integral membrane protein, 15kDa 10682 ENSG00000143252 ENST00000367975
SDHD succinate dehydrogenase complex, subunit D, integral membrane protein 10683 ENSG00000204370 ENST00000375549
STK11 serine/threonine kinase 11 11389 ENSG00000118046 ENST00000326873
TP53 tumor protein p53 11998 ENSG00000141510 ENST00000269305
TP53BP1 tumor protein p53 binding protein 1 11999 ENSG00000067369 ENST00000382044
TSC1 tuberous sclerosis 1 12362 ENSG00000165699 ENST00000298552
TSC2 tuberous sclerosis 2 12363 ENSG00000103197 ENST00000219476
VHL von Hippel-Lindau tumor suppressor, E3 ubiquitin protein ligase 12687 ENSG00000134086 ENST00000256474
WRN Werner syndrome, RecQ helicase-like 12791 ENSG00000165392 ENST00000298139
WT1 Wilms tumor 1 12796 ENSG00000184937 ENST00000332351

14
XPA xeroderma pigmentosum, complementation group A 12814 ENSG00000136936 ENST00000375128
XPC xeroderma pigmentosum, complementation group C 12816 ENSG00000154767 ENST00000285021
XRCC2 X-ray repair complementing defective repair in Chinese hamster cells 2 12829 ENSG00000196584 ENST00000359321

15
Table S4. Sequencing batches
Capture Reagents refers to the Haloplex amplicon design used.
Sample Batch # of
Samples Capture Reagents
Mean Coverage per Sample
Median Coverage per
Sample % sites covered
to 20X
AC0R2KACXX 30 00990 192·3 88·0 67·0%
A1H1M 11 00990 59·3 11·1 42·8%
A1KJN 7 00990 188·8 33·9 55·9%
A1R4F 6 00990 210·6 50·4 59·2%
AC1BRYACXX 44 00990 436·5 95·2 63·9%
AD1KEWACXX 41 00990 495·5 81·4 62·1%
AD1NNPACXX 44 00990 394·5 31·7 54·0%
D1AWVACXX 66 00990 595·5 224·4 68·5%
BC1JTFACXX 46 00990 408·3 42·4 57·3%
BH098PADXX 185 07649 287·7 176·5 82·1%
AH0D0TADXX 169 07649 250·5 118·0 64·6%
AH98CKADXX 85 07649 313·2 181·4 80·2%
AH9EMMADXX 95 07649 310·2 182·2 80·8%
AH9WA1ADXX 92 07649 319·9 192·4 81·7%
BHAN1FADXX 93 07649 269·7 164·3 80·7%
AHM2JCADXX 182 07649 327·9 205·5 82·1%
BHM2K7ADXX 189 07649 343·0 217·6 82·4%

16
Table S5. Summary of sequencing coverage
Minimum 1st Quartile Median Mean 3rd Quartile Maximum
Total Reads 583344 2667038 3006704 3543381 3869588 13824192
Mapped Reads 564499 2635751 2990614 3512505 3860699 13520892
% Reads Mapped 93·53 99·11 99·95 99·2 99·97 99·99
Singletons 27 418 902 19974 9735 261908
% Reads On Target 38 76·74 94·7 86·9 95·92 98·79
% Target Bases Covered to 20X 34·63 81·8 95·06 88·46 96·43 97·9
Mean Coverage For Target Bases 61·38 355·94 461·13 494·53 586·67 1658·11
% Target bases with 1/5 of mean
coverage 34·41 67·56 84·69 78·75 88·58 91·62

17
Table S6. Results of validation of predicted SNVs by Sanger sequencing
Validated by Sanger Sequencing
Filtering Criteria YES NO Precision
QUAL ≥ 60 and Read Depth ≥ 20 145 11 92·90%
QUAL ≥ 200 and Read Depth ≥ 20 145 3 97·90%
QUAL ≥ 200 and Read Depth ≥ 30 142 2 98·60%
Table S7. Identification of TP53 rs1042522 minor allele by Haloplex capture, sequencing
and variant calling process
Correct genotype call
rs1042522 Genotype YES NO Genotyping accuracy
C/C 34 2 94·4%
C/G 120 1 99·2%
G/G 76 0 100%
Overall 230 3 98·7%

18
Table S8. Odds ratio of the deleterious:synonymous ratios
Comparison of sarcoma probands and controls with one-sided Fisher Exact Test p-value
indicated. Analysis restricted to samples of Caucasian ethnicity only.
Probands vs ISKS controls Probands v LifePool Probands v EVS
Pooled comparison
OR Range p-value (1-
tailed) OR Range p-value (1-
tailed) OR Range p-value (1-
tailed) Kost combined
p-value
C5 1·63 0·91 - 3·15 0·05 1·74 1·24 - 2·44 p<0.0001 1·19 0·93 - 1·51 0·081 p<0.0001
C4 1·31 0·72 - 2·54 0·23 1·95 1·30 - 2·92 p<0.0001
1·83 1·19 - 2·75 0·0031 p<0.0001
C4/5 1·47 0·96 - 2·32 0·039 1·82 1·40 - 2·37 p<0.0001
1·32 1·06- 1·62 0·0062 p<0.0001
C3 1·24 0·96 - 1·61 0·050 1·39 1·19 - 1·63 p<0.0001
1·04 0·93 - 1·17 0·24 p<0.0001
Total 1·29 1·03 - 1·63 0·014 1·48 1·29 - 1·71 p<0.0001
1·09 0·98 - 1·21 0·057 p<0.0001
Table S9. Deleterious and synonymous variants in sarcoma probands and the control cohorts
The sarcoma probands versus EVS European American comparison is limited to SNVs due to
the unexplained excess of indel calls in the EVS data set in comparison to other control
populations (figure S5). The sarcoma probands versus LifePool comparison was limited to the
56 genes included in both studies. Numbers are for samples of Caucasian ethnicity only.
Probands (n=848)
ISKS controls (n=220)
Probands (SNVs only)
EVS European American
(SNVs only) (n=4320)
Probands (LifePool
genes)
LifePool (n=2010)
C5 89 14 89 405 83 72
C4 71 14 33 98 62 48
C4/5 160 28 122 503 145 120
C3 462 96 462 2401 398 432
Synonymous 1351 348 1351 7329 1123 1694
Total 622 124 584 2904 543 552
19
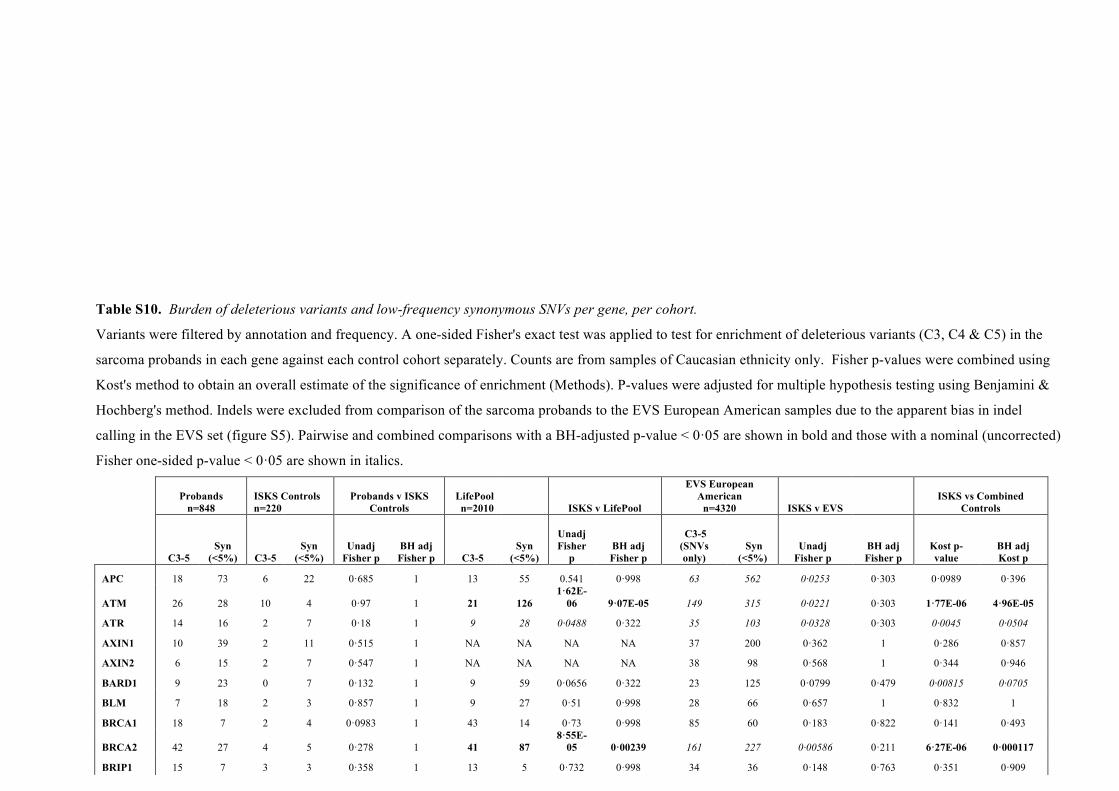
Table S10. Burden of deleterious variants and low-frequency synonymous SNVs per gene, per cohort.
Variants were filtered by annotation and frequency. A one-sided Fisher's exact test was applied to test for enrichment of deleterious variants (C3, C4 & C5) in the
sarcoma probands in each gene against each control cohort separately. Counts are from samples of Caucasian ethnicity only. Fisher p-values were combined using
Kost's method to obtain an overall estimate of the significance of enrichment (Methods). P-values were adjusted for multiple hypothesis testing using Benjamini &
Hochberg's method. Indels were excluded from comparison of the sarcoma probands to the EVS European American samples due to the apparent bias in indel
calling in the EVS set (figure S5). Pairwise and combined comparisons with a BH-adjusted p-value < 0·05 are shown in bold and those with a nominal (uncorrected)
Fisher one-sided p-value < 0·05 are shown in italics.
Probands n=848
ISKS Controls n=220
Probands v ISKS Controls
LifePool n=2010 ISKS v LifePool
EVS European American
n=4320 ISKS v EVS
ISKS vs Combined Controls
C3-5
Syn (<5%) C3-5
Syn (<5%)
Unadj Fisher p
BH adj Fisher p C3-5
Syn (<5%)
Unadj Fisher
p BH adj Fisher p
C3-5 (SNVs only)
Syn (<5%)
Unadj Fisher p
BH adj Fisher p
Kost p-value
BH adj Kost p
APC 18 73 6 22 0·685 1 13 55 0.541 0·998 63 562 0·0253 0·303 0·0989 0·396
ATM 26 28 10 4 0·97 1 21 126 1·62E-
06 9·07E-05 149 315 0·0221 0·303 1·77E-06 4·96E-05
ATR 14 16 2 7 0·18 1 9 28 0·0488 0·322 35 103 0·0328 0·303 0·0045 0·0504
AXIN1 10 39 2 11 0·515 1 NA NA NA NA 37 200 0·362 1 0·286 0·857
AXIN2 6 15 2 7 0·547 1 NA NA NA NA 38 98 0·568 1 0·344 0·946
BARD1 9 23 0 7 0·132 1 9 59 0·0656 0·322 23 125 0·0799 0·479 0·00815 0·0705
BLM 7 18 2 3 0·857 1 9 27 0·51 0·998 28 66 0·657 1 0·832 1
BRCA1 18 7 2 4 0·0983 1 43 14 0·73 0·998 85 60 0·183 0·822 0·141 0·493
BRCA2 42 27 4 5 0·278 1 41 87 8·55E-
05 0·00239 161 227 0·00586 0·211 6·27E-06 0·000117
BRIP1 15 7 3 3 0·358 1 13 5 0·732 0·998 34 36 0·148 0·763 0·351 0·909
BUB1B 3 18 2 1 0·995 1 3 28 0·464 0·963 14 116 0·432 1 0·711 1
CDH1 13 23 3 10 0·31 1 24 62 0·245 0·764 32 129 0·0336 0·303 0·0331 0·176
CDKN2A 2 2 0 0 1 1 NA NA NA NA 4 3 0·917 1 1 1

20
(ARF)
CDKN2A (INK4A) 2 1 1 0 1 1 NA NA NA NA 1 4 1 1 1 1
CHEK1 0 4 1 0 1 1 0 3 1 1 6 9 1 1 1 1
CHEK2 14 1 1 1 0·228 1 13 3 0·325 0·837 73 3 0·9 1 0·406 0·909
DDB2 0 12 2 3 1 1 1 11 1 1 8 48 1 1 1 1
ERCC2 15 3 3 4 0·0663 1 11 9 0·062 0·322 50 47 0·0508 0·406 0·00213 0·0298
ERCC3 6 6 2 1 0·877 1 15 12 0·748 0·998 36 29 0·746 1 0·863 1
ERCC4 16 70 1 11 0·341 1 7 87 0·0214 0·2 58 433 0·0633 0·456 0·00879 0·0705
ERCC5 17 54 4 8 0·853 1 20 82 0·309 0·837 26 29 0·998 1 0·984 1
EXT1 2 8 0 3 0·577 1 NA NA NA NA 8 48 0·472 1 0·354 0·946
EXT2 12 15 0 3 0·201 1 NA NA NA NA 53 89 0·312 1 0·111 0·434 FAM175A 1 1 1 0 1 1 1 5 0·464 0·963 8 9 0·737 1 1 1
FANCA 22 26 5 8 0·44 1 14 28 0·161 0·562 118 129 0·802 1 0·462 0·995
FANCB 3 2 0 0 1 1 3 3 0·608 0·998 15 15 0·528 1 0·951 1
FANCC 8 5 2 1 0·786 1 6 4 0·637 0·998 67 16 0·967 1 0·979 1
FANCD2 4 37 0 10 0·405 1 9 44 0·906 1 34 160 0·935 1 0·944 1
FANCE 9 19 2 3 0·807 1 7 23 0·324 0·837 22 64 0·327 1 0·379 0·909
FANCF 6 30 2 7 0·814 1 6 60 0·206 0·679 10 94 0·313 1 0·357 0·909
FANCG 2 2 2 0 1 1 4 3 0·803 1 5 12 0·407 1 1 1
FANCI 7 23 2 4 0·849 1 12 17 0·962 1 48 76 0·982 1 0·991 1
FANCL 7 28 0 7 0·249 1 4 91 0·0086 0·12 48 213 0·75 1 0·0259 0·161
FANCM 18 9 4 2 0·671 1 10 13 0·0867 0·347 92 46 0·594 1 0·258 0·772
FH 2 2 0 1 0·6 1 NA NA NA NA 8 9 0·669 1 0.469 1
IDH1 5 1 1 2 0.226 1 NA NA NA NA 18 18 0.141 0.763 0.0605 0.291
IDH2 5 10 3 4 0.818 1 NA NA NA NA 32 65 0.596 1 0.685 1
MEN1 2 4 1 1 0.893 1 1 7 0.385 0.897 12 29 0.827 1 0.887 1
MLH1 10 24 1 8 0·255 1 5 51 0·013 0·152 52 184 0·317 1 0·0159 0·111

21
MLH3 14 23 1 6 0·227 1 6 26 0·068 0·322 68 102 0·894 1 0·157 0·517
MRE11A 3 13 1 4 0·772 1 7 17 0·869 1 18 45 0·869 1 0·851 1
MSH2 5 28 1 5 0·776 1 4 4 0·993 1 36 156 0·764 1 0·998 1
MSH6 12 28 0 5 0·194 1 14 21 0·875 1 82 75 0·999 1 0·796 1
MUTYH 15 3 2 2 0·21 1 11 9 0·0622 0·322 75 24 0·359 1 0·064 0·276
NBN 17 9 1 7 0·0121 0·868 5 4 0·443 0·963 92 54 0·557 1 0·0376 0·176
NF1 7 54 0 18 0·151 1 8 126 0·148 0·551 23 339 0·217 0·917 0·0346 0·176
NF2 0 5 1 2 1 1 3 6 1 1 8 20 1 1 1 1
PALB2 6 13 1 4 0·538 1 9 31 0·329 0·837 48 88 0·712 1 0·59 1
PMS1 10 14 3 4 0·691 1 12 1 1 1 77 58 0·947 1 1 1
PMS2 7 7 1 1 0·767 1 5 18 0·0787 0·339 31 40 0·441 1 0·262 0·772
PTCH1 15 45 3 14 0·392 1 NA NA NA NA 59 238 0·232 0·929 0·171 0·558
PTEN 2 2 0 0 1 1 0 1 0·6 0·998 3 22 0·382 1 0·942 1
RAD50 15 13 4 0 1 1 10 22 0·0683 0·322 95 51 0·952 1 0·394 0·909
RAD51C 3 1 0 0 1 1 NA NA NA NA 5 4 0·49 1 0·979 1
RAD51D 6 1 1 0 1 1 4 1 0·682 0·998 16 0 1 1 1 1
RB1 3 13 0 0 1 1 1 6 0·648 0·998 5 23 0·788 1 1 1
RECQL4 33 65 7 12 0·707 1 39 66 0·746 0·998 91 323 0·0247 0·303 0·112 0·418
SDHA 9 70 2 18 0·611 1 NA NA NA NA 25 387 0·0769 0·479 0·107 0·434
SDHB 3 16 0 4 0·547 1 NA NA NA NA 2 106 0·0237 0·303 0·0319 0·277
SDHC 0 3 0 0 1 1 NA NA NA NA 1 8 1 1 1 1
SDHD 0 0 0 0 1 1 NA NA NA NA 1 3 1 1 1 1
STK11 3 11 0 1 0·8 1 5 21 0·588 0·998 7 30 0·561 1 0·74 1
TP53 16 71 0 18 0·0378 1 2 76 0·0008
08 0·0151 6 308 1·78E-07 1·28E-05 5·75E-10 3·24E-08
TP53BP1 8 21 1 9 0·25 1 20 41 0·769 1 31 113 0·312 1 0·34 0·909
TSC1 0 32 0 3 1 1 6 12 1 1 5 110 1 1 1 1
TSC2 17 90 7 27 0·817 1 22 103 0·699 0·998 120 550 0·854 1 0·828 1

22
VHL 1 4 1 2 0·893 1 1 5 0·727 0·998 4 15 0·726 1 0·887 1
WRN 12 10 3 2 0·76 1 7 9 0·372 0·897 81 47 0·883 1 0·873 1
WT1 2 13 3 5 0·967 1 3 10 0·878 1 13 9 0·999 1 1 1
XPA 3 1 2 0 1 1 NA NA NA NA 1 4 0·167 0·8 0·355 0·946
XPC 7 10 0 4 0·167 1 7 8 0·748 0·998 37 54 0·586 1 0·495 1
XRCC2 0 1 1 0 1 1 5 3 1 1 11 5 1 1 1 1

Table S11. Deleterious and synonymous burden in TCGA and Norway probands and
LifePool and ISKS controls.
Counts are the sum of the variants in the 49 genes that intersect between the ISKS, LifePool
and Norway datasets.
TCGA Probands Norway Probands Combined Probands
LifePool Controls
ISKS Controls
C5 36 12 48 67 15
C4 22 4 26 43 12
C4/5 58 16 74 110 27
C3 82 60 142 415 85
Synonymous 347 42 389 1643 291
Total 140 76 216 525 112

24
Table S12. Results of multivariate Cox regression of factors influencing age at first cancer
diagnosis.
coef exp(coef) se(coef) Z p-value
C3/C4/C5 Carrier Status 0.11553 1.12247 0.04087 2.827 0.0047
Gender -0.12607 0.88156 0.06158 -2.047 0.041
Prior Therapy 0.24423 1.27664 0.14714 1.66 0.097
Angiomyosarcoma/Hemangiosarcoma 0.03106 1.03155 0.28629 0.108 0.91
Alveolar soft part sarcoma -0.15709 0.85462 0.43495 -0.361 0.72
Clear cell sarcoma -0.25369 0.77593 0.4343 -0.584 0.56
Chordoma -1.09656 0.33402 0.74112 -1.48 0.14
Chondrosarcoma -0.89432 0.40889 0.24559 -3.642 0.00027
Dermatofibrosarcoma -1.4206 0.24157 0.30516 -4.655 p<0.0001
Epithelioid hemangioendothelioma -0.89212 0.40978 0.46324 -1.926 0.054
Epithelioid sarcoma -1.50116 0.22287 0.35433 -4.237 p<0.0001
Endometrial stromal sarcoma -1.62522 0.19687 0.31338 -5.186 p<0.0001
Fibromyxosarcoma -1.20765 0.2989 0.26127 -4.622 p<0.0001
Fibrosarcoma -0.91629 0.4 0.54474 -1.682 0.093
Gastrointestinal stromal sarcoma -0.56227 0.56991 0.26729 -2.104 0.035
Leiomyosarcoma -1.69034 0.18446 0.23734 -7.122 p<0.0001
Liposarcoma -0.96294 0.38177 0.29883 -3.222 0.0013
Myxoid liposarcoma -1.3401 0.26182 0.25913 -5.171 p<0.0001
Pleomorphic liposarcoma -1.29799 0.27308 0.41519 -3.126 0.0018
Dedifferentiated/well differentiated Liposarcoma -1.11673 0.32735 0.24142 -4.626 p<0.0001
Mesenchymal chondrosarcoma -2.27924 0.10236 1.02543 -2.223 0.026
Malignant peripheral nerve sheath tumor/Perineurioma -0.50339 0.60448 0.29657 -1.697 0.090
Osteosarcoma -1.90284 0.14914 0.23803 -7.994 p<0.0001
Other sarcomas -1.95555 0.14149 0.50021 -3.909 p<0.0001
Phyllodes tumor, malignant -2.01068 0.1339 0.50078 -4.015 p<0.0001
Ewing sarcoma -1.89982 0.1496 0.23879 -7.956 p<0.0001
Rhabdomyosarcoma -1.54991 0.21227 0.49926 -3.104 0.0019
Alveolar rhabdomyosarcoma -1.1514 0.31619 0.46229 -2.491 0.013
Embryonal rhabdomyosarcoma -0.84266 0.43057 0.54565 -1.544 0.12
Pleomorphic rhabdomyosarcoma, adult type 0.31762 1.37385 0.73954 0.429 0.67
Solitary fibrous tumor/Hemangiopericytoma -2.16828 0.11437 0.36355 -5.964 p<0.0001
Synovial sarcoma -1.59214 0.20349 0.25135 -6.334 p<0.0001
Malignant fibrous histiocytoma/Spindle cell sarcoma/Not Otherwise Specified/Undifferentiated sarcoma -2.00505 0.13465 0.23582 -8.503 p<0.0001

25
FIGURES
Figure S1. Age at first cancer diagnosis for sarcoma probands.
>69
60-69
50-59
40-49
30-39
20-29
10-19
<10
Number of probands
0 50 100 150 200
26
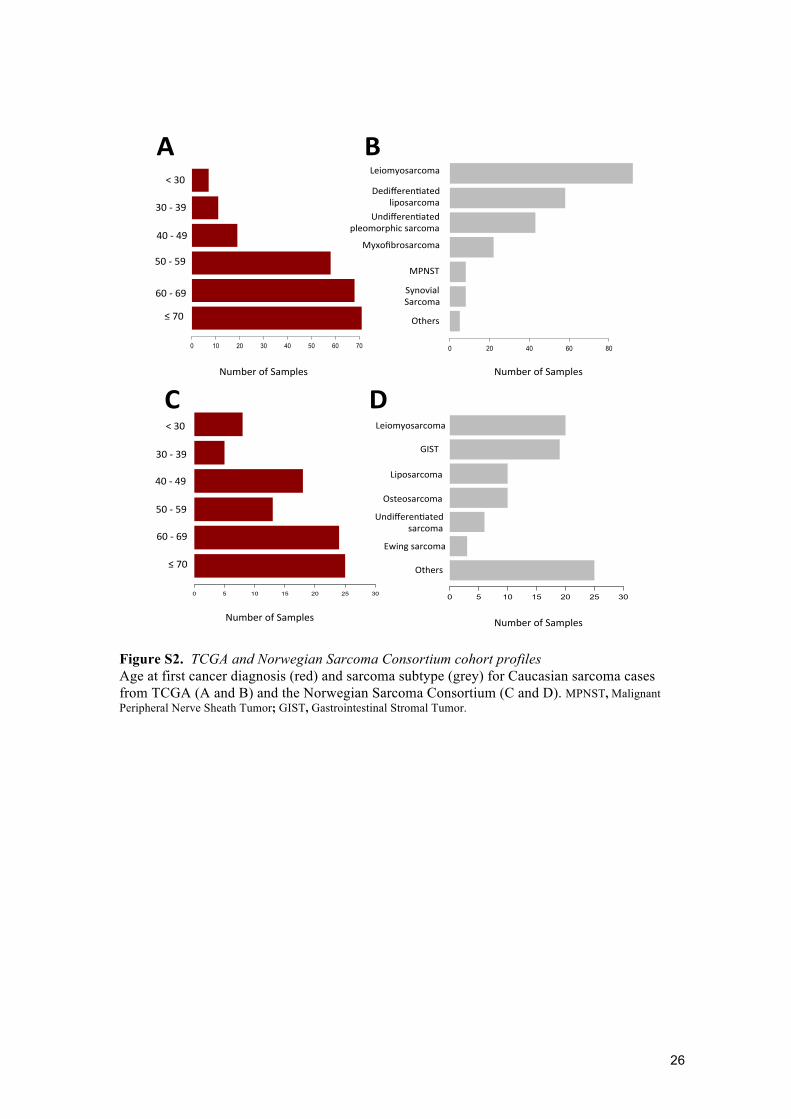
Figure S2. TCGA and Norwegian Sarcoma Consortium cohort profiles Age at first cancer diagnosis (red) and sarcoma subtype (grey) for Caucasian sarcoma cases from TCGA (A and B) and the Norwegian Sarcoma Consortium (C and D). MPNST, Malignant Peripheral Nerve Sheath Tumor; GIST, Gastrointestinal Stromal Tumor.
0 5 10 15 20 25 300 5 10 15 20 25 30
0 20 40 60 800 10 20 30 40 50 60 70
Number'of'Samples'
<'30'
30'2'39'
40'2'49'
50'2'59'
60'2'69'
≤'70'
A"Leiomyosarcoma'
DedifferenAated''liposarcoma'
UndifferenAated''pleomorphic'sarcoma'
Myxofibrosarcoma'
MPNST'
Synovial''Sarcoma'
Others'
Number'of'Samples'
B"
Others'
Leiomyosarcoma'
Liposarcoma'
Osteosarcoma'
GIST'
Ewing'sarcoma'
UndifferenAated''sarcoma'
D"C"
Number'of'Samples'
<'30'
30'2'39'
40'2'49'
50'2'59'
60'2'69'
≤'70'
Number'of'Samples'

27
Figure S3. Filtering scheme for variants
Variant'Filtering'Scheme'
QUAL≥200 and total read depth ≥20 and ≥8 reads with variant allele and ≥20% reads had variant allele
Freq%≤1%%in%sarcoma%probands,%in%each%of%the%3%control%cohorts
& in the ExAC (-TCGA)
non-synonymous, STOP, essential splice site,
frameshifts
FS%(Strand%bias%)%<%100%&%ReadPosRankSum%(PosiConal%bias) > -10
Passes thresholds in ≥95% of the samples with UG calls
Freq%≤5%%in%sarcoma%probands,%in%each%of%the%3%control%cohorts%
&%in%the%ExAC%(JTCGA)
Synonymous
1'
2'
3'
4'
5'

28
Figure S4. Adaptor read-through artefact of the Haloplex library preparation process Alignments of Haloplex reads from sarcoma probands are shown in Integrated Genome Viewer. Reads are colored by strand. The G->A SNV (green letters) appears only at the ends of the reads from the minus strand of only a single amplicon and is not seen in any reads from any overlapping amplicons, regardless of strand. This amplicon is 99bp long and read length for this sequencing run was 100bp. The G->A SNV is thus the first base pair of the sequencing adaptor.

29
Figure S5. Total variant burden and number of variant sites per cohort The fraction of total variant burden (top) and number of variant sites (bottom) comprised SNVs (blue) and indels (red) in each cohort. The EVS contains an excess of indel burden (top) i.e., more indel calls per sample, though not an excess of indel sites (bottom) suggesting a tendency to overcall indels in the EVS cohort and/or a tendency to undercall them in the two Haloplex cohorts. For this reason, indels were excluded from the comparison of sarcoma probands and ISKS controls versus EVS.
SNVs Indels
LifePool(Sarcoma(Probands(&(ISKS(controls(
EVS(European(American(
Overall(Burden(
#(of(Variant(Sites(
Chi$square+p+<+1e$56+
Chi$square+p+=+0.95+
92.6%( 94.1%( 74.2%(
92.3%( 92.2%( 92.5%(

30
Figure S6. RVBA in the Caucasian subset of the sarcoma patients after exclusion of known sarcoma risk genes Odds ratios for overall burden of damaging germline variants in ISKS cases and the ISKS and LifePool controls after removing all variants from seven genes with well-established links with sarcoma risk (TP53, NF1, RB1, SDHA, SDHB, SDHC, SDHD). Data are the log2 odds ratio and 95% confidence intervals for each comparison. P-values are for one-sided Fisher Exact Tests. Statistical significance for the combined control comparisons was estimated using the method of Kost.

31
Figure S7. RVBA in the Caucasian subset of the sarcoma patients after exclusion of post-therapy tumours Odds ratios for overall burden of damaging germline variants in ISKS cases were recalculated after removing 52 samples from tumours that were detected after radiotherapy and/or chemotherapy. Data are the log2 odds ratio and 95% confidence intervals for each comparison. P-values are for one-sided Fisher Exact Tests. Statistical significance for the combined control comparisons was estimated using the method of Kost.
Log2 Odds Ratio
-2 -1 0 1 2
All C3/C4/C5 Variants
C4 & C5 Variants
C3 Variants
vs combined controls
vs ISKS controls
vs LifePool controls
vs combined controls
vs ISKS controls
vs LifePool controls
vs combined controls
vs ISKS controls
vs LifePool controls
0.5 (0.32 to 0.68)
0.71 (0.39 to 1)
0.43 (0.23 to 0.63)
0.35 (0.015 to 0.68)
0.53 (-0.092 to 1.2)
0.29 (-0.074 to 0.67)
0.56 (0.36 to 0.77)
0.83 (0.45 to 1.2)
0.48 (0.25 to 0.71)
p<0.0001
p<0.0001
p<0.0001
0.039
0.097
0.13
p<0.0001
p<0.0001
p<0.0001
Odds ratio (95% CI) P-value

32
A
B
Figure S8. Deviance residuals and Martingale residuals from Cox regression analysis of age at first cancer diagnosis. Martingale residuals (A) and Deviance residuals (B) plotted as a function of subject age at first cancer (the explanatory variable).
0 20 40 60 80
-10
-8-6
-4-2
0Test for non-linearity of HR
cordas.factor(st)
Mar
tinga
le R
esid
uals
0 20 40 60 80
-2-1
01
23
4
Test for non-proportional hazards
Age at diagnosis
Bet
a(t)
for c
oord
s
No variants C3 variant C4/C5 variant

33
Figure S9. ERCC2 variants in sarcoma cases. A: ERCC2 variants were cloned and transduced into an ERCC2-null cell line, exposed to cisplatin and cell viability assessed relative to wild-type. *P<0·05; **P<0·01; ***P<0·001. B: Protein sequence locations for ERCC2 variants and location for the Rad51/RecA-like helicase domains HD1 and HD2, the ARCH/helicase and beta-bridge (HBB) domain, and the C-terminal extension (CTE).
B
A
R112H
R156* ESSex5 ESSex7
V231M T301M N307K L399F L406V S441L R686S R690Q
T749*W696*V664fsL652fs
L744P
R616W/P R658C G675R
HD1 HD1 ARCH / HBB HD1 CTEHD2
Class 4 variants
Class 3 variants
Class 5 variants
ERCC2 domains
0.0
0.2
0.4
0.6 ns ns ns*** *** *** *** ******** ** ***
IC5
0 [
Cis
pla
tin
]
R690Q W696*V664fs L744PT301M L399FR156*MockEmpty vectorWT L652fsR616WR616P R658C

34
REFERENCES
1. Li FP, Fraumeni JF, Jr., Mulvihill JJ, Blattner WA, Dreyfus MG, Tucker MA, et al. A cancer family syndrome in twenty-four kindreds. Cancer Res. 1988;48(18):5358-62. 2. Bougeard G, Renaux-Petel M, Flaman JM, Charbonnier C, Fermey P, Belotti M, et al. Revisiting Li-Fraumeni Syndrome From TP53 Mutation Carriers. J Clin Oncol. 2015; 33(21):2345-52. 3. Lee AJ, Cunningham AP, Kuchenbaecker KB, Mavaddat N, Easton DF, Antoniou AC, et al. BOADICEA breast cancer risk prediction model: updates to cancer incidences, tumour pathology and web interface. Br J Cancer. 2014;110(2):535-45. 4. Vasen HF, Mecklin JP, Khan PM, Lynch HT. The International Collaborative Group on Hereditary Non-Polyposis Colorectal Cancer (ICG-HNPCC). Diseases of the colon and rectum. 1991;34(5):424-5. 5. Vasen HF, Watson P, Mecklin JP, Lynch HT. New clinical criteria for hereditary nonpolyposis colorectal cancer (HNPCC, Lynch syndrome) proposed by the International Collaborative group on HNPCC. Gastroenterology. 1999;116(6):1453-6. 6. Umar A, Boland CR, Terdiman JP, Syngal S, de la Chapelle A, Ruschoff J, et al. Revised Bethesda Guidelines for hereditary nonpolyposis colorectal cancer (Lynch syndrome) and microsatellite instability. Journal of the National Cancer Institute. 2004;96(4):261-8. 7. GenoMEL the Melanoma Genetics Consortium. Information for medical staff - Familial melanoma [cited 2015. Available from: http://www.genomel.org/. 8. Australian Institute of Health and Welfare (AIHW) 2015. Australian Cancer Incidence and Mortality (ACIM) book: Melanoma of the skin (ICD-10 code C43). Canberra: AIHW. http://www.aihw.gov.au/acim-books. 9. Australian Institute of Health and Welfare (AIHW) 2015. Australian Cancer Incidence and Mortality (ACIM) books: Breast cancer (ICD-10 code C50). Canberra: AIHW http://www.aihw.gov.au/acim-books. 10. Australian Institute of Health and Welfare (AIHW) 2015. Australian Cancer Incidence and Mortality (ACIM) books: All cancers combined. Canberra: AIHW http://www.aihw.gov.au/acim-books. 11. Australian Institute of Health and Welfare (AIHW) 2015. Australian Cancer Incidence and Mortality (ACIM) books: Brain cancer (ICD-10 code C71). Canberra: AIHW http://www.aihw.gov.au/acim-books. 12. Australian Institute of Health and Welfare (AIHW) 2015. Australian Cancer Incidence and Mortality (ACIM) books: Other soft tissue (ICD-10 codes C47, C49). Canberra: AIHW http://www.aihw.gov.au/acim-books. 13. Australian Institute of Health and Welfare (AIHW) 2015. Australian Cancer Incidence and Mortality (ACIM) books: Bone and articular cartilage (ICD-10 codes C40-C41). Canberra: AIHW Australian Cancer Database 2011, unpublished data & AIHW National Mortality Database, unpublished data. 14. Dite GS, Whittemore AS, Knight JA, John EM, Milne RL, Andrulis IL, et al. Increased cancer risks for relatives of very early-onset breast cancer cases with and without BRCA1 and BRCA2 mutations. Br J Cancer. 2010;103(7):1103-8. 15. Amary MF, Damato S, Halai D, Eskandarpour M, Berisha F, Bonar F, et al. Ollier disease and Maffucci syndrome are caused by somatic mosaic mutations of IDH1 and IDH2. Nature genetics. 2011;43(12):1262-5. 16. Ciavarella M, Coco M, Baorda F, Stanziale P, Chetta M, Bisceglia L, et al. 20 novel point mutations and one large deletion in EXT1 and EXT2 genes: report of diagnostic screening in a large Italian cohort of patients affected by hereditary multiple exostosis. Gene. 2013;515(2):339-48. 17. Evans DG, Baser ME, McGaughran J, Sharif S, Howard E, Moran A. Malignant peripheral nerve sheath tumours in neurofibromatosis 1. Journal of medical genetics. 2002;39(5):311-4. 18. Jones KB, Pacifici M, Hilton MJ. Multiple hereditary exostoses (MHE): elucidating the pathogenesis of a rare skeletal disorder through interdisciplinary research. Connective tissue research. 2014;55(2):80-8. 19. Musso N, Caronia FP, Castorina S, Lo Monte AI, Barresi V, Condorelli DF. Somatic loss of an EXT2 gene mutation during malignant progression in a patient with hereditary multiple osteochondromas. Cancer genetics. 2015;208(3):62-7. 20. Sugimoto M. A cascade leading to premature aging phenotypes including abnormal tumor profiles in Werner syndrome (review). International journal of molecular medicine. 2014;33(2):247-53. 21. Veith S, Mangerich A. RecQ helicases and PARP1 team up in maintaining genome integrity. Ageing research reviews. 2014.

35
22. Martin M. Cutadapt removes adapter sequences from high-throughput sequencing reads. EMBnetjournal. 2011;17(1). 23. DePristo MA, Banks E, Poplin R, Garimella KV, Maguire JR, Hartl C, et al. A framework for variation discovery and genotyping using next-generation DNA sequencing data. Nature genetics. 2011;43(5):491-8. 24. Yates; A, Akanni; W, Amode; MR, Barrell; D, Billis; K, Carvalho-Silva; D, et al. Ensembl 2016. Nucleic Acids Research. 2016;44(D1):D710-6. 25. McLaren W, Pritchard B, Rios D, Chen Y, Flicek P, Cunningham F. Deriving the consequences of genomic variants with the Ensembl API and SNP Effect Predictor. Bioinformatics. 2010;26(16):2069-70. 26. Plon SE, Eccles DM, Easton D, Foulkes WD, Genuardi M, Greenblatt MS, et al. Sequence variant classification and reporting: recommendations for improving the interpretation of cancer susceptibility genetic test results. Human mutation. 2008;29(11):1282-91. 27. Green RC, Berg JS, Grody WW, Kalia SS, Korf BR, Martin CL, et al. ACMG recommendations for reporting of incidental findings in clinical exome and genome sequencing. Genetics in medicine : official journal of the American College of Medical Genetics. 2013;15(7):565-74. 28. Kost JTM, M. P. Combining dependent P-values. Statistics and Probability Letters. 2002;60(2):183-90. 29. O'Donoghue SI, Sabir KS, Kalemanov M, Stolte C, Wellmann B, Ho V, et al. Aquaria: Simplifying discovery and insight from protein structures. Nat Methods. 2015;12:98–9. 30. Fan L, Fuss JO, Cheng QJ, Arvai AS, Hammel M, Roberts VA, et al. XPD helicase structures and activities: insights into the cancer and aging phenotypes from XPD mutations. Cell. 2008;133(5):789-800. 31. The UniProt Consortium. Activities at the Universal Protein Resource (UniProt). Nucleic Acids Res. 2014;42:D191-D8. 32. Hunter S, Jones P, Mitchell A, Apweiler R, Attwood TK, Bateman A, et al. InterPro in 2011: new developments in the family and domain prediction database. Nucleic Acids Res. 2012;40(Database issue):D306-12. 33. Hecht M, Bromberg Y, Rost B. Better prediction of functional effects for sequence variant. Bioinformatics. 2015;16(Suppl 8):S1. 34. Gonzalez-Perez A, Lopez-Bigas N. Improving the assessment of the outcome of nonsynonymous SNVs with a consensus deleteriousness score, Condel. American journal of human genetics. 2011;88(4):440-9. 35. Kumar P, Henikoff S, Ng PC. Predicting the effects of coding non-synonymous variants on protein function using the SIFT algorithm. Nat Protoc. 2009;4(7):1073-81. 36. Adzhubei I, Jordan DM, Sunyaev SR. Predicting functional effect of human missense mutations using PolyPhen-2. Current protocols in human genetics / editorial board, Jonathan L Haines [et al]. 2013;Chapter 7:Unit7 20.