supplemental material: climate change and future pollen ... · pdf filehowever, some figures...
TRANSCRIPT

Environ Health Perspect DOI: 10.1289/EHP173
Note to readers with disabilities: EHP strives to ensure that all journal content is accessible to all readers.
However, some figures and Supplemental Material published in EHP articles may not conform to 508
standards due to the complexity of the information being presented. If you need assistance accessing journal
content, please contact [email protected]. Our staff will work with you to assess and meet your
accessibility needs within 3 working days.
Supplemental Material
Climate Change and Future Pollen Allergy in Europe
Iain R. Lake, Natalia R. Jones, Maureen Agnew, Clare M. Goodess, Filippo Giorgi, Lynda
Hamaoui-Laguel, Mikhail A. Semenov, Fabien Solomon, Jonathan Storkey, Robert Vautard, and
Michelle M. Epstein
Table of Contents Figure S1: Process for selecting studies reporting sensitization to ragweed pollen
Table S1: Ragweed Sensitization Rate (RSR) exclusion criteria
Table S2: Ragweed sensitization rates included in the review and summary information collected
References
Figure S2: Baseline and future population (percentage) sensitized to ragweed pollen at the NUTS2
level for RCP4.5 and RCP8.5 and a reference plant invasion scenario. Data are presented separately
for the CHIMERE and WRF/RegCM model suites.
Table S3: Population (in thousands) sensitized to ragweed for the current and future. Reference
ragweed invasion scenario comparing RCP 4.5 and RCP 8.5, and 2 climate model suites (Chimere,
WRF/RegCM) for 40 European countries; 95% confidence interval (CIs) shown in brackets.
Table S4: Current and future populations clinically sensitized to ragweed pollen. Changes due to
population change are also presented. Data are average of the CHIMERE and WRF/RegCM model
suites for RCP4.5 and a reference plant invasion scenario.

Figure S1: Process for selecting studies reporting sensitization to ragweed pollen
1923 potentially relevant studies identified through standardized database search
1873 excluded (ragweed sensitization not reported; outside Europe)
50 studies (144 location-specific sensitization rates) retained
15 excluded studies (86 location-specific sensitization rates) – did not pass entry criteria
35 studies included, providing 66 location-specific sensitization rates, across 20 European countries

Table S1: Ragweed Sensitization Rate (RSR) exclusion criteria First filter: Ragweed sensitization is not reported in the study The study has taken place outside Europe Second filter exclusion criteria: RSR is not clearly restricted to ragweed pollen alone but e.g., for ragweed and/or mug wort RSR is reported for an unrepresentative or overly-focused sub group of the population (e.g. an elderly cohort living in an institution, weed-sensitive allergy patients, allergy patients only symptomatic during ragweed season, immigrants) The sample size is < 50 individuals The date of the study is pre 1993 (i.e., over 20 years before the start of the present project)

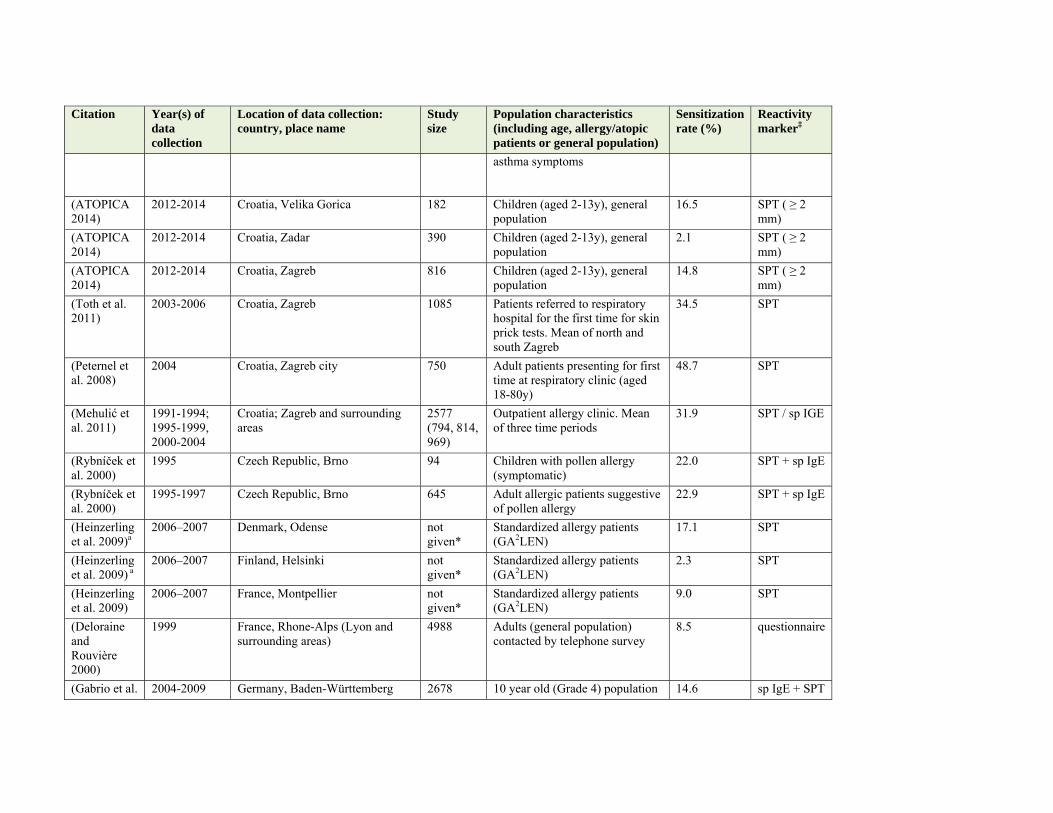
Table S2: Ragweed sensitization rates included in the review and summary information collected Citation Year(s) of
data collection
Location of data collection: country, place name
Study size
Population characteristics (including age, allergy/atopic patients or general population)
Sensitization rate (%)
Reactivity marker‡
(Hemmer et al. 2011)
1997-2007 Austria, all regions 13719 Atopic patients diagnosed between 1997 and 2007
11.1 SPT
(Hemmer et al. 2011)
1997-2007 Austria, Alpine regions 13719 Atopic patients diagnosed between 1997 and 2007
5.4 (4.7-6.0) SPT
(Hemmer et al. 2011)
1997-2007 Austria, Eastern lowlands adjoining Hungary
13719 Atopic patients diagnosed between 1997 and 2007
20.8 SPT
(Heinzerling et al. 2009)
2006–2007 Austria, Vienna not given*
Standardized allergy patients (GA2LEN)
8.5 SPT
(Jäger 2000) 1984-1997 Austria, Vienna 3510 (1993-97)
Allergy outpatients restricted to the period 1993-1997.
30.6 SPT + sp IGE
(Heinzerling et al. 2009)
2006–2007 Belgium, Ghent not given*
Standardized allergy patients (GA2LEN)
3.0 SPT
(Nikolov et al. 2013)
2011-2012 Bulgaria, Sofia 74 74 patients sensitized to grass and/or weed pollen
21.6 SPT
(Toth et al. 2011)
2003-2006 Croatia, Ivanic Grad 614 Patients referred to respiratory hospital for the first time for skin prick tests
51.1 SPT
(ATOPICA 2014)
2012-2014 Croatia, Ivanic Grad 157 Children (aged 2-13y), general population
19.1 SPT ( ≥ 2 mm)
(ATOPICA 2014)
2012-2014 Croatia, Osijek 582 Children (aged 2-13y), general population
17.5 SPT ( ≥ 2 mm)
(Toth et al. 2011)
2003-2006 Croatia, Samobor 493 Patients referred to respiratory hospital for the first time for skin prick tests
15.6 SPT
(ATOPICA 2014)
2012-2014 Croatia, Samobor 169 Children (aged 2-13y), general population
16.6 SPT ( ≥ 2 mm)
(ATOPICA 2014)
2012-2014 Croatia, Slavonski Brod 540 Children (aged 2-13y), general population
15.2 SPT ( ≥ 2 mm)
(ATOPICA 2014)
2012-2014 Croatia, Split 1180 Children (aged 2-13y), general population
1.9 SPT ( ≥ 2 mm)
(Cvitanovic et al. 2007)
2003 Croatia, Split-Dalmatia 320 320 patients from Split-Dalmatian County with seasonal rhinitis and
17.5 SPT
Citation Year(s) of data collection
Location of data collection: country, place name
Study size
Population characteristics (including age, allergy/atopic patients or general population)
Sensitization rate (%)
Reactivity marker‡
asthma symptoms
(ATOPICA 2014)
2012-2014 Croatia, Velika Gorica 182 Children (aged 2-13y), general population
16.5 SPT ( ≥ 2 mm)
(ATOPICA 2014)
2012-2014 Croatia, Zadar 390 Children (aged 2-13y), general population
2.1 SPT ( ≥ 2 mm)
(ATOPICA 2014)
2012-2014 Croatia, Zagreb 816 Children (aged 2-13y), general population
14.8 SPT ( ≥ 2 mm)
(Toth et al. 2011)
2003-2006 Croatia, Zagreb 1085 Patients referred to respiratory hospital for the first time for skin prick tests. Mean of north and south Zagreb
34.5 SPT
(Peternel et al. 2008)
2004 Croatia, Zagreb city 750 Adult patients presenting for first time at respiratory clinic (aged 18-80y)
48.7 SPT
(Mehulić et al. 2011)
1991-1994; 1995-1999, 2000-2004
Croatia; Zagreb and surrounding areas
2577 (794, 814, 969)
Outpatient allergy clinic. Mean of three time periods
31.9 SPT / sp IGE
(Rybníček et al. 2000)
1995 Czech Republic, Brno 94 Children with pollen allergy (symptomatic)
22.0 SPT + sp IgE
(Rybníček et al. 2000)
1995-1997 Czech Republic, Brno 645 Adult allergic patients suggestive of pollen allergy
22.9 SPT + sp IgE
(Heinzerling et al. 2009)a
2006–2007 Denmark, Odense not given*
Standardized allergy patients (GA2LEN)
17.1 SPT
(Heinzerling et al. 2009) a
2006–2007 Finland, Helsinki not given*
Standardized allergy patients (GA2LEN)
2.3 SPT
(Heinzerling et al. 2009)
2006–2007 France, Montpellier not given*
Standardized allergy patients (GA2LEN)
9.0 SPT
(Deloraine and Rouvière 2000)
1999 France, Rhone-Alps (Lyon and surrounding areas)
4988 Adults (general population) contacted by telephone survey
8.5 questionnaire
(Gabrio et al. 2004-2009 Germany, Baden-Württemberg 2678 10 year old (Grade 4) population 14.6 sp IgE + SPT

Citation Year(s) of data collection
Location of data collection: country, place name
Study size
Population characteristics (including age, allergy/atopic patients or general population)
Sensitization rate (%)
Reactivity marker‡
2010) study
(Gabrio et al. 2010)
2008-2009 Germany, Baden-Württemberg 1134 Adults (general population) 11.0 sp IgE + SPT
(Heinzerling et al. 2009)
2006–2007 Germany, Berlin–Munich not given*
Standardized allergy patients (GA2LEN)
14.4 SPT
(Eben et al. 2008)
2005-2007 Germany, Munich 1070 Adult patients with history allergy disease
22.9 SPT + sp IgE
(Ruëff et al. 2012)
2006-2009 Germany, Munich and 3 smaller towns, Southern Bavaria
977 Patients with documented or suspected atopic disease or food allergy. Median age 43y
19.5 SPT / sp IgE
(McIntyre et al. 2010; McIntyre et al. 2012; McIntyre et al. 2011a; McIntyre et al. 2011b)
2008-2010 Germany, Munich, Bavaria 1022 Patients from Bavarian University allergy unit (with suspected sensitization to seasonal aeroallergens)
28.3 SPT + sp IGE
(Boehme et al. 2013)
2007 Germany, south-west 1039 18-66 years old 10.8 SPT and sp IgE
(Heinzerling et al. 2009)
2006–2007 Greece, Athens not given*
Allergy patients (GA2LEN), crude rates given (not standardized)
11.7 SPT
(Nekam et al. 2011)
pre 2011 Hungary, Kecskemet (south Hungary)
50 Adult patients with respiratory allergy for at least 2 pollen seasons including symptoms during the ragweed season.
56.0 sp IgE
(Heinzerling et al. 2009)
2006–2007 Hungary, Budapest not given*
Standardized allergy patients (GA2LEN)
53.8 SPT
(Nekam et al. 2011)
pre 2011 Hungary, Eger (north Hungary) 50 Adult patients with respiratory allergy for at least 2 pollen seasons
52.0 sp IgE
(Nekam et al. 2011)
pre 2011 Hungary, Nyiregyhaz (south Hungary)
50 Adult patients with respiratory allergy for at least 2 pollen seasons including symptoms
54.0 sp IgE

Citation Year(s) of data collection
Location of data collection: country, place name
Study size
Population characteristics (including age, allergy/atopic patients or general population)
Sensitization rate (%)
Reactivity marker‡
during the ragweed season.
(Dervaderics et al. 2002)
pre 2002 Hungary, Paks 185 Hungarian nationals with self-reported allergy symptoms
20.0 SPT + sp IgE
(Kadocsa and Juhász 2002)
1998-1999 Hungary, Szeded (south Hungary) 394 Seasonal allergic rhinitis patients 84.8 SPT
(Asero et al. 2012)
Not given Italy, Clinica San Carlo, north of Milan
95 Study of immigrants in Northern Italy. But data for controls from patients seen at allergy center
56.0 SPT
(Cecchi et al. 2010)
2006-2009 Italy, Florence 3086 Adult patients at allergy and clinical immunology unit
9.3 SPT
(Heinzerling et al. 2009)
2006–2007 Italy, Genoa and Palerma not given*
Standardized allergy patients (GA2LEN)
3.5 SPT
(Tosi et al. 2011)
1989-2008 Italy, Legnano 18594 (total 1993-2008)
Respiratory patients (>14 y) attending an allergy clinic for the first time. Annual rates of sensitization available, we restrict to the period 1993-2008.
35.0 SPT
(Goracci and Goracci 1996)
1991-1995 Italy, Livorno (Leghorn), central Italy
325 Patients at department of allergology
6.8 sp IgE
(Albertini et al. 2012)
1992-2008 Italy, Parma 19,468 Outpatients affected by respiratory disease
4.5 SPT
(Carosso and Gallesio 2000)
1996-1997 Italy, Turin 5680 Subjects affected by rhino-conjunctivitis and/or bronchial asthma during spring and summer by respiratory symptoms
9.5 sp IgE
(Asero et al. 2012)
Not given Italy, Verona 75 Study of immigrants in Northern Italy. But data for controls from patients seen at allergy center
0.0 SPT
(Milkovska et al. 2008)
1998-2000 Macedonia, Skopje 722 Random subjects aged 18-78 (mean age 39.6y)
6.5 SPT
(Heinzerling 2006–2007 Netherlands, The; Amsterdam not Standardized allergy patients 18.6 SPT

Citation Year(s) of data collection
Location of data collection: country, place name
Study size
Population characteristics (including age, allergy/atopic patients or general population)
Sensitization rate (%)
Reactivity marker‡
et al. 2009) given* (GA2LEN)
(Beijer and Vertegaal 2010)
2007 Netherlands, The; authors are based in Leiden and Leiderdorp
307 Participants tested positive for specific IgE for common inhalant allergies.
9.4 sp IgE
(De Weger et al. 2009)
2004-2006 Netherlands, The; Leiden? 250 Patients with suspected allergic disease. Allergic to inhaled aeroallergens
6.7 sp IgE
(Heinzerling et al. 2009)
2006–2007 Poland, Lodz not given*
Standardized allergy patients (GA2LEN)
10.8 SPT
(Heinzerling et al. 2009) a
2006–2007 Portugal, Coimbra not given*
Standardized allergy patients (GA2LEN)
12.4 SPT
(Popescu and Tudose 2011)
2009-2010 Romania, Bucharest 447 Patients with allergic rhinitis (5-62y)
11.2 SPT / sp IgE
(Ianovici et al. 2013)
2009 Romania, Timișoara city 1036 Patients who presented during 2009 to allergy specialist, 228 sensitized to ragweed
22.0 SPT
(Zvezdin et al. 2004)
2000, 2002, 2003
Serbia, Novi Sad 2148 (691, 756, 701)
People who had symptoms of allergic rhinitis and / or asthma
30.0 SPT
(Ackermann-Liebrich et al. 2009)
2002 Switzerland, Aarau 949 Population cohort of adults (SAPALDIA cohort)
8.3 sp IgE
(Ackermann-Liebrich et al. 2009)
2002 Switzerland, Basel 778 Population cohort of adults (SAPALDIA cohort)
10.3 sp IgE
(Ackermann-Liebrich et al. 2009)
2002 Switzerland, Geneva 398 Population cohort of adults (SAPALDIA cohort)
8.3 sp IgE
(Ackermann-Liebrich et al. 2009)
2002 Switzerland, Lugano 741 Population cohort of adults (SAPALDIA cohort)
6.9 sp IgE
(Ackermann-Liebrich et
2002 Switzerland, Payerne 810 Population cohort of adults (SAPALDIA cohort)
5.8 sp IgE

Citation Year(s) of data collection
Location of data collection: country, place name
Study size
Population characteristics (including age, allergy/atopic patients or general population)
Sensitization rate (%)
Reactivity marker‡
al. 2009)
(Ackermann-Liebrich et al. 2009)
2002 Switzerland, Wald 1095 Population cohort of adults (SAPALDIA cohort)
7.8 sp IgE
(Heinzerling et al. 2009)
2006–2007 Switzerland, Zurich not given*
Standardized allergy patients (GA2LEN)
18.6 SPT
(Heinzerling et al. 2009)
2006–2007 United Kingdom, London not given*
Allergy patients (GA2LEN), crude rates given (not standardized)
7.9 SPT
‡ SPT: Skin prick tests; sp IgE: Ragweed specific Immunoglobulin E * Although no specific population for each location is provided, these data are all from the GA2LEN study which collectively included over 3000 people. Hence we assumed that each individual location would have had a large enough population to be included in our study a Excluded from the statistical analysis due to a very low baseline pollen level (< 10 grains m3y‐1)

References
Ackermann-Liebrich U, Schindler C, Frei P, Probst-Hensch NM, Imboden M, Gemperli A, et al.
2009. Sensitisation to Ambrosia in Switzerland: A public health threat in waiting. Swiss Med Wkly
139:70-75.
Albertini R, Ugolotti M, Peveri S, Valenti MT, Usberti I, Ridolo E, et al. 2012. Evolution of
ragweed pollen concentrations, sensitization and related allergic clinical symptoms in Parma
(northern Italy). Aerobiologia 28:347-354.
Asero R, Conte M, Senna GE. 2012. Features of sensitization to airborne allergens among extra-
european immigrants living in 2 distinct areas of Northern Italy. Eur Ann Allergy Clinical Immunol
44:107-112.
ATOPICA. 2014. Atopica Final Report. Brussels:European Union.
Beijer C, Vertegaal M. 2010. Sensitisation to Ambrosia in The Netherlands: a public health threat or
just cross-reaction? Allergy 65:94-94.
Boehme MWJ, Kompauer I, Weidner U, Piechotowski I, Gabrio T, Behrendt H. 2013. Respiratory
symptoms and sensitization to airborne pollen of ragweed and mugwort of adults in Southwest
Germany. Dtsch Med Wochenschr 138:1651-1658.
Burbach GJ, Heinzerling LM, Edenharter G, Bachert C, Bindslev-Jensen C, Bonini S, et al. 2009.
GA2LEN skin test study II: Clinical relevance of inhalant allergen sensitizations in Europe. Allergy
64:1507-1515.
Carosso A, Gallesio MT. 2000. Allergy to ragweed: Clinical relevance in Turin. Aerobiologia
16:155-158.
Cecchi L, D'Amato G, Ayres JG, Galan C, Forastiere F, Forsberg B, et al. 2010. Projections of the
effects of climate change on allergic asthma: The contribution of aerobiology. Allergy 65:1073-
1081.
Cvitanovic S, Znaor L, Kanceljak-Macan B. 2007. Allergic rhinitis and asthma in southern Croatia:

impact of sensitization to Ambrosia elatior. . Croatian Medical Journal 48:68-75.
De Weger LA, Van Der Linden AC, Terreehorst I, Van Der Slikke WJ, Van Vliet AJH, Hiemstra
PS. 2009. Ambrosia in the Netherlands: Allergic sensitivities and spreading of plants and clumps.
Ned Tijdschr Geneeskd 153:798-803.
Deloraine A, Rouvière F. 2000. Place de l’allergie due à l’ambroisie parmi les pollinoses en Rhône-
Alpes. Grenoble, France:Centre Rhône-Alpes d’épidémiologie et de prévention sanitaire
(CAREPS).
Dervaderics M, Fust G, Otos M, Barok J, Pataky G. 2002. Differences in the sensitisation to
ragweed pollen and occurrence of late summer allergic symptoms between native and immigrant
workers of the Nuclear Power Plant of Hungary. Immunol Invest 31:29-40.
Eben R, Gabrio T, Huss-Marp J, Darsow U, Jessberger B, Link B, et al. 2008. Sensitisation to
Ambrosia artemisiifolia (ragweed): a common finding in Southern Germany with potential clinical
relevance. Allergy 63:466-467.
Gabrio T, Alberternst B, Böhme M, Kaminski U, Nawrath S, Behrendt H. 2010. Sensitization to
allergens of Ambrosia artemisiifolia and other allergens on 10 years old children and adults in
Baden-Württemberg. Umweltmed Forsch Prax 15:15-22.
Goracci E, Goracci G. 1996. Ragweed (Ambrosia) pollen presence in Livorno, Central Italy:
Aerobiological and sensitization data. Aerobiologia 12:139-170.
Heinzerling LM, Burbach GJ, Edenharter G, Bachert C, Bindslev-Jensen C, Bonini S, et al. 2009.
GA2LEN skin test study I: GALEN harmonization of skin prick testing: Novel sensitization patterns
for inhalant allergens in Europe. Allergy 64:1498-1506.
Hemmer W, Schauer U, Trinca A, Neumann C, Jarisch R. 2011. Ragweed Pollen Allergy in
Austria: a Retrospective Analysis of Sensitization Rates from 1997 to 2007. J Allergy Clin
Immunol 127:AB170-AB170.
Ianovici N, Panaitescu CB, Brudiu I. 2013. Analysis of airborne allergenic pollen spectrum for
2009 in Timişoara, Romania. Aerobiologia 29:95-111.

Jäger S. 2000. Ragweed (Ambrosia) sensitisation rates correlate with the amount of inhaled
airborne pollen. A 14-year study in Vienna, Austria. Aerobiologia 16:149-153.
Kadocsa E, Juhász M. 2002. Study of airborne pollen composition and allergen spectrum of hay
fever patients in South Hungary (1990-1999). Aerobiologia 18:203-209.
McIntyre M, Jaeger T, Wopfner N, Ferreira F, Ollert M, Ring J, et al. 2010. Ragweed testing in
Bavaria: positive challenge test result in every fourth patient with Ambrosia sensitisation. Allergy
65:200-201.
McIntyre M, Jaeger T, Huss-Marp J, Hauser M, Ferreira F, Ollert M, et al. 2012. 30 Ragweed
Allergy – What Role Does It Play in Bavaria? The World Allergy Organization Journal 5:S27-S28.
McIntyre MS, Jaeger T, Huss-Marp J, Ollert M, Schmidt-Weber C, Ring J, et al. 2011a. Ragweed
sensitization in Bavaria: Results of a three-year Study on clinical Relevance. Journal Der Deutschen
Dermatologischen Gesellschaft 9:132-132.
McIntyre MS, Jaeger T, Huss-Marp J, Wopfner N, Ferreira F, Ollert M, et al. 2011b. Sensitisation
and allergy to ragweed in Bavaria - a health threat? Allergy 66:250-250.
Mehulić M, Mehulić K, Vuljanko IM, Kukulj S, Grle SP, Vukić AD, et al. 2011. Changing pattern
of sensitization in Croatia to aeroallergens in adult population referring to allergy clinic during a
period of 15 years. Coll Antropol 35:529-536.
Milkovska S, Karadzinska-Bislimovska J, Cvetanov V, Janackov B, Minov J, Risteska-Kuc S, et al.
2008. Ambrosia and Artemisia in r. Macedonia: aeropallinological and allergenic significance.
Allergy 63:398-398.
Nekam K, Paldy A, Apatini D, Magyar D, DuBuske LM. 2011. Sensitization Patterns to Allergens
in Ragweed Allergic Patients from Regions of Hungary Having Different Levels of Ragweed
Allergen Exposure. J Allergy Clin Immunol 127:AB255-AB255.
Nikolov G, Hristova-Savova M, Nedyalkov M, Petrunov B. 2013. The Role of Ambrosia Allergen
in respiratory diseases in Bulgaria. Allergy, Asthma & Immunophysiology: From Basic Science to
Clinical Management:35-38.

Peternel R, Milanović SM, Srnec L. 2008. Airborne ragweed (Ambrosia artemisiifolia L.) pollen
content in the city of Zagreb and implications on pollen allergy. Ann Agric Environ Med 15:125-
130.
Popescu F, Tudose AM. 2011. Ambrosia pollen sensitization in allergic rhinitis patients from the
central part of the Romanian Plain Romanian Journal of the Rhinology 1:26-30.
Ruëff F, Przybilla B, Walker A, Gmeiner J, Kramer M, Sabanés-Bové D, et al. 2012. Sensitization
to common ragweed in southern bavaria: Clinical and geographical risk factors in atopic patients.
Int Arch Allergy Immunol 159:65-74.
Rybníček O, Novotná B, Rybníčkova E, Rybníček K. 2000. Ragweed in the Czech Republic.
Aerobiologia 16:287-290.
Tosi A, Wüthrich B, Bonini M, Pietragalla-Köhler B. 2011. Time lag between Ambrosia
sensitisation and Ambrosia allergy: A 20-year study (1989-2008) in Legnano, northern Italy. Swiss
Med Wkly 141.
Toth I, Peternel R, Gajnik D, Vojniković B. 2011. Micro-regional hypersensitivity variations to
inhalant allergens in the city of Zagreb and Zagreb county. Coll Antropol 35:31-37.
Zvezdin B, Radišić P, Kojičić M, Obradović-Anđelić S, Jarić D, Tepavac A, et al. 2004. Alergijske
bolesti respiratornog trakta i polen ambrozije kao njihov uzročni faktor [AMBROSIA POLLEN - A
CAUSATIVE AGENT OF ALLERGIC DISEASES OF THE RESPIRATORY TRACT]. Pneumon
4.

Figure S2; Baseline and future population (percentage) sensitized to ragweed pollen at the NUTS2 level for RCP4.5 and RCP8.5 and a reference plant invasion scenario. Data are presented separately for the CHIMERE and WRF/RegCM model suites. Data source: GISCO - Eurostat (European Commission). Administrative boundaries: © EuroGeographics © UN-FAO © Turkstat.
WR
F/R
egC
M
Baseline (1986-2005) RCP4.5 Future (2041-2060) RCP8.5 Future (2041-2060)
CH
IME
RE
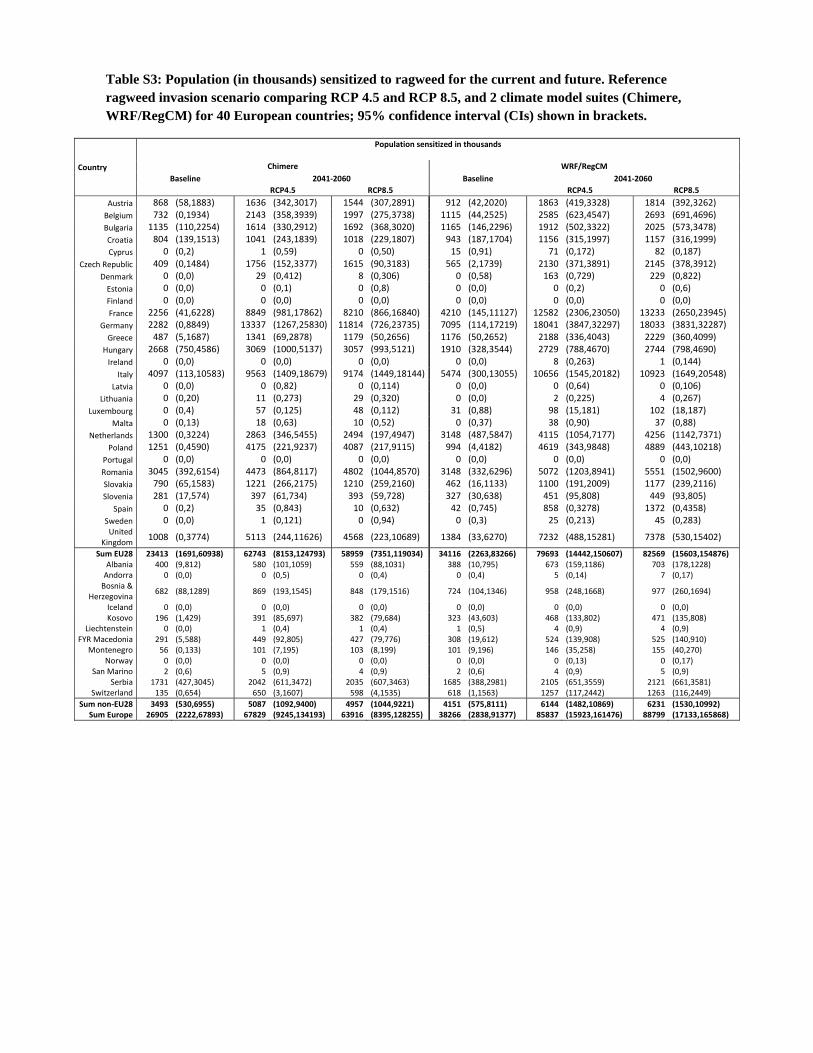
Table S3: Population (in thousands) sensitized to ragweed for the current and future. Reference ragweed invasion scenario comparing RCP 4.5 and RCP 8.5, and 2 climate model suites (Chimere, WRF/RegCM) for 40 European countries; 95% confidence interval (CIs) shown in brackets.
Country
Population sensitized in thousands
Chimere WRF/RegCM Baseline 2041‐2060 Baseline 2041‐2060
RCP4.5 RCP8.5 RCP4.5 RCP8.5
Austria 868 (58,1883) 1636 (342,3017) 1544 (307,2891) 912 (42,2020) 1863 (419,3328) 1814 (392,3262)Belgium 732 (0,1934) 2143 (358,3939) 1997 (275,3738) 1115 (44,2525) 2585 (623,4547) 2693 (691,4696)Bulgaria 1135 (110,2254) 1614 (330,2912) 1692 (368,3020) 1165 (146,2296) 1912 (502,3322) 2025 (573,3478)Croatia 804 (139,1513) 1041 (243,1839) 1018 (229,1807) 943 (187,1704) 1156 (315,1997) 1157 (316,1999)Cyprus 0 (0,2) 1 (0,59) 0 (0,50) 15 (0,91) 71 (0,172) 82 (0,187)
Czech Republic 409 (0,1484) 1756 (152,3377) 1615 (90,3183) 565 (2,1739) 2130 (371,3891) 2145 (378,3912)Denmark 0 (0,0) 29 (0,412) 8 (0,306) 0 (0,58) 163 (0,729) 229 (0,822)Estonia 0 (0,0) 0 (0,1) 0 (0,8) 0 (0,0) 0 (0,2) 0 (0,6)Finland 0 (0,0) 0 (0,0) 0 (0,0) 0 (0,0) 0 (0,0) 0 (0,0)France 2256 (41,6228) 8849 (981,17862) 8210 (866,16840) 4210 (145,11127) 12582 (2306,23050) 13233 (2650,23945)
Germany 2282 (0,8849) 13337 (1267,25830) 11814 (726,23735) 7095 (114,17219) 18041 (3847,32297) 18033 (3831,32287)Greece 487 (5,1687) 1341 (69,2878) 1179 (50,2656) 1176 (50,2652) 2188 (336,4043) 2229 (360,4099)
Hungary 2668 (750,4586) 3069 (1000,5137) 3057 (993,5121) 1910 (328,3544) 2729 (788,4670) 2744 (798,4690)Ireland 0 (0,0) 0 (0,0) 0 (0,0) 0 (0,0) 8 (0,263) 1 (0,144)
Italy 4097 (113,10583) 9563 (1409,18679) 9174 (1449,18144) 5474 (300,13055) 10656 (1545,20182) 10923 (1649,20548)Latvia 0 (0,0) 0 (0,82) 0 (0,114) 0 (0,0) 0 (0,64) 0 (0,106)
Lithuania 0 (0,20) 11 (0,273) 29 (0,320) 0 (0,0) 2 (0,225) 4 (0,267)Luxembourg 0 (0,4) 57 (0,125) 48 (0,112) 31 (0,88) 98 (15,181) 102 (18,187)
Malta 0 (0,13) 18 (0,63) 10 (0,52) 0 (0,37) 38 (0,90) 37 (0,88)Netherlands 1300 (0,3224) 2863 (346,5455) 2494 (197,4947) 3148 (487,5847) 4115 (1054,7177) 4256 (1142,7371)
Poland 1251 (0,4590) 4175 (221,9237) 4087 (217,9115) 994 (4,4182) 4619 (343,9848) 4889 (443,10218)Portugal 0 (0,0) 0 (0,0) 0 (0,0) 0 (0,0) 0 (0,0) 0 (0,0)Romania 3045 (392,6154) 4473 (864,8117) 4802 (1044,8570) 3148 (332,6296) 5072 (1203,8941) 5551 (1502,9600)Slovakia 790 (65,1583) 1221 (266,2175) 1210 (259,2160) 462 (16,1133) 1100 (191,2009) 1177 (239,2116)Slovenia 281 (17,574) 397 (61,734) 393 (59,728) 327 (30,638) 451 (95,808) 449 (93,805)
Spain 0 (0,2) 35 (0,843) 10 (0,632) 42 (0,745) 858 (0,3278) 1372 (0,4358)Sweden 0 (0,0) 1 (0,121) 0 (0,94) 0 (0,3) 25 (0,213) 45 (0,283)United
Kingdom 1008 (0,3774) 5113 (244,11626) 4568 (223,10689) 1384 (33,6270) 7232 (488,15281) 7378 (530,15402)
Sum EU28 23413 (1691,60938) 62743 (8153,124793) 58959 (7351,119034) 34116 (2263,83266) 79693 (14442,150607) 82569 (15603,154876)Albania 400 (9,812) 580 (101,1059) 559 (88,1031) 388 (10,795) 673 (159,1186) 703 (178,1228)Andorra 0 (0,0) 0 (0,5) 0 (0,4) 0 (0,4) 5 (0,14) 7 (0,17)Bosnia &
Herzegovina 682 (88,1289) 869 (193,1545) 848 (179,1516) 724 (104,1346) 958 (248,1668) 977 (260,1694)
Iceland 0 (0,0) 0 (0,0) 0 (0,0) 0 (0,0) 0 (0,0) 0 (0,0)Kosovo 196 (1,429) 391 (85,697) 382 (79,684) 323 (43,603) 468 (133,802) 471 (135,808)
Liechtenstein 0 (0,0) 1 (0,4) 1 (0,4) 1 (0,5) 4 (0,9) 4 (0,9)FYR Macedonia 291 (5,588) 449 (92,805) 427 (79,776) 308 (19,612) 524 (139,908) 525 (140,910)
Montenegro 56 (0,133) 101 (7,195) 103 (8,199) 101 (9,196) 146 (35,258) 155 (40,270)Norway 0 (0,0) 0 (0,0) 0 (0,0) 0 (0,0) 0 (0,13) 0 (0,17)
San Marino 2 (0,6) 5 (0,9) 4 (0,9) 2 (0,6) 4 (0,9) 5 (0,9) Serbia 1731 (427,3045) 2042 (611,3472) 2035 (607,3463) 1685 (388,2981) 2105 (651,3559) 2121 (661,3581)
Switzerland 135 (0,654) 650 (3,1607) 598 (4,1535) 618 (1,1563) 1257 (117,2442) 1263 (116,2449)Sum non‐EU28 3493 (530,6955) 5087 (1092,9400) 4957 (1044,9221) 4151 (575,8111) 6144 (1482,10869) 6231 (1530,10992)
Sum Europe 26905 (2222,67893) 67829 (9245,134193) 63916 (8395,128255) 38266 (2838,91377) 85837 (15923,161476) 88799 (17133,165868)

Table S4: Current and future populations clinically sensitized to ragweed pollen. Changes due to population change are also presented. Data are average of the CHIMERE and WRF/RegCM model suites for RCP4.5 and a reference plant invasion scenario.
Country
Clinical sensitization value (%)a
Projected change in population, baseline
to 2050 (%)
Population clinically sensitized in thousands [CHIMERE, WRF/RegCM]*
Baseline 2041-2060 2041-2060
plus population change Austria 62.4 7.8 555 [542,569] 1092 [1021,1163] 1176 [1101,1254]
Belgium 100 9.4 923 [732,1115] 2364 [2143,2585] 2585 [2344,2828] Bulgaria 75.9b -31.2 873 [861,884] 1338 [1225,1451] 920 [843,998] Croatia 75.9b -19.9 663 [610,716] 834 [790,877] 668 [633,702] Cyprus 75.9b 22.9 6 [0,11] 27 [1,54] 33 [1,66]
Czech Republic 75.9b 5.4 370 [310,429] 1475 [1333,1617] 1554 [1405,1704] Denmark 64.6 12.5 0 [0,0] 62 [19,105] 70 [21,118]
Estonia 75.9b -14.2 0 [0,0] 0 [0,0] 0 [0,0] Finland 60.9 5.3 0 [0,0] 0 [0,0] 0 [0,0] France 50.0 12.6 1616 [1128,2105] 5358 [4425,6291] 6035 [4983,7084]
Germany 83.6 -15.9 3919 [1908,5931] 13116 [11150,15082] 11037 [9377,12684] Greece 43.6 -7.0 363 [212,585] 769 [513,954] 715 [477,887]
Hungary 92.4 -11.5 2115 [2465,1765] 2678 [2836,2522] 2370 [2510,2232] Ireland 75.9b 29.2 0 [0,0] 3 [0,6] 4 [0,8]
Italy 88.6 -2.4 4240 [3630,4850] 8957 [8473,9441] 8738 [8270,9214] Latvia 75.9b -22.5 0 [0,0] 0 [0,0] 0 [0,0]
Lithuania 75.9b -19.8 0 [0,0] 5 [8,2] 4 [6,2] Luxembourg 75.9b 37.1 12 [0,24] 59 [43,74] 81 [59,101]
Malta 75.9b -2.1 0 [0,0] 21 [14,29] 21 [14,28] Netherlands 89.8 -0.6 1997 [1167,2827] 3133 [2571,3695] 3115 [2556,3673]
Poland 50.0 -11.3 561 [626,497] 2199 [2088,2310] 1951 [1852,2049] Portugal 87.1 -8.8 0 [0,0] 0 [0,0] 0 [0,0] Romania 75.9b -19.6 2350 [2311,2389] 3622 [3395,3850] 2913 [2730,3095] Slovakia 75.9b -8.4 475 [600,351] 881 [927,835] 807 [849,765] Slovenia 75.9b -3.4 231 [213,248] 322 [301,342] 311 [291,330]
Spain 75.9b 1.6 16 [0,32] 339 [27,651] 345 [27,661] Sweden 75.9b 25.8 0 [0,0] 10 [1,19] 12 [1,24]
UK 89.9 16.4 1075 [906,1244] 5549 [4597,6502] 6462 [5351,7568]
Sum EU28 22361 [18221,26572] 54212 [47901,60457] 51928 [47901,60457]
Albania 75.9b -6.0 299 [304,294] 475 [440,511] 447 [414,480] Andorra 75.9b 21.9 0 [0,0] 2 [0,4] 2 [0,5]
Bosnia & Herzegovina
75.9b -13.4 534 [518,550] 693 [660,727] 601 [572,630]
Iceland 75.9b 27.0 0 [0,0] 0 [0,0] 0 [0,0] Kosovo 75.9b 29.5 197 [149,245] 326 [297,355] 422 [385,460]
Liechtenstein 75.9b 21.8 0 [0,1] 2 [1,3] 2 [1,4] FYR Macedonia 75.9b -10.5 227 [221,234] 369 [341,398] 330 [305,356]
Montenegro 75.9b -10.2 60 [43,77] 94 [77,111] 84 [69,100] Norway 75.9b 33.1 0 [0,0] 0 [0,0] 0 [0,0]
San Marino 75.9b 6.9 2 [2,2] 3 [4,3] 4 [4,3] Serbia 75.9b -30.9 1296 [1314,1279] 1574 [1550,1598] 1087 [1071,1104]
Switzerland 52.2 34.4 196 [70,323] 498 [339,656] 669 [456,882]
Sum non-EU28 2811 [2621,3005] 4036 [3709,4366] 3649 [3709,4366] Sum Europe 25172 [20842,29577] 58248 [51610,64823] 55577 [51610,64823]
a Country level estimates of the proportion of ragweed sensitized individuals who will experience clinical symptoms. Data from Burbach et al. (2009). Where country specific data is not available b the European average value of 75.9% is used