supplemental information cd301b mononuclear … · cd301b+ mononuclear phagocytes maintain positive...
TRANSCRIPT

Immunity, Volume 45
Supplemental Information
CD301b+ Mononuclear Phagocytes Maintain
Positive Energy Balance through Secretion
of Resistin-like Molecule Alpha
Yosuke Kumamoto, Joao Paulo G. Camporez, Michael J. Jurczak, MaryaShanabrough, Tamas Horvath, Gerald I. Shulman, and Akiko Iwasaki

B
C
Supplementary Figure 1
-10.0
-7.5
-5.0
-2.5
0.0
2.5 ***
***n.s.
n.s. *
Wei
ght
chan
ge [g
ram
s]
DTPBS DT DT
WT Mgl2-DTR
CD207-DTR
PBS
-5.0
-2.5
0.0
2.5
5.0
Wei
ght
chan
ge [g
ram
s]
-10
-5
0
5
3 weeksHFD
PBS
**
4 monthsHFD
**
A
4.44
4.8
8.62
1.73
4.4
1.19
38
30.2
Siglec F NK1.1 CD25
Eosinophil
CD
11b
CD
3ε
CD
127
WT
Mgl2-DTR
NK/NKT ILC2
DTPBS DT
Supplementary Figure 1 (related to Figure 2). Depletion of CD301b+ MNPs results in weight loss. (A,C) Weight loss in Mgl2-DTR mice after DT treatment is expressed in absolute weight. (B) Impact of DTtreatment on non-MNP subsets in Mgl2-DTR mice. Regular chow-fed WT or Mgl2-DTR mice were treated with DT for 10 days as in Figure 2A and examined for the expression of indicated markers in the EWAT. Eosinophils (CD11b+Siglec F+) and NK or NKT cells (NK1.1+CD3ε- or CD3ε+) are gated on total CD45+ cells and type 2 innate lymphoid cells (ILC2, CD127+CD25+) are gated on CD45+ CD3ε- CD4- CD8α- CD11b- CD19- CD49b- FcεRI- SiglecF- cells.
Supplementary Figure 2
0.00
0.050.10
0.15
0.200.25
0.30
0.350.40
0.45
*** ** *
*
***
***
** *
* *
*
*Feed
ing
[g/h
r]
7AM8A
M9A
M10
AM11
AM12
AM1P
M2P
M3P
M4P
M5P
M6P
M7P
M8P
M9P
M10
PM11
PM12
PM1A
M2A
M3A
M4A
M5A
M6A
M
Light hours Dark hours
Regular chow+PBSRegular chow+DT3wk HFD+PBS3wk HFD+DT
0.3
0.4
0.5
0.6
0.7
* * * * * * * **
* * ** * *** * * * * *Ene
rgy
exp
end
iture
[kca
l/hr]
7AM8A
M9A
M10
AM11
AM12
AM1P
M2P
M3P
M4P
M5P
M6P
M7P
M8P
M9P
M10
PM11
PM12
PM1A
M2A
M3A
M4A
M5A
M6A
M
Light hours Dark hours
0.00
0.05
0.10
0.15
0.20
0.25
Feed
ing
[g/h
r]
*
- +RC HFD
- +
**
0.00
0.25
0.50
0.75
Cal
orie
s [k
cal/h
r]
** **
- +RC HFD
- +0.25
0.30
0.35
0.40
0.45
0.50
0.55
0.60
0.65
Ene
rgy
exp
end
iture
[kca
l/hr]
* n.s.
- +RC HFD
- +-0.3
-0.2
-0.1
-0.0
0.1
0.2
0.3
Inta
ke-E
xpen
ditu
re[k
cal/h
r]
- +RC HFD
- +
** **
c-fos in PBN
0
250
500
750
1000
c-fo
s in
PB
N
DT PBS DTWT Mgl2-DTR
n.s.n.s.
n.s.
0
50
100
150
200
250
c-fo
s in
AN
c-fos in AN
DT PBS DTWT Mgl2-DTR
n.s.n.s.
n.s.
c-fos in AN POMC
0
5
10
15
20
25
30
35
%c-
fos+
in A
N P
OM
C
DT PBS DTWT Mgl2-DTR
n.s.n.s.
n.s.
POMC in AN
0
50
100
150
200
PO
MC
in A
N
DT PBS DTWT Mgl2-DTR
n.s.n.s.
n.s.
A
B
C
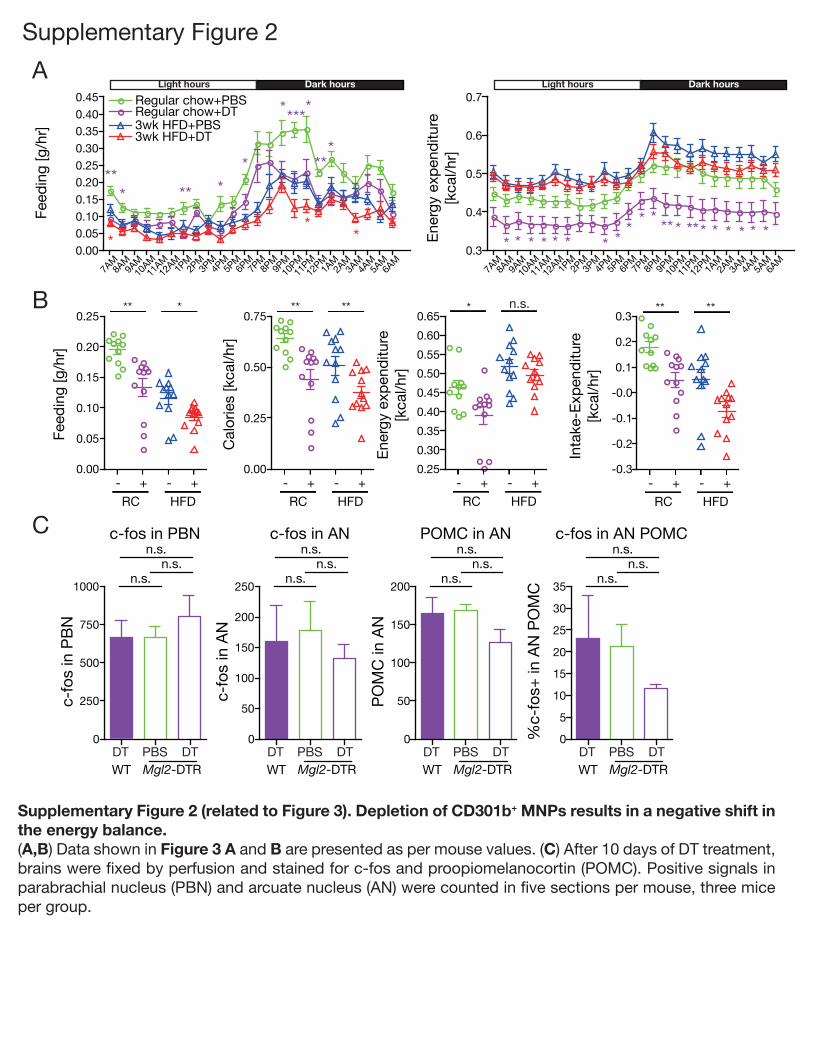
Supplementary Figure 2 (related to Figure 3). Depletion of CD301b+ MNPs results in a negative shift in the energy balance.(A,B) Data shown in Figure 3 A and B are presented as per mouse values. (C) After 10 days of DT treatment, brains were fixed by perfusion and stained for c-fos and proopiomelanocortin (POMC). Positive signals in parabrachial nucleus (PBN) and arcuate nucleus (AN) were counted in five sections per mouse, three mice per group.

Supplementary Figure 3
EWAT IWAT Liver
EWAT
IWATLiver
13
22
58
1
10
1. SYSTEMIC LUPUS ERYTHEMATOSUS2. B CELL RECEPTOR SIGNALING PATHWAY3. INTESTINAL IMMUNE NETWORK FOR IGA PRODUCTION4. PRIMARY IMMUNODEFICIENCY5. LEISHMANIA INFECTION6. NATURAL KILLER CELL MEDIATED CYTOTOXICITY7. LYSOSOME8. HEMATOPOIETIC CELL LINEAGE9. FC GAMMA R MEDIATED PHAGOCYTOSIS
10. TOLL LIKE RECEPTOR SIGNALING PATHWAY11. VIRAL MYOCARDITIS12. COMPLEMENT AND COAGULATION CASCADES13. ASTHMA14. FC EPSILON RI SIGNALING PATHWAY15. RETINOL METABOLISM16. GRAFT VERSUS HOST DISEASE17. ALLOGRAFT REJECTION18. T CELL RECEPTOR SIGNALING PATHWAY19. PRION DISEASES20. TYPE I DIABETES MELLITUS21. ANTIGEN PROCESSING AND PRESENTATION22. AUTOIMMUNE THYROID DISEASE
1. DNA REPLICATION2. CELL CYCLE3. CHEMOKINE SIGNALING PATHWAY4. BASE EXCISION REPAIR5. RIBOSOME6. CYTOKINE CYTOKINE RECEPTOR INTERACTION7. PPAR SIGNALING PATHWAY8. JAK STAT SIGNALING PATHWAY9. OTHER GLYCAN DEGRADATION
10. AMINOACYL TRNA BIOSYNTHESIS11. REGULATION OF ACTIN CYTOSKELETON12. STEROID BIOSYNTHESIS13. PORPHYRIN AND CHLOROPHYLL METABOLISM
1. CELL ADHESION MOLECULES CAMS2. OXIDATIVE PHOSPHORYLATION3. LEUKOCYTE TRANSENDOTHELIAL MIGRATION4. METABOLISM OF XENOBIOTICS BY CYTOCHROME P4505. TRYPTOPHAN METABOLISM
1. MATURITY ONSET DIABETES OF THE YOUNG2. TYROSINE METABOLISM3. NEUROACTIVE LIGAND RECEPTOR INTERACTION4. TGF BETA SIGNALING PATHWAY5. BASAL CELL CARCINOMA6. CALCIUM SIGNALING PATHWAY7. BUTANOATE METABOLISM8. PRIMARY BILE ACID BIOSYNTHESIS
1. OLFACTORY TRANSDUCTION
1. ARACHIDONIC ACID METABOLISM
A
B
Supplementary Figure 3 (related to Figure 6). Depletion of CD301b+ MNPs affects distinct pathways in the WAT and liver. Gene set enrichment analysis of the microarray data shown in Figure 6. Differentially regulated KEGG path-ways with nominal p<0.05 are shown.

Supplemental Experimental Procedures
Mice and treatments
Colonies of WT C57BL/6N (WT), Mgl2-DTR (Mgl2+/DTReGFP) and homozygotic
Mgl2DTReGFP/DTReGFP mice were maintained in our specific pathogen-free facility at room
temperature (20-22ºC). CD207-DTR mice were a gift from Daniel Kaplan and
maintained in our colony. Transgene-bearing CD207-DTR mice were screened as
previously described (Bobr et al., 2010). YARG mice were a gift from Ruslan Medzhitov.
Adipoq-/- mice were purchased from the Jackson Laboratory and crossed with
Mgl2DTReGFP/DTReGFP to make Mgl2+/DTReGFP;Adipoq-/- mice. Unless otherwise stated, 3-6
month-old males were used for experiments. Where indicated, mice were fed with HFD
(60% kcal% fat, D12492, Research Diets) for indicated period of time. For in vivo cell
depletion analyses, DT (0.5 µg/mouse/dose, List Biological Laboratories) was given
intraperitoneally every three days for four times, then mice were sacrificed on day 10. In
HFD-fed animals, DT was given in the last 10 days of the indicated HFD feeding period.
For chemical sympathectomy, WT mice were injected intraperitoneally twice with 3.5
mg/mouse/dose 6-hydroxydopamine (~100 µg/g body weight, MP Biomedicals)
dissolved in 0.07% (w/v) ascorbic acid (Sigma) in PBS on 1 and 3 days prior to the first
DT treatment, as previously described (Riol-Blanco et al., 2014). For reconstitution of
RELMα, 10 µg of bacteria-expressed RELMα (Peprotech) was injected
intraperitoneally every three days for four times as previously described (Osborne et al.,
2013), at the same time with the DT treatments. In general, animals with different
treatments were co-housed in the same cages to avoid cage-to-cage variation. For
indirect calorimetry, mice were individually housed during the 10-day DT treatment

period and their metabolic activity was monitored in metabolic cages in the last five
days. All animal protocols were approved by the Institutional Animal Care and Use
Committee at Yale University.
Cell preparation and flow cytometry
For adipose-tissue leukocytes, the fat pad was minced and digested with 2
mg/ml collagenase D (Roche), then the stromal vascular fraction was collected by
centrifuging at 500 x g for 5 minutes. For colonic MNPs, the colonic epithelium was
removed by 5 mM EDTA, then the remaining tissue was minced and digested with
collagenase D. Peritoneal leukocytes were collected from naïve WT mice by flushing
the peritoneal cavity with PBS. Blood leukocytes were collected by separating the blood
with Histopaque-1077 (Sigma). For isolating cells from the adipose tissue, liver, skeletal
muscle and pancreas, mice were briefly perfused with PBS, then the organs were
removed, minced and digested with 5 mg/ml collagenase D and 2 mg/ml DNase I
(Roche). For hepatic leukocytes, the resulting cell suspensions were then further
separated by Histopaque-1077 by collecting the interphase after centrifuging at 500 x g
for 20 minutes. Cells were stained with monoclonal antibodies against CD11b (clone
M1/70), CD11c (N418), F4/80 (BM8), MHCII (M5/114.15.2), CD206 (C068C2), and
CD301b (11A10-B7) or rat IgG2a isotype control (RTK2758). All monoclonal antibodies
were purchased from Biolegend except anti-CD301b, which was developed and
prepared in-house (Kumamoto et al., 2013). For intracellular RELMα staining, cells pre-
stained for MNP markers were fixed with Fixation/Permiabilization Reagent
(eBioscience) and stained with biotinylated rabbit anti-mouse RELMα (Peprotech),

followed by detection with streptavidin-PE-Dazzle 594 (BioLegend).
Gene expression analyses
Harvested tissues were immediately minced and lysed in Trizol (Invitrogen)
and stored frozen at -80ºC. Total RNA was isolated with chloroform and isopropanol,
then cleaned up with RNeasy Mini Kit (Qiagen). RNA isolated from epididymal and
inguinal WAT and the liver was analyzed with Affymetrix Mouse Gene 2.0ST Microarray
according to manufacturer's protocol. For real-time PCR, cDNA was synthesized with
iScript cDNA synthesis kit (Bio-Rad). Genes were amplified with iTaq Universal SYBR
Green Supermix (Bio-Rad) with the primers listed in Supplementary Information and
their relative amount to Hprt was calculated by quantitative real-time PCR.
ELISA and metabolite measurements
Sera were stored frozen at -80ºC upon harvest. Serum leptin (Mouse Leptin
(OB) ELISA Kit, Sigma), adiponectin (Adiponectin (mouse) ELISA Kit, Adipogen), free
and total cholesterol (Total Cholesterol and Cholesteryl Ester Colorimetric Assay Kit II,
BioVision), free and total T3 (fT3 and total T3 ELISA Kit, Alpha Diagnostic) and
corticosterone (Corticosterone ELISA Kit, Abnova) were measured according to
manufacturer's protocol. For quantifying serum RELMα, ELISA plates were coated with
50 µl/well, 2 µg/ml rabbit anti-murine RELMα and serum RELMα was detected by 50
µl/well, 2 µg/ml biotinylated rabbit anti-murine RELMα using recombinant RELMα (all
reagents are from Peprotech) as quantification standard.

Glucose tolerance tests and hyperinsulinemic euglycemic clamps
Experiments evaluating glucose homeostasis were performed according to
recommendations by the NIH-funded Mouse Metabolic Phenotyping Center (MMPC)
consortium (Ayala et al., 2010). Glucose tolerance tests were performed after an
overnight fast. Blood was collected by tail bleed for measures of plasma glucose and
insulin at set time points following an i.p. challenge of 1 mg/g body weight dextrose.
Glucose was measured using a YSI Glucose Analyzer or a Breeze2 Glucometer (Bayer)
and insulin was measured by radioimmunoassay (Linco). Hyperinsulinemic euglycemic
clamps were performed as previously described (Jurczak et al., 2012). After surgical
implantation of an indwelling catheter in the right jugular vein, mice were allowed to
recover 1 week prior to clamp experiments. Following an overnight 14h fast, mice were
infused with 3-3H-glucose at a rate of 0.05 µCi/min for 120 min to determine basal
glucose turnover. Next, a primed infusion of insulin and 3-3H-glucose was administered
at 7.14 mU·kg-1·min-1 and 0.24 µCi/min, respectively, for 4 min, after which rates were
reduced to 3 mU·kg-1·min-1 insulin and 0.1 µCi/min 3-3H-glucose for the remainder of
the experiment. Blood was collected via tail massage for monitoring plasma glucose,
insulin and tracer at set time points during the 140 min infusion, and a variable infusion
of 20% dextrose was given to maintain euglycemia. Glucose turnover was calculated
as the ratio of the 3-3H-glucose infusion rate to the specific activity of plasma glucose at
the end of the basal infusion and during the last 40 min of the hyperinsulinemic-
euglycemic clamp study. Hepatic glucose production represents the difference between
the glucose infusion rate and the rate of glucose appearance. A 10 µCi bolus injection of
14C-2-deoxyglucose was given at 90 min to determine tissue-specific glucose uptake,
which was calculated from the area under the curve of 14C-2-deoxyglucose detected in
plasma and the tissue content of 14C-2-deoxyglucose-6-phosphate. Following collection
of the final blood sample, mice were anesthetized with an intravenous injection of 150
mg/kg pentobarbital and tissues were harvested and froze with aluminum forceps in
liquid nitrogen. All tissues were stored at -80o C until later use.
c-Fos staining in the brain
Under deep anesthesia, mice were perfused with a fixative containing 4%
paraformaldehyde, 15% picric acid, 0.1% glutaraldehyde in 0.1 M phosphate buffer.
Fifty micron sections were cut through the ARN and PBN of the brain, and every third
section was used for immunostaining. For staining ARN, sections were stained with
goat anti-c-Fos (Santa Cruz) and, where applicable, with rabbit anti-POMC (Phoenix
Pharmaceuticals), followed by visualization with Alexa fluor 594 donkey anti-rabbit and
Alexa fluor 488 donkey anti-goat (Life Technologies) in a Zeiss Axioplan 2 imaging
system. For staining PBN, sections were incubated with goat anti-c-Fos, then with
biotinylated donkey anti-goat IgG (Vector Labs). Specific antibody binding was
detected by avidin-coujugated peroxidase (ABC, Vector Labs) with diaminobenzidine.
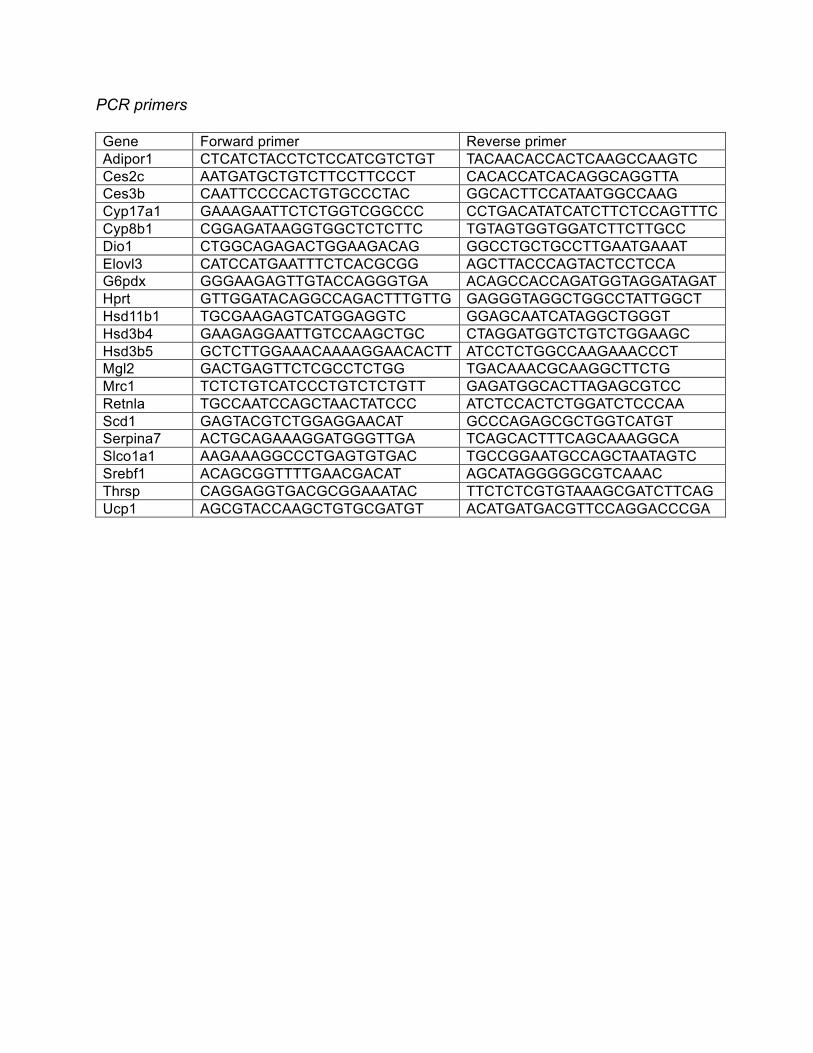
PCR primers Gene Forward primer Reverse primer Adipor1 CTCATCTACCTCTCCATCGTCTGT TACAACACCACTCAAGCCAAGTC Ces2c AATGATGCTGTCTTCCTTCCCT CACACCATCACAGGCAGGTTA Ces3b CAATTCCCCACTGTGCCCTAC GGCACTTCCATAATGGCCAAG Cyp17a1 GAAAGAATTCTCTGGTCGGCCC CCTGACATATCATCTTCTCCAGTTTC Cyp8b1 CGGAGATAAGGTGGCTCTCTTC TGTAGTGGTGGATCTTCTTGCC Dio1 CTGGCAGAGACTGGAAGACAG GGCCTGCTGCCTTGAATGAAAT Elovl3 CATCCATGAATTTCTCACGCGG AGCTTACCCAGTACTCCTCCA G6pdx GGGAAGAGTTGTACCAGGGTGA ACAGCCACCAGATGGTAGGATAGAT Hprt GTTGGATACAGGCCAGACTTTGTTG GAGGGTAGGCTGGCCTATTGGCT Hsd11b1 TGCGAAGAGTCATGGAGGTC GGAGCAATCATAGGCTGGGT Hsd3b4 GAAGAGGAATTGTCCAAGCTGC CTAGGATGGTCTGTCTGGAAGC Hsd3b5 GCTCTTGGAAACAAAAGGAACACTT ATCCTCTGGCCAAGAAACCCT Mgl2 GACTGAGTTCTCGCCTCTGG TGACAAACGCAAGGCTTCTG Mrc1 TCTCTGTCATCCCTGTCTCTGTT GAGATGGCACTTAGAGCGTCC Retnla TGCCAATCCAGCTAACTATCCC ATCTCCACTCTGGATCTCCCAA Scd1 GAGTACGTCTGGAGGAACAT GCCCAGAGCGCTGGTCATGT Serpina7 ACTGCAGAAAGGATGGGTTGA TCAGCACTTTCAGCAAAGGCA Slco1a1 AAGAAAGGCCCTGAGTGTGAC TGCCGGAATGCCAGCTAATAGTC Srebf1 ACAGCGGTTTTGAACGACAT AGCATAGGGGGCGTCAAAC Thrsp CAGGAGGTGACGCGGAAATAC TTCTCTCGTGTAAAGCGATCTTCAG Ucp1 AGCGTACCAAGCTGTGCGATGT ACATGATGACGTTCCAGGACCCGA