supplemental financial information - seagate.com financial information fiscal ... and other...
TRANSCRIPT

1
Supplemental Financial Information Fiscal Q1 2018 (quarter ended September 29, 2017) October 23, 2017
10/22/2017
Supplemental Financial Information
FISCAL Q1 2018

2
Supplemental Financial Information Fiscal Q1 2018 (quarter ended September 29, 2017) October 23, 2017
Safe Harbor Statement
This document contains forward-looking statements within the meaning of Section 27A of the Securities Act of 1933 and Section 21E of the Securities Exchange Act of 1934, each
as amended, including, in particular, statements about the Company’s plans, strategies and prospects, estimates of industry growth, market demand, and dividend issuance plans
for the fiscal quarter ending December 29, 2017 and beyond. These statements identify prospective information and may include words such as “expects,” “intends,” “plans,”
“anticipates,” “believes,” “estimates,” “predicts,” “projects,” “should,” “may,” “will,” or the negative of these words, variations of these words and comparable terminology. These
forward-looking statements are based on information available to the Company as of the date of this report and are based on management’s current views and assumptions. These
forward-looking statements are conditioned upon and also involve a number of known and unknown risks, uncertainties, and other factors that could cause actual results,
performance or events to differ materially from those anticipated by these forward-looking statements. Such risks, uncertainties, and other factors may be beyond the Company’s
control and may pose a risk to the Company’s operating and financial condition. Such risks and uncertainties include, but are not limited to: items that may be identified during its
financial statement closing process that cause adjustments to the estimates included in this report; the uncertainty in global economic conditions; the impact of the variable demand
and adverse pricing environment for disk drives; the Company’s ability to successfully qualify, manufacture and sell its disk drive products in increasing volumes on a cost-effective
basis and with acceptable quality; the impact of competitive product announcements; the Company’s ability to achieve projected cost savings in connection with its restructuring
plans; possible excess industry supply with respect to particular disk drive products; disruptions to its supply chain or production capabilities; unexpected advances in competing
technologies or changes in market trends; the development and introduction of products based on new technologies and expansion into new data storage markets; the Company’s
ability to comply with certain covenants in its credit facilities with respect to financial ratios and financial condition tests; currency fluctuations that may impact the Company’s
margins and international sales; cyber-attacks or other data breaches that disrupt the Company’s operations or result in the dissemination of proprietary or confidential information
and cause reputational harm; and fluctuations in interest rates. Information concerning risks, uncertainties and other factors that could cause results to differ materially from the
expectations described in this press release is contained in the Company’s Annual Report on Form 10-K filed with the U.S. Securities and Exchange Commission on August 4,
2017, the “Risk Factors” section of which is incorporated into this press release by reference, and other documents filed with or furnished to the Securities and Exchange
Commission. These forward-looking statements should not be relied upon as representing the Company’s views as of any subsequent date and the Company undertakes no
obligation to update forward-looking statements to reflect events or circumstances after the date they were made.
3
Supplemental Financial Information Fiscal Q1 2018 (quarter ended September 29, 2017) October 23, 2017
Use of Non-GAAP Financial Information
To supplement the condensed consolidated financial statements presented in accordance with generally accepted accounting principles (GAAP), the Company provides non-GAAP
measures of adjusted revenue, net income, diluted earnings per share, earnings per share, gross margin, gross margin as a percentage of revenue, operating expenses, free cash
flow, EBITDA and Credit Agreement defined EBITDA which are adjusted from results based on GAAP to exclude certain expenses, gains and losses. These non-GAAP financial
measures are provided to enhance the user's overall understanding of the Company’s current financial performance and our prospects for the future. Specifically, the Company
believes non-GAAP results provide useful information to both management and investors as these non-GAAP results exclude certain expenses, gains and losses that we believe
are not indicative of our core operating results and because it is similar to the approach used in connection with the financial models and estimates published by financial analysts
who follow the Company. Free cash flow does not reflect all of the Company's expenses and non-cash items and does not reflect the Company's uses of cash in financing and
investment activities.
These non-GAAP results are some of the primary measurements management uses to assess the Company’s performance, allocate resources and plan for future periods.
Reported non-GAAP results should only be considered as supplemental to results prepared in accordance with GAAP, and not considered as a substitute for, or superior to, GAAP
results. These non-GAAP measures may differ from the non-GAAP measures reported by other companies in our industry.

4
Supplemental Financial Information Fiscal Q1 2018 (quarter ended September 29, 2017) October 23, 2017
1. See ‘Reconciliation Tables’ section for GAAP reconciliation.
Q1 FY2018 Financial Highlights
$237M
$2.6B 28.0% 70.3EB
29.0%
$0.62
$0.96 1.9TB
Revenue Gross Margin Diluted EPSHDD Capacity
Shipped
Cash Flow from Operations
Avg. Capacity per Drive
GAAP GAAP
Gross Margin
NON-GAAP1
Diluted EPS
NON-GAAP1

5
Supplemental Financial Information Fiscal Q1 2018 (quarter ended September 29, 2017) October 23, 2017
1. See ‘Reconciliation Tables’ section for GAAP reconciliation.
2. The number of shares used in the Non-GAAP diluted net income per share computation for Q3'16 is 299 million as it includes dilutive shares related to employee equity award plans. Such shares were excluded from the computation of GAAP diluted net income per share as to do so would be anti-dilutive.
3. HDD Revenue by Channel reflects channel distribution of HDD revenue only.
Quarterly Financial Trends
Q1’16 Q2’16 Q3’16 Q4’16 Q1’17 Q2’17 Q3’17 Q4’17 Q1’18
GAAP Results
Revenue ($M) 2,925 2,986 2,595 2,654 2,797 2,894 2,674 2,406 2,632
Gross Margin % 23.6% 24.8% 20.2% 24.9% 28.6% 30.8% 30.5% 27.7% 28.0%
Operating Expenses ($M) 603 512 497 559 580 521 550 470 481
Net Income (loss) ($M) 34 165 (21) 70 167 297 194 114 181
Diluted EPS (LPS) $0.11 $0.55 ($0.07) $0.23 $0.55 $1.00 $0.65 $0.38 $0.62
Non-GAAP Results1
Revenue ($M) 2,927 2,985 2,591 2,653 2,797 2,893 2,675 2,406 2,632
Gross Margin % 24.2% 25.6% 22.7% 25.8% 29.5% 31.8% 31.4% 28.9% 29.0%
Operating Expenses ($M) 501 453 439 443 472 458 443 422 408
Net Income ($M) 165 246 66 207 299 412 329 192 279
Diluted EPS2 $0.54 $0.82 $0.22 $0.69 $0.99 $1.38 $1.10 $0.65 $0.96
End of Qtr Actual Share Count (M) 299 296 298 299 299 295 297 292 289
Diluted Shares O/S for EPS (M) 308 301 298 300 301 298 300 297 292
Dividends Per Share Paid $0.54 $0.63 $0.63 $0.63 - $0.63 $0.63 $0.63 $0.63
Shares Repurchased (M) 20.0 2.9 - - 3.0 4.1 - 5.0 5.0
Fiscal YTD Shares Repurchased (M) 20.0 23.0 23.0 23.0 3.0 7.1 7.1 12.1 5.0
Revenue by Product Line ($M)
HDD 2,722 2,727 2,371 2,455 2,589 2,652 2,424 2,220 2,390
Enterprise Systems, Flash, and Other 203 259 224 199 208 242 250 186 242
HDD Revenue by Channel 3
OEM 69% 68% 69% 71% 70% 66% 66% 67% 67%
Distributors 18% 16% 16% 16% 18% 18% 19% 18% 17%
Retail 13% 16% 15% 13% 12% 16% 15% 15% 16%

6
Supplemental Financial Information Fiscal Q1 2018 (quarter ended September 29, 2017) October 23, 2017
1. Consumer Electronics includes exabytes from surveillance, DVR, NAS, and gaming.
HDD Product Mix Trends
Q1’16 Q2’16 Q3’16 Q4’16 Q1’17 Q2’17 Q3’17 Q4’17 Q1’18
Enterprise
Capacity (EB) Mission Critical 2.4 2.5 2.2 2.2 2.4 2.6 2.3 2.2 2.1
Nearline 12.2 15.1 17.7 24.7 25.7 21.6 21.4 21.2 25.1
1.9 2.2 2.6 3.2 3.2 3.0 3.2 3.4 3.9
Capacity (EB) Consumer Electronics1 11.6 10.5 8.4 11.3 13.7 14.8 13.6 12.4 13.5
Consumer 9.2 11.0 9.3 8.6 8.9 12.1 10.8 9.5 11.1
1.3 1.5 1.6 1.6 1.6 1.9 2.0 1.9 1.9
Capacity (EB) Desktop + Notebook 20.7 21.4 18.0 14.7 16.0 17.1 17.3 16.8 18.6
0.9 0.9 0.9 0.9 1.0 1.0 1.1 1.0 1.1
56.1 60.6 55.6 61.7 66.7 68.2 65.5 62.2 70.3
1.2 1.3 1.4 1.7 1.7 1.7 1.8 1.8 1.9
33% 34% 37% 41% 41% 37% 36% 37% 36%
28% 27% 24% 27% 28% 31% 29% 29% 29%
33% 31% 30% 24% 24% 24% 25% 26% 26%
Average Capacity per Drive (TB)
Enterprise as a % of Total Revenue
Client Compute as a % of Total Revenue
Client non-Compute as a % of Total Revenue
Average Capacity per Drive (TB)
Average Capacity per Drive (TB)
Average Capacity per Drive (TB)
Total HDD Capacity (EB)
Edge non-Compute / Client non-Compute
Edge Compute / Client Compute
NOTE: Minor calculation variances are due to rounding.

7
Supplemental Financial Information Fiscal Q1 2018 (quarter ended September 29, 2017) October 23, 2017
NOTE: Minor calculation variances are due to rounding.
HDD Exabytes Shipped and Average Capacity per Drive
56.1 60.6 55.6 61.7 66.7 68.2 65.5 62.2 70.3
1.9 TB
0.0
0.5
1.0
1.5
2.0
30
35
40
45
50
55
60
65
70
75
Q1’16 Q2’16 Q3’16 Q4’16 Q1’17 Q2’17 Q3’17 Q4’17 Q1’18
Avera
ge
Cap
acity
pe
r driv
e (T
B)
Exab
yte
s
STX Exabyte Shipped Average capacity per drive (TB)

8
Supplemental Financial Information Fiscal Q1 2018 (quarter ended September 29, 2017) October 23, 2017
NOTE: Minor calculation variances are due to rounding.
1. Capital Expenditures is cash paid for the acquisition of property, equipment, and leasehold improvements.
2. Free cash flow is a non-GAAP measure defined as cash flow from operations less capital expenditures.
3. Based on Fiscal Year.
4. Based on Fiscal Year. For YTD Shares Repurchased through Fiscal Q2’16, $1,061 million was paid in cash and $29 million was accrued for as of January 1, 2016.
5. Cash Flow from Operations has been retrospectively adjusted from Q1'16 for the impact of the adoption of ASU 2016-18, Statement of Cash Flows: Restricted Cash, which requires amount generally described as restricted cash and restricted cash equivalents to be included with cash and cash equivalents when reconciling the total beginning and ending
balances for the periods presented on the Statement of Cash Flows.
Cash, Cash Flow, and Operational Trends
Q1’16 Q2’16 Q3’16 Q4’16 Q1’17 Q2’17 Q3’17 Q4’17 Q1’18
Cash ($M) 1,921 1,264 1,199 1,131 1,494 1,716 3,026 2,539 2,285
Debt ($M) 4,096 4,098 4,089 4,091 4,092 4,093 5,231 5,021 5,002
Cash Flow From Operations5 ($M) 824 382 205 269 591 656 426 243 237
Capital Expenditures1 ($M) 209 137 95 146 140 95 95 104 124
Free Cash Flow2 ($M) 615 245 110 123 451 561 331 139 113
YTD Cash Flow From Operations3,5 ($M) 824 1,206 1,411 1,680 591 1,247 1,673 1,916 237
YTD Shares Repurchased4 ($M) 983 1,090 1,090 1,090 101 248 248 460 166
YTD Dividend Paid3 ($M) 163 351 539 727 - 188 374 561 184
YTD Percent Return of OCF3 139% 119% 115% 108% 17% 35% 37% 53% 148%
Days Sales Outstanding 47 43 44 45 43 38 39 45 42
Days Inventory Outstanding 45 43 41 40 42 46 51 51 49
Days Payables Outstanding 77 71 66 69 71 74 78 85 74
Cash Conversion Cycle 15 14 19 16 13 10 12 12 17
Worldwide Headcount 51,079 50,048 46,673 45,487 44,455 44,882 43,214 41,221 40,496

9
Supplemental Financial Information Fiscal Q1 2018 (quarter ended September 29, 2017) October 23, 2017
Seagate and Tencent Seagate and Baidu
Seagate Technology and Tencent Technology signed a Strategic
Partnership Memorandum of Understanding (MOU) for cooperation in the
field of information technology.
Tencent will regard Seagate as a key supplier of storage solutions, and
Seagate will treat Tencent as a Strategic Partner and set up a special
service team for Tencent. Also, both companies will carry out an all-round
and in-depth cooperation covering products and technology, and will work
together to drive market development activities.
Announced the signing of a strategic cooperation agreement with Baidu
covering the fields of information technology, big data analysis and
advanced storage system development and implementation.
The pact renews an existing agreement between the two firms signed in
September 2014, under which both parties would regard each other as
their preferred strategic partner, investing their respective superior
resources, carrying out experiments in products, solutions and services,
and jointly getting involved in diverse technological innovation research.
12TB drives for NAS and Desktop Computing
Announced its IronWolf™, IronWolf™ Pro and BarraCuda® Pro hard drives
are now available at capacities up to 12TB.
Seagate’s 12TB IronWolf and BarraCuda Pro drives further extend the
capabilities of the leading Seagate Guardian Series to meet the growing
data needs of large enterprise business, small and medium-sized
businesses (SMBs), and creative professionals.
Seagate revs up Nytro Flash Storage Portfolio
Announced at the 2017 Flash Memory Summit enhanced versions of two
flash technologies to boost performance and capacity for mixed data
center workloads. The updated solid-state drives — including the Nytro®
5000 M.2 non-volatile memory express (NVMe) SSD and the Nytro 3000
Serial Attached SCSI (SAS) SSD — address different segments of the
cloud and data center markets and help organizations maximize the value
of their data.
Product and Technology Development Highlights

10
RECONCILIATION TABLES
11
Supplemental Financial Information Fiscal Q1 2018 (quarter ended September 29, 2017) October 23, 2017
1. The number of shares used in the Non-GAAP diluted net income per share computation for Q3'16 is 299 million as it includes dilutive shares related to employee equity award plans. Such shares were excluded from the computation of GAAP diluted net income per share as to do so would be anti-dilutive.
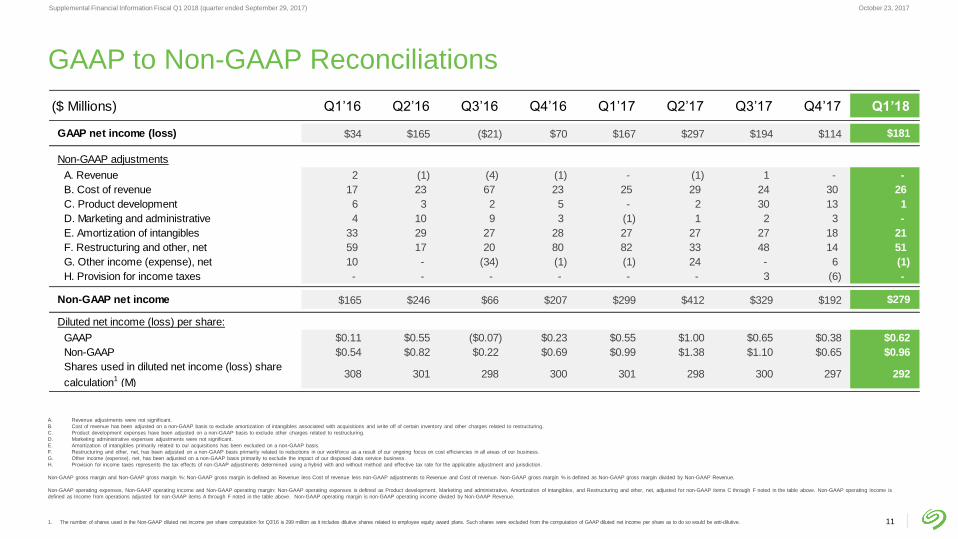
GAAP to Non-GAAP Reconciliations
A. Revenue adjustments were not significant.
B. Cost of revenue has been adjusted on a non-GAAP basis to exclude amortization of intangibles associated with acquisitions and write off of certain inventory and other charges related to restructuring.
C. Product development expenses have been adjusted on a non-GAAP basis to exclude other charges related to restructuring.
D. Marketing administrative expenses adjustments were not significant.
E. Amortization of intangibles primarily related to our acquisitions has been excluded on a non-GAAP basis.
F. Restructuring and other, net, has been adjusted on a non-GAAP basis primarily related to reductions in our workforce as a result of our ongoing focus on cost efficiencies in all areas of our business.
G. Other income (expense), net, has been adjusted on a non-GAAP basis primarily to exclude the impact of our disposed data service business.
H. Provision for income taxes represents the tax effects of non-GAAP adjustments determined using a hybrid with and without method and effective tax rate for the applicable adjustment and jurisdiction.
Non-GAAP gross margin and Non-GAAP gross margin %: Non-GAAP gross margin is defined as Revenue less Cost of revenue less non-GAAP adjustments to Revenue and Cost of revenue. Non-GAAP gross margin % is defined as Non-GAAP gross margin divided by Non-GAAP Revenue.
Non-GAAP operating expenses, Non-GAAP operating income and Non-GAAP operating margin: Non-GAAP operating expenses is defined as Product development, Marketing and administrative, Amortization of intangibles, and Restructuring and other, net, adjusted for non-GAAP items C through F noted in the table above. Non-GAAP operating income is
defined as Income from operations adjusted for non-GAAP items A through F noted in the table above. Non-GAAP operating margin is non-GAAP operating income divided by Non-GAAP Revenue.
($ Millions) Q1’16 Q2’16 Q3’16 Q4’16 Q1’17 Q2’17 Q3’17 Q4’17 Q1’18
GAAP net income (loss) $34 $165 ($21) $70 $167 $297 $194 $114 $181
Non-GAAP adjustments
A. Revenue 2 (1) (4) (1) - (1) 1 - -
B. Cost of revenue 17 23 67 23 25 29 24 30 26
C. Product development 6 3 2 5 - 2 30 13 1
D. Marketing and administrative 4 10 9 3 (1) 1 2 3 -
E. Amortization of intangibles 33 29 27 28 27 27 27 18 21
F. Restructuring and other, net 59 17 20 80 82 33 48 14 51
G. Other income (expense), net 10 - (34) (1) (1) 24 - 6 (1)
H. Provision for income taxes - - - - - - 3 (6) -
Non-GAAP net income $165 $246 $66 $207 $299 $412 $329 $192 $279
Diluted net income (loss) per share:
GAAP $0.11 $0.55 ($0.07) $0.23 $0.55 $1.00 $0.65 $0.38 $0.62
Non-GAAP $0.54 $0.82 $0.22 $0.69 $0.99 $1.38 $1.10 $0.65 $0.96
Shares used in diluted net income (loss) share
calculation1 (M)308 301 298 300 301 298 300 297 292

12
Supplemental Financial Information Fiscal Q1 2018 (quarter ended September 29, 2017) October 23, 2017
1. Credit Agreement Defined EBITDA includes the adjustment for expense related to share-based compensation.
GAAP to Adjusted EBITDA Reconciliations
A. Revenue adjustments were not significant.
B. Cost of revenue has been adjusted on a non-GAAP to exclude the write off of certain inventory and other charges related to restructuring.
C. Product development expenses have been adjusted on a non-GAAP basis to exclude other charges related to restructuring.
D. Marketing and administrative expenses adjustments were not significant.
E. Restructuring and other, net, has been adjusted on a non-GAAP basis primarily related to reductions in our workforce as a result of our ongoing focus on cost efficiencies in all areas of our business.
F. Other income (expense), net, has been adjusted on a non-GAAP basis primarily to exclude the impact of our disposed data service business.
($ Millions) Q1’16 Q2’16 Q3’16 Q4’16 Q1’17 Q2’17 Q3’17 Q4’17 Q1’18
Income Before Income Taxes $31 $180 $9 $54 $173 $310 $212 $120 $188
EBITDA adjustments
Depreciation 167 163 155 156 158 149 140 134 125
Amortization 41 46 43 44 42 42 42 42 36
Interest Income (1) (1) (1) (1) (1) (1) (5) (5) (7)
Interest Expense 47 48 47 51 50 50 60 62 61
EBITDA $285 $436 $253 $304 $422 $550 $449 $353 $403
Non-GAAP adjustments
A. Revenue 2 (1) (4) (1) - (1) 1 - -
B. Cost of Revenue 10 8 52 3 (1) 10 7 3 12
C. Product Development 6 3 2 2 - 1 27 13 1
D. Marketing and administrative 4 10 9 1 (1) 1 2 3 -
E. Restructuring and other, net 59 17 20 80 82 33 48 14 51
F. Other income (expense), net 10 - (34) (1) (1) 24 - 6 (1)
Adjusted EBITDA $376 $473 $298 $388 $501 $618 $534 $392 $466
Share-based Compensation $33 $32 $30 $25 $40 $33 $37 $27 $32
Credit Agreement Defined EBITDA1 $409 $505 $328 $413 $541 $651 $571 $419 $498

13
Supplemental Financial Information Fiscal Q1 2018 (quarter ended September 29, 2017) October 23, 2017
($M) Q1'16 Q2'16 Q3'16 Q4'16 Q1'17 Q2'17 Q3'17 Q4'17 Q1'18
Gross profit 689 741 524 662 801 891 816 666 736
Accelerated depreciation, impairment and other charges related to cost saving efforts 4 4 52 6 16 16 7 5 1
Amortization of acquired intangible assets 6 15 15 15 13 13 13 24 14
Other charges 9 3 (4) 1 (4) (1) 5 1 11
Non-GAAP gross profit 708 763 587 684 826 919 841 696 762
Gross margin 23.6% 24.8% 20.2% 24.9% 28.6% 30.8% 30.5% 27.7% 28.0%
Non-GAAP gross margin 24.2% 25.6% 22.7% 25.8% 29.5% 31.8% 31.4% 28.9% 29.0%
($M) Q1'16 Q2'16 Q3'16 Q4'16 Q1'17 Q2'17 Q3'17 Q4'17 Q1'18
Total operating expenses 603 512 497 559 580 521 550 470 481
Accelerated depreciation, impairment and other charges related to cost saving efforts - (5) - (5) (1) (1) (30) (7) -
Amortization of acquired intangible assets (33) (29) (27) (28) (27) (27) (27) (17) (21)
Restructuring and other, net (59) (17) (20) (80) (82) (33) (48) (14) (51)
Other charges (10) (8) (11) (3) 2 (2) (2) (10) (1)
Total non-GAAP operating expenses 501 453 439 443 472 458 443 422 408
($M) Q1'16 Q2'16 Q3'16 Q4'16 Q1'17 Q2'17 Q3'17 Q4'17 Q1'18
Net income (loss) 34 165 (21) 70 167 297 194 114 181
Interest income (1) (1) (1) (1) (1) (1) (5) (5) (7)
Interest expense 47 48 47 51 50 50 60 62 61
Income tax expense (benefit) (3) 15 30 (16) 6 13 18 6 7
Depreciation and amortization 208 209 198 200 200 191 182 176 161
EBITDA 285 436 253 304 422 550 449 353 403
($M) Q1'16 Q2'16 Q3'16 Q4'16 Q1'17 Q2'17 Q3'17 Q4'17 Q1'18
Net income (loss) 34 165 (21) 70 167 297 194 114 181
Accelerated depreciation, impairment and other charges related to cost saving efforts 4 9 52 11 17 17 37 12 1
Amortization of acquired intangible assets 39 44 42 43 40 40 40 41 35
Restructuring and other, net 59 17 20 80 82 33 48 14 51
Interest income on the final arbitration award settlement in the case against Western Digital - - (33) - - - - - -
Losses (gain) recognized on the early redemption and repurchase of debt - - (2) - - - - 7 -
Other charges 29 11 8 3 (7) 25 7 10 11
Income tax adjustments - - - - - - 3 (6) -
Non-GAAP net income 165 246 66 207 299 412 329 192 279
Reconciliation of Gross Margin to Non-GAAP Gross Margin & Gross Profit to Non-GAAP Gross Profit
Reconciliation of Operating Expenses to Non-GAAP Operating Expenses
Reconciliation of Net Income to EBITDA
Reconciliation of Net Income (Loss) to Non-GAAP Net Income

14
Download the Seagate Investor Relations App
The Seagate Investor Relations app gives investors real-time access
to important information regarding Seagate’s stock price, results,
press releases, and investor events.
Mobile
• Take anywhere
• Offline access
• Content sharing
Easy Access
• Folder format
• Stock information
• Search function
• Notes feature
Notifications
• New content
• Reminders
• Calendar events