supplemental figure 1 nadh - … · supplemental figure 1 ... sod-inhibitable chemiluminescence...
TRANSCRIPT

Supplemental Figure 1
Supplemental Figure 1 A. NADH-dependent O2- release was measured by the
lucigenin method. The SOD-inhibitable component of O2- release from the mitochondrial
fraction in CMs transduced with indicated adenoviruses was determined (n=4). B. H2O2
content in mitochondria was measured by Amplex Red assay (n=4). Statistical analyses were done by one-way ANOVA followed by a post hoc Fisher’s comparison test. *P<0.05, **P<0.01.
Ad-FYN (-) (+) (-) (+)
Ad-NOX4 (-) (-) (+) (+)
SO
D-in
hibi
tabl
ech
emilu
min
esce
nce
(RLU
)
Ad-shFYN (-) (-)
(-)(-) (-)
(-) (-)
(+)
(+)(+)
0
8000
12000
4000
NADH
Ad-FYN (-) (+) (-) (+)
Ad-NOX4 (-) (-) (+) (+)
Am
plex
Red
assa
y(n
mol
H2O
2/m
in/m
gpr
otei
n)
Ad-shFYN (-) (-)
(-)(-) (-)
(-) (-)
(+)
(+)(+)
0
0.4
0.6
0.2
A
B
P=0.09
*** *
**
***
*
*
0.8
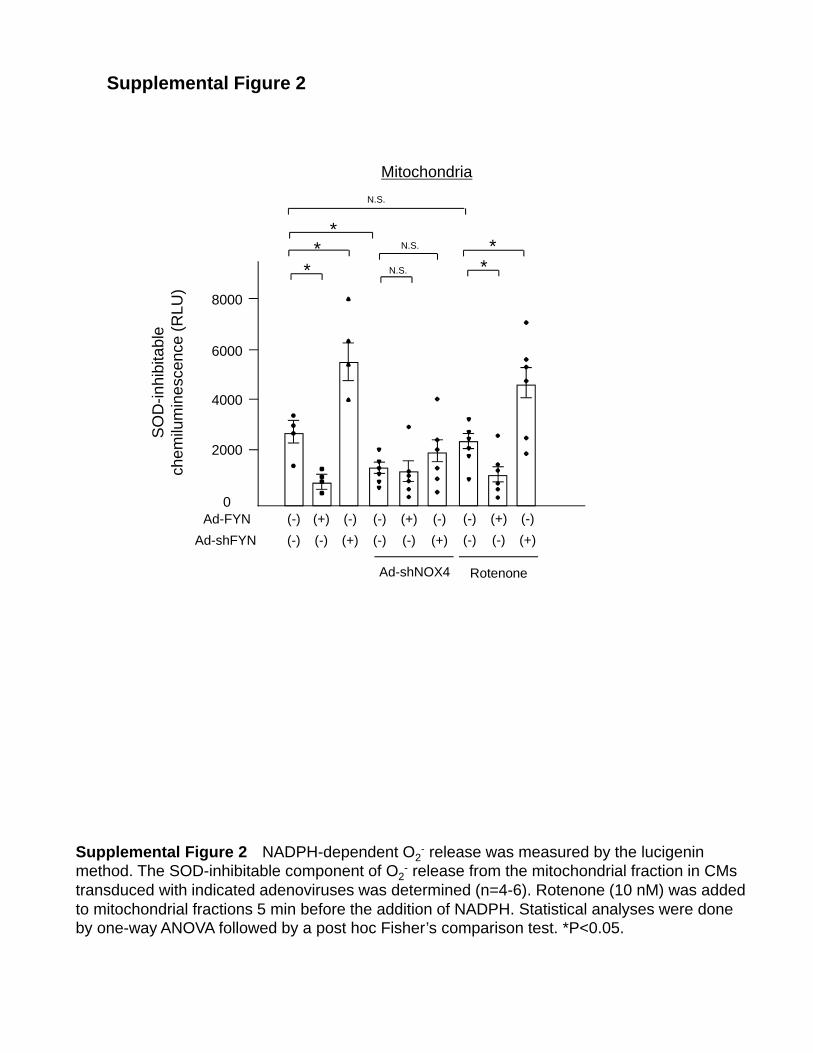
Supplemental Figure 2
Supplemental Figure 2 NADPH-dependent O2- release was measured by the lucigenin
method. The SOD-inhibitable component of O2- release from the mitochondrial fraction in CMs
transduced with indicated adenoviruses was determined (n=4-6). Rotenone (10 nM) was added to mitochondrial fractions 5 min before the addition of NADPH. Statistical analyses were done by one-way ANOVA followed by a post hoc Fisher’s comparison test. *P<0.05.
SO
D-in
hibi
tabl
ech
emilu
min
esce
nce
(RLU
)
0
4000
6000
2000
8000
Mitochondria
Ad-shFYN (-) (+)
Ad-shNOX4
(-) (+)(-) (-)
Ad-FYN (-) (+) (-) (-) (+) (-)
*
*
N.S.
* N.S.
(-) (+)(-)
(-) (+) (-)
Rotenone
**
N.S.

Supplemental Figure 3 Cardiomyocytes were treated with a Fyn inhibitor (1-Naphthyl PP1, 0, 0.3, 1, 3, and 10 M) for 30 minutes. H2O2 production was examined with Amplex Red assays (n=7). Statistical analyses were done by one-way ANOVA followed by a post hoc Fisher’s comparison test. *P<0.05.
0
0.5
1
1.5
2
2.5
1-Naphthyl PP1
Supplemental Figure 3
Am
plex
Red
assa
y(R
elat
ive
to c
ontr
ol)
(-)
**
*

Supplemental Figure 4
Supplemental Figure 4 NADPH-dependent O2- release was measured by the
lucigenin method. A, B. The SOD-inhibitable component of O2- release from ER
fraction (A) and nuclear fraction (B) in CMs transduced with indicated adenoviruses was determined (n=4). C, D. H2O2 content in ER fraction (C) and nuclear fraction (D) was measured by Amplex Red assay (n=6-7). Statistical analyses were done by one-way ANOVA followed by a post hoc Fisher’s comparison test. *P<0.05, **P<0.01
SO
D-in
hibi
tabl
ech
emilu
min
esce
nce
(RLU
)
Ad-shFYN (-) (+)
0
4000
6000
2000
A
SO
D-in
hibi
tabl
ech
emilu
min
esce
nce
(RLU
)
0
4000
6000
2000
B
Ad-NOX4 (-) (-) (+) (+)
(-) (+)
80008000
ER
Nucleus
Ad-FYN (-) (+) (-) (+)
Ad-NOX4 (-) (-) (+) (+)
Am
plex
Red
assa
y(n
mol
H2O
2/m
in/m
gpr
otei
n)
Ad-shFYN (-) (-)
(-)
(-) (-)
(-) (-)
(+)
(+)(+)
0
0.4
0.6
0.2
D
Ad-FYN (-) (+) (-) (+)
Ad-NOX4 (-) (-) (+) (+)
Am
plex
Red
assa
y(n
mol
H2O
2/m
in/m
gpr
otei
n)
Ad-shFYN (-) (-)
(-)
(-) (-)
(-) (-)
(+)
(+)(+)
0
0.4
0.6
0.2
C ER Nucleus
(-) (-)
Ad-FYN
(-) (+)
(-) (+) (-) (+) (-) (+)
Ad-shFYN (-) (+)
Ad-NOX4 (-) (-) (+) (+)
(-) (+)(-) (-)
Ad-FYN
(-) (+)
(-) (+) (-) (+) (-) (+)
*
***
**
****
*
*
****
* *
****
*

Supplemental Figure 5
Supplemental Figure 5 A. Protein levels of NOX4, FYN, Histone H3, Bip, and COXIV in nucleus, ER, and mitochondria in CMs transduced with indicated adenovirus were determined. The experiment was conducted 3 times. B. Protein levels of NOX4, Histone H3, Bip, and COXIV in nucleus, ER, and mitochondria in CMs transduced with indicated adenovirus were determined. The experiment was conducted 3 times.
MitochondriaNucleus ER
Ad FYN
NOX4
FYN
Histone H3
Cox IV
Bip
(-) (+) (-) (+) (-) (+)
NOX4
Histone H3
Co IV
Bip
Mitochondria Nucleus ER
Ad‐NOX4wt
Ad‐NOX4Y566D
Ad‐NOX4Y566A
Ad‐LacZ
Ad‐NOX4wt
Ad‐NOX4Y566D
Ad‐NOX4Y566A
Ad‐LacZ
Ad‐NOX4wt
Ad‐NOX4Y566D
Ad‐NOX4Y566A
Ad‐LacZ
A
B

Supplemental Figure 6
Supplemental Figure 6A, B. Protein levels of cleaved caspase3 and GAPDH in cultured neonatal rat CMs transduced with indicated adenoviruses. C, D. Protein levels of cleaved caspase3 and GAPDH in the heart from indicated mice. Statistical analyses were done by one-way ANOVA followed by a post hoc Fisher’s comparison test. *P<0.05
Ad-FYN (-) (+) (-) (+)Ad-NOX4 (-) (-) (+) (+)
Ad-shFYN (-) (-)
(-)(-) (-)
(-) (-)
(+)
(+)(+)
Cleaved caspase 3
GAPDH
Ad-FYN (-) (+)(+) (+)
(-)(-)
(-) (+)(-) (-)
Ad-NOX4wt (-) (-)(-) (+) (+)
Ad-NOX4Y556A
Cleaved caspase 3
GAPDH
WT
Ad-NOX4Y556A
WT
Ad-NOX4wt
WT
Ad-LacZ
Tg-FYN Tg-FYN
WT FYN KOWT FYN KO
Cleaved caspase 3
GAPDH
Cleaved caspase 3
GAPDH
Sham TAC
A
B
C
D
0
2
3
1
Cle
aved
Cas
pase
3/G
AP
DH
Ad-FYN (-) (+) (-) (+)Ad-NOX4 (-) (-) (+) (+)
Ad-shFYN (-) (-)
(-)(-) (-)
(-) (-)
(+)
(+)(+)
***
p=0.183
0
2
3
1C
leav
edC
aspa
se 3
/GA
PD
H
Ad-NOX4Y566A (-) (-) (+) (+)Ad-NOX4wt (-) (+) (-) (-)
Ad-FYN (-) (-)
(+)(-)
(-) (+)(+)
*
*4
N.S
N.S
0
2
3
1
Cle
aved
Cas
pase
3/G
AP
DH
*
* N.S
N.S
WT
Ad-NOX4Y556A
WT
Ad-NOX4wt
WT
Ad-LacZ
Tg-FYN Tg-FYN
*
*
0
2
1
Cle
aved
Cas
pase
3/G
AP
DH
*p=0.764
WT FYN KOWT FYN KO
Sham TAC
3

Supplemental Figure 7
Supplemental Figure 7Co-immunoprecipitation assays using lysates of CMs transduced with Ad-NOX4wt. After immunoprecipitation (IP) with control IgG or anti-NOX4 antibody, immunoblotting for FYN, Src, or YES was performed. Immunoblots of input controls (5% lysates) are also shown. The experiment was conducted 3 times.
5% Input
NOX4wt Ad
IP:NOX4 IP:IgG
IB:FYN
IB:FYN
NOX4wt Ad
IP:NOX4 IP:IgG
5% Input
IB:Src
IB:Src
NOX4wt Ad
IP:NOX4 IP:IgG
5% Input
IB:YES
IB:YES

Supplemental Figure 8
Ad-NOX4Y556D
Ad-NOX4wt
0
2000
3000
1000
SO
D-in
hibi
tabl
ech
emilu
min
esce
nce
(RLU
)
*
0
4
2
Ad-LacZ
*
Ad-NOX4Y556D
Ad-NOX4wt
Ad-LacZ
**
A
B
TU
NE
L po
sitiv
e ce
lls
(%)
Supplemental Figure 8A. NADPH-dependent O2- release was measured by the lucigenin method. The SOD-inhibitable component of O2- release from the mitochondrial fraction in CMs transduced with indicated adenoviruses was determined (n=4). B. Apoptosis in CMs transduced with indicated adenoviruses was evaluated with TUNEL staining (n=4). Statistical analyses were done by one-way ANOVA followed by a post hoc Fisher’s comparison test. *P<0.05

Supplemental Figure 9
m g q I e w a m w a n e q a l a s g l i l i t g g I v a t a
N terminal sequence of p22phox
1 10 20 30
A
B
NOX4
NADPH NADP+
p22
NOX4
NADPH NADP+
p22active
inactiveP
Supplemental Figure 9 p22phox has negatively charged amino acids in its N-terminus. a. The N terminal amino acid sequence of p22phox. b. A schematic representation of our hypothesis as to how Y566 phosphorylation of NOX4 inhibits Nox4.

Supplemental Figure 10
Supplemental Figure 10phosphorylated FYN, total FYN, and GAPDH in LV after in WT and NOX4 KO mice. After immunoprecipitation (IP) with an anti-FYN antibody, immunoblot analyses (IB) for phospho-Src (S416) were performed to detect FYN phosphorylated at the tyrosine in the activation loop of the kinase domain (pFYN). The experiment was conducted 3 times.
FYN
pFYN(Tyr416)
WT NOX4 KO
GAPDH

Supplemental Figure 11
Supplemental Figure 11 A. Expression levels of NOX4, FYN, GAPDH, COX IV, Histone H3, and Bip in each fraction from the indicated mouse hearts 0 and 6 weeks after TAC operation. The experiment was conducted 3 times. B. NADPH-dependent and SOD-inhibitable O2
- release in each fraction from the indicated mouse hearts was measured by the lucigenin method (n=4). Statistical analyses were done by one-way ANOVA followed by a post hoc Fisher’s comparison test. *P<0.05.
Mito
0w 6w
NOX4
FYN
GAPDH
COX VI
Histone H3
Bip
Nuc
0w 6w
ER
0w 6wA
B
SO
D-in
hibi
tabl
ech
emilu
min
esce
nce
(RLU
)
0
4000
6000
2000
8000
*
Mito
0w 6w
Nuc
0w 6w
ER
0w 6w
TAC
*
*

Supplemental Figure 12
0
5
10
LVW
/TL
(mg/
mm
)
Lung
W/T
L (m
g/m
m)
0
10
15
sham TAC sham TAC
5
A B
Supplemental Figure 12. Deletion of FYN promotes LV dysfunction and heart failure in response to pressure overload. A, B. LVW/TL, and Lung W/TL were determined in the indicated mice 2 weeks after TAC (n=6). Statistical analyses were done by one-way ANOVA followed by a post hoc Fisher’s comparison test. *P<0.05
**

Supplemental Figure 13m
BP
(mm
Hg)
0
100
50
A B CLV
ED
P (
mm
Hg)
0
10
5
15
0
5
10
LVW
/TL
(mg/
mm
)
D
0
5
10
Lung
W/T
L (m
g/m
m)
0
1
2
E
0
0.4
0.8
F
SO
D in
hibi
tab
lech
emilu
min
esce
nce
(com
pare
d to
WT
)
TU
NE
L-po
sitiv
e ce
lls(%
)
Supplemental Figure 13. Deletion of NOX4 rescues cardiac dysfunction and heart failure in FYN KO mice in response to PO. A, D. Mean BP and LV end-diastolic pressure were evaluated with Millar catheter in the indicated mice 2 weeks after TAC operation (n=6). B, C. LVW/TL and Lung W/TL were determined in the indicated mice 2 weeks after TAC operation (n=6). E. NADPH-dependent and SOD-inhibitable O2
- release in mitochondrial fraction from the indicated mouse hearts was measured by the lucigenin method (n=6). F.Apoptosis in the indicated mouse hearts was evaluated with TUNEL staining (n=6). Statistical analyses were done by one-way ANOVA followed by a post hoc Fisher’s comparison test..*P<0.05
** * * *
*
* **
* *
* *
20

Supplemental Figure 14
Supplemental Figure 14 A. Expression levels of FYN, NOX4, and tubulin in indicated mouse hearts subjected to either sham or TAC operation. The experiment was conducted 3 times. B.NADPH-dependent and SOD-inhibitable O2
- release in mitochondrial fraction from the indicated mouse hearts was measured by the lucigenin method (n=4). C. Apoptosis in the indicated mouse hearts was evaluated with TUNEL staining (n=4). D. LV CM cross-sectional area (CSA) evaluated with wheat germ agglutinin staining (n=4). E. LVEF was evaluated with echocardiography (n=4). F. LVEDP was evaluated with a Millar catheter (n=4). Statistical analyses were done by one-way ANOVA followed by a post hoc Fisher’s comparison test.*P<0.05, **P<0.01.
sham TAC
NOX4
Tubulin
FYN
AB
C
TU
NE
L-po
sitiv
e ce
lls(%
)
SO
D in
hibi
tabl
ech
emilu
min
esce
nce
(com
pare
dto
WT
+sh
am)
CS
A (
mm
2 )
D
sham TAC
0
200
100
300
****
*
0
0.4
0.2
0.6
** ** *
0
2
1
3
** ** *
sham TAC sham TAC
E
LVE
F (
%)
0
40
20
60
* *sham TAC
F
LVE
DP
(m
mH
g)
0
10
5
15
* ** *
sham TAC
80
0.8

Supplemental Figure 15
Supplemental Figure 15 Protein levels of phosphorylated Perk at Thr980, Perk, reduced HDAC4, HDAC4, reduced aconitase2, aconitase2, NOX4, FYN, GAPDH, nuclear Nrf2, and Nrf2 in CMs transduced with indicated adenoviruses was determined. The extent of cysteine reduction in HDAC4 and aconitase2 in CMs transduced with indicated adenoviruses was detected by iodoacetamide assay. The experiment was conducted 3 times.
NOX4
FYN
P-Perk (Thr 980)
NOX4
Perk
FYN
GAPDH
Reduced HDAC4
HDAC4
Reduced aconitase2
Aconitase2
Nuclear Nrf2
Nrf2

Supplemental Figure 16
Supplemental Figure 16 A. The cells were pre-incubated with the indicated adenovirus for 48 hours and then the cells we cultured with normal or glucose-free medium for 4 hours. NADPH-dependent O2
- release was measured by the lucigenin method. The SOD-inhibitable component of O2
- release from the ER fraction in CMs transduced with indicated adenoviruses was determined (n=6). B. The cells were pre-incubated with the indicated adenovirus for 48 hours and then the cells were cultured with normal or glucose-free medium for 4 hours. Protein levels of LC3-I and LC3-II in cultured neonatal rat CMs transduced with indicated adenoviruses (n=3). The experiment was conducted 3 times. C. The cells were pre-incubated with the indicated adenovirus for 48 hours and then the cells we cultured with normal or glucose-free medium for 24 hours. Viable cell numbers were measured by CTB assays according to the supplier's protocol (n=8). D. The cells were cultured with normal or glucose-free medium for 4 hours. The expression levels of phosphorylated FYN and total FYN were evaluated with immunoblotting. After immunoprecipitation (IP) with an anti-Fyn antibody, immunoblot analyses (IB) for phospho-Src (S416) were performed to detect FYN phosphorylated at the tyrosine in the activation loop of the kinase domain (pFYN). GD, glucose deprivation. The experiment was conducted 3 times. Statistical analyses were done by one-way ANOVA followed by a post hoc Fisher’s comparison test. *P<0.05.
A
C
Cel
l via
bilit
y(C
ompa
red
to G
D(-
) (%
))
0
100
50
* *
* *
Ad-FYNAd-shFYN
GD(-) GD(+)
--
--
+-
-+
--
+-
-+
Ad-shNOX4
N.S. N.S.
GD(+)
B
SO
D-in
hibi
tabl
ech
emilu
min
esce
nce
(RLU
)
0
4000
6000
2000
ER
*
*
Ad-FYNAd-shFYN
GD(-) GD(+)
--
--
+-
-+
--
+-
-+
Ad-shNOX4
GD(+)
N.S.
N.S.
LC3-I
LC3-II
Ad-shNOX4
Ad-FYN
Ad-shFYN
GD(-) GD(+)
--
--
+-
-+
--
+-
-+
GD(+)
FYN
GD
pFYN(Tyr416)
IP: IgG IP: FYN
- + - +
D
**
*
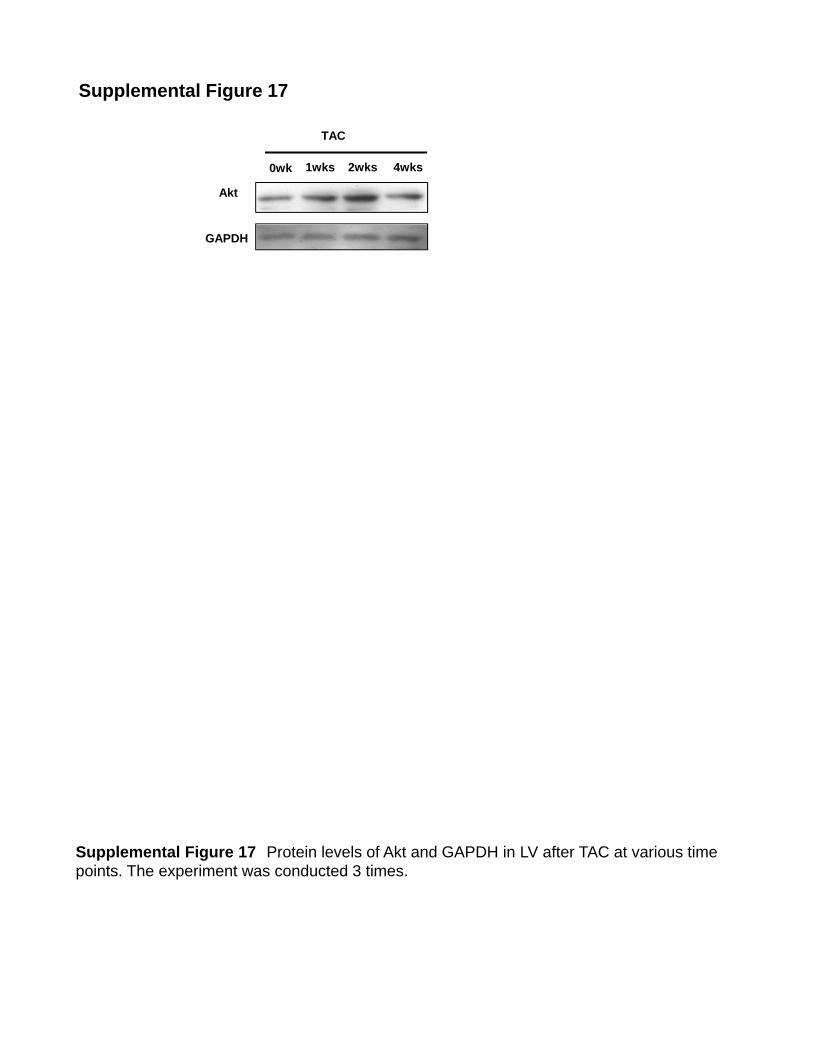
Supplemental Figure 17
Supplemental Figure 17 Protein levels of Akt and GAPDH in LV after TAC at various time points. The experiment was conducted 3 times.
0wk 1wks 2wks
TAC
4wks
GAPDH
Akt

Supplemental Table 1
WT+Sham FYN KO+Sham WT+TAC FYN KO+TAC
HR, bpm 511±11 517±15 500±15 493±10
LVEDD, mm 3.5±0.1 3.5±0.1 3.2±0.09*1 4.0±0.09*2
LVESD, mm 2.2±0.1 2.1±0.2 1.8±0.2*1 3.3±0.1*2
IVSWT, mm 0.73±0.02 0.74±0.03 1.08±0.04*1 1.25±0.05*2
PWT, mm 0.72±0.03 0.73±0.03 1.06±0.06*1 1.20±0.07*2
n=6 n=6 n=8 n=8
Echocardiographic data of WT and FYN KO mice 2 weeks after TAC operation
HR, heart rate; LV, left ventricle; EDD, end-diastolic dimension; ESD, end-systolic dimension; EF, ejection fraction; EDP, end-diastolic pressure; IVSWT, interventricular septal wall thickness; PWT, posterior wall thickness.Data are mean ± SEM, *1 P<0.05 vs WT+Sham, *2 P<0.05 vs WT+TAC.
LVEF, % 74.7±5.3 76.7±5.6 79.5±5.2 44.3±4.6*2

Supplemental Table 2
WT+Sham FYN KO+Sham WT+TAC FYN KO+TAC
HR, bpm 497±18 503±19 494±17 481±18
sBP, mmHg 99±4 100±4 161±6*1 156±6*1
dBP, mmHg 67±3 64±4 71±5 70±4
Peak LVP, mmHg 102±3 99±4 157±8*1 160±5*1
LVEDP, mmHg 2.6±0.7 3.0±0.7 9.9±1.0*1 15.3±1.9*2
+dP/dt, mmHg/s 6733±402 7033±578 7663±566 4825±432*2
-dP/dt , mmHg/s 6517±423 6467±786 4875±275*1 3625±339*2
n=6 n=6 n=8 n=8
Hemodynamic analyses of WT and FYN KO mice 2 weeks after TAC operation
HR, heart rate; sBP, systolic blood pressure; dBP, diastolic blood pressure; mBP, mean blood pressure; LV, left ventricle; EDP, end-diastolic pressure. Data are mean ± SEM, *1 P<0.05 vs WT+Sham, *2 P<0.05 vs WT+TAC.
mBP, mmHg 77±2 76±3 101±4*1 99±4*1

Supplemental Table 3
WT+TAC cNOX4 KO+TAC FYN KO+TAC DKO+TAC
n=6 n=6 n=6 n=6
DKO, double knock-out (FYNKO‐cNOX4KO); HR, heart rate; LV, left ventricle; EDD, end-diastolic dimension; ESD, end-systolic dimension; EF, ejection fraction; EDP, end-diastolic pressure; IVSWT, interventricular septal wall thickness; PWT, posterior wall thickness. Data are mean ± SEM, *1 P<0.05 vs WT+TAC, *2 P<0.05 vs FYNKO+TAC.
Echocardiographic data of WT, cNOX4 KO, FYN KO, and double KO mice 2 weeks after TAC operation
HR, bpm 501±16 489±15 531±20 496±14
LVEDD, mm 3.3±0.06 3.2±0.2 3.8±0.1*1 3.4±0.1*2
LVESD, mm 2.0±0.1 2.0±0.2 3.1±0.1*1 2.3±0.1*2
IVSWT, mm 1.06±0.04 0.9±0.04*1 1.20±0.06*1 1.06±0.06*2
PWT, mm 0.98±0.12 0.77±0.03*1 1.18±0.08 *1 1.02±0.06*2
LVEF, % 75.5±4.0 76.7±3.1 44.6±3.6*1 68.0±4.0*2

Supplemental Table 4
WT+TAC cNOX4 KO+TAC FYN KO+TAC DKO+TAC
HR, bpm 489±26 473±25 463±29 504±18
sBP , mmHg 158±5 163±7 157±5 166±6
dBP, mmHg 72±5 70±3 67±4 75±6
Peak LVP, mmHg 163±6 157±8 162±10 160±8
LVEDP, mmHg 9.5±0.9 7.1±0.7*1 16.2±2.6*1 8.7±0.8*2
+dP/dt, mmHg/s 7717±620 8133±392 4650±367*1 6717±410*2
‐dP/dt, mmHg/s 4683±304 5883±295*1 3383±386*1 4717±289*2
n=6 n=6 n=6 n=6
DKO, double knockout; HR, heart rate; sBP, systolic blood pressure; dBP, diastolic blood pressure; mBP, mean blood pressure; LV, left ventricle; EDP, end-diastolic pressure. Data are mean ± SEM, *1 P<0.05 vs WT+TAC, *2 P<0.05 vs FYN KO+TAC.
mBP, mmHg 100±2 101±3 98±3 105±5
Hemodynamic analyses of WT, cNOX4 KO, FYN KO, and double KO mice 2 weeks after TAC operation

Supplemental Table 5
WT+Sham WT+TAC Tg‐FYN+TAC Tg‐NOX4+TAC Bigenic+TAC
n=4 n=4 n=4 n=4 n=4
HR, heart rate; LV, left ventricle; EDD, end‐diastolic dimension; ESD, end‐systolic dimension; EF, ejection fraction; EDP, end‐diastolic pressure; IVSWT, interventricular septal wall thickness; PWT, posterior wall thickness. Data are mean ± SEM, *1 P<0.05 vs WT+Sham, *2 P<0.05 vs WT+TAC, *3
P<0.05 vs Tg‐NOX4+TAC.
Echocardiographic data of WT, Tg‐NOX4, Tg‐FYN and bigenic mice2 weeks after TAC operation
HR, bpm 497±25 496±23 551±31 522±15 506±14
LVEDD, mm 3.4±0.09 3.1±0.1 3.4±0.1 3.9±0.1*2 3.5±0.09*3
LVESD, mm 2.3±0.2 2.1±0.2 2.1±0.2 3.2±0.2*2 2.3±0.1*3
IVSWT, mm 0.74±0.04 1.15±0.06*1 0.88±0.08*2 1.30±0.11*2 1.12±0.07*3
PWT, mm 0.73±0.03 1.20±0.04*1 0.89±0.05*2 1.35±0.06*2 1.10±0.07*3
LVEF, % 68.3±6.3 66.8±5.0 73.5±6.1 43.5±4.6*2 70.8±3.7*3

Supplemental Table 6
WT+Sham WT+TAC Tg‐FYN+TAC Tg‐NOX4+TAC Bigenic+TAC
HR, bpm 478±10 505±13 493±32 459±37 495±26
sBP, mmHg 97±7 154±5*1 151±11*1 146±9*1 150±6*1
dBP, mmHg 68±5 76±4 75±3 75±3 72±7
Peak LVP, mmHg 99±3 159±9*1 154±9*1 151±11*1 164±5*1
LVEDP, mmHg 3.3±0.3 9.2±1.3*1 3.3±0.3*2 14.0±2.4*2 8.3±0.9*3
+dP/dt, mmHg/s 8425±649 6925±660 7525±390 3513±401*2 6550±585*3
‐dP/dt, mmHg/s 6425±622 4350±340*1 6025±487*2 3263±626*2 5325±309*3
n=4 n=4 n=4 n=4 n=4
HR, heart rate; sBP, systolic blood pressure; dBP, diastolic blood pressure; mBP, mean blood pressure; LV, left ventricle; EDP, end‐diastolic pressure. Data are mean ± SEM, *1 P<0.05 vs WT+Sham, *2 P<0.05 vs WT+TAC, *3 P<0.05 vs Tg‐NOX4+TAC.
mBP, mmHg 79±3 102±4*1 101±5*1 99±5*1 98±4*1
Hemodynamic analyses of WT, Tg‐NOX4, Tg‐FYN and bigenic mice2 weeks after TAC operation