supplemental experimental procedures - home: cell … hplc-ms/ms analysis of tryptic peptides the...
TRANSCRIPT

Molecular Cell, Volume 50 Supplemental Information
SIRT5-Mediated Lysine Desuccinylation Impacts Diverse Metabolic Pathways Jeongsoon Park, Yue Chen, Daniel X. Tishkoff, Chao Peng, Minjia Tan, Lunzhai Dai, Zhongyu Xie, Yi Zhang, Bernadette M. M. Zwaans, Mary E. Skinner, David B. Lombard, and Yingming Zhao
Supplemental Experimental Procedures
Generation of Sirt5+/+ and Sirt5-/- MEFs
Chimeric mice were generated by injection of targeted ES clones into C57BL6/J
blastocysts. Male chimeras were mated with 129Sv females to generate F1
heterozygous mice, which were interbred to generate homozygous KO mice. MEFs
were generated from day 13.5 embryos by standard methods. Sirt5+/+ (WT) and Sirt5-/-
(KO) MEFs were immortalized by infecting with a retroviral vector SSR#41 that
expresses SV40 large T antigen flanked with FRT sites. The infected cells were
subsequently selected in DMEM media containing 0.3 mg/mL hygromycin B (Invitrogen,
Carlsbad, CA, USA) for 7–10 days.
Stable Isotope Labeling of Sirt5 KO and WT MEFs
Sirt5 KO and WT MEFs were labeled with light ([U-12C614N2]-L-lysine) and heavy ([U-
13C615N2]-L-lysine) lysine using a SILAC protein quantification kit (Invitrogen, Carlsbad,
CA) according to manufacturer’s instructions. The two cell lines were grown for more
than 6 generations in SILAC DMEM media supplemented with dialyzed fetal bovine
serum (FBS) and either “light” lysine or “heavy” lysine to achieve more than 99%
labeling efficiency.
2
Preparation of MEF Cell Lysate
The cells were washed twice with pre-chilled PBS and lysed with SDS sample buffer (20
mM Tris pH 6.8, 2% SDS, 5% β-mercaptoethanol, 10% glycerol, and 25 mM
nicotinamide). The cell lysates from “heavy” and “light” cells were clarified by
centrifugation for 10 min at 20,000xg, respectively. Equivalent amounts of protein
lysates from two pools of cells were combined and digested with trypsin for high-pH
reverse-phase HPLC fractionation.
Peptide Fractionation with High-pH Reverse-Phase Chromatography
HPLC buffer A (10 mM ammonium formate in water, pH 7.8) and HPLC buffer B (10 mM
ammonium formate in 90% acetonitrile and 10% water, pH 7.8) were used for high-pH
reverse-phase fractionation of peptides. The reverse-phase column (Phenomenex,
Luna C18 10 mm x 250 mm, 5 µm particle, 100 Å pore size) was equilibrated with 2%
HPLC buffer B. The peptide mixture of interest in HPLC buffer A was loaded onto the
HPLC column and eluted with linear gradient of 2% to 30% HPLC buffer B in 40 min,
30% B-90% B in 15 min at a constant flow rate of 4 mL/min using Shimadzu preparative
HPLC. Seventy fractions were collected and combined equally into 20 final fractions.
The fractions were dried in a SpeedVac prior to immunoaffinity enrichment.
Preparation of Mouse Liver Lysate and Protein Fractionation
Four-month old male Sirt5 KO mice (Lombard et al., 2007; Nakagawa et al., 2009) were
anesthetized with isoflurane, and the blood in the liver was removed by perfusion with

3
ice cold NaCl (0.9%) for 1 min. Livers were collected immediately and homogenized in a
glass dounce tissue grinder in NETN lysis buffer (100 mM NaCl, 20 mM Tris-Cl pH 8.0,
0.5 mM EDTA, 1.0 % (v/v) Nonidet P-40 (NP40), and 20 mM nicotinamide). The tissue
homogenate was sonicated on ice for 4 x 15 sec with 1 min cooling intervals. The lysate
was centrifuged at 20,000xg and the pellet was saved as an independent fraction for
trypsin digestion. Proteins in the supernatant were fractionated by HPLC using a
polyCAT/WAX column following a previously described method (Chen et al., 2012). A
total of 20 fractions were collected. The proteins in each fraction were precipitated with
trichloroacetic acid (TCA) and then in-solution digested by trypsin as previously
described prior to immunoaffinity purification (Kim et al., 2006a).
PTM-Specific Immunoaffinity Enrichment
Enrichment of Ksucc peptides was performed as previously described (Kim et al.,
2006b). Briefly, the tryptic peptides were incubated with 50 μl antibody-immobilized
beads (PTM Biolabs, Chicago, IL) at 4 °C for 6 hours with gentle rotation. After
incubation, the beads were carefully washed three times with NETN buffer (50 mM
Tris•HCl [pH 8.0], 100 mM NaCl, 1 mM EDTA, 0.5% NP40), twice with ETN buffer (50
mM Tris•HCl [pH 8.0], 100 mM NaCl, 1 mM EDTA) and once with water. The bound
peptides were eluted from the beads by washing three times with 30 μl of 0.1 M glycine
solution (pH = 2.5). Eluates were combined and dried in a SpeedVac. Quantitative
proteomics analysis of Kac peptides using SILAC-based mass spectrometric analysis
was carried out likewise using anti-Kac antibody-immobilized beads (PTM Biolabs,
Chicago, IL).

4
HPLC-MS/MS Analysis of Tryptic Peptides
The tryptic digest were dissolved in HPLC solvent A (0.1% formic acid in water, v/v) and
injected into an EASY-nLC 1000 HPLC system (Thermo Fisher Scientific, Odense,
Denmark) equipped with an in-house made fused silica emitter (10 cm length, 360 μm
OD x 75 μm ID) packed with Jupiter C12 resin (4 μm particle size, 90 Å pore size,
Phenomenex). All the digested samples were eluted with a 60 min gradient from 5%
solvent B (10%water/ 90%ACN/0.1% formic acid, v/v/v) to 80% solvent B at a flow rate
of 200 nL/min. The eluates from the RP-HPLC column were ionized by a Proxeon
nanoESI ion source and introduced into an Orbitrap Elite mass spectrometer system.
Full MS spectra from m/z 350 to 1700 were acquired in the Orbitrap mass analyzer at a
resolution of 240,000 at 400 m/z. Lock mass at m/z 536.165369 was enabled for
internal mass calibration for the full MS scan. The full MS scans were followed by data-
dependent MS/MS fragmentation of the 15 most intense peaks in the dual linear ion trap
mass analyzer in rapid scan mode with a normalized collision-induced dissociation (CID)
energy of 35%. A forty-second dynamic exclusion time with a repeat count of 1 and
±10ppm exclusion window was used for MS/MS analysis.
SILAC-Based Quantification Analysis
Protein and PTM site identification and quantifications were performed by Maxquant
with integrated Andromeda search engine (v. 1.3.0.5) (Cox and Mann, 2008; Cox et al.,
2011). For each MS/MS spectra, the top 6 most intense peaks in every 100 Da window
were extracted. Then, tandem mass spectra were searched against Uniprot mouse

5
reference protein database concatenated with reverse decoy database and protein
sequences of common contaminants. Trypsin was specified as cleavage enzyme with 1
missing cleavage for protein quantification and 2 missing cleavages for PTM site
quantification with the maximum of 3 labeled amino acids per peptides. Mass error was
set to 6 ppm for precursor ions and 0.5 Da for fragment ions. Carbamyiodomethylation
on Cys was specified as fixed modification and oxidation on Met, acetylation on Lys,
succinylation on Lys and acetylation on protein N-terminal were specified as variable
modifications. False discovery rate (FDR) thresholds for protein, peptide and
modification site were specified at 0.01. Minimum peptide length was set at 7. In-house
developed scripts were applied to remove Lys succinylation site identifications with
Andromeda score less than 40 or site localization probability less than 0.75. In addition,
the scripts also removed site identifications from reverse or contaminant protein
sequences, as well as Lys acetylation or succinylation sites assigned to the peptide C-
terminal, unless the peptide C-terminal was also the corresponding protein C-terminal.
Estimation of Absolute Stoichiometry of Lys Succinylation Sites
We modified a previous reported algorithm to estimate absolute stoichiometry of Ksucc
sites quantified in WT and Sirt5 KO MEF cells (Olsen et al., 2010). For each Ksucc site,
the method requires the successful quantification of a Ksucc site, as well its
corresponding protein and unmodified peptide. We required that all proteins were
quantified considering any peptides but succinylated peptides. For each Ksucc peptide,
we define the unmodified form as the longest and completely tryptically digested portion
of the Ksucc peptide and we required that the unmodified peptide not have any other

6
variable modification or missing cleavages. Un-normalized SILAC KO/WT quantification
ratios of Ksucc peptides, corresponding proteins and unmodified peptides, were then
analyzed following the previously reported algorithm (Olsen et al., 2010).
Functional Annotation Analysis
Enrichment analysis for Gene Ontology (Ashburner et al., 2000), KEGG pathway
(Kanehisa and Goto, 2000) and Disease Ontology (Schriml et al., 2012) were performed
with GO-Elite package (Zambon et al., 2012). Enrichment analysis for PFAM domain
(Finn et al., 2008) was performed using a hypergeometric test in GOstats package
(Falcon and Gentleman, 2007) in R. All p values were adjusted with a Benjamini-
Hochberg false discovery rate with a cutoff rate of 1% (Benjamini and Hochberg, 1995).
Protein Complex Analysis
Manually curated CORUM protein complex database for all mammals was used for
protein complex analysis (Ruepp et al., 2008). Overrepresented complexes were
identified using hypergeometric test with Benjamini-Hochberg corrected false discover
rate of less than 1%.
Protein-Protein Interaction Network Analysis
All interactions for mouse with scores above 700 in the STRING database were used for
protein-protein interaction analysis. The network was visualized in Cytoscape (v.3.0
beta) (Shannon et al., 2003) and highly-connected clusters were identified by MCODE
plug-in (Bader and Hogue, 2003).

7
In Vitro Desuccinylation Assay
Prior to use, porcine heart PDC (Sigma; P7032) was further purified by pelleting at
135,000xg for 2 h in a buffer containing 100 mM KH2PO4 pH 7.5, 0.05% Lauryl
Maltoside, 2.5 mM EDTA, and 30% glycerol. Desuccinylation reactions were carried out
on 20.8 μg purified PDC in a final volume of 80 μl in reaction buffer consisting of 25 mM
Tris-Cl pH 8.0, 200 mM NaCl, 5 mM KCl, 1 mM MgCl2, 0.1% PEG 8000, and 3.125 mM
NAD+ at 37°C for 1 hr. Where indicated, 24 μg of WT or mutant SIRT5 was added.
Following desuccinylation, 15 μl of the reaction was used for immunoblot analysis with
Ksucc antibody (PTM BioLab Co. Ltd, #PTM-401) and 50 μl of the reaction was
analyzed by PDC AAT activity assay.
Sirt5 KD Cell Generation
Stable Sirt5 KD 293T cell lines were established by lentiviral transduction of Sirt5
shRNAs in the pLKO lentiviral backbone (Sigma oligo ID#sTCN0000018546 and
TCN0000018547/cat # RHS4533-NM12241) and a non-silencing shRNA as a control.
Transduced cells were selected in 4 μg/ml puromycin until all uninfected control cells
were dead.
Subcellular Fractionation
293T cells were collected by centrifuging at 500xg for 5 min at 4°C. Cells were gently
homogenized in hypotonic buffer (10 mM Hepes pH 7.9, 10 mM KCl, 0.1 mM EDTA)
containing protease inhibitors (0.5 mM PMSF and protease inhibitor complete (Roche))

8
for 15 min on ice with the use of a dounce homogenizer, and then centrifuged at 800xg
for 5 min at 4°C to obtain the pellet (nuclear fraction). The supernatant was centrifuged
at 6,200xg for 10 min at 4°C to pellet mitochondria. A portion of the remaining
supernatant was used for immunoblot as the cytosolic fraction. The mitochondrial pellet
was solubilized with 1% sodium dodecylmaltoside in PBS pH 7.4 after two washes and
centrifugation at 100,000xg for 15 min at 4°C. For immunoblot, equal protein amounts of
each fraction was loaded as assessed by DC assay (Bio-rad).
For tissue fractionation, livers were rinsed in cold PBS and then minced on ice and
homogenized in LHM containing a protease inhibitor cocktail (Roche), 500 nM
trichostatin A (TSA), and 10 mM nicotinamide using a chilled glass dounce homogenizer.
Homogenates were centrifuged for 10 min at 800xg at 4°C, and the resulting pellets
were extracted to obtain the nuclear fraction. The nuclear fraction was resuspended in
0.5% NP40 in 50 mM Tris-Cl (pH 7.5) and 150 mM NaCl, then again pelleted and
extracted with 20 mM Tris-Cl (pH 7.9), 25% glycerol, 0.42 M NaCl, 1.5 mM MgCl2,
0.2 mM EDTA, 0.1 mM PMSF and 0.5 mM DTT for 20 min, and centrifuged at 20,000xg
for 30 min. The original supernatants were centrifuged at 6,200xg for 10 min, and the
resulting pellet was used as the mitochondrial fraction, and the supernatant was used
as the cytosolic fraction.
SIRT5 Immunofluorescence
For immunofluorescent detection of SIRT5, 293T cells grown on glass cover slips were
preincubated for 15 min with 500 nM MitoTracker CMRox (Molecular Probes) and then
fixed with 4% paraformaldehyde for 15 minutes at room temperature. After washing with

9
phosphate-buffered saline (PBS), pH 7.4, cells were incubated with 0.1% Triton X-100
in PBS for 10 min. Following blocking with 2% goat serum, cells were incubated at 37°C
with 1:200 diluted rabbit SIRT5 antibody (HPA022002, Sigma) or rabbit IgG as a
negative control for 1 hour. Following 3 washes with PBS, anti-rabbit Alexa fluor 488-
conjugated secondary antibody (Molecular Probes) was used for detection. For nuclear
staining, cells were incubated with 500 nM DAPI for 15 minutes at room temperature
before mounting in Prolong Gold Antifade (Invitrogen). Cells were visualized using a
FV300 BX61 laser-scanning confocal fluorescence microscope 300 (Olympus, Melville,
NY). Images were acquired with FluoView analyzer.
PDC INT Activity
For measurement of PDC activity in cells by INT assay (Schwab et al., 2005), cells were
harvested with 0.05% trypsin–EDTA, washed twice with PBS, and subsequently
centrifuged (500xg). Cells were then suspended at a final protein concentration of 1
mg/ml in PBS. After PDC activation with DCA (5 mM) for 15 minutes at 37°C where
indicated (Fouque et al., 2003), cells were washed once with PBS, and the cell pellet
was resuspended in 3 ml of buffer containing 250 mM sucrose, 1 mM EGTA, and 10
mM Hepes, pH 7.5 and homogenized by 20 strokes in a tight-fitting dounce
homogenizer on ice. After centrifugation at 13,000xg for 5 minutes at 4°C, the
supernatant was discarded. Pellets were then subject to 3 rounds of freeze-thaw in LN2
and 25°C water. Cells were then resuspended at ~4 mg/ml in a buffer consisting of
0.1% Triton X-100, 1 mM CaCl2, 5 mM MgCl2, 50 mM KCl, 250 mM sucrose, and 20
mM Tris-HCl pH 7.5. Between 100 μg-1 mg of sample was used per 1.1 ml of reaction
master mix consisting of 5 mM L-carnitine, 2.5 mM NAD+, 0.2 mM TPP, 0.1 mM CoA,

10
0.5 mM pyruvate, 0.1% Triton X-100, 1 mM MgCl2, 0.1% BSA, 0.6 μM p-
iodonitrotetrazolium chloride (INT), and 6.5 μM phenazine methylsufate (PMS) in 50 mM
potassium phosphate buffer, pH 7.5 (Hinman and Blass, 1981). Assays were performed
at 25°C in a SpectraMax plus plate reader; the increase in absorbance at 500 nm was
monitored, attributable to reduction of INT, the final electron acceptor (extinction
coefficient 12.4 mM-1 cm-1).
SDH Activity Assay
For determination of SDH enzymatic activity, Sirt5 KD and control 293T cell
mitochondria were prepared and purified (Graham, 2001). Solubilization of purified
mitochondria with 1% of n-dodecyl β-D-maltoside and separation of mitochondrial
protein complexes by sucrose density gradient centrifugation were performed as
previously described (Taylor et al., 2002; Taylor et al., 2003). SDH activity was
measured by adding an assay solution containing 10 mM Tris-HCl pH 7.4, 10 mM
KH2PO4, 250 mM sucrose, 1 mM EGTA, 20 mM succinate, 2 mM KCN, 50 μM
dichlorophenolindophenol (DCIP), and 50 M ubiquinone-2 with 10-20 μg of
mitochondrial lysate. The reduction of DCIP was measured at 600 nm in a SpectraMax
plate reader in kinetic mode at room temperature for 30 min. Calculations were based
on the extinction coefficient of 21 mM-1 cm-1 for DCIP (Nadanaciva et al., 2007)
Oxygen Consumption Assay in Cells
For measurements of O2 consumption rate in cells, ~5x10⁶ cells were permeabilized in
0.01% digitonin and resuspended in respiration buffer (20 mM Hepes, pH 7.1, 250 mM

11
sucrose, 2 mM Kpi, 10 mM MgCl2, and 1.0 mM ADP). Measurements were carried out
using a Clark-type oxygen electrode (Hansatech Ltd.) by sequential addition of
substrates and inhibitors. The substrate concentrations were as follows: malate,
pyruvate, succinate, all 5 mM; ascorbate, 10 mM; N,N, N’, N’-tetramethyl-p-
phenylenediamine (TMPD), 0.2 mM; rotenone, 1 �M; 6-fluoropyruvate, 5 mM; antimycin
A, 3 μg/ml; KCN 2 mM. Reduction of oxygen was calculated by normalizing to actual
cell number in each (Hofhaus et al., 1996).
Mitochondrial Respiration
Respiration of isolated mitochondria was measured using a Seahorse XF-24 Analyzer
(Seahorse Bioscience). Mitochondria were diluted to 0.2 mg/ml in BSA-free LM (70 mM
sucrose, 220 mM mannitol, 1 mM EGTA, 2 mM Hepes, 1% w/v defatted BSA, pH 7.2)
(Mailloux et al., 2013), and 50 μl of suspension (10 μg mitochondria, except for
Ascorbate/TMPD where 5 μg were used) was then loaded into Seahorse tissue culture
(TC) plate wells. TC plates were centrifuged at 2,000xg for 10 min at 4 °C to attach
mitochondria to the plastic. For bioenergetic determinations, the oxygen consumption
rate (OCR) was first determined under state 2 conditions (substrate only: 10 mM
pyruvate and 5 mM malate, or 5 mM succinate and 2 μM rotenone, or 5 mM glutamate
and 5 mM malate, or 1 mM TMPD and 100 mM ascorbate. ADP (0.1 mM), oligomycin
(2.5 μg/ml), FCCP (2 μM), and 5 mM fluoropyruvate or 2 μM rotenone or antimycin A (4
μM), or sodium azide were then sequentially injected to test state 3, state 4 (proton
leak-dependent respiration), maximal respiration, and respiration independent of the
respiratory chain, respectively.

12
siRNA Transfection
Smartpool siRNAs targeting human Sdhc (L-011385-00-0005), Sdhd (L006305-00-
0005), and the non-targeting control (S-001810-10-05) were purchased from
Dharmacon Research (Lafayette, Colorado), and transfection of siRNAs was performed
according to manufacturer's instructions. Briefly, 293T cells were trypsinized and plated
in 6-well dishes at 2.5x10⁴ cells per well for 12−16 h prior to transfection. Cationic lipid
complexes, prepared by incubating 200 pmol of the indicated siRNA with 2μl
DharmaFECT (Dharmacon) in 100 μl DMEM (Gibco-Invitrogen) for 20 min, were added
to the wells in a final volume of 1 ml. After 24 hours, cells were passaged and harvested
at 48, 72, and 96 hours for Ksucc immunoblot.

13
Figure S1. Sirt5 KO Results in Global Increase of Lys Succinylation in Mouse Liver
Tissue and MEFs, Related to Figure 1A
(A) Succinylation in mouse liver tissue.
(B) Succinylation in MEFs.

14
Figure S2A. Immunoblot Analysis of Ksucc Levels in Liver and Kidney Whole-Cell
Extracts and Mitochondria of ~8-Week-Old 129SvE Male and Female Mice Fed ad lib or
Fasted for 48 hr, Related to Figure 1B

15
Figure S2B

16
Figure S2C

17
Figure S2D

18
Figure S2E

19
Figure S2F

20
Figure S2G

21
Figure S2H
22
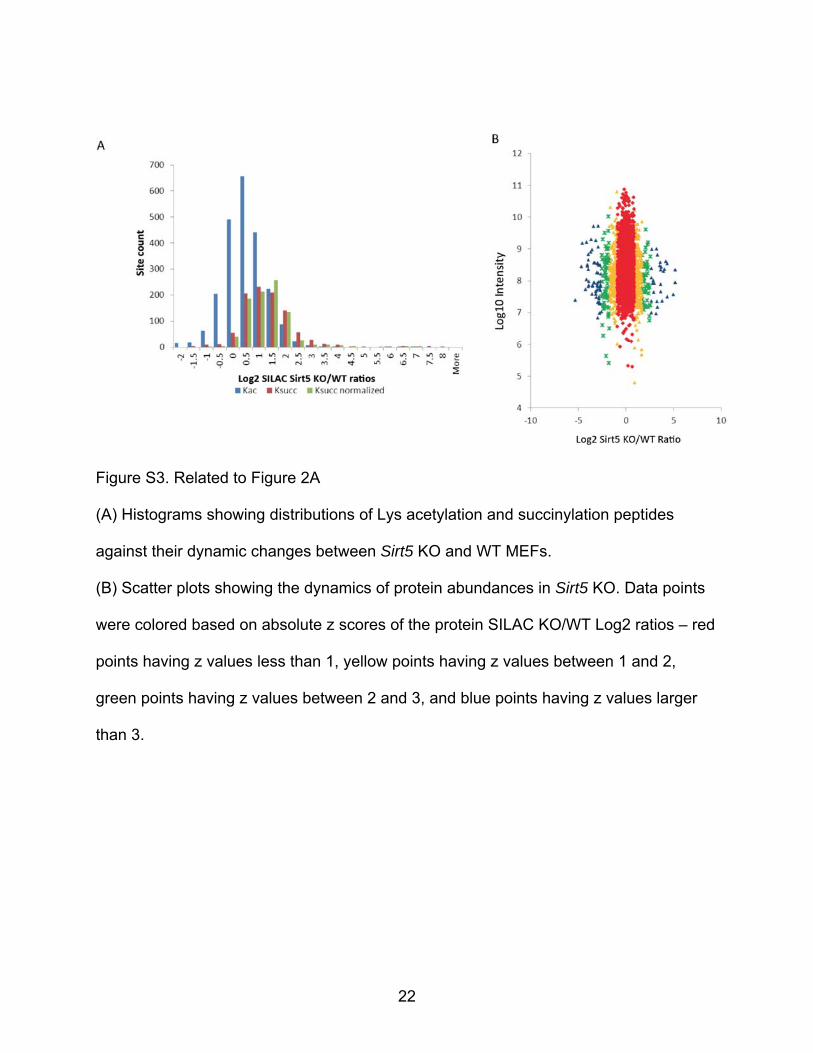
Figure S3. Related to Figure 2A
(A) Histograms showing distributions of Lys acetylation and succinylation peptides
against their dynamic changes between Sirt5 KO and WT MEFs.
(B) Scatter plots showing the dynamics of protein abundances in Sirt5 KO. Data points
were colored based on absolute z scores of the protein SILAC KO/WT Log2 ratios – red
points having z values less than 1, yellow points having z values between 1 and 2,
green points having z values between 2 and 3, and blue points having z values larger
than 3.

23
Figure S4. Sequence Logo Representation of Significant Motifs Identified among Ksucc
Sites, Related to Figure 4A

24
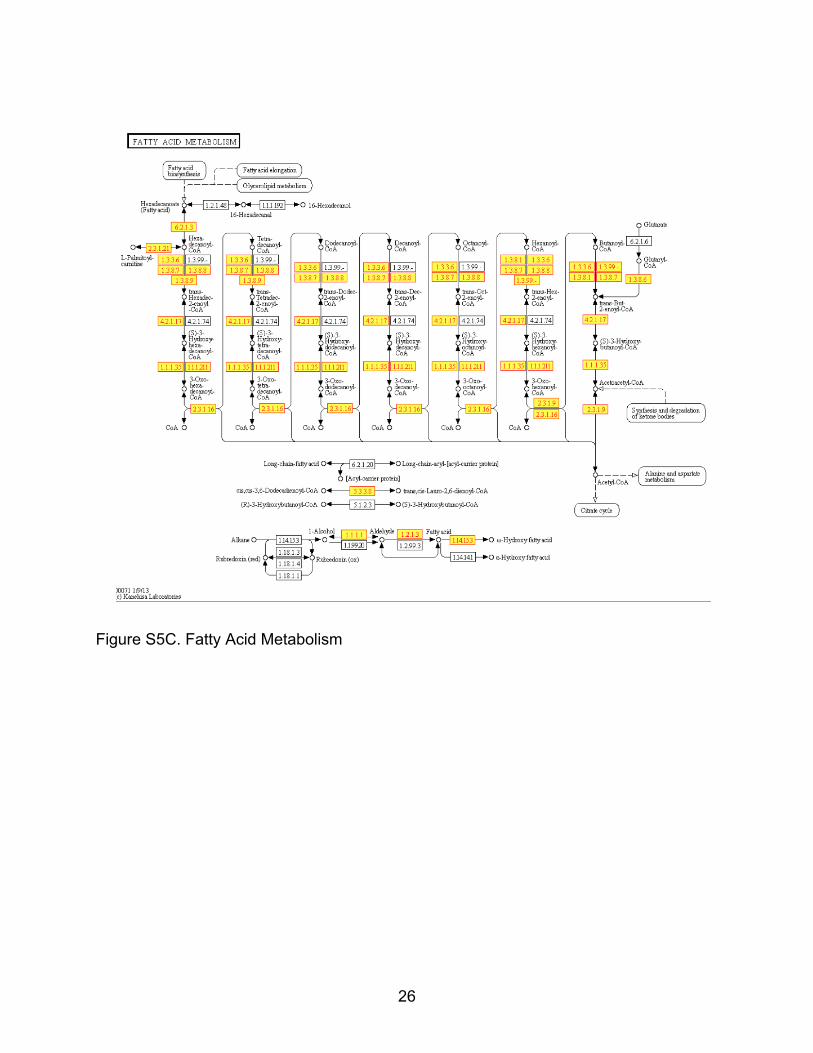
Figure S5A. Illustrated Examples of KEGG Pathways Enriched with Ksucc Proteins,
Related to Figure 4C
Red borders designate proteins with Lys succinylation.
(A) Val-Leu-Ile degradation pathway.

25
Figure S5B. Citrate Cycle.
26
Figure S5C. Fatty Acid Metabolism

27
A
B
Figure S6. Kinetics of Lys Succinylation, Related to Figure 2B
Hela cells were pulse-labeled with 50 mM D4-succinate for 0, 8, and 24 h. Collected
cells were lysed and proteins were digested by trypsin prior to immunoaffinity
purification of Ksucc peptides by pan anti-Ksucc antibody. Labeling ratios were

28
calculated based on intensity ratios of heavy (D4) form to light form (H4) of each Ksucc
peptide from every time point. (A) Clustering of labeling ratios from 15 peptides
identified in both heavy and light forms at all three timepoints. (B) Linear regression
analysis for the Ksucc peptides in cluster 2 from clustering analysis in (A) to calculate
the percentage rate of Lys D4-succinylation incorporation (left panel) and the
percentage rate of the Lys H4-succinylation loss (right panel). The error bars represent
the standard error of means (SEM) for all labeling ratios in each time point group.

29
A
B
C

30
Figure S7. SDH Inhibition Does Not Greatly Impact Lys Succinylation, Related to Figure
6A
(A and B) WT or SIRT5-deficent mouse fibroblasts were treated with the SDHA
inhibitors 3-NPA or malonate as indicated, and Ksucc levels were evaluated by
immunoblot.
(C) 293T cells were transfected with siRNA smartpools directed against either Sdhc or
Sdhd. Sdhc was efficiently inhibited; however Sdhd KD was unsuccessful. Ksucc levels
were evaluated by immunoblot

31
Supplemental References
Ashburner, M., Ball, C.A., Blake, J.A., Botstein, D., Butler, H., Cherry, J.M., Davis, A.P., Dolinski, K., Dwight, S.S., Eppig, J.T., et al. (2000). Gene ontology: tool for the unification of biology. The Gene Ontology Consortium. Nat Genet 25, 25-29. Bader, G.D., and Hogue, C.W. (2003). An automated method for finding molecular complexes in large protein interaction networks. BMC Bioinformatics 4, 2. Benjamini, Y., and Hochberg, Y. (1995). Controlling the false discovery rate—a practical and powerful approach to multiple testing. J R Stat Soc, 289-300. Chen, Y., Zhao, W., Yang, J.S., Cheng, Z., Luo, H., Lu, Z., Tan, M., Gu, W., and Zhao, Y. (2012). Quantitative Acetylome Analysis Reveals the Roles of SIRT1 in Regulating Diverse Substrates and Cellular Pathways. Mol Cell Proteomics 11, 1048-1062. Cox, J., and Mann, M. (2008). MaxQuant enables high peptide identification rates, individualized p.p.b.-range mass accuracies and proteome-wide protein quantification. Nat Biotechnol 26, 1367-1372. Cox, J., Neuhauser, N., Michalski, A., Scheltema, R.A., Olsen, J.V., and Mann, M. (2011). Andromeda: a peptide search engine integrated into the MaxQuant environment. J Proteome Res 10, 1794-1805. Falcon, S., and Gentleman, R. (2007). Using GOstats to test gene lists for GO term association. Bioinformatics 23, 257-258. Finn, R.D., Tate, J., Mistry, J., Coggill, P.C., Sammut, S.J., Hotz, H.R., Ceric, G., Forslund, K., Eddy, S.R., Sonnhammer, E.L., et al. (2008). The Pfam protein families database. Nucleic Acids Res 36, D281-288. Fouque, F., Brivet, M., Boutron, A., Vequaud, C., Marsac, C., Zabot, M.T., and Benelli, C. (2003). Differential effect of DCA treatment on the pyruvate dehydrogenase complex in patients with severe PDHC deficiency. Pediatr Res 53, 793-799. Graham, J.M. (2001). Isolation of mitochondria from tissues and cells by differential centrifugation. Curr Protoc Cell Biol Chapter 3, Unit 3 3. Hinman, L.M., and Blass, J.P. (1981). An NADH-linked spectrophotometric assay for pyruvate dehydrogenase complex in crude tissue homogenates. The Journal of biological chemistry 256, 6583-6586. Hofhaus, G., Shakeley, R.M., and Attardi, G. (1996). Use of polarography to detect respiration defects in cell cultures. Methods Enzymol 264, 476-483. Kanehisa, M., and Goto, S. (2000). KEGG: kyoto encyclopedia of genes and genomes. Nucleic Acids Res 28, 27-30. Kim, S.C., Chen, Y., Mirza, S., Xu, Y., Lee, J., Liu, P., and Zhao, Y. (2006a). A clean, more efficient method for in-solution digestion of protein mixtures without detergent or urea. J Proteome Res 5, 3446-3452. Kim, S.C., Sprung, R., Chen, Y., Xu, Y., Ball, H., Pei, J., Cheng, T., Kho, Y., Xiao, H., Xiao, L., et al. (2006b). Substrate and functional diversity of lysine acetylation revealed by a proteomics survey. Mol Cell 23, 607-618. Lombard, D.B., Alt, F.W., Cheng, H.L., Bunkenborg, J., Streeper, R.S., Mostoslavsky, R., Kim, J., Yancopoulos, G., Valenzuela, D., Murphy, A., et al. (2007). Mammalian Sir2 homolog SIRT3 regulates global mitochondrial lysine acetylation. Mol Cell Biol 27, 8807-8814.

32
Mailloux, R.J., Xuan, J.Y., Beauchamp, B., Jui, L., Lou, M., and Harper, M.E. (2013). Glutaredoxin-2 Is Required to Control Proton Leak through Uncoupling Protein-3. The Journal of biological chemistry 288, 8365-8379. Nadanaciva, S., Bernal, A., Aggeler, R., Capaldi, R., and Will, Y. (2007). Target identification of drug induced mitochondrial toxicity using immunocapture based OXPHOS activity assays. Toxicol In Vitro 21, 902-911. Nakagawa, T., Lomb, D.J., Haigis, M.C., and Guarente, L. (2009). SIRT5 Deacetylates carbamoyl phosphate synthetase 1 and regulates the urea cycle. Cell 137, 560-570. Olsen, J.V., Vermeulen, M., Santamaria, A., Kumar, C., Miller, M.L., Jensen, L.J., Gnad, F., Cox, J., Jensen, T.S., Nigg, E.A., et al. (2010). Quantitative phosphoproteomics reveals widespread full phosphorylation site occupancy during mitosis. Science signaling 3, ra3. Ruepp, A., Brauner, B., Dunger-Kaltenbach, I., Frishman, G., Montrone, C., Stransky, M., Waegele, B., Schmidt, T., Doudieu, O.N., Stumpflen, V., et al. (2008). CORUM: the comprehensive resource of mammalian protein complexes. Nucleic Acids Res 36, D646-650. Schriml, L.M., Arze, C., Nadendla, S., Chang, Y.W., Mazaitis, M., Felix, V., Feng, G., and Kibbe, W.A. (2012). Disease Ontology: a backbone for disease semantic integration. Nucleic Acids Res 40, D940-946. Schwab, M.A., Kolker, S., van den Heuvel, L.P., Sauer, S., Wolf, N.I., Rating, D., Hoffmann, G.F., Smeitink, J.A., and Okun, J.G. (2005). Optimized spectrophotometric assay for the completely activated pyruvate dehydrogenase complex in fibroblasts. Clin Chem 51, 151-160. Shannon, P., Markiel, A., Ozier, O., Baliga, N.S., Wang, J.T., Ramage, D., Amin, N., Schwikowski, B., and Ideker, T. (2003). Cytoscape: a software environment for integrated models of biomolecular interaction networks. Genome Res 13, 2498-2504. Taylor, N.L., Day, D.A., and Millar, A.H. (2002). Environmental stress causes oxidative damage to plant mitochondria leading to inhibition of glycine decarboxylase. The Journal of biological chemistry 277, 42663-42668. Taylor, S.W., Fahy, E., Zhang, B., Glenn, G.M., Warnock, D.E., Wiley, S., Murphy, A.N., Gaucher, S.P., Capaldi, R.A., Gibson, B.W., et al. (2003). Characterization of the human heart mitochondrial proteome. Nat Biotechnol 21, 281-286. Zambon, A.C., Gaj, S., Ho, I., Hanspers, K., Vranizan, K., Evelo, C.T., Conklin, B.R., Pico, A.R., and Salomonis, N. (2012). GO-Elite: a flexible solution for pathway and ontology over-representation. Bioinformatics 28, 2209-2210.