superconductivity of f-substituted ln obis 2 ln = la, ce ... fileon those with ln = la, ce, and yb....
TRANSCRIPT

Superconductivity of F-substituted LnOBiS2 (Ln = La, Ce, Pr, Nd, Yb)
compounds
D. Yazici, K. Huang, B. D. White, A. H. Chang, A. J. Friedman, and M. B.
Maple
Department of Physics, University of California, San Diego, La Jolla, CA 92093
E-mail: [email protected]
Polycrystalline samples of F-substituted LnOBiS2 (Ln = La, Ce, Pr, Nd, Yb)
compounds were synthesized by solid-state reaction. The samples were
characterized by x-ray diffraction measurements and found to have the ZrCuSiAs
crystal structure. Electrical resistivity and magnetic susceptibility measurements
were performed on all of the samples and specific heat measurements were made
on those with Ln = La, Ce, and Yb. All of these compounds exhibit
superconductivity in the range 1.9 K – 5.4 K, which has not previously been
reported for the compounds based on Ce, Pr, and Yb. The YbO0.5F0.5BiS2
compounds was also found to exhibit magnetic order at ~2.7 K that apparently
coexists with superconductivity below 5.4 K.
Keywords: Superconducting materials, rare earth compounds, electrical resistivity,
and specific heat
1. Introduction
Soon after the discovery of superconductivity in the BiS2-based compound Bi4O4S3 with
a superconducting critical temperature (Tc) of 8.6 K by Mizuguchi et al. [1], a new BiS2-
based superconductor, LaO1-xFxBiS2, with the relatively high Tc of 10.6 K was reported
[2]. Recently, another BiS2-based superconductor, NdO1-xFxBiS2 (x = 0.1 - 0.7) was

found to have a maximum Tc of 5.6 K at x ≈ 0.3 [3]. These materials have a layered
crystal structure composed of superconducting BiS2 layers and blocking layers of
Bi4O4(SO4)1-x for Bi4O4S3 and LnO for LnO1-xFxBiS2 (Ln = La, Nd). This is similar to the
situation encountered in the high-Tc layered cuprate and Fe-pnictide superconductors, in
which the superconductivity primarily resides in CuO2 planes and Fe-pnictide layers,
respectively.
Polycrystalline samples of F-substituted LnOBiS2 (Ln = La, Ce, Pr, Nd, Yb)
compounds were synthesized by solid-state reaction. The compounds were characterized
by x-ray diffraction measurements and found to have the ZrCuSiAs crystal structure.
Electrical resistivity and magnetic susceptibility measurements were made on all of the
samples, while specific heat measurements were made on the samples based on La, Ce
and Yb. All of these compounds exhibit superconductivity in the range 1.9 K – 5.4 K,
while the compounds with Ce, Pr, and Yb are new superconductors. The YbO0.5F0.5BiS2
sample was also found to exhibit magnetic order at ~2.7 K that apparently coexists with
superconductivity below 5.4 K.
2. Experimental Details
Polycrystalline samples of LnO1-xFxBiS2 (Ln = La, Ce, Pr, Nd, Yb) with x = 0.5 were
prepared by solid-state reaction using powders of Ln2O3 (Ln = La, Pr, Nd, Yb) (99.9%),
CeO2 (99.9%) for CeO1-xFxBiS2, LnF3 (99.9%), Ln2S3 (99.9%), and Bi2S3 (99.9%). The
Bi2S3 precursor powders were prepared by reacting Bi (99.99%) and S (99.9%) together
at 500 oC in an evacuated quartz tube for 10 hours. The four Ln2S3 precursor powders
were prepared by reacting Ln chunks and S grains at 800 oC in evacuated quartz tubes for
12 hours. The starting materials with nominal composition of LnO0.5F0.5BiS2 (Ln = La,

Ce, Pr, Nd, Yb) were weighed, thoroughly mixed, pressed into pellets, sealed in
evacuated quartz tubes, and annealed at 800 oC for 10 hours. The products were then
ground, mixed for homogenization, pressed into pellets, and annealed again in evacuated
quartz tubes at 800 oC for 10 hours. X-ray powder diffraction measurements were made
using an x-ray diffractometer with a Cu Kα source to assess phase purity and to determine
the crystal structure of the LnO0.5F0.5BiS2 (Ln = La, Ce, Pr, Nd, Yb) compounds.
Electrical resistivity ρ(T) measurements were performed using a four-wire technique in a
liquid 4He dewar in the temperature range 1.1 K ≤ T ≤ 300 K. The temperature
dependence of the magnetization was measured using a Quantum Design (QD) Magnetic
Property Measurement System (MPMS) with an applied magnetic field of 5 Oe. Specific
heat measurements were made using a standard thermal relaxation technique in the
temperature range 1.8 K ≤ T ≤ 50 K in a QD Dynacool Physical Property Measurement
System (PPMS).
3. Results and discussion
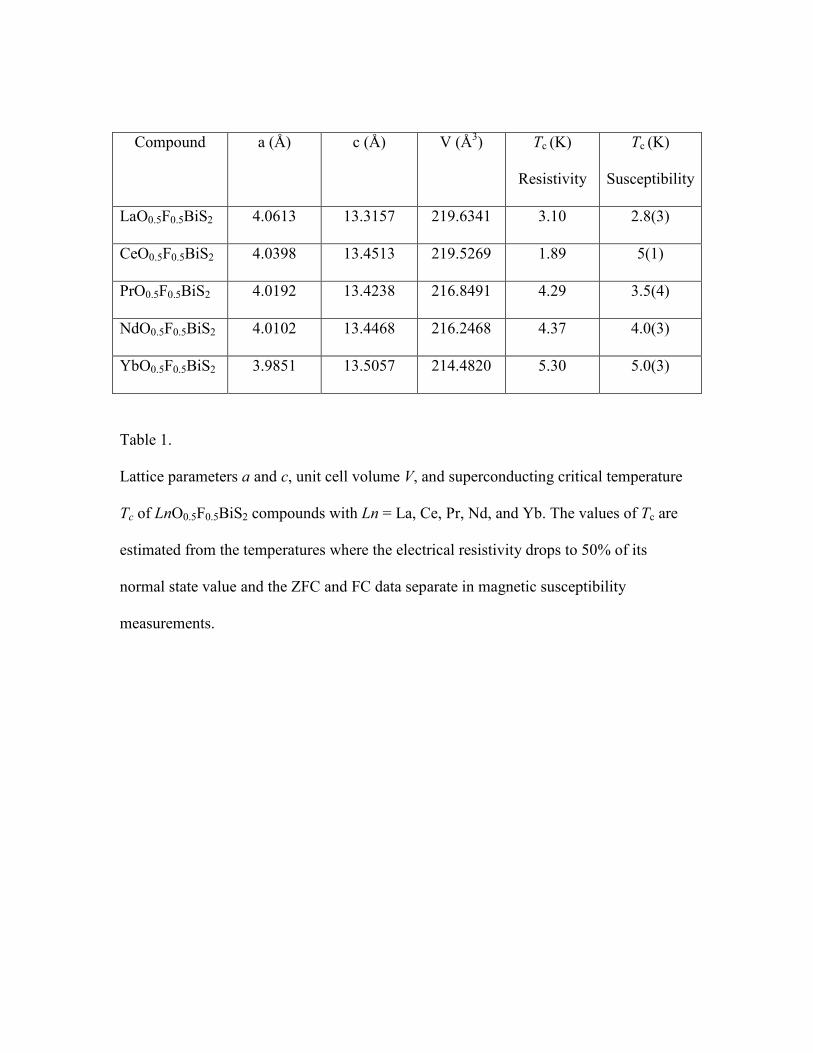
Figure 1 displays a representative powder x-ray diffraction (XRD) pattern for
LaO0.5F0.5BiS2. The broad feature in the XRD background between 25 and 35 degrees is
associated with the glass substrate. Although the XRD pattern contains a small number
of impurity peaks belonging to LaF3, which are indicated by arrows in Fig. 1, all of the
major peaks can be indexed to the space group P4/nmm. Similar patterns (not shown)
were obtained for the other compounds with similar impurity levels of LnF3. The lattice
constants were estimated from 2Θ values of selected Bragg reflections and are listed in
Table 1. The crystal structure of LaOBiS2 is displayed in the inset of Fig. 1.
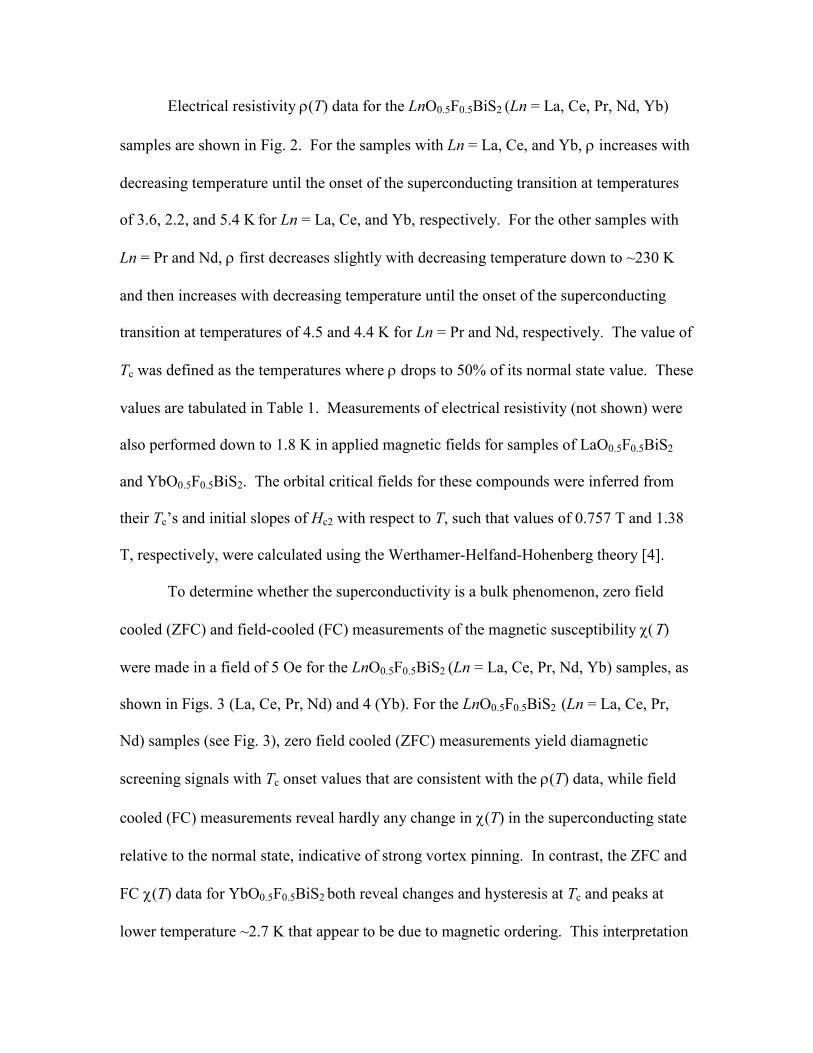
Electrical resistivity ρ(T) data for the LnO0.5F0.5BiS2 (Ln = La, Ce, Pr, Nd, Yb)
samples are shown in Fig. 2. For the samples with Ln = La, Ce, and Yb, ρ increases with
decreasing temperature until the onset of the superconducting transition at temperatures
of 3.6, 2.2, and 5.4 K for Ln = La, Ce, and Yb, respectively. For the other samples with
Ln = Pr and Nd, ρ first decreases slightly with decreasing temperature down to ~230 K
and then increases with decreasing temperature until the onset of the superconducting
transition at temperatures of 4.5 and 4.4 K for Ln = Pr and Nd, respectively. The value of
Tc was defined as the temperatures where ρ drops to 50% of its normal state value. These
values are tabulated in Table 1. Measurements of electrical resistivity (not shown) were
also performed down to 1.8 K in applied magnetic fields for samples of LaO0.5F0.5BiS2
and YbO0.5F0.5BiS2. The orbital critical fields for these compounds were inferred from
their Tc’s and initial slopes of Hc2 with respect to T, such that values of 0.757 T and 1.38
T, respectively, were calculated using the Werthamer-Helfand-Hohenberg theory [4].
To determine whether the superconductivity is a bulk phenomenon, zero field
cooled (ZFC) and field-cooled (FC) measurements of the magnetic susceptibility χ(Τ)
were made in a field of 5 Oe for the LnO0.5F0.5BiS2 (Ln = La, Ce, Pr, Nd, Yb) samples, as
shown in Figs. 3 (La, Ce, Pr, Nd) and 4 (Yb). For the LnO0.5F0.5BiS2 (Ln = La, Ce, Pr,
Nd) samples (see Fig. 3), zero field cooled (ZFC) measurements yield diamagnetic
screening signals with Tc onset values that are consistent with the ρ(T) data, while field
cooled (FC) measurements reveal hardly any change in χ(T) in the superconducting state
relative to the normal state, indicative of strong vortex pinning. In contrast, the ZFC and
FC χ(T) data for YbO0.5F0.5BiS2 both reveal changes and hysteresis at Tc and peaks at
lower temperature ~2.7 K that appear to be due to magnetic ordering. This interpretation

is further supported by a sharp feature in the specific heat near ~2.7 K and shown in Fig.
7. That magnetic ordering is probably antiferromagnetic in nature, since the
superconductivity persists to temperatures below ~2.7 K and appears to coexist with the
magnetic order. For superconductors containing ions that order ferromagnetically, such
as ErRh4B4 and HoMo6S8, the ferromagnetism destroys the superconductivity at a second
critical temperature Tc2 of the order of the Curie temperature that is lower than the critical
temperature Tc1 at which the sample first became superconducting [5,6].
Specific heat C(T) data for LnO0.5F0.5BiS2 samples with Ln = La, Ce, and Yb are
displayed in Figs. 5, 6, and 7, respectively. C(T) data for LaO0.5F0.5BiS2, covering the
temperature range 1.8 K to 50 K, are shown in Fig. 5. A fit of the expression C(T) = γT +
βT 3, where γ is the electronic specific heat coefficient and β is the coefficient of the
lattice contribution, to C/T data in the normal state, plotted as a function of T 2, is shown
in the inset in the lower right hand side of Fig. 5. From the best fit, which is explicitly
indicated by a line in the inset, we obtain values of γ = 2.53 mJ/mol-K2 and β = 0.904
mJ/mol-K4; the value of β corresponds to a Debye temperature of ΘD = 221 K. In the
inset in the upper left hand side of the figure, the electronic contribution to the specific
heat Ce(T) = C(T) – βT 3 is shown, which has been derived by subtracting the lattice
contribution βT 3 from C(T). There is a clear jump at Tc = 2.93 K, determined from the
idealized entropy conserving construction shown in the figure. This value of Tc is close
to the temperature at which the electrical resistivity of LaO0.5F0.5BiS2 vanishes (see Fig.
2). The presence of the jump clearly indicates the bulk nature of superconductivity in this
compound. The ratio of the jump to the electronic contribution to specific heat at Tc,
∆C/γTc = 0.94, was calculated using the jump in Ce/T of 2.37 mJ/mol-K2 seen in the inset
of Fig. 5. This value for ∆C/γTc is less than the value of 1.43 predicted by the BCS
theory.
The C(T) data for CeO0.5F0.5BiS2 are displayed between 1.8 K and 50 K in Fig. 6.
There is an upturn at low temperature that may indicate the presence of incipient
magnetic order. However, measurements must be made at temperatures below 1.8 K to
unambiguously identify the nature of this anomaly. The upper inset of Fig. 6 highlights
the behavior of C/T as a function of T. Absent from these data is any evidence for a jump
at the Tc’s obtained from either the electrical resistivity (Tc = 1.9 K) or magnetic
susceptibility (Tc = 5(1) K) measurements. However, the jump in C/T for LaO0.5F0.5BiS2
was closest to the temperature where its electrical resistivity dropped completely to zero,
and according to Fig. 2, this occurs in CeO0.5F0.5BiS2 below our base temperature. The
lower inset of Fig. 6 highlights the linear fit to C/T vs. T 2, from which we extracted γ =
58.1 mJ/mol-K2 and calculated ΘD = 224 K.
Specific heat C(T) data for YbO0.5F0.5BiS2 between 1.8 K and 50 K are shown in
Fig. 7. In the inset in the lower right hand side of the figure, a linear fit to the C/T vs T 2
plot yields values of γ = 30.1 mJ/mol-K2 and ΘD = 186 K. Highlighted in the inset of Fig.
7 on the upper left hand side of the figure are C(T) data, which exhibit a lambda-like
anomaly near 2.65 K that appears to be due to antiferromagnetic order. The entropy
Sm(T) associated with the magnetic ordering was estimated by integrating Ce(T)/T from 0
K to 10 K, where the electronic contribution Ce(T) was derived from C(T) by subtracting
the phonon contribution βT3. The contribution to Se(T) between 0 K and 1.8 K, the low
temperature limit of the C(T) measurements, was estimated by linear extrapolation of the
Ce(T)/T curve to 0 K and integrating from 0 K to 1.8 K. The resultant entropy Sm(T) (not

shown) was found to saturate to approximately 4.8 J/mol-K at ~10K which is 84 % of
Rln2 associated with a Kramers doublet ground state. This large value of the entropy
reveals that the magnetic ordering is intrinsic and not due to an impurity phase such as
Yb2O3, YbOF or Yb2O2S which exhibit antiferromagnetic order with Néel temperatures
in the range TN = 2.3 - 2.5 K. No jump due to the superconducting transition was evident
in the C(T) data at the Tc of ~ 5.4 K as determined from ρ(T) and χ(T) measurements (see
Figs. 2 and 4). This is probably a consequence of the superconducting transition being
spread out in temperature due to sample inhomogeneity.
4. Summary
Polycrystalline samples of LnO0.5F0.5BiS2 (Ln = La, Ce, Pr, Nd, Yb) compounds were
synthesized by solid-state reaction and found to have the ZrCuSiAs crystal structure.
Electrical resistivity and magnetic susceptibility measurements were performed on all of
the samples and specific heat measurements were made on those with Ln = La, Ce, and
Yb. All of these compounds exhibit superconductivity in the range 1.9 K – 5.4 K, which
has not previously been reported for the compounds based on Ce, Pr, and Yb. The
YbO0.5F0.5BiS2 sample was also found to exhibit magnetic order (probably
antiferromagnetic order) at ~2.7 K that apparently coexists with superconductivity below
5.4 K.
Acknowledgements
The authors gratefully acknowledge the support of the US Air Force Office of Scientific Research
– Multidisciplinary University Research Initiative under Grant No. FA9550-09-1-0603 (funding
superconductivity searches) and the US Department of Energy under Grant No. DE-FG02-04-
ER46105 (funding materials synthesis and characterization).

References
[1] Y. Mizuguchi et al., arXiv: 1207.3145.
[2] Y. Mizuguchi et al., arXiv: 1207.3567.
[3] S. Demura et al., arXiv: 1207.5248.
[4] N. R. Werthamer, E. Helfand, and P. C. Hohenberg, Phys. Rev. 147, 295 (1966)
[5] O. Fischer, M. B. Maple ( Eds. ), Superconductivity in Ternary Compounds 1, Topics
in Current Physics, vol. 32, Springer, Berlin, 1982.
[6] M. B. Maple, O. Fischer ( Eds. ), Superconductivity in Ternary Compounds 2, Topics
in Current Physics, vol. 34, Springer, Berlin, 1982.
Compound a (Å) c (Å) V (Å3) Tc (K)
Resistivity
Tc (K)
Susceptibility
LaO0.5F0.5BiS2 4.0613 13.3157 219.6341 3.10 2.8(3)
CeO0.5F0.5BiS2 4.0398 13.4513 219.5269 1.89 5(1)
PrO0.5F0.5BiS2 4.0192 13.4238 216.8491 4.29 3.5(4)
NdO0.5F0.5BiS2 4.0102 13.4468 216.2468 4.37 4.0(3)
YbO0.5F0.5BiS2 3.9851 13.5057 214.4820 5.30 5.0(3)
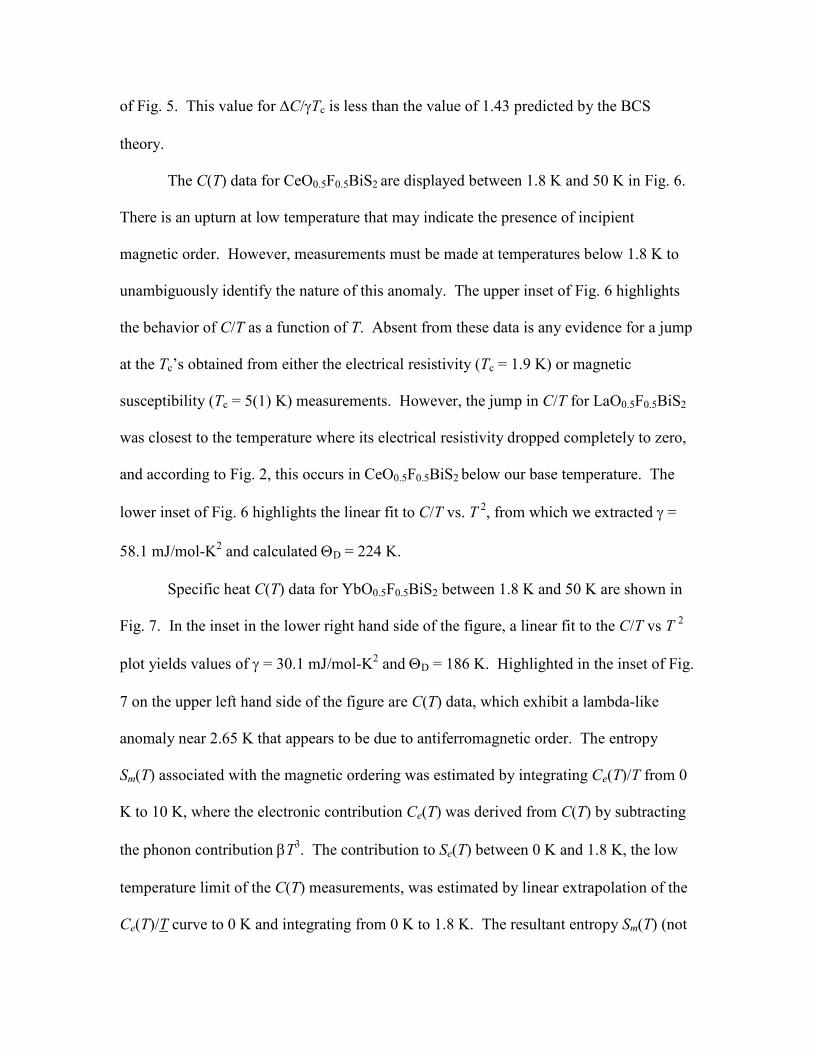
Table 1.
Lattice parameters a and c, unit cell volume V, and superconducting critical temperature
Tc of LnO0.5F0.5BiS2 compounds with Ln = La, Ce, Pr, Nd, and Yb. The values of Tc are
estimated from the temperatures where the electrical resistivity drops to 50% of its
normal state value and the ZFC and FC data separate in magnetic susceptibility
measurements.
Figure 1. X-ray diffraction pattern for LaO0.5F0.5BiS2 at room temperature. The black
points indicate the observed intensity Iobs, the red line represents the calculated intensity
Icalc, and the blue line indicates the difference Iobs – Icalc. The crystal structure is shown
in the upper right hand part of the figure.

Figure 2. Electrical resistivity ρ(T), normalized to its room temperature value ρ(300 K),
vs temperature T for LnO0.5F0.5BiS2 (Ln = La, Ce, Pr, Nd, Yb). The resistive
superconducting transition curves are shown in the inset
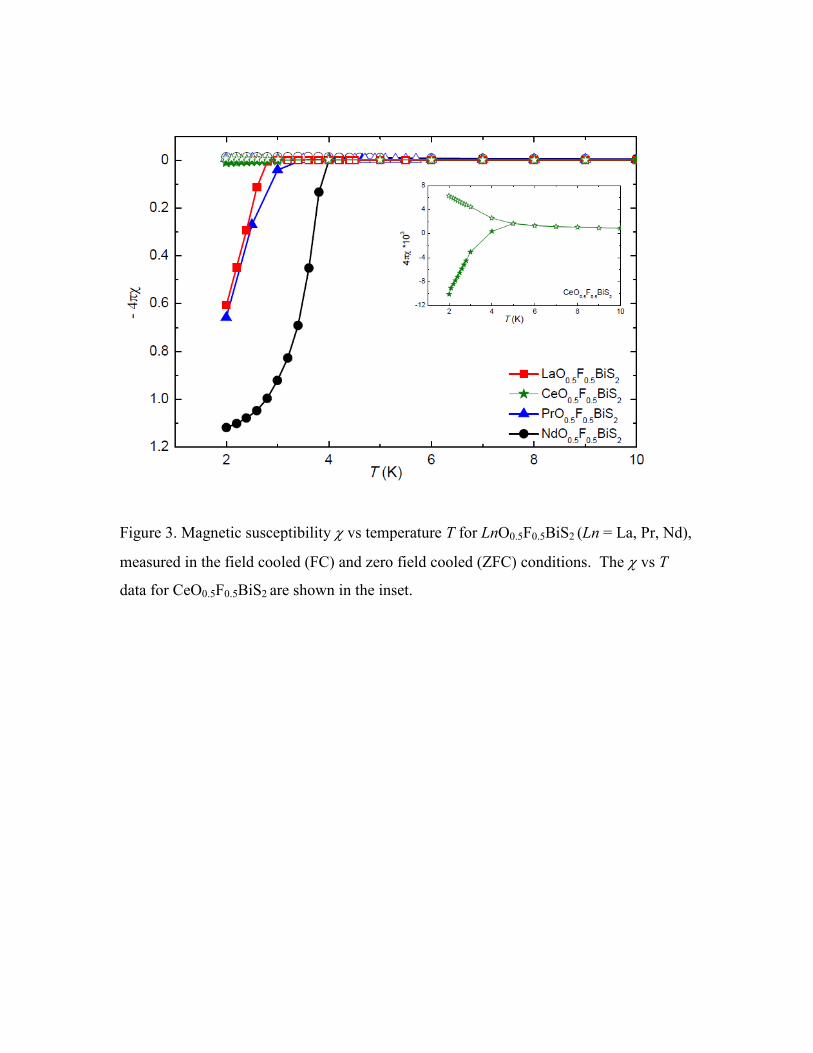
Figure 3. Magnetic susceptibility χ vs temperature T for LnO0.5F0.5BiS2 (Ln = La, Pr, Nd),
measured in the field cooled (FC) and zero field cooled (ZFC) conditions. The χ vs T
data for CeO0.5F0.5BiS2 are shown in the inset.

Figure 4. Magnetic susceptibility χ vs temperature T for YbO0.5F0.5BiS2, measured in the
field cooled (FC) and zero field cooled (ZFC) conditions. The superconducting critical
temperature Tc is indicated in the figure.

Figure 5. Specific heat C vs temperature T for LaO0.5F0.5BiS2. A plot of C/T vs T 2 is
shown in the inset in the lower right hand part of the figure. The red line is a fit of the
expression C(T) = γ + βT 2, which yields the values for γ = 2.53 mJ/mol-K2 and ΘD = 221
K. A plot of Ce vs T, where Ce is the electronic contribution to the specific heat, in the
vicinity of the superconducting transition is shown in the inset in the upper left hand side
of the figure. An idealized entropy conserving construction yields Tc = 2.93 K and
∆C/(γTc) = 0.94.
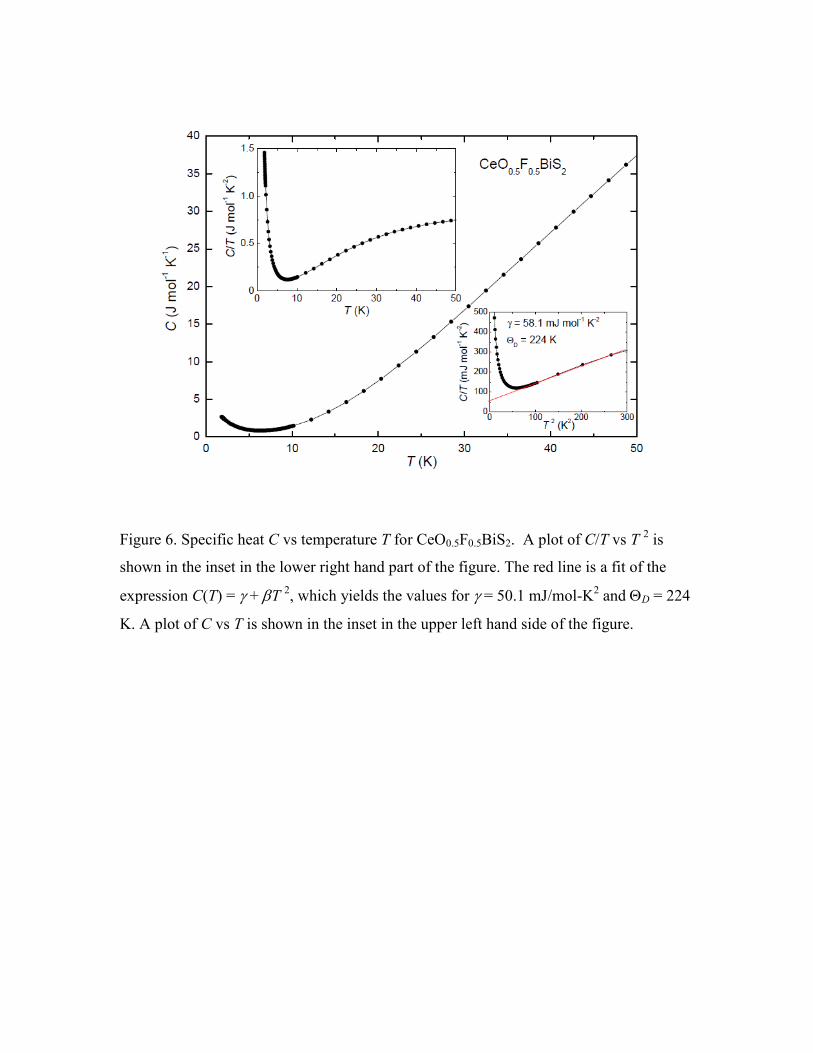
Figure 6. Specific heat C vs temperature T for CeO0.5F0.5BiS2. A plot of C/T vs T 2 is
shown in the inset in the lower right hand part of the figure. The red line is a fit of the
expression C(T) = γ + βT 2, which yields the values for γ = 50.1 mJ/mol-K2 and ΘD = 224
K. A plot of C vs T is shown in the inset in the upper left hand side of the figure.

Figure 7. Specific heat C vs temperature T for YbO0.5F0.5BiS2. A plot of C/T vs T 2 is
shown in the inset in the lower right hand part of the figure. The red line is a fit of the
expression C(T) = γ + βT 2, which yields the values for γ = 30.1 mJ/mol-K2 and ΘD = 186
K. A plot of C vs T, shown in the inset in the upper left hand side of the figure, reveals a
sharp feature that is apparently associated with magnetic order that occurs below TM =
2.65 K.