supelco reporter, volume 31.1
TRANSCRIPT

pg. 12 ANALYSIS OF
ANTIARRHYTHMIC CARDIAC DRUGS IN
PLASMA
pg. 20
PERFORMANCE COMPARISON OF
STORAGE CONTAINERS
TDS3™
Analysis of Pesticidesby QuEChERS and SPE
pgs. 6&8
Applications Newsletter Volume 31.1
sigma-aldrich.com/analytical
Reporter 31.1 |2
Table of Contents
Pharmaceutical
Benefits of Larger Fused-Core® Particles to Pharmaceutically Relevant Compounds. . . . . . . . . . . . . . . . . .3
Narrow Bore Gel Filtration Columns
for Protein and Aggregate Analysis . . . . .4
Food and Beverage Analysis
Reduce Matrix Background and Improve Overall Analyte Recovery for the Analysis of Pesticides in Beef Kidney . . . .6
Rapid Cleanup of Spinach Extracts Using Gravity Elution SPE Prior to Pesticide Analysis . . . . . . . . . . . . . . . . . . . . . .8
Ionic Liquid GC Column Option for the Analysis of Omega 3 and Omega 6 Fatty Acids . . . . . . . . . . . . . . . . . 10
Clinical/Bioanalytical
Investigating Matrix Interference in Analysis of Antiarrhythmic Cardiac Drugs in Plasma . . . . . . . . . . . . . 12
Improvement in LC-MS/MS Analysis of Vitamin D Metabolites in Serum by Leveraging Column Selectivity and Effective Sample Prep . . . . . . . . . . . 16
Environmental
radiello™ Passive Sampler as a Tool for the Measurement of Atmospheric Ammonia Concentrations and Dry Deposition . . . . . . . . . . . . . . . . . . . . . . 18
Performance Comparison of TDS3™ Storage Containers to Swagelok Fittings and Glass Storage Containers . . . . . . . . 20
Chromatographic Purification
Considerations for TLC Plate Selection . . . . . . . . . . . . . . . . . . 22
ReporterVolume 31.1
The QuEChERS Approach to
Sample Preparation
Dear Colleague:
Nearly a decade ago, Steven J. Lehotay and Michelangelo Anastassiades changed
the face of solid phase extraction for food analysis with the introduction of the
QuEChERS approach. The “Quick, Easy, Cheap, Effective, Rugged, Safe” QuEChERS
methodology involves the use of bulk salts and SPE sorbents for the extraction
and cleanup of homogenized food/agricultural samples with simple mixing and
centrifugation steps. This technique has provided analytical laboratories with fast, cost
effective sample cleanup prior to pesticide residue analysis by LC-MS or GC-MS.
The QuEChERS approach to sample cleanup is now widely accepted and has been
incorporated into a variety of contemporary laboratory methods. Extensive validation
of two specific QuEChERS techniques has led to AOAC and EN official methods for
pesticide residue analysis (AOAC Official Method 2007.01 and CEN Standard Method EN
15662). These methods have been adopted by numerous food testing labs throughout
the world for various food matrices. In addition, although the QuEChERS method
is predominantly used for pesticide residue analysis, it has recently been expanded
into areas including veterinary drug, PAH, PCB, PBDE and flame retardant analysis.
Though the QuEChERS approach has yielded increased speed and sensitivity, lipid and
pigment interferences in difficult matrices have remained obstacles in food analysis.
The Supel™ QuE Z-Sep sorbents have recently illustrated the effective removal of
more fat and color from sample extracts than traditional phases for QuEChERS (i.e.
PSA and C18). Fatty matrix interferences are removed via the interaction between
the polar group of the lipid and the proprietary bonded ion-exchange group of
the Z-Sep sorbent as well as the interaction between the hydrophobic chains of
the lipid and the hydrophobic group of the sorbent. By eliminating problematic
matrix interferences, Z-Sep products improve limits of detection and provide more
robust LC-MS and GC-MS methods. This proprietary technology can replace C18
and PSA phases in current methods without additional method development.
The article entitled “Reduce Matrix Background & Improve Overall Analyte Recovery
for the Analysis of Pesticides in Beef Kidney” illustrates the use of Z-Sep+ for the removal
of lipid interferences from a fatty matrix. To learn more about the Supel QuE Z-Sep sorbents
for QuEChERS, refer to the aforementioned article in this issue, scan the QR code below,
or visit sigma-aldrich.com/zsep.
Sincerely,
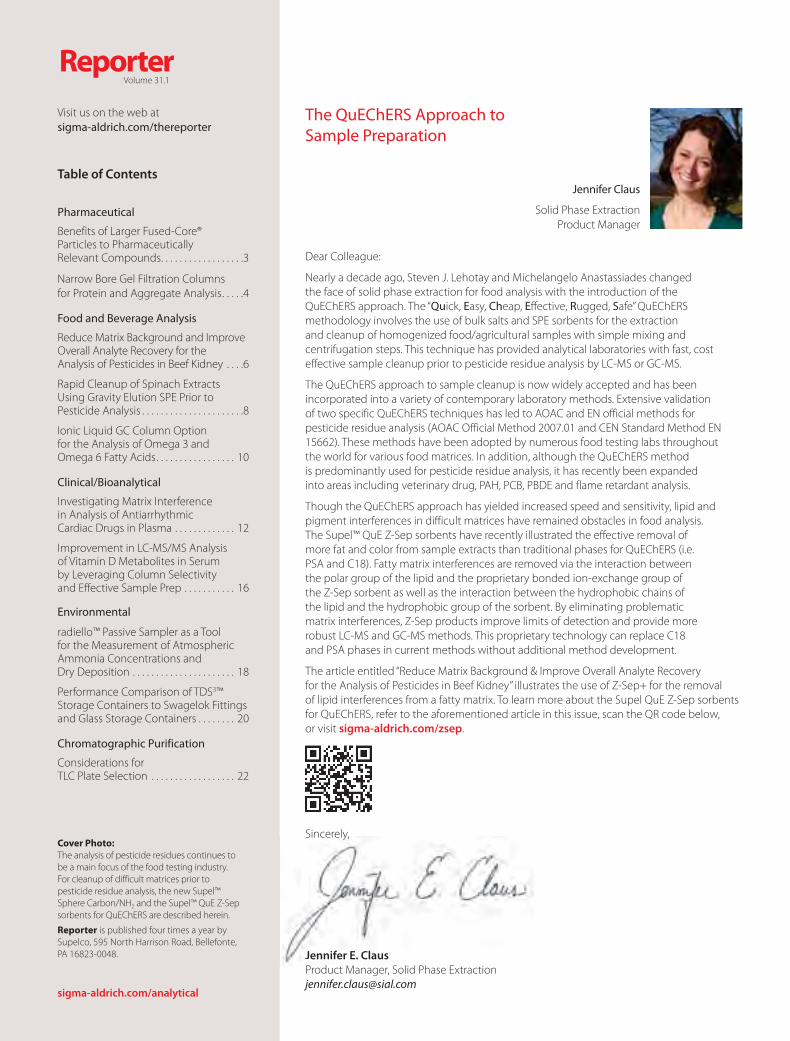
Jennifer E. Claus
Product Manager, Solid Phase Extraction
Jennifer Claus
Solid Phase Extraction
Product Manager
sigma-aldrich.com/analytical
Visit us on the web at
sigma-aldrich.com/thereporter
Cover Photo: The analysis of pesticide residues continues to
be a main focus of the food testing industry.
For cleanup of difficult matrices prior to
pesticide residue analysis, the new Supel™
Sphere Carbon/NH2 and the Supel™ QuE Z-Sep
sorbents for QuEChERS are described herein.
Reporter is published four times a year by
Supelco, 595 North Harrison Road, Bellefonte,
PA 16823-0048.
Sincerely,
Jennifer E. Claus
P d t M S lid Ph E t ti

3Order: 800-325-3010 (U.S.) 814-359-3441 (Global)
Benefits of Larger Fused-Core® Particles to Pharmaceutically Relevant CompoundsGaurang Parmar
Non-steroidal anti-inflammatory drugs (NSAIDs) are pharmaceutically
relevant compounds that inhibit the inflammation process without
the use of steroid drugs. The most commonly used NSAIDs are
aspirin, ibuprofen and naproxen.
NSAIDs often cause dangerous side effects. As reported to the US
Food and Drug Administration, the majority of the undesired side
effects are related to damage to the gastrointestinal (GI) tract and
kidneys.1 As a result, there is continuous interest in improving the
analysis and characterization of NSAIDs.
In this study a simple UV-based HPLC method was developed
using the new Ascentis® Express 5 μm Fused-Core HPLC column.
A comparison was then made to a traditional 5 μm fully-porous
HPLC column.
Experimental Conditions
An aliquot (2 μL) of NSAIDs mixture was injected on an Ascentis
Express 5 μm and a regular porous 5 μm C18, 15 cm x 4.6 mm I.D.
column. Figure 1 shows the two chromatograms and details the
experimental conditions.
Figure 1. Comparison of NSAIDs Analysis on Ascentis Express
5 μm and Regular Porous 5 μm Columns
column: Ascentis Express C18, 5 μm (50537-U) and a regular porous C18, 15 cm x 4.6 mm I.D
mobile phase: (A) 20 mM pH 2.5 potassium phosphate, (B) 50:50 ACN:MeOH; A:B = 48% A:52% B; instrument: Shimadzu Prominence UFLC XR
flow rate: 2.0 mL/min
injection volume: 2 μL
det: 254 nm
temp: 35 °C
1. Acetaminophen
2. Aspirin
3. Salicylic acid
4. Tolmetin
5. Ketoprofen
6. Naproxen
7. Fenoprofen
8. Diclofenac
9. Ibuprofen
0 2 4
6 8
Min
1
2
3
4 5
Ab
sorb
an
ce
6 8 10 12 14 16 18
7 9
6 8
1
2
3
4 57 9
Ascentis Express 5 μmPressure 240 bar
Porous 5 μmPressure 215 bar
k = 12.57N = 20,500
k = 15.5N = 11,000
Conclusion
The Fused-Core column shows same selectivity as a regular 5 μm
porous C18 HPLC column, but outperforms the fully-porous column
in terms of efficiency, with almost twice the theoretical plates
(N=20,500 vs. N=11,000). In addition to this, the 5 μm Fused-Core
column exhibits greater resolution in about half the run time
when compared to the fully porous column, all at about the same
backpressure. The Fused-Core particle design provides an easy way to
realize higher efficiencies and shorter run times. See Figure 2 for the
Fused-Core particle comparison of 2.7 μm vs. 5 μm.
Figure 2. Comparison of 2.7 μm vs. 5 μm Fused-Core Particles
0.5 μm
1.7 μm2.7 μm Solid Core
0.6 μm
3.3 μm5 μm Solid Core
Reference
1. Spac, A. F.; Dorneanu, V., HPLC Analysis of NSAIDs, Encyclopedia of Chrom,
Edition 3, 2009 Chapter.129, 495
Featured Product
Description Cat. No.
Ascentis Express C18, 15 cm x 4.6 mm I.D., 5 μm particles 50537-U
Related Products
I.D. Length C18 F5 C8
Pheny-
Hexyl ES-Cyano
Ascentis Express 5 μm Columns
2.1 mm 2 cm 50507-U 50603-U 50362-U 50442-U 50557-U
2.1 mm 3 cm 50508-U 50604-U 50363-U 50443-U 50558-U
2.1 mm 5 cm 50509-U 50605-U 50364-U 50446-U 50559-U
2.1 mm 7.5 cm 50511-U 50607-U 50367-U 50451-U 50562-U
2.1 mm 10 cm 50517-U 50612-U 50368-U 50454-U 50563-U
2.1 mm 15 cm 50518-U 50613-U 50372-U 50455-U 50564-U
2.1 mm 25 cm 50521-U 50614-U 50373-U 50456-U 50566-U
3.0 mm 3 cm 50522-U 50615-U 50376-U 50459-U 50567-U
3.0 mm 5 cm 50523-U 50616-U 50377-U 50464-U 50568-U
3.0 mm 7.5 cm 50525-U 50619-U 50378-U 50466-U 50569-U
3.0 mm 10 cm 50526-U 50622-U 50381-U 50469-U 50570-U
3.0 mm 15 cm 50527-U 50623-U 50382-U 50470-U 50574-U
3.0 mm 25 cm 50528-U 50624-U 50385-U 50472-U 50575-U
4.6 mm 3 cm 50529-U 50625-U 50386-U 50474-U 50577-U
4.6 mm 5 cm 50530-U 50626-U 50389-U 50477-U 50581-U
4.6 mm 7.5 cm 50533-U 50627-U 50390-U 50479-U 50583-U
4.6 mm 10 cm 50536-U 50628-U 50391-U 50482-U 50585-U
4.6 mm 15 cm 50537-U 50631-U 50392-U 50483-U 50588-U
4.6 mm 25 cm 50538-U 50632-U 50394-U 50487-U 50591-U
Description Cat. No.
Holder w/EXP Titanium Hybrid Ferrule (cartridge not included) 53500-U

Reporter 31.1 |4
sigma-aldrich.com/tsk
Pharmaceutical
Narrow Bore Gel Filtration Columns for Protein and Aggregate AnalysisRoy Eksteen
Introduction
Traditionally, in Gel Filtration Chromatography (GFC), the column
diameter has been larger than the diameter of HPLC columns used in
interactive modes of liquid chromatography. The main reason for this
was that HPLC instruments were optimized for 4.6 mm I.D. columns
that were 25 cm long. To prevent extra-column band broadening
(ECBB) to detract from the efficiency of the column, it was (and still
is) accepted practice to retain the solute of interest at least up to a
retention factor of two, which means a peak volume that is three
times the volume in which an unretained (low molecular weight)
solute elutes from a GFC column. The most popular internal diameter
of GFC columns is 7.8 mm. Since peak volume is proportional to the
ratio of the square of the column diameters (7.8 and 4.6 mm)2, the
volume in a 7.8 mm I.D. column is almost 3 times larger than that of a
4.6 mm I.D. column. In other words, extra-column band broadening
was not a factor when 7.8 mm I.D. GFC columns were used with
conventional HPLC instrumentation.
In recent years, HPLC and UHPLC instruments have been optimized
to take advantage of higher column efficiencies provided by the
Fused-Core® 2.7 μm particle technology available in Ascentis® Express
columns and also by columns packed with fully porous 1.7 μm
particles. When using such optimized instrumentation, the researcher
can now take advantage of the primary benefit of smaller I.D. (gel
filtration) columns, namely the ability to detect proteins at higher
sensitivity when limited in sample mass. In this summary review of
a poster from Tosoh Bioscience LLC,1 we will illustrate this principle
featuring the popular TSKgel® SuperSW3000 gel filtration columns.
Experimental
Columns
TSKgel SuperSW3000, 4 μm, 1 mm I.D. x 30 cm (Cat. No. 821485)
TSKgel SuperSW3000, 4 μm, 2 mm I.D. x 30 cm (Cat. No. 821845)
TSKgel SuperSW3000, 4 μm, 4.6 mm I.D. x 30 cm (Cat. No. 818675)
Sample
Proteins and enzymes were purchased from Sigma-Aldrich®. The
antibody was a gift from the Tosoh Research Center (Kanagawa, Japan).
Other
UV cell: 2 μL (for 2 mm & 4.6 mm I.D.)
UV cell: 35 nL (for 1 mm I.D.)
Sample injector: Rheodyne 7520
Tubing (injector to column): 0.05 mm I.D. x 20 cm fused silica
Results and Discussion
Gel filtration chromatography (size-exclusion chromatography in an
aqueous mobile phase) is a powerful tool for analyzing biological
polymers such as proteins, peptides, nucleic acids and their
fragments. In biopharma companies, TSKgel SW series GFC columns
are now routinely and widely used in research and in the final quality
control of biotherapeutic drugs. In QC, the analyst is rarely sample
mass limited. However, researchers performing proteomic studies
routinely rely on the ability to detect very small amounts of proteins.
Like the conventional 4.6 mm I.D. column, the 1 mm and 2 mm I.D.
TSKgel SuperSW3000 columns are filled with spherical 4 μm particles
chemically bonded with diol-containing functional groups. The
effect of sample mass on detection sensitivity is shown in Figure 1
for a series of protein standards. The same protein mass and volume
(1 μL) was injected on a 1 mm I.D., 2 mm I.D. and 4.6 mm I.D. TSKgel
SuperSW3000 column. Approximately a five-fold increase in peak
height of a standard protein mixture was observed when using a
2 mm I.D. x 30 cm TSKgel SuperSW3000 column compared to a
4.6 mm I.D. x 30 cm column. Clearly, the best sensitivity is obtained
on the smallest bore (1 mm I.D.) column. Note that the same 2 μL UV
detector cell volume was used for the 2 and 4.6 mm I.D. columns and
a much smaller 35 nL cell volume for the 1 mm I.D. column.
Figure 1. Effect of Sample Mass on Detection Sensitivity
columns: TSKgel SuperSW3000, 30 cm x 4.6 mm I.D.
TSKgel SuperSW3000, 30 cm x 2 mm I.D.
TSKgel SuperSW3000, 30 cm x 1 mm I.D.
eluent: 0.1 mol/L phosphate buffer + 0.1 mol/L Na2SO4 + 0.05% NaN3 (pH 6.7)
flow rate: 0.350 mL/min (4.6 mm I.D.)
0.650 mL/min (2 mm I.D.)
0.016 mL/min (1 mm I.D.)
detection: UV at 280 nm
detector cell volume: 2 μL (4.6 and 2 mm I.D.)
35 nL (1 mm I.D.)
temperature: 25 °C
injection volume: 1 μL
0
20
40
60
80
100
120
140
0 5 10 15 20
Min
Inte
nsi
ty (
mV
)
4.6 mm I.D.
2 mm I.D.
1 mm I.D.
1
2
4
5
3
1. Thyroglobulin (1.0 mg/mL)
2. γ-Globulin (2.0 mg/mL)
3. Ovalbumin (2.0 mg/mL)
4. Ribonuclease A (3.0 mg/mL)
5. p-Aminobenzoic acid (0.02 mg/mL)

5Order: 800-325-3010 (U.S.) 814-359-3441 (Global)
The same improvement in sensitivity as seen for protein standards
was also evident when analyzing an IgG sample containing a low
concentration of aggregates, as is shown in Figure 2. The fact the
calibration curves were linear (not shown) confirmed nonspecific
adsorption on the stationary phase was minimal. The detection limit
of IgG was 18 ng using the 1 mm I.D. TSKgel SuperSW3000 column
while still being able to detect small amounts of IgG aggregates.
As with 1 mm I.D. columns, we found that reducing the injection
volume of an IgG solution from 10 μL to 1 μL greatly improved
efficiency of the 2 mm I.D. column, although at constant injection
volume, efficiency did not vary with IgG concentration in the
range of 1-5 mg/mL. In a separate study (results not shown) it was
determined trace analysis of biological components was possible
when the 1 mm I.D. TSKgel SuperSW3000 column was utilized with
an off-line SELDI/TOF/MS.
Figure 2. Improve IgG Aggregate Detection Limit
columns: TSKgel SuperSW3000, 30 cm x 4.6 mm I.D.
TSKgel SuperSW3000, 30 cm x 2 mm I.D.
TSKgel SuperSW3000, 30 cm x 1 mm I.D.
eluent: 0.1 mol/L phosphate buffer + 0.1 mol/L Na2SO4 + 0.05% NaN3 (pH 6.7)
flow rate: 0.350 mL/min (4.6 mm I.D.)
0.650 mL/min (2 mm I.D.)
0.016 mL/min (1 mm I.D.)
detection: UV at 280 nm
detector cell volume: 2 μL (4.6 and 2 mm I.D.)
35 nL (1 mm I.D.)
temperature: 25 °C
injection volume: 1 μL
sample: lgG (mouse, Mab, 1 mg/mL)
9
10
11
12
13
14
0 5 10 15
Inte
nsi
ty (
mV
)
Min
1 mm I.D. x 30 cm
AggregatesIgG (monomer)
2 mm I.D. x 30 cm
4 mm I.D. x 30 cm
The performance of a competitor column filled with a composite
matrix of dextran and agarose is compared in Figure 3 with a
2 mm I.D. TSKgel SuperSW3000 column, each operated at their
recommended flow rate. The result demonstrates the silica backbone
in SW-type TSKgel columns is best suited to deliver fast and efficient
results in a high throughput situation.
Figure 3. Competitive Advantage
column: TSKgel SuperSW3000, 30 cm x 2 mm I.D.
flow rate: 65 μL/min
linear velocity: 124 cm/h
N: 30,000
column: Competitor A, 30 cm x 3.2 mm I.D.
flow rate: 40 μL/min
linear velocity: 30 cm/h
N: 11,000
eluent: 0.1 mol/L phosphate buffer + 0.1 mol/L Na2SO4 + 0.05% NaN3 (pH 6.7)
detection: UV at 280 nm
temperature: 25 °C
injection volume: 0.2 μL
0
10
20
30
40
50
60
70
80
90
100
0 10 20 30 40 50 60 70
Min
Inte
nsi
ty (
mV
)
12 3
4 5
TSKgel SuperSW3000
Competitor A
1. Thyroglobulin (1.0 mg/mL)
2. γ-Globulin (2.0 mg/mL)
3. Ovalbumin (2.0 mg/mL)
4. Ribonuclease A (3.0 mg/mL)
5. p-Aminobenzoic acid (0.02 mg/mL)
Note: both columns were operated at
their recommended flow rates.
Conclusions
Narrow bore TSKgel SuperSW3000 columns (1 mm and 2 mm I.D.)
showed similar resolution for biological samples to what can be
obtained on conventional 4.6 mm I.D. TSKgel SuperSW3000 columns.
As expected, highest sensitivity was achieved on the 1 mm I.D.
narrow bore column. Linear calibration curves confirmed nonspecific
adsorption on the stationary phase was minimal. The detection limit of
IgG was 18 ng using a 1 mm I.D. column while still being able to detect
small amounts of IgG aggregates. The results indicate narrow bore
TSKgel SuperSW3000 columns are an excellent choice for the rapid
separation of proteins and enzymes at micro scale and are a great fit
for the trace analysis of biological components by LC/MS.
Reference
1. Based on work performed by C. Tomasek, H. Moriyama, S. Yamasaki, S. Satoh and
H. Tomizawa (Tosoh Corporation). For a complete report about this study, visit
sigma-aldrich.com/tsk
Featured Products
Description Cat. No.
TSKgel SuperSW3000 Columns, 4 μm
1 mm I.D. x 30 cm 821485
2 mm I.D. x 30 cm 821845
4.6 mm I.D. x 30 cm 818675
TSKgel SuperSW Guard Column, 4 μm
4.6 mm I.D. x 3.5 cm 818762

Reporter 31.1 |6
sigma-aldrich.com/food
Food and Beverage Analysis
Reduce Matrix Background and Improve Overall Analyte Recovery for the Analysis of Pesticides in Beef KidneyKatherine K. Stenerson and Jennifer Claus
The exposure of farm animals to agricultural pesticides continues
to be a major concern among food producers. For example, in the
case of organochlorine pesticides, although their use has been
severely restricted by many countries, they can still be detected at
low levels in some agricultural products.1 Lipophilic pesticides, such
as organochlorine and some pyrethroids, can bioaccumulate in
fatty tissues, thus finding their way into animal products consumed
by the public.
The current methods for extracting pesticides from meat products
require the use of organic solvents, consequently resulting in the
co-extraction of undesired fatty matrix interferences. Cleanup of
samples is then necessary through techniques such as freezing,
liquid-liquid partitioning, solid phase extraction (SPE), gel permeation
chromatography (GPC) or matrix solid phase dispersion (MSPD) prior
to chromatographic analysis.1,2
QuEChERS Cleanup SorbentsIn the past several years, QuEChERS, which stands for Quick, Easy,
Cheap, Effective, Rugged, Safe, has become a very popular method
for the extraction and cleanup of fruit, vegetable and some fatty
matrices prior to pesticide residue analysis.3-5 The extraction step uses
acetonitrile and a salting out effect (with magnesium sulfate). Cleanup
is accomplished using dispersive SPE (dSPE), with sorbents such as:
PSA (primary-secondary amine) – for removal of polar pigments,
sugars and organic acids
Carbon – for removal of chlorophyll and carotenoids
C18 – for removal of lipids and non-polar components
Typically, for reducing fatty matrix, a combination of PSA/C18 is
used.6 A new cleanup sorbent, Z-Sep+, was recently developed for
removal of lipids and pigments. Supel QuE Z-Sep+ is a single material
consisting of zirconia and C18 bonded to the same silica particles.
The zirconia acts as a Lewis acid, attracting compounds with electron
donating groups, such as the -OH in mono and diglycerides, while
the C18 binds fats through hydrophobic interaction.
ExperimentalIn this study, the use of a new sorbent, Supel QuE Z-Sep+
is evaluated and compared to PSA/C18 for removal of fatty
components from the beef kidney matrix prior to pesticide
residue analysis by GC-MS. Lipophilic insecticides and fungicides
common in beef tissues (organochlorines, pyrethroids, diphenyl
fungicides and pesticide synergists) are analyzed in this study.6,7
Extraction and cleanup procedures used in this study are based on
AOAC method 2007.01 and summarized in Table 1.3 Replicates of
both unspiked and spiked kidney extract samples were processed.
Spiked samples were prepared using a 10 μg/mL mixture of lipophilic
pesticides in acetonitrile, spiking at 50 ng/g. Matrix-matched
standards were prepared at 10 ng/mL, 20 ng/mL, 40 ng/mL and
60 ng/mL for each cleanup sorbent. Extracts underwent GC-MS
analysis, and quantitation was performed using a calibration curve
prepared with matrix-matched standards.
Table 1. Extraction and Cleanup Procedures
1. Place 10 g of a homogenized beef kidney sample into a 50 mL centrifuge tube
(Cat. No. 55248-U). Add 50 μL of a 10 μg/mL spike solution if a spiked replicate.
2. Add 25 mL of acetonitrile (Cat. No. 34481) and shake for one minute.
3. Add the contents of an Acetate Extraction Tube (Cat. No. 55234-U) and shake
for one minute.
4. Centrifuge for five minutes.
5. Transfer three mL of the supernatant into the appropriate cleanup tube,
Z-Sep+ (Cat. No. 55296-U) or PSA/C18 (Cat. No. 55229-U).
6. Shake for one minute, then centrifuge for three minutes.
7. Inject the extract directly into the GC-MS for analysis.
Matrix RemovalExtracts were run in full scan mode to compare the backgrounds
remaining before and after cleanup with Z-Sep+ and PSA/C18
(Figure 1). Heavy matrix observed in the uncleaned sample,
consisting primarily of fatty acids, was significantly reduced by
both cleanup sorbents. The large peak eluting around 30 minutes,
identified as cholesterol, was notably reduced by cleanup. In a direct
comparison of the two cleanups, the Z-Sep+ sorbent was found to
remove more background than PSA/C18.
ChromatographyConsistent with the background comparison study, more matrix
remained behind after cleanup with PSA/C18 than Z-Sep+ in the total
ion chromatograms (TICs) of the spiked samples run in SIM mode
(Figure 2). The matrix enhancement effect was more pronounced in
the samples cleaned with PSA/C18, especially for Endosulfan I and II,
4,4’-DDE, piperonyl butoxide, bifenthrin and permethrin.
Pesticide RecoveryAs depicted in Table 2, recoveries for both cleanups fell in the generally
acceptable range of 70-120%.3 Reproducibility is comparable between
both cleanup methods, as shown by the %RSD. Z-Sep+ exhibited
higher average recovery values than PSA/C18 for a majority of the
pesticides, with the exception of diphenylamine and 4,4’-DDE.
ConclusionThe suitability of the new cleanup sorbent, Supel QuE Z-Sep+, has
been successfully demonstrated for cleanup of beef kidney matrix.
It was found to effectively reduce background without significantly
reducing recovery of lipophilic pesticides such as organochlorines
and some pyrethroids. GC-MS full-scan data indicated Z-Sep+ was
found to provide better cleanup in the form of reduced background
than PSA/C18, and less interference in the GC-MS/SIM analysis of the
target pesticides themselves.

7Order: 800-325-3010 (U.S.) 814-359-3441 (Global)
column: SLB-5ms, 20 m x 0.18 mm I.D., 0.36 μm (28576-U)
oven: 70 °C (0.5 min), 25 °C/min to 125 °C, 10 °C/min to 200 °C, 5 °C/min to 300 °C (1 min)
inj. temp: programmed, 60 °C (0.28 min), 600 °C/min to 325 °C (5 min)
detector: MS
carrier gas: helium, 1 mL/min constant
injection: 10 μL, PTV solvent vent, 100 mL/min vent flow at 0.28 min, 5 psi vent pressure
liner: 4 mm I.D. FocusLiner™ with taper
Figure 1. GC-MS full scan chromatograms of beef kidney
extract (a) with no cleanup (b) PSA/C18 cleanup (c) Z-Sep+
cleanup. All are on the same Y-scale.
10 20 30
10 20 30
10 20 30
Min
(a)
(b)
(c)
Conditions same as Figure 1.
Figure 2. TICs of GC-MS/SIM Analysis of Pesticides at
50 ng/g in Beef Kidney Extract, Cleaned Using
(a) Z-Sep+ and (b) PSA/C18.
(a) 1
2
3
4
5
6
7
11
12
1314
109
8
10 20 30
Min
(b)1
2
3
4
5
6
7
11
12
1314
10
98
1. Diphenylamine
2. Hexachlorobenzene
3. γ-BHC
4. Endosulfan I
5. 4,4’-DDE
6. Endosulfan II
7. 4,4’-DDD
8. Endosulfan sulfate
9. 4,4’-DDT
10. Piperonyl Butoxide
11. Bifenthrin
12. Cyhalothrin
13. Permethrin (isomers)
14. Cyfluthrin (isomers)
Table 2. Average Pesticide Recoveries from Beef Kidney Spiked
at 50 ng/g, Average of n=3 with (%RSD)
Z-Sep + PSA/C18
Diphenylamine 70 (1) 81 (1)
Hexachlorobenzene 74 (1) 73 (2)
γ-BHC (lindane) 81 (1) 77 (1)
Endosulfan I 106 (5) 79 (4)
4,4'-DDE 71 (2) 77 (2)
Endosulfan II 108 (6) 73 (5)
4,4'-DDD 91 (3) 78 (1)
Endosulfan Sulfate 98 (4) 67 (4)
4,4'-DDT 83 (4) 74 (2)
Piperonyl Butoxide 91 (5) 86 (2)
Bifenthrin 101 (7) 82 (2)
Cyhalothrin 101 (6) 87 (13)
Permethrin 99 (7) 86 (2)
Cyfluthrin 110 (8) 93 (2)
References
1. M. LeDoux, J. Chromatogr. A, 1218, 1021-1036 (2011).
2. S. Lehotay, K. Mastovska, J. of AOAC International, 88, 630-638 (2005).
3. AOAC Official Method 2007.01, Pesticide Residues in Foods by Acetonitrile
Extraction and Partitioning with Magnesium Sulfate.
4. S. Lehotay, Quick, Easy, Cheap, Effective, Rugged and Safe (QuEChERS) Approach
for the Determination of Pesticide Residues. Proceedings AOAC Annual Meeting,
St. Louis, MO USA, 2004.
5. U. Koesukwiwat, S. Lehotay, K. Mastovska, K. Dorweiler, and N. Leepipatpiboon,
J. of Agricultural and Food Chemistry, 58, 5950-5958 (2010).
6. Pesticide Data Program Annual Summary, Calendar Year 2009, United States
Department of Agriculture, Agricultural Marketing Service, Science and
Technology Programs, May 2011.
7. The Pesticide Manual 13th Edition, C.D.S Tomlin, Ed. (The British Crop Protection
Council, Surrey, UK, 2003).
Featured Products
Description Cat. No.
Supel™ QuE QuEChERS Products
Empty Centrifuge Tube, 50 mL, 50 ea 55248-U
Acetate Extraction Tube, 12 mL, 50 ea 55234-U
Z-Sep+ Cleanup Tube, 12 mL, 50 ea 55296-U
PSA/C18 Cleanup Tube, 12 mL, 50 ea 55229-U
SLB®-5ms Capillary GC Column
20 m x 0.18 mm I.D., 0.36 μm 28576-U
Analytical Solvent
Acetonitrile, for pesticide residue analysis 34481
Related Information
Visit our Food and Beverage/Pesticides resources
sigma-aldrich.com/food-pesticides
Did you know . . .
Supelco’s QuEChERS technical resources and additional
Supel QuE product information can be accessed at
sigma-aldrich.com/quechers

Reporter 31.1 |8
sigma-aldrich.com/food
Food and Beverage Analysis
Rapid Cleanup of Spinach Extracts Using Gravity Elution SPE Prior to Pesticide AnalysisKatherine K. Stenerson and Jennifer Claus
Prior to analysis for pesticide residues, extracts of highly pigmented
foods, such as spinach, require a cleanup step for removal of matrix
materials. Failure to do so can lead to ion suppression in LC-MS,
inlet contamination in GC-MS and column contamination for both
techniques. A dual-layer SPE tube containing graphitized carbon and
aminopropyl on silica (NH2) is often used.
Carbon removes pigments and sterols
NH2 removes fatty acids, polar pigments, organic acids and sugars
Gravity Elution
Sample processing can be done either by applying a vacuum to pull
the sample/solvents through the SPE tube, or by allowing gravity to
pull the sample/solvents through. Gravity elution has the advantage
of allowing more contact time between the extract and the sorbents.
However, vacuum elution is more widely practiced due to limitations
in sorbent particle technology.
Spherical Particles
Current dual-layer SPE tubes contain granular materials. These
materials have variations in particle size and shape, which can lead to
slower flow, and more inconsistency in flow characteristics between
tubes. Fines, which also contribute to flow and consistency issues,
can be formed during manufacture and/or shipping due to the
friable nature of granular materials.
A new dual-layer SPE tube, Supel™ Sphere Carbon/NH2, was
developed that uses spherical materials for both the carbon and
NH2 layers, providing fast, more consistent flows compared to tubes
containing granular material. This allows gravity elution (instead
of vacuum elution) to be applied, resulting in more contact time
between the extract and the sorbents.
In this work, Supel Sphere Carbon/NH2 tubes were compared
to traditional tubes containing granular materials for flow
characteristics, removal of matrix interferences and pesticide
recovery for spinach extracts. The physical difference between
spherical and granular materials is illustrated in Figure 1.
Figure 1. Spherical vs. Granular Materials
Carbon
NH2
Spherical (Supel Sphere) Granular (Traditional)
Experimental
Extraction and cleanup procedures derived from two published
methodologies1,2 are summarized in Table 1. Replicates of unspiked
and spiked (5 ng/g) spinach samples were prepared, and allowed
to sit for one hour prior to extraction. After extraction, extracts were
split for cleanup using a tube containing spherical materials or a
tube containing granular materials. Following cleanup, analysis was
performed by GC-MS/SIM using large volume injection (LVI).
Quantitation was done using matrix-matched standards. The list of
compounds evaluated included organophosphorus, organochlorine,
acidic and hydrophobic pesticides.
Table 1. Extraction and Cleanup Procedures
1. Place 10 g of homogenized spinach (spike added if a spiked replicate) and
10 mL of acetonitrile (Cat. No. 34481) into a 50 mL centrifuge tube (Cat. No.
55248-U), then shake for one minute.
2. Add content of an Acetate Extraction Tube (Cat. No. 55234-U), then shake
for one minute.
3. Centrifuge at 3,200 rpm for five minutes.
4. Transfer the supernatant to a 12 mL tube containing 1 g of anhydrous
magnesium sulfate (Cat. No. 63135).
5. Shake for one minute, then centrifuge at 3,200 rpm for five minutes.
6. Transfer 5 mL of the supernatant to a glass test tube and evaporate to 1 mL
(at 40 °C).
7. Add 250 μL of toluene (Cat. No. 34494).
8. Condition a Supel Sphere Carbon/NH2 Tube (Cat. No. 54283-U) or a
traditional tube with 10 mL of acetonitrile:toluene (75:25).
9. Add sample extract from step 7, start eluent collection immediately.
10. Gravity elute tube with 20 mL of acetonitrile:toluene (75:25) and
collect all eluent.
Flow Characteristics
The average time required for 25 mL of extraction solvent (75:25
acetonitrile:toluene) to be gravity eluted through each tube type
is displayed in Figure 2. The range (slowest and fastest) of the five
replicates is depicted by the vertical lines. Average flow times for the
granular materials were similar, while flow through the Supel Sphere
Carbon/NH2 tubes was 50% faster. In addition, the Supel Sphere tube
exhibited the best flow reproducibility between cartridges.
Figure 2. Average Timed Gravity Elution of 25 mL Solvent (n = 5)
0.00
5.00
10.00
15.00
20.00
25.00
30.00
Min
Flow Comparison Test
Supel Sphere
Carbon/NH2
Competitor A Competitor BSupel Sphere
Carbon/NH2
Competitor A Competitor B

9Order: 800-325-3010 (U.S.) 814-359-3441 (Global)
Removal of Matrix Interference
Full scan GC-MS runs of two extracts after cleanup are shown in
Figure 3. The chromatogram of the extract when a Supel™ Sphere
Carbon/NH2 tube was used is notably cleaner. A cleaner background
will translate to greater sensitivity and less instrument contamination,
leading to longer periods of acceptable GC-MS performance before
system maintenance is required.
Figure 3. Extracts of Spiked Spinach (full scan mode, same Y-axis)
column: SLB-5ms, 20 m x 0.18 mm I.D., 0.36 μm (28576-U)
oven: 70 °C (2 min), 15 °C/min to 325 °C (5 min)
inj. temp.: Programmed, 60 °C (0.28 min), 600 °C/min to 325 °C (5 min)
detector: MS, SIM mode
carrier gas: helium, 1 mL/min constant
injection: 10 μL LVI, PTV solvent vent, rapid injection speed; split vent flow: 100 mL/min (5 psi) until 0.28 min, 60 mL/min at 2.78 min
liner: 4 mm I.D., split/splitless type, single taper FocusLiner™ design (wool packed)
10 20Min
10 20Min
Supel Sphere Carbon/NH2
Competitor
Pesticide Recovery
Table 2 compares average recoveries and %RSD values for three
spiked samples after cleanup using Supel Sphere Carbon/NH2 tubes
and traditional tubes containing granular materials. As shown,
recovery values when Supel Sphere Carbon/NH2 tubes were used
were similar or better for most pesticides. Reproducibility was also
better for most pesticides.
Conclusions
Gravity elution may be preferred to vacuum elution for SPE as it
allows a greater extract-sorbent contact time. When applied to
the cleanup of spinach extracts and compared to traditional tubes
containing granular materials, Supel Sphere Carbon/NH2 SPE tubes
exhibited superior and more consistent flow, removed as much or
more background, and resulted in improved recovery and %RSD
values for most pesticides.
References
1. Multiresidue Method for Agricultural Chemicals by GC/MS (Agricultural Products),
Analytical Methods for Residual Compositional Substances of Agricultural
Chemicals, Feed Additives, and Veterinary Drugs in Food: Syoku-An No. 0124001;
Department of Food Safety, Japanese Ministry of Health, Labour and Welfare:
January 24, 2005.
2. Pesticide Residues in Foods by Acetonitrile Extraction and Partitioning with
Magnesium Sulfate. AOAC Official Method 2007.01.
Table 2. Average % Recovery (%RSD), n=3
Analyte
Supel Sphere Tube
(Spherical Material)
Traditional Tube
(Granular Material)
Trifluralin 81 (2) 78 (3)
α-BHC 83 (1) 75 (10)
Thiometon 81 (5) 75 (3)
Hexachlorobenzene 43 (6) 55 (5)
Simazine 82 (2) 81 (4)
Quintozene 74 (8) 71 (6)
γ-BHC 84 (5) 80 (7)
Tolclofos-methyl 83 (4) 80 (3)
Heptachlor 72 (3) 69 (9)
Malathion 83 (11) 90 (5)
Metolachlor 83 (4) 82 (2)
Chloropyrifos 84 (3) 70 (4)
Endosulfan I 84 (8) 66 (11)
Oxadiazon 79 (3) 83 (3)
Ethion 81 (1) 79 (5)
Triazophos 73 (1) 83 (2)
4,4'-DDT 67 (3) 67 (4)
Phosmet 81 (3) 82 (4)
Methoxychlor 71 (4) 80 (3)
Coumaphos 79 (2) 79 (3)
Cyfluthrin isomer 66 (5) 71 (14)
Cypermethrin isomer 88 (5) 72 (8)
Deltamethrin 76 (7) 63 (36)
Featured Products
Description Cat. No.
Supel Sphere SPE Product
Carbon/NH2 Tube, 6 mL, 30 ea. 54283-U
Supel QuE QuEChERS Products
Acetate Extraction Tube, 12 mL, 50 ea. 55234-U
Empty Centrifuge Tube, 50 mL, 50 ea. 55248-U
SLB®-5ms Capillary GC Column
20 m x 0.18 mm I.D., 0.36 μm 28576-U
Analytical Reagents and Solvents
Anhydrous Magnesium Sulfate (MgSO4), ≥97% 63135
Acetonitrile, for pesticide residue analysis 34481
Toluene, for pesticide residue analysis 34494
Related Products
Description Cat. No.
Supel QuE QuEChERS Products
Citrate Extraction Tube, 12 mL, 50 ea. 55227-U
Citrate/Sodium Bicarbonate Extraction Tube, 12 mL, 50 ea. 55237-U
SLB-5ms Capillary GC Columns
30 m x 0.25 mm I.D., 0.25 μm 28471-U
30 m x 0.25 mm I.D., 0.50 μm 28473-U
20 m x 0.18 mm I.D., 0.18 μm 28564-U
Related Information
Visit our Food and Beverage/Pesticides resources
sigma-aldrich.com/food-pesticides

Reporter 31.1 |10
sigma-aldrich.com/food
1. C4:0 2. C6:0 3. C8:0 4. C10:0 5. C11:0 6. C12:0 7. C13:0 8. C14:0 9. C14:1 10. C15:0 11. C15:1 12. C16:0 13. C16:1 14. C17:0 15. C17:1 16. C18:0 17. C18:1n9c 18. C18:1n9t 19. C18:2n6c
20. C18:2n6t 21. C18:3n6 22. C18:3n3 23. C20:0 24. C20:1n9 25. C20:2 26. C20:3n6 27. C21:0 28. C20:3n3 29. C20:4n6 30. C20:5n3 31. C22:0 32. C22:1n9 33. C22:2 34. C23:0 35. C22:5n3 36. C24:0 37. C22:6n3 38. C24:1n9
Figure 1. C4-C24 FAME Standard
column 1: Omegawax, 30 m x 0.25 mm I.D., 0.25 μm (24136)
column 2: SLB-IL60, 30 m x 0.25 mm I.D., 0.20 μm (29505-U)
oven: 170 °C, 1 °C/min to 225 °C
inj. temp.: 250 °C
carrier gas: helium, 1.2 mL/min
det.: FID, 260 °C
injection: 1 μL, 100:1 split
liner: 4 mm I.D., split/splitless type, single taper wool packed FocusLiner™ design
sample: Supelco 37-Component FAME Mix (47885-U) + C22:5n3, in methylene chloride
10
1
2
34
5
10 20 30 40 50
Min
8
6
7
12
119
15
16
1413
17,18
212019
23
22 262524 292827
31
30 32 33 3435
36
3738
52 min
20
16 17,18
212019
Omegawax
10
1
23 4
5
8
6
7
12
11
9
15
16
1413
2120 19
23
22 26252429
28
27
31
3032 33 34
35
36
3738
36 min
10 20 30
Min
18
17
16
2120 19
18
17SLB-IL60
Ionic Liquid GC Column Option for the Analysis of Omega 3 and Omega 6 Fatty AcidsKatherine K. Stenerson, Michael R. Halpenny, Leonard M. Sidisky
and Michael D. Buchanan
Essential fatty acids are nutrients that must be obtained from the diet
because humans lack the anabolic processes for their synthesis.
Two closely related groups of essential fatty acids are the omega 3
and omega 6 fatty acids. These unsaturated fatty acids contain the
initial double bond located directly after the third (omega 3) or the
sixth (omega 6) carbon atom as measured from the methyl end of
the compound.
Omega 3 and omega 6 fatty acids are typically analyzed using gas
chromatography (GC) after their conversion to fatty acid methyl
esters (FAMEs). Columns described in promulgated methods1,2
contain a stationary phase based on polyethylene glycol (PEG),
and often have ‘wax’ in the name.
In this work, a new ionic liquid GC column, SLB®-IL60, is evaluated
against an Omegawax® column for its suitability for this application.
The SLB-IL60 column has selectivity similar to ‘wax’ columns, but is
different enough to provide a unique elution pattern. It is not based
on a PEG phase. Instead, it has various functional groups that allow
for an increased number of interaction mechanisms compared to a
PEG phase. Specifications for both columns can be found in Table 1.
Table 1. Column Specifications
Omegawax
Phase: Bonded; Poly(ethylene glycol)
Temp. Limits: 50 °C to 280 °C (isothermal or programmed)
SLB-IL60
Phase: Non-bonded; 1,12-Di(tripropylphosphonium)dodecane
bis(trifluoromethylsulfonyl)imide
Temp. Limits: 35 °C to 300 °C (isothermal or programmed)
Experimental
The GC conditions which were used are from the AOAC 991.39 and
AOCS Ce 1i-07 methods. This was possible as both methods share
the same set of run conditions. Two standard mixes were initially
analyzed to gauge elution patterns. An individual FAME was also
analyzed to confirm identification. Overall, the following standards
were used:
1. Supelco® 37-Component FAME Mix
2. PUFA No. 3 (from menhaden oil), diluted in 1 mL of hexane
3. C22:5n3 methyl ester
Food and Beverage Analysis

11Order: 800-325-3010 (U.S.) 814-359-3441 (Global)
C4-C24 FAME Mix
A custom 38-component mix was prepared by the addition of
C22:5n3 FAME to a stock 37-component FAME mix. The resulting
mix was then analyzed on both columns under identical conditions.
Resulting chromatograms are shown in Figure 1. Observations are
that the SLB-IL60 column provides:
An overall faster elution (36 minutes compared to 52 minutes)
Resolution of C18:1n9c (peak 17) and C18:1n9t (peak 18)
Elution of C18:1n9t (peak 18) before C18:1n9c (peak 17)
Elution of C18:2n6t (peak 20) before C18:2n6c (peak 19)
Elution of C20:3n3 (peak 28) before C20:3n6 (peak 26)
Elution of C22:6n3 (peak 37) before C22:5n3 (peak 35) – confirmed
by analysis of an individual C22:5n3 standard
PUFA No. 3 Mix
A qualitative polyunsaturated fatty acid (PUFA) methyl ester standard
(made from menhaden oil) was also analyzed on both columns
under identical conditions. Figure 2 shows both chromatograms. Use
of the SLB-IL60 column resulted in:
An overall faster elution (31 minutes compared to 52 minutes)
Coelution of C20:4n3 and C20:5n3 (peaks 16 and 17)
Elution of C22:6n3 (peak 19) before C22:5n3 (peak 18) – confirmed
by analysis of an individual C22:5n3 standard
Conclusion
Compared to existing ‘wax’ columns, the SLB-IL60 column offers unique
selectivity, some cis/trans resolution, and the faster elution of analytes.
The elution of trans isomers before cis isomers of the same carbon
chain length plus degree and position of unsaturation demonstrates
the analyte-stationary phase mechanism difference of the SLB-IL60.
These differences make the SLB-IL60 a good column choice for the
analysis of omega 3 and omega 6 fatty acid methyl esters.
References
1. AOAC Official Method 991.39, “Fatty Acids in Encapsulated Fish Oils and Fish Oil
Methyl and Ethyl Esters” AOAC International 2003.
2. AOCS Official Method Ce 1i-07, “Determination of Saturated, cis-Monounsatu-
rated, and cis-Polyunsaturated Fatty Acids in Marine and Other Oils Containing
Long Chain Polyunsaturated Fatty Acids (PUFAs) by Capillary GLC” AOCS Official
Methods and Recommended Practices.
Featured Products
Description Cat. No.
GC Columns
Omegawax®, 30 m x 0.25 mm I.D., 0.25 μm 24136
SLB®-IL60, 30 m x 0.25 mm I.D., 0.20 μm 29505-U
Analytical Standards
Supelco® 37-Component FAME Mix, 1 mL
10 mg/mL (total wt.) in methylene chloride
Visit sigma-aldrich.com/fame for composition details.
47885-U
PUFA No. 3 (from menhaden oil), 100 mg
Visit sigma-aldrich.com/fame for composition details.
47085-U
Methyl all-cis-7,10,13,16,19-docosapentaenoate (C22:5n3),
>98.0%, 250 mg
17269
Analytical Solvents
n-Hexane, for pesticide residue analysis 34484
Related Information
Visit our Food and Beverage/Fats resources
sigma-aldrich.com/food-fats
Did you know . . .
Supelco’s ionic liquid GC column web landing page contains detailed
product information, in-depth technical literature, application notes,
plus a bibliography of journal articles featuring ionic liquid columns.
sigma-aldrich.com/il-gc
1. C14:0 2. C16:0 3. C16:1n7 4. C16:2n4 5. C16:3n4 6. C18:0 7. C18:1n9 8. C18:1n7 9. C18:2n6 10. C18:3n4
11. C18:3n3 12. C18:4n3 13. C20:1n9 14. C20:3n3 15. C20:4n6 16. C20:4n3 17. C20:5n3 18. C22:5n3 19. C22:6n3
Figure 2. PUFA No. 3 Standard
column 1: Omegawax, 30 m x 0.25 mm I.D., 0.25 μm (24136)
column 2: SLB-IL60, 30 m x 0.25 mm I.D., 0.20 μm (29505-U)
oven: 170 °C, 1 °C/min to 225 °C
inj. temp.: 250 °C
carrier gas: helium, 1.2 mL/min
det.: FID, 260 °C
injection: 1 μL, 100:1 split
liner: 4 mm I.D., split/splitless type, single taper wool packed FocusLiner™ design
sample: PUFA No. 3 Mix (47085-U), diluted in 1 mL of hexane
10 20 30 40 50
Min
1
2
3
4
6
7
8
9
10
11
12
13 1415
16
17
18
19
5
10 20 30
Min
1 2 3
4
5
6
7
8
9
10
11
12
1314
15
17, 16
19
18
52 min
31 min
Omegawax
SLB-IL60

Reporter 31.1 |12
sigma-aldrich.com/bioanalysis
Clinical/Bioanalytical
Investigating Matrix Interference in Analysis of Antiarrhythmic Cardiac Drugs in PlasmaCraig Aurand
For efficient therapeutic drug monitoring, it is important for clinicians
to have access to fast and robust analytical methods for accurate
assessment of drug efficacy. Industrial trends toward highly specific
LC/MS applications over traditional immunoassay have resulted in the
need for high-speed chromatographic assays along with simplified
sample preparation methods. Often the limitation of a bioanalytical
technique is based upon the effectiveness of the sample preparation
technique. Plasma and serum samples are often susceptible to assay
irregularities due to matrix-induced interferences. In this study the
impact of matrix interference is investigated with respect to precision
and accuracy of antiarrhythmic cardiac drugs from plasma samples.
Therapeutic Drug Monitoring of Antiarrhythmic Drugs
The focus of the study reported here was to develop a bioanalytical
assay for antiarrhythmic cardiac drugs and associated metabolites from
plasma samples. The goal was to develop a robust analytical technique
that facilitates high throughput application with simplified sample
processing. Figure 1 shows the structures of the antiarrhythmic drugs
evaluated in this study. The utility of these antiarrhythmic drugs vary:
lidocaine is used for ventricular arrhythmias, flecainide is administered
for tachyarrhythmia, while amiodarone is utilized in both ventricular
and atrial cardiac dysrhythmias.1 Having an analytical method capable
of analyzing a range of antiarrhythmic agents allows for simplified
analysis while increasing the services the testing laboratory can offer.
This not only pertains to LC/MS analysis, but also to sample collection
and sample preparation.
Figure 1. Structures of Antiarrhythmic Compounds
Analytical Approach
The first part of the study focused on the chromatographic
conditions for resolution of lidocaine, flecainide, amiodarone and
the associated metabolite, desethylamiodarone. The basic nature of
these antiarrhythmic agents makes them ideal candidates for HILIC
(hydrophilic interaction) chromatographic separation. The benefit
of HILIC over traditional reversed-phase chromatography is two-
fold for both sample introduction and analyte detection.2 First, the
high acetonitrile concentration of HILIC mobile phases allows for
direct analysis of precipitated plasma samples without the need for
additional sample solvent exchange. Second, the high acetonitrile
content provides increased analyte response in positive ESI MS
detection. Of the various HILIC-mode columns tested, method
development for this assay determined the Ascentis® Express HILIC,
2.7 μm particles, provided the best chromatographic resolution of
the antiarrhythmic drugs while maintaining high peak efficiency for
enhanced detection levels.
Once the chromatographic and LC/MS conditions had been optimized,
the second part of this study was to evaluate the effectiveness of
sample preparation and the impact of sample matrix on the assay.
Often when dealing with plasma samples, endogenous matrix such
as phospholipids can cause irreproducibility in quantitation due to
ionization-suppression effects. Coelution of endogenous matrix with
target analytes can result an arbitrary decrease in the response of
target analytes, thus decreasing the overall accuracy of the method.3
The determination of matrix interference is a critical aspect in any
bioanalytical method development. In this case, a standard protein
precipitation method was compared with hybrid zirconia coated silica
particles in 96-well SPE format for processing the plasma samples prior
to LC/MS analysis.
Experimental
Standard Solutions
Standard solutions were prepared from a stock standard in (3:1)
1% formic acid acetonitrile:water at a level of 10, 50, 100, 200 and
300 ng/mL.
Preparation and Extraction of Plasma Samples
Rat plasma stabilized with K2EDTA was acquired from Lampire
Biological Laboratories (Pipersville Pa). Plasma was spiked directly
from stock standard to a level of 400 ng/mL of each analyte.
Concentration of final sample work up in both techniques is
equivalent to 100 ng/mL.
Standard protein precipitation method: Apply 100 μL of spiked
plasma to centrifuge vial, followed by 300 μL of 1% formic acid
in acetonitrile. Agitate via vortex for two minutes, place vial
in centrifuge and spin at 15,000 rpm for 2.5 minutes. Collect
supernatant and analyze directly.
HybridSPE®-Phospholipid 96-well method: Apply 100 μL of spiked
plasma to the well, followed by 300 μL of 1% formic acid in
acetonitrile. Agitate via vortex for four minutes, place on vacuum
manifold and apply 10" Hg vacuum for four minutes. Collect filtrate
and analyze directly.

13Order: 800-325-3010 (U.S.) 814-359-3441 (Global)
Results
Figure 2 shows the chromatographic resolution of the antiarrhythmic
drugs on the Ascentis Express HILIC. Analysis was conducted on
a time of flight (TOF) LC/MS and demonstrated a linear analyte
response across the concentration range as shown in Figure 3.
Figure 2. LC/MS Analysis of Antiarrhythmic Drugs and
Metabolite on Ascentis Express HILIC
LC-MS system: Agilent 1290, 6210 TOF
column: Ascentis Express HILIC, 10 cm x 2.1 mm I.D., 2.7 μm (53939-U)
mobile phase: (A) 5 mM ammonium formate; (B) 5 mM ammonium formate in acetonitrile, 5:95 (A:B), adjusted to pH 7.0 with formic acid
flow rate: 0.4 mL/min
pressure: 90 bar
column temp.: 35 °C
detection: ESI+, 100-1000 m/z
sample: each compound, 300 ng/mL in 75:25 (1% formic acid acetonitrile:water)
injection: 0.5 μL
1 2 3 4 5
Min
1.0
26
2.0
22
2.6
20
3.4
67
tR (min) Analyte
1.02 Lidocaine
2.02 Amiodarone
2.62 Desethylamiodarone
3.46 Flecainide
Figure 3. Antiarrhythmic Drugs Calibration Curve
Conditions same as Figure 2.
R² = 0.9983
R² = 0.9981
R² = 0.9987
R² = 0.9936
0 50 100 150 200 250 300 350
Pe
ak
are
a
conc. (ng/mL)
Amiodarone
Desmethylamiodarone
Flecainide
Lidocaine
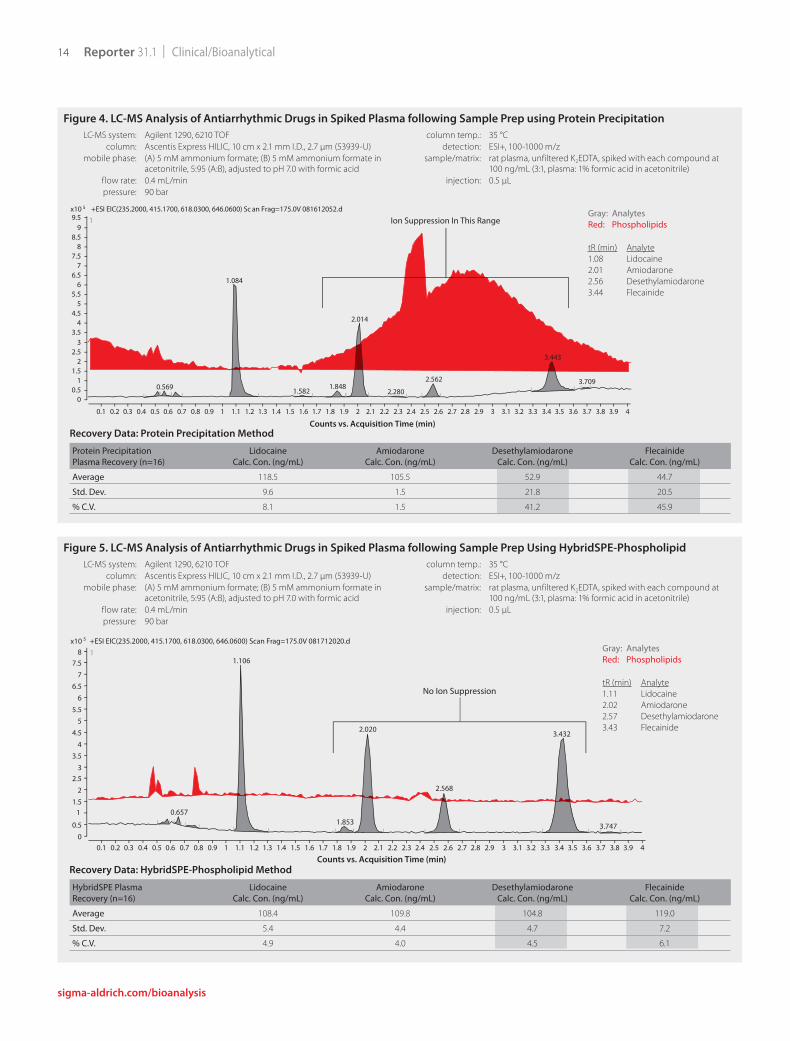
Using the standard protein precipitation technique, matrix
interference was observed with the overlap of endogenous
phospholipids and the target analytes. As shown in Figure 4, the
elution region of amiodarone, desethylamiodarone and flecainide
overlaps with the elution of the endogenous phospholipids.
This raises the issue as an area of concern for possible detection
irregularities. As observed in the matrix trace, phospholipids are
carried over from previous sample injections causing real concern of
method reproducibility. When analyte levels were calculated against
the calibration curve, the concentration of desethylamiodarone
and flecainide were substantially lower than the spiked levels.
Significant ion suppression was observed due to the endogenous
phospholipids in the plasma samples. The coefficient of variation
(% C.V.) value was extremely high for both desethylamiodarone and
flecainide further confirming the concern of matrix interference.
To validate the decreased detected levels of desethylamiodarone and
flecainide were due to phospholipid ion suppression, plasma samples
were processed using the HybridSPE-Phospholipid 96-well plate. This
technology utilizes hybrid zirconia coated silica particles to facilitate
the selective extraction of phospholipids from biological samples
via Lewis acid/base interaction between the phosphate moiety of
the phospholipids and the zirconia surface. This interaction is highly
selective toward the isolation of phospholipids while remaining
non-selective towards target analytes. Sample processing using
the HybridSPE-Phospholipid consists of the addition of formic acid
acetonitrile to the plasma samples, followed by mixing and filtration
by applying vacuum to the 96-well plate. This technique allows for
direct depletion of sample proteins and phospholipids resulting in
a simplified and effective sample preparation. Samples processed
using the HybridSPE-Phospholipid technique were depleted of
phospholipid matrix with no additional sample processing.
Figure 5 shows the analyte and phospholipid trace of plasma
samples processed using the HybridSPE-Phospholipid technique.
Notice the increased peak response of both desethylamiodarone
and flecainide as compared to samples processed using the standard
protein precipitation technique. The calculated levels were consistent
with the spiked levels. There was no phospholipid matrix observed
in the HybridSPE-Phospholipid processed samples, confirming
the reduced response of desethylamiodarone and flecainide in
the standard protein precipitation technique was a result of the
endogenous phospholipids. The consistency in the calculated levels
of all three antiarrhythmic agents and metabolite with the spiked
level coupled with low CV values verifies the precision and accuracy
of the HybridSPE-Phospholipid sample preparation.
Conclusions
Endogenous phospholipids can dramatically impact the precision
and accuracy of a bioanalytical method. During development, the
impact of sample matrix on analyte detection should be a priority
in method validation. Failure to do so can result in inaccuracies in
reported levels, thus impacting the assessment of patient health.
Eliminating matrix effects in LC/MS is imperative to producing
reliable and accurate bioanalytical methods. The targeted
phospholipid selectivity of the HybridSPE-Phospholipid technique
enables simplified sample processing with no phospholipid matrix
interference, while exhibiting excellent recovery from plasma and
serum samples. This application demonstrates how selectivity in
both sample preparation and chromatographic separation allows
for a simplified and efficient bioanalytical method resulting in a
highly precise and accurate assay. The fast HILIC chromatography
on Ascentis Express paired with the selective sample preparation
of HybridSPE-Phospholipid, LC-MS Ultra CHROMASOLV® solvents
and Cerilliant® Certified Reference Materials resulted in a robust and
precise bioanalytical method.
(continued on next page)
Reporter 31.1 |14 Clinical/Bioanalytical
sigma-aldrich.com/bioanalysis
Figure 4. LC-MS Analysis of Antiarrhythmic Drugs in Spiked Plasma following Sample Prep using Protein Precipitation
5x10
0
0.5
1
1.5
2
2.5
3
3.5
4
4.5
5
5.5
6
6.5
7
7.5
8
8.5
9
9.5+ESI EIC(235.2000, 415.1700, 618.0300, 646.0600) Sc an Frag=175.0V 081612052.d
1.084
2.014
3.443
2.562 3.7091.8480.569
1.582 2.280
1
Counts vs. Acquisition Time (min)
0.1 0.2 0.3 0.4 0.5 0.6 0.7 0.8 0.9 1 1.1 1.2 1.3 1.4 1.5 1.6 1.7 1.8 1.9 2 2.1 2.2 2.3 2.4 2.5 2.6 2.7 2.8 2.9 3 3.1 3.2 3.3 3.4 3.5 3.6 3.7 3.8 3.9 4
Ion Suppression In This Range
LC-MS system: Agilent 1290, 6210 TOF
column: Ascentis Express HILIC, 10 cm x 2.1 mm I.D., 2.7 μm (53939-U)
mobile phase: (A) 5 mM ammonium formate; (B) 5 mM ammonium formate in acetonitrile, 5:95 (A:B), adjusted to pH 7.0 with formic acid
flow rate: 0.4 mL/min
pressure: 90 bar
column temp.: 35 °C
detection: ESI+, 100-1000 m/z
sample/matrix: rat plasma, unfiltered K2EDTA, spiked with each compound at 100 ng/mL (3:1, plasma: 1% formic acid in acetonitrile)
injection: 0.5 μL
tR (min) Analyte
1.08 Lidocaine
2.01 Amiodarone
2.56 Desethylamiodarone
3.44 Flecainide
Gray: Analytes
Red: Phospholipids
Recovery Data: Protein Precipitation Method
Protein Precipitation
Plasma Recovery (n=16)
Lidocaine
Calc. Con. (ng/mL)
Amiodarone
Calc. Con. (ng/mL)
Desethylamiodarone
Calc. Con. (ng/mL)
Flecainide
Calc. Con. (ng/mL)
Average 118.5 105.5 52.9 44.7
Std. Dev. 9.6 1.5 21.8 20.5
% C.V. 8.1 1.5 41.2 45.9
Figure 5. LC-MS Analysis of Antiarrhythmic Drugs in Spiked Plasma following Sample Prep Using HybridSPE-Phospholipid
5x10
0
0.5
1.5
1
2
2.5
3
3.5
4
4.5
5
5.5
6
6.5
7
7.5
8
+ESI EIC(235.2000, 415.1700, 618.0300, 646.0600) Scan Frag=175.0V 081712020.d
1.106
2.0203.432
2.568
0.657
1.8533.747
1
0.1 0.2 0.3 0.4 0.5 0.6 0.7 0.8 0.9 1 1.1 1.2 1.3 1.4 1.5 1.6 1.7 1.8 1.9 2 2.1 2.2 2.3 2.4 2.5 2.6 2.7 2.8 2.9 3 3.1 3.2 3.3 3.4 3.5 3.6 3.7 3.8 3.9 4
Counts vs. Acquisition Time (min)
No Ion Suppression
LC-MS system: Agilent 1290, 6210 TOF
column: Ascentis Express HILIC, 10 cm x 2.1 mm I.D., 2.7 μm (53939-U)
mobile phase: (A) 5 mM ammonium formate; (B) 5 mM ammonium formate in acetonitrile, 5:95 (A:B), adjusted to pH 7.0 with formic acid
flow rate: 0.4 mL/min
pressure: 90 bar
column temp.: 35 °C
detection: ESI+, 100-1000 m/z
sample/matrix: rat plasma, unfiltered K2EDTA, spiked with each compound at 100 ng/mL (3:1, plasma: 1% formic acid in acetonitrile)
injection: 0.5 μL
tR (min) Analyte
1.11 Lidocaine
2.02 Amiodarone
2.57 Desethylamiodarone
3.43 Flecainide
Gray: Analytes
Red: Phospholipids
Recovery Data: HybridSPE-Phospholipid Method
HybridSPE Plasma
Recovery (n=16)
Lidocaine
Calc. Con. (ng/mL)
Amiodarone
Calc. Con. (ng/mL)
Desethylamiodarone
Calc. Con. (ng/mL)
Flecainide
Calc. Con. (ng/mL)
Average 108.4 109.8 104.8 119.0
Std. Dev. 5.4 4.4 4.7 7.2
% C.V. 4.9 4.0 4.5 6.1

15Order: 800-325-3010 (U.S.) 814-359-3441 (Global)
References
1. American Heart Association, Medications for Arrhythmia.
http://www.heart.org (accessed Nov. 26, 2012).
2. Ascentis Express HILIC Guide. Faster Analysis of Polar Compounds. 2012.
Sigma-Aldrich Literature Code OMI.
3. Aurand, C. Understanding, Visualizing, and Reducing the Impact of Phospholip-
id-Induced Ion Suppression in LC-MS. Supelco Reporter, 2012, 30.2, 10-12.
Featured Products
Description Cat. No.
Ascentis Express HILIC, 10 cm x 2.1 mm I.D., 2.7 μm particles 53939-U
HybridSPE-Phospholipid 96-well Plate, bed wt. 50 mg,
volume 2 mL
575656-U
Acetonitrile, LC-MS Ultra CHROMASOLV, tested for
UHPLC-MS, 1 L, 2 L
14261
Water, LC-MS Ultra CHROMASOLV, tested for UHPLC-MS,
1 L, 2 L
14263
Formic acid, LC-MS Ultra eluent additive, 1 mL, 2 mL 14265
Ammonium formate, LC-MS Ultra eluent additive, 25 g 14266
Description Cat. No.
Cerilliant® Certified Reference Materials*
Amiodarone HCl, 1.0 mg/mL (as free base) in methanol,
1 mL ampule
A-060
Amiodarone-D4 HCl, 100 μg/mL (as free base) in methanol,
1 mL ampule
A-082
N-Desethylamiodarone HCl, 1.0 mg/mL (as free base) in
methanol, 1 mL ampule
D-055
N-Desethylamiodarone-D4 HCl, 100 μg/mL (as free base) in
methanol, 1 mL ampule
D-056
(±)-Flecainide, 1.0 mg/mL in methanol, 1 mL ampule F-017
Lidocaine, 1.0 mg/mL in methanol, 1 mL ampule L-018
Our complete offering of solvents, reagents, columns, sample prep and other consumables to maximize speed and sensitivity in bioanalysis can be found at sigma-aldrich.com/bioanalysis.
*Standards from Cerilliant, a Sigma-Aldrich Company, can be ordered from cerilliant.com
Quality Exceeding your Expectations
LC-MS Ultra Solvents and Additives Designed for UHPLC
UHPLC-MS/TOF
For more information, request the LC-MS Ultra CHROMASOLV
Solvents and Additives Brochure (OUX) or visit
sigma-aldrich.com/uhplc
20% Off HPLC Accessories
Specify promo code SBV when you order. Offer expires
March 29, 2013. Not valid in Japan. Discount is percent
off list price.
For more information, visit
sigma-aldrich.com/hplc-accessories
Maximize System Performance with
Easy-to-Use HPLC Accessories

Reporter 31.1 |16
sigma-aldrich.com/bioanalysis
Clinical/Bioanalytical
Improvement in LC-MS/MS Analysis of Vitamin D Metabolites in Serum by Leveraging Column Selectivity and Effective Sample PrepCraig R. Aurand
Clinical interest in vitamin D stems from its implications in an
ever-widening range of human health conditions.1 This heightened
interest has spawned the need for analytical strategies to assess an
individual’s vitamin D status. Because LC-MS/MS has overcome many
of the limitations of traditional immunoassay (e.g. cross-reactivity,
matrix interferences), it is becoming more and more the analytical
method of choice for certain clinical assays, including vitamin D.
To maximize the effectiveness of LC-MS/MS experiments, it is
important to consider factors that reduce measurement sensitivity
and accuracy, restrict throughput and cause instrument downtime.
This brief report presents a rapid and sensitive LC-MS/MS method for
accurate determination of 25-hydroxyvitamin D2, 25-hydroxyvitamin
D3, and 3-epi-25-hydroxyvitamin D3 in serum.
Importance of Resolving Vitamin D Homologs
The metabolic pathways of vitamin D2 (ergocalciferol) and vitamin D3
(cholecalciferol) involve many compounds with varying degrees of
biological activity and clinical interest. Chromatographic resolution
of the various homologs of vitamin D2 is necessary for accurate
quantitation, especially considering several key metabolites
are isobaric and not distinguishable by MS alone. For example,
separation of the active 25-hydroxyvitamin D3 from the 3-epi-25-
hydroxyvitamin D3, whose biological role is currently unclear, may
provide more accurate information for treatment and prevention.2
The aim of this study was to identify an HPLC stationary phase that
would resolve vitamin D homologs, especially isobars, with short
analysis time and high efficiency.
Sample Prep to Remove Interferences and
Enhance MS Sensitivity
The hydrophobic character of vitamin D and its metabolites requires
mobile phases with high concentrations of organic modifier,
conditions that also elute endogenous interferences such as
phospholipids. This phospholipid coelution causes ion suppression
and/or enhancement in the MS instrument that reduces sensitivity
and accuracy.3 Additionally, serum phospholipids and proteins foul
HPLC and UHPLC columns and can cause instrument downtime. It is
therefore important to remove them prior to analysis. In this study,
commonly used protein precipitation and solid phase extraction
methods were compared in terms of their ability to remove these
interferences and improve detection accuracy.
Materials and Methods
HPLC: Ascentis® Express F5, 10 cm x 2.1 mm I.D., 2.7 μm (Cat. No.
53569-U)
Sample Prep Device: HybridSPE®-Phospholipid, 96-well plates,
50 mg/well (Cat. No. 575656-U)
Solvents and Additives (for sample prep and chromatography):
LC-MS Ultra CHROMASOLV® water (Cat. No.14263), methanol
(Fluka, 14262) and ammonium formate (Cat. No. 14266)
Standards: 25-Hydroxyvitamin D3 (Cat. No. H-083),
1α,25-Dihydroxyvitamin D2 (Cat. No. H-090); 3-epi-25-
Hydroxyvitamin D3 (Cat. No. 705993)
Protein Precipitation Method: Apply 100 μL of plasma to
centrifuge vial followed by 300 μL of 1% formic acid in acetonitrile.
Agitate via vortex for two minutes. Centrifuge 2.5 minutes at
15,000 rpm. Collect supernatant and analyze directly.
HybridSPE®-Phospholipid 96-Well Method: Apply 100 μL of
spiked plasma to the well, followed by 300 μL of 1% formic acid in
acetonitrile. Agitate via vortex for four minutes, place on vacuum
manifold and apply 10" Hg vacuum for four minutes. Collect filtrate
and analyze directly.
Results
A pentafluorophenyl HPLC phase (Ascentis Express F5) was chosen
because of its ability to rapidly resolve the vitamin D homologs tested,
especially the 25-hydroxyvitamin D3 and the 3-epi-25-hydroxyvitamin
D3 (Figure 1) that coelute on C18 stationary phases. Figure 2 shows
the separation of 25-hydroxyvitamin D2, 25-hydroxyvitamin D3 and
3-epi-25-hydroxyvitamin D3 on the Ascentis Express F5 column. Note
that the coelution of 25-hydroxyvitamin D2 and 3-epi-25-
hydroxyvitamin D3 is not an issue because they are resolved by
the mass spec. Figure 3 shows the phospholipid monitoring
chromatograms of coextracted matrix from standard protein
precipitation and using the HybridSPE-Phospholipid technique.
Comparing the sample prep methods, the simple and straight-forward
HybridSPE-Phospholipid method was found to be far superior to
standard protein precipitation. HybridSPE-Phospholipid selectively
depleted the phospholipid matrix and precipitated proteins, providing
no interference from the serum matrix. In contrast, the protein
precipitation technique contained a large amount of coextracted
phospholipid matrix resulting in interference that eluted in the
retention range of 25-hydroxyvitamin D2, 25-hydroxyvitamin D3, and
3-epi-25-hydroxyvitamin D3. This coelution reduces sensitivity and
reproducibility, resulting in irregularities in quantitation as confirmed
by the recovery and reproducibility data reported in Table 1.
Table 1. Sample Prep Analyte Recovery Comparison
25-OH Vitamin D3
3-epi-25-OH Vitamin D3
25-OH Vitamin D2
HybridSPE-Phospholipid Method
% Recovery 70.4 65.6 55.8
% Std. Dev. 8.2 5.8 12.1
Protein Precipitation Method
% Recovery 53.0 55.7 33.9
% Std. Dev. 12.1 7.9 118.6

17Order: 800-325-3010 (U.S.) 814-359-3441 (Global)
Figure 1. HPLC Separation of 25-Hydroxyvitamin D2 and
25-Hydroxyvitamin D3 on Ascentis Express F5
column: Ascentis® Express F5, 10 cm x 2.1 mm I.D., 2.7 μm (53569-U)
mobile phase: (A) 5 mM ammonium formate; (B) 5 mM ammonium formate in methanol; (25:75, A:B)
flow rate: 0.4 mL/min
column temp.: 40 °C
detector: ESI(+), m/z 100-1000
injection: 1 μL, each compound 20 μg/mL in methanol
0 2 4
Min
1
2 1. 25-OH Vitamin D3
2. 25-OH Vitamin D2
Figure 2. HPLC Separation of 25-Dihydroxyvitamin D2,
25-Hydroxyvitamin D3, and 3-epi-25-Hydroxyvitamin D3
on Ascentis Express F5
Conditions same as in Figure 1.
0 2 4 6
Min
1
2
3 1. 25-DiOH Vitamin D2
2. 25-OH Vitamin D3
3. 3-epi-25-OH Vitamin D3 and 25-OH Vitamin D2
Figure 3. Serum Extracted Using HybridSPE-Phospholipid or
Protein Precipitation
Conditions same as in Figure 1 except:
phospholipid monitoring (m/z): lysophosphatidylcholines, 496.3, 524.3 m/z; glycerophosphocholines, 758.5, 786.5, 806.5, 810.5 m/z
0 2 4
Min
Red: HybridSPE-Phospholipid Method
Black: protein precipitation Method
No Phospholipids in HybridSPE-Phospholipid Method
Conclusion
Chromatographic resolution of analytes still plays an important
role in LC/MS applications; especially when dealing with isobaric
compounds. The unique selectivity of the Ascentis Express
F5 provided a fast and efficient method for the analysis of
25-hydroxyvitamin D and homologs from serum samples. The
selective phospholipid depletion of the HybridSPE-Phospholipid
method enabled an efficient sample cleanup increasing method
reproducibility and accuracy. This approach demonstrates how
selectivity, in both chromatographic and sample preparation, allows
for efficient analysis that would otherwise be unattainable with
traditional reversed-phase approaches. The combination of this
novel sample prep technique along with the unique selectivity of
the Ascentis Express F5 enables a fast and simplified bioanalytical
method for associated vitamin D metabolites. For further reading and
details of this method, please see reference 2.
References
1. Wang, S. Epidemiology of vitamin D in health and disease. Nutr. Res. Rev., 2009.
22(2), 188–203.
2. Aurand, Craig R.; Bell, David S.; Wright, Michael. Highly selective isolation and
separation of 25-hydroxyvitamin D and 3-epi-25-hydroxyvitamin D metabolites
from serum. Bioanalysis, 2012, 4(22), 2681–2691.
3. Aurand, C. Understanding, Visualizing, and Reducing the Impact of Phospholip-
id-Induced Ion Suppression in LC-MS. Supelco Reporter, 2012, 30.2, 10-12.
Featured Products
Description Cat. No.
Ascentis Express F5, 10 cm x 2.1 mm I.D., 2.7 μm 53569-U
Guard cartridge for Ascentis Express F5, 2.1 mm I.D., 2.7 μm, pk. of 3 53594-U
Universal Guard Holder 53500-U
HybridSPE-Phospholipid 96-well Plate, bed wt. 50 mg, volume 2 mL 575656-U
Methanol, LC-MS Ultra CHROMASOLV, tested for UHPLC-MS, 1 L, 2 L 14262
Acetonitrile, LC-MS Ultra CHROMASOLV, tested for UHPLC-MS,
1 L, 2 L
14261
Water, LC-MS Ultra CHROMASOLV, tested for UHPLC-MS, 1 L, 2 L 14263
Ammonium formate, LC-MS Ultra eluent additive, 25 g 14266
3-epi-25-Hydroxyvitamin D3, 1 mg (neat) 705993
Cerilliant® Certified Reference Materials*
25-Hydroxyvitamin D2, 50 μg/mL in ethanol, 1 mL/ampoule H-073
25-Hydroxyvitamin D3, 100 μg/mL in ethanol, 1 mL/ampoule H-083
d6-25-Hydroxyvitamin D3 (26,26,26,27,27,27-d6), 50 μg/mL in
ethanol, 1 mL/ampoule
H-074
25-Hydroxyvitamin D2, 5 μg/mL in ethanol, 1 mL/ampoule H-087
25-Hydroxyvitamin D3, 5 μg/mL in ethanol, 1 mL/ampoule H-086
1α,25-Dihydroxyvitamin D2, 5 μg/mL in ethanol, 1 mL/ampoule H-090
1α,25-Dihydroxyvitamin D3, 5 μg/mL in ethanol, 1 mL/ampoule H-089
Vitamin D2 (Ergocalciferol), 1.0 mg/mL in ethanol, 1 mL/ampoule V-024
d3-Vitamin D2 (6,19,19-d3), 100 μg/mL in ethanol, 1 mL/ampoule V-026
Vitamin D3 (Cholecalciferol), 1.0 mg/mL in ethanol, 1 mL/ampoule V-025
Our complete offering of solvents, reagents, columns, sample prep and other consumables to maximize speed and sensitivity in bioanalysis can be found at sigma-aldrich.com/bioanalysis.
*Standards from Cerilliant, a Sigma-Aldrich Company, can be ordered from cerilliant.com

Reporter 31.1 |18 Environmental
sigma-aldrich.com/radiello
radiello™ Passive Sampler as a Tool for the Measurement of Atmospheric Ammonia Concentrations and Dry Deposition
Kristen Schultz
Introduction
The National Atmospheric Deposition Program (NADP) launched
the Ammonia Monitoring Network (AMoN) in 2010 but first piloted
a passive sampling program beginning in 2007 with 16 test sites,
experimenting with different types of passive sampling devices. Illinois
Water Survey (IWS) operates as the Central Analytical Laboratory (CAL)
for NADP’s AMoN and deploys and analyzes the ammonia test samples
and reports the analytical data back to the NADP.
Ammonia is emitted by many sources, including very important
agricultural sources of fertilizer application and meat production.
NADP’S AMoN provides useful information to the agricultural
community to assess the fate and transport of ammonia in the
atmosphere. Their goal is to measure atmospheric ammonia
concentrations and estimate dry deposition over North America.
The network uses the low-cost, passive diffusion sampler, radiello,
deployed every two weeks to 54 locations (Figure 1) providing an
integrated and quality assured measurement of ammonia in air.
Figure 1. NADP Ammonia Monitoring Network (AMoN)
���
�
�
�
���
�
�
�
�
�
�
�
� ��
�
✩�
�
� �
�
�
✩ ✩
�
��
�✩✩
✩
��
��
��
���
�
✩
��
�
��
�
�
�
�
�
�
Network Monitoring Locations
� Active sites
✩ Inactive sites
Site status as of May 2011
Pending sites�
radiello Ammonia Adsorbing Cartridge
The cartridge adsorbent (RAD168) is made of microporous
polyethylene material and impregnated with phosphoric acid.
Ammonia is adsorbed as ammonium ion. Airborne ammonium
salts dispersed as particulate matter do not cross the diffusive
membrane of radiello.
Ammonium ion is quantified by visible spectrometry as indophenol:
at basic buffered pH ammonium ion reacts with phenol and sodium
hypochlorite, with pentacyanonitrosylferrate catalysis (in the following
cyanoferrate), to form indophenol. The reaction product is intensely
colored in blue, and its absorbance measured at 635 nm. (Figure 2).
Figure 2. Reaction of Ammonia on Adsorbent Cartridge
OH++ NH3 ONaNONaClO
Na2Fe(CN)5 NO.2H2O
(cyanoferrate)
indophenol
Field Deployment of radiello Samplers
The sampler shelter (design available from Central Analytical
Laboratory) consists of an inverted plastic shelter permanently
fastened to an aluminum u-channel mounting bracket (Figure 3).
The shelter is erected such that the lower edge is two meters (80
inches) above surrounding surfaces. Triplicate radiello ammonia
samplers are mounted within the shelter (Figure 4). Samplers are
not mounted near plumbing stacks, chimneys, vents, exhausts or other
possible sources of direct ammonia emissions.
bracket
shelter
hose clamps
metal post
2 metersabove
ground
Figure 3. Shelter Schematic
Figure 4. Installation of
radiello Cartridges in Shelter
Contributed Article
The following was generated with the assistance of an outside source using
Sigma-Aldrich® products. Content was provided from the public information
published on the Ammonia Monitoring Network website.
http://nadp.isws.illinois.edu

19Order: 800-325-3010 (U.S.) 814-359-3441 (Global)
The vertical arm of the aluminum bracket can be fastened to a metal
fence post. Alternatively, the shelter can be mounted on a suitable
wooden post or pole by using screws (or small lag bolts) driven
through the predrilled holes in the lower part of the bracket.
Laboratory Methods
The radiello ammonia samplers are returned back to the Central
Analytical Laboratory and analyzed. The cartridges are removed and
the ammonia (as NH4+) is removed by sonication in deionized water,
using Flow Injection Analysis (FIA).
Suitability of radiello for Ammonia Concentration
Measurements
The NADP selected radiello samplers for the ease of use and
deployment (no sampling pump or calibration requirement) and
the quality of data. In order to ensure the radiello samplers perform
according to the AMoN criteria, it is compared against a denuder
reference method at the Illinois field site. A denuder differs from
radiello in that it is an active sampling method requiring a sampling
pump. The denuder is comprised of coated glass sampler. Below
is a plot comparing the data for radiello vs. denuder for ammonia
measurements (Figure 5).
Figure 5. Comparison of radiello and Denuder Measurements
at Champaign County, Illinois
Q1 Q2 Q3 Q4 Q1 Q2 Q3 Q4 Q1 Q2
0.00.20.40.60.81.01.21.41.61.82.02.22.42.62.83.03.23.43.63.84.04.24.44.64.8
Am
mo
nia
Co
nce
ntr
ati
on
, μg
/m3
Denuder
Radiello
2010–2012
Conclusion
The radiello ammonia sampler impregnated with phosphoric
acid represents a low-cost, reliable and simple tool for assessing
the atmospheric deposition of ammonia at parts per billion (ppb)
concentration levels.
Reference
1. National Atmospheric Deposition Program (NADP) Ammonia Gas Monitoring
Network Factsheet (AMoN), Rev 4/29/11 http://nadp.isws.illinois.edu/amon/
AMoNfactsheet.pdf
Featured Products
Description Qty. Cat. No.
Cartridge Adsorbent - Ammonia 20 RAD168
Diffusive Body - White 20 RAD120
radiello Accessories
Triangle Support Plate 20 RAD121
radiello Clips 20 RAD195
Bar Code Labels 198 RAD190
Related Information
For more information on the NADP AMoN network
or to participate in the program, contact:
Christopher M.B. Lehmann, Ph.D.
Director, Central Analytical Laboratory
National Atmospheric Deposition Program
Illinois State Water Survey; Prairie Research Institute
University of Illinois at Urbana-Champaign
2204 Griffith Dr., Champaign, IL 61820-7495
Phone: (217) 265-8512, Fax: (217) 333-0249
Email: [email protected]
http://nadp.isws.illinois.edu
25% Off Certified Low Adsorption VialsSupelco’s Certified Low Adsorption, Center Drain™ (CD™), MRQ30, and QsertVial™ products
offer the benefit of maximum sample extraction without the worry of trace analytes being
adsorbed by the vial surface.
Specify promo code Z01 when you order. Offer expires June 28, 2013. Not valid in China,
Japan, Argentina, Brazil and India.
For more information, visit
sigma-aldrich.com/lavials

Reporter 31.1 |20 Environmental
sigma-aldrich.com/air-monitoring
Figure 1. TDS3 Container with Carbotrap 300 Glass-Fritted TD Tube
The clear body of the TDS3 container is shorter than the actual tube (as shown), so the
septa seals on the end of the thermal desorption tube, creating an air-tight seal.
Results
Percent recoveries in Table 1 were calculated by comparing peak
areas for the desorbed analytes to those for calibration standards
spiked onto the Carbotrap 300 tubes in the same manner on the
day of analysis. Values shown are means for the three samples. Area
counts for the first six listed compounds were normalized to an
internal standard, bromodichloromethane; the last six compounds
were normalized to 1,3-dichlorobenzene.
Table 1. Recovery of Analytes Stored for 14 Days Conclusion
Set One Set Two Set Three
Analyte
TDS3 Storage
Container
Swagelok Fittings
with PTFE Ferrules
Glass Storage
Container
Chloroform 97.7 ± 6.8 97.9 ± 2.3 99.2 ± 3.5
1,1,1-Trichloroethane 102.4 ± 1.7 102.6 ± 1.5 104.4 ± 1.4
Carbon tetrachloride 98.7 ± 2.8 95.8 ± 1.3 98.8 ± 2.6
1,2-Dichloroethane 98.6 ± 3.0 95.8 ± 1.7 98.6 ± 1.0
Trichloroethylene 100.7 ± 2.8 96.7 ± 0.7 105.0 ± 2.0
1,2-Dichloropropane 99.3 ± 2.5 97.5 ± 1.4 102.9 ± 2.7
1,3-Dichloropropane 101.3 ± 6.0 94.4 ± 9.2 87.8 ± 9.4
Tetrachloroethylene 99.5 ± 5.3 101.7 ± 4.4 93.8 ± 6.6
Ethylene dibromide 114.2 ± 6.2 97.1 ± 18.3 76.2 ± 8.7
Chlorobenzene 95.4 ± 4.4 95.9 ± 6.9 95.0 ± 5.7
Bromoform 107.7 ± 11.3 98.9 ± 5.5 91.7 ± 10.4
Bromobenzene 96.0 ± 4.8 95.4 ± 8.4 91.1 ± 6.8
The results in Table 1 demonstrate that the TDS3 storage containers
are equivalent to both Swagelok end-cap fittings and glass storage
containers in terms of sample stability during storage.
Performance Comparison of TDS3™ Storage Containers to Swagelok Fittings and Glass Storage Containers
Kristen Schultz and Jamie Brown
Introduction
The typical analytical process for air sampling using thermal
desorption tubes almost always involves shipping and storing
the sampling tube before and after sampling prior to analysis. The
most common approach to preventing contamination of the tube
during shipment and storage has been to attach Swagelok® end-cap
fittings, using PTFE ferrules to both ends of the tubes before and after
sampling. Another common technique is to place the sampling tube
in a glass vial-like container, constructed to seal at one end with a
PTFE-faced screw cap.
The TDS3 (Thermal Desorption Storage and Sampling System) offers
advantages over both the Swagelok end-cap fittings and glass
storage containers because it is designed to eliminate internal dead
volume, minimize the area of migration of the sample from the
adsorbent during the storage period and eliminate breakage risks
when shipping and handling in contrast to glass storage containers
bearing this same risk. The TDS3 storage container holds the tube in
its hard polycarbonate shell and seals with inert end-caps fitted with
PTFE-faced silicone septa that are easily replaced. This eliminates the
need for extensive cleaning or thermal conditioning of the device
before it can be used for storing another tube.
Experimental
The performance of the TDS3 storage container was measured by its
effectiveness for storing a collected sample relative to Swagelok end-
cap fittings and glass storage containers.
A mix of twelve analytes were spiked onto twelve Carbotrap®
300 thermal desorption tubes (6 mm O.D. x 4 mm ID x 11.5 cm L),
containing three carbonaceous adsorbents: Carbotrap C, Carbotrap B
and Carbosieve® S-III. The sampling tubes were spiked with
40 ng of each analyte in 0.2 μL of methanol, using flash vaporization
and 0.5 liters of inert nitrogen (50 mL/min for 10 min) to transfer the
vaporized analytes onto the sampling tube.
The twelve tubes were assigned to three sets, each stored in a different
storage device. Tubes in Set One were stored in TDS3 storage containers,
Set Two were fitted with brass Swagelok nut and end-cap fittings, using
PTFE ferrules and Set Three were stored in a threaded glass vial-type
container which seals with a PTFE screw cap at one end.
After spiking, the tubes were quickly sealed and placed in a paint can
(all tubes in the same can) containing a small amount of activated
charcoal and placed in a laboratory freezer for 14 days at -24 °C. After
14 days, the samples were removed from the paint can and thermally
desorbed to a gas chromatograph.

21Order: 800-325-3010 (U.S.) 814-359-3441 (Global)
Did you know . . .
In addition to its ability to
maintain sample integrity, the
TDS3 storage container offers
the user versatility during the
sampling process. It can be
converted to a sampling device
by installing optional sampling
caps that allow the user to easily
connect the tube in the TDS3
container to a sampling pump.
An optional tube holder is
also available.
Figure 2. Carbotrap 300 TD
Tubes with Escort™ Elf Pump
and Twin Port Sampler
Featured Products
Description Qty. Cat. No.
TDS3 Storage Container by Instrument Manufacturer/Model
Supelco, DANI, Markes, PerkinElmer, Shimadzu 1 25097-U
CDS/Dynatherm™ Standard Tubes 1 25096-U
Chrompack TD Tubes 1 25098-U
Gerstel® TDS/TDS2/TDSA Tubes 1 25095-U
Gerstel 60 mm Tubes 1 28307-U
Teledyne/Tekmar® AEROTtrap 6000 Tubes 1 25099-U
Envirochem, 810 Tubes 1 25100-U
TDS3 Storage Container Accessories
Sampling caps w/washers for 1/4 in. OD Tubes 10 25069
Replacement Septa for all TDS3 containers 50 25073
Male Luer Plug 12 504351
Female Luer Cap 12 57098
Description Qty. Cat. No.
Tubing Adapter for use with:
1/8 in. tubing to male luer 20 21016
3/16 in. tubing to male luer 20 23364
1/4 in. tubing to male luer 10 24856
Tubing Coupler
For use with male to male luer 20 25064-U
Related Products
Description Qty. Cat. No.
Equipment
Escort Elf Sampling Pump 1 28160-U
Gemini Twin Port Sampler 1 28118-U
12 Volt Battery Charger 1 28155-U
110 Volt Battery Charger 1 28158-U
240 Volt Battery Charger 1 28159-U
Chemical Standards
Chloroform 5 mL 02487
Carbon tetrachloride 1 mL, 5 mL 02671
1,2-Dichloroethane 1 mL, 5 mL 02562
Trichloroethylene 5 mL 46267
1,2-Dichloropropane 1 mL 02577
1,3-Dichloropropane 250 mg 45439
Tetrachloroethylene 1 mL, 5 mL 02666
Ethylene dibromide 1 g 31040
Chlorobenzene 5 mL, 25 mL 08650
Bromoform 1 g 36972
Bromobenzene 500 mg 442495
Innovation Inside, Results Delivered.
Visit
sigma-aldrich.com/air-monitoring
Explore the solutions within
Air MonitoringRefresh your air sampling media with innovative products from
Supelco featuring radiello™ Passive Sampling Devices and the ASSET™
EZ4-NCO Dry Sampler for Isocyanates. Supelco offers a complete
range of sampling devices with adsorbent expertise inside.
Reporter 31.1 |22
sigma-aldrich.com/tlc
Chromatographic Purification
Considerations for TLC Plate Selection
Robert F. Wallace
Introduction
Thin layer chromatography (TLC), an analytical technique often used
to separate and identify compounds present in a given mixture, can
also be used to determine the purity of a particular substance within
that mixture. Economical, TLC is often used for preliminary evaluations
of separation parameters for column chromatography. Because of its
simplicity and speed, TLC is also ideal for monitoring chemical reactions
by qualitatively analyzing the reaction products. Supelco® offers a
broad range of TLC products to address this wide variety of application
needs. Here we describe various selection criteria that might be
considered in choosing the ideal TLC plate for a particular application.
Plate TypeIn addition to standard analytical TLC plates, Supelco offers a variety of
both high performance and preparative TLC plates. High Performance
Thin Layer Chromatography (HPTLC) plates are characterized by smaller
particles, usually less than 10 μm, thinner layers, less than 150 μm
and smaller plates, less than 10 cm developing distance. HPTLC
offers distinct advantages over traditional TLC that include better
resolving power, faster development times, lower sample diffusion
and reduced solvent consumption. Like standard TLC plates, HPTLC
plates are available coated with a variety of matrices, with and without
indictors. Preparative TLC plates are used to purify or isolate a particular
substance by separating it from contaminants. To allow them to
separate larger quantities of material, these plates have adsorbent
layer thicknesses of greater than 500 μm. They also typically have softer
inorganic binders so that sample bands can be removed more easily
after separation.
Support TypesThree types of supports are available for individual application
requirements; glass, aluminum and plastic. Rigid, transparent and
reusable, glass plates offer high chemical resistance and good heat
stability for charring. For these reasons, they are the most widely used
plate support. Aluminum foil plates are a support alternative that offers
ease of handling and resistant to breakage. Lightweight and thinner
than glass plates, aluminum plates can reduce shipping costs and
save storage space. Additionally, they can be easily cut with scissors
to the desired dimensions or stored in laboratory notebooks. Solvent
resistant and compatibility with aqueous eluents are other features
of aluminum plates that might be appealing for specific applications.
Plastic or polyester (PET) plate supports are also lightweight and
flexible. Like aluminum-backed plates, they can be cut to desired
dimensions and stored in laboratory notebooks for future reference.
They also offer very good solvent resistance.
Adsorbent Layers/MatricesThe supports discussed earlier are available coated with a variety
of matrices with and without fluorescent indicators. Silica gel
is the most common TLC sorbent. Having the widest range of
applications, silica gel is available both modified/bonded and un-
bonded. Eluents used with silica gel are similar to solvents used in
column chromatography. Aluminum oxide, another matrix option,
exhibits selectivity similar to silica. Cellulose is available as either
microcrystalline or fibrous cellulose, with microcrystalline cellulose
typically providing more compact spots. Polyamide, which should
not be used with corrosive visualization reagents, also exhibits
very low diffusivity, allowing for tightly confined sample spots with
maximum intensity.
BindersTLC plates are available with polymeric (organic) and inorganic binders
as well as without binders. Binders do not impact adsorptive properties
of the matrix but impact the adherence of the adsorbent layer to
the backing. Available binders are organic (polymeric), inorganic and
gypsum. Adsorbent layers with organic binders are often most rugged,
making sample handling and application easier. Inorganic binders are
not as rugged but are generally a better option than plates without
a binder. No binder or gypsum plates are the least rugged and can
fracture easily. Plates with no binder are not recommended with
developing solvents containing greater than 20% water.
Plate DimensionsIn TLC you can choose a variety of plate dimensions. Larger plates
are often less costly and can be cut to smaller sizes. Pre-scored plates
are often safer and can be easily snapped into smaller dimensions.
Aluminum and plastic backed plates, as mentioned previously, can be
easily cut with a pair of scissors to the desired dimension. Yet another
option is the use of smaller pre-cut plates. This option provides the
ultimate convenience, making them a practical alternative where lab
productivity rather than plate cost is the major driver.
ConclusionTo assist in the selection of
the appropriate TLC plate and
accessories for your particular
application, order or download
the Supelco TLC Plate brochure.
sigma-aldrich.com/tlc
High Performance TLC Plates
Standard TLC Plates
Preparative TLC Plates
Other TLC Products
Unfold a Variety of Trusted Options
Thin Layer Chromatography(TLC) Plates

23Order: 800-325-3010 (U.S.) 814-359-3441 (Global)
2013 Analytical Trade Show Calendar
Date Tradeshow Location
January 14–17 The NELAC Institute (TNI) –
Semiannual Meeting: Forum on
Laboratory Accreditation
Denver, CO
February 9–13 MSACL 2013 San Diego, CA
March 4–7 ANAKON 2013 DE, Essen
March 6–7 Mass Spectrometry SG, Singapore
March 13–14 The Air Quality and Emissions show
(formerly MCERTS)
UK, Telford
March 17–22 Pittcon 2013 Philadelphia, PA
April 1–5 GMA Science Forum 2013 Washington, DC
April 3–4 Isocyanate and Health: Past,
Present and Future
Potomac, MD
April 7–11 ACS Spring New Orleans, LA
April 8–9 5th Berlin LC/MSMS Symposium DE, Berlin
Apirl 8–11 WRIB Long Beach, CA
April 18 Chrom Forum Delaware Valley:
The Practice of Chromatography:
Sample Preparation, Validation and
Troubleshooting
Fort Washington, PA
April 28–May 1 AOCS – Oil Montreal, Canada
April 28–May 1 ISBT BevTech 2013 Fort Lauderdale, FL
April 30–May 1 Environmental Trade Fair and
Conference
Austin, TX
May 5–8 FEMA Palm Beach, FL
May 7–9 Minnesota Chromatography Forum Minneapolis, MN
May 12–15 Int'l Symposium on Capillary
Chromatography
Palm Springs, CA
May 16 Triangle Chromatography Symposium Raleigh, NC
May 16 North Jersey Chrom Disc Group New Jersey
May 18–21 American Society for Microbiology
(ASM 2013)
Denver, CO
May 18–23 AIHCE – Industrial Hygiene Montreal, Canada
May 20–22 AAPS NBC San Diego, CA
May 22–24 Florida Soc. Env. Analysts (Spring) Clearwater Beach, FL
June 9–13 61st ASMS Conference on Mass
Spectrometry and Allied Topics
Minneapolis, MN
June 16–20 HPLC 2013 NL, Amsterdam
June 25–28 Air & Waste Management Assoc. –
106th Annual Conference & Exhibition
Chicago, IL
Date Tradeshow Location
June 18–19 38th Annual BMS Analytical
Symposium (BMSIARC)
Edison, NJ
July 2–5 In Vino Analytica Scientia FR, Reims
July 7-10 Chirality Shanghai, China
July 13–16 Institute of Food Technologists (IFT) Chicago, IL
July 21–23 PaAAEL/NYAAEL (NY/PA Approved
Env. Labs)
PA (TBD)
July 21–24 NACRW – North America Chemical
Research Workshop (renamed from
FPRW )
St. Pete Beach, FL
July 28–August 1 AACC – Am. Assoc. for Clinical Chem. Houston, TX
August 5–9 NEMC – Nat'l Env. Mon. Conf. San Antonio, TX
August 1 COSMOS TBD
August 5–9 GPA Tulsa, OK
August 5–8 2013 Analytical Land O’Lakes
Conference: “Strategies for
Analytical Excellence”
Merrimac, WI
August 19 ACS – Fall Philadelphia, PA
August 25–28 AOAC – Analytical Methods Chicago, IL
August 25–29 Euroanalysis PL, Warsaw
TBD Csaba Horváth Medal Award
Symposium
Europe
September 19 J&J Chromatography Bridge Water, NJ
September
23–25
Polyurethanes 2013 Phoenix, AZ
September 29–
October 2
AACC – Am. Assoc. for Cereal
Chemists
Albuquerque, NM
October 4-6 Southwestern Association of
Toxicologists
Norman, OK
October FEMA – Fall Symposium TBD
October 28–
November 1
Society of Forensic Toxicology
(SOFT) – Annual Meeting
Orlando, FL
October 15–16 Gulf Coast Conference Galveston, TX
November 5–8 Recent Advances in Food Analysis
(RAFA 2013)
CZ, Prague
November
10–14
2013 AAPS Annual Meeting and
Exposition
San Antonio, TX
November
18–20
Eastern Analytical Symposium and
Exposition (EAS)
Somerset, NJ
Look for Supelco at the following events:
©2013 Sigma-Aldrich Co. LLC. All rights reserved. SIGMA-ALDRICH and SUPELCO are trademarks of Sigma-Aldrich Co. LLC, registered in the US and other countries. Ascentis, Carbosieve, Carbotrap, CHIROBIOTIC, HybridSPE,
Omegawax and SLB are registered trademarks of Sigma-Aldrich Co. LLC. CHROMASOLV is a registered trademark of Sigma-Aldrich Laborchemikalien GmbH. FLUKA is a registered trademark of Sigma-Aldrich GmbH. ENVI-Carb,
Escort, Supel, Solutions within and TDS3 are trademarks of Sigma-Aldrich Co. LLC. Fused-Core is a registered trademark of Advanced Materials Technology, Inc. Gerstel is a registered trademark of Gerstel GmbH & Co KG. PITTCON is
a registered trademark of Pittsburgh Conference on Analytical Chemistry and Applied Spectroscopy. Swagelok is a registered trademark of Swagelok Company. Tekmar is a registered trademark of Tekmar Co. TSKgel is a registered
trademark of Tosoh Corporation. CD is a trademark of QIS, Inc. Dynatherm is a trademark of CDS Analytical. FocusLiner is a trademark of SGE Analytical Science Pty Ltd. QSertVial is a trademark of QIS, Inc. radiello is a trademark of
Fondazione Salvatore Maugeri IRCCS. Supelco brand products are sold through Sigma-Aldrich, Inc. Purchaser must determine the suitability of the product(s) for their particular use. Additional terms and conditions may apply.
Please see product information on the Sigma-Aldrich website at www.sigmaaldrich.com and/or on the reverse side of the invoice or packing slip.
PGR
11737 / T213001
1023
Discover the Latest in Analytical Innovation for Your Application
Supelco® and Fluka® 2013 Pittcon Presentations
Oral Presentations
Sunday, March 17
2:55 PM
Elimination or Isolation of Phospholipids from Biological Matrices
Using Zirconia-Based Sorbents
Presenter: Jennifer Claus
Location: Room 116
Evaluations of a New Ionic Liquid Stationary Phase with PEG-Like
Selectivity
Presenter: Len Sidisky
Location: Room 404
Tuesday, March 19
10:35 PM
Guidelines for Transferring Routine HPLC Methods to New 5 μm
Core-Type Particles
Presenter: Richard Henry
Location: Room 121A
8:20 AM
Advantages of Using Monodisperse Particles in HPLC Columns
Presenter: Richard Henry
Location: Room 121A
Poster Presentations
Tuesday, March 19
AM Session
Investigation of BioSPME Technology for the Enrichment of Illicit
Phenethylamine and Cathinone Compounds from Biological Samples
Author: Craig Aurand
Location: Room 204ABC
Wednesday, March 20
AM Session
Microbial Quality Control of Beer
Author: Shyam Verma
Location: Room 204ABC
New Analytical Tools for the Determination of Persistent Organic
Pollutants (POPs) in Fatty Food and Beverage Matrices Using QuEChERS
Extraction/Cleanup and Gas Chromatography (GC) Analysis
Author: Katherine Stenerson
Location: Room 204ABC
PM Session
Comparison of the Selectivity of Ionic Liquid Stationary Phases for the
Analysis of PAHs
Author: Len Sidisky
Location: Exposition Floor, Aisles 1600-2100
Influence of the Solvent Quality on UHPLC/UV/MS Results
Author: Shyam Verma
Location: Exposition Floor, Aisles 1600-2100
Thursday, March 21
AM Session
High-Performance Quantitative 1H-NMR Yields Organic Certified Reference
Materials (CRM) with Traceability and Low Measurement Uncertainty
Author: Michael Weber
Location: Exposition Floor, Aisles 1600-2100
PM Session
Comparison of the Selectivity of Ionic Liquid Stationary Phases for the
Analysis of FAME Isomers
Author: Len Sidisky
Location: Room 204ABC
Enrichment of Phospholipids from Biological Matrices with Zirconium
Oxide-Modified Silica Sorbents
Author: Xiaoning Lu
Location: Room 204ABC
A Novel Dry Sampler for Determination of Isocyanates in Vapor Phase
and Particulate
Author: Michael Ye
Location: Room 204ABC
The World’s Largest Annual Conference
and Exposition for Laboratory ScienceMarch 17-21, 2013, Philadelphia, Pennsylvania
If you identify, quantify, analyze or test the chemical or biological
properties of compounds or molecules, Pittcon is a must attend
event for you. See all the innovations in instrumentation from
leading companies from around the world, learn about the
latest techniques used in your industry, select from over 2,000
technical sessions and over 100 short courses, and participate in
networking opportunities with world renowned scientists.
Visit the Sigma-Aldrich Booth #3749.
Scan the QR code to
save this schedule.