sun - loopnetimages4.loopnet.com/d2/ws9gc4c-dt3amrvzrtzoxbdfqdkivuvfvx… · • complete phone...
TRANSCRIPT

Gibson Business Park1168 & 1170 Center Point DriveHenderson, Nevada 89074
Renae E. Russo, LEED GAVice President702-968-7319
FOR SALESun
Commercial Real Estate, Inc.
2 of 121168 & 1170 Center Point Drive OM
Confidentiality & disClosure
SUN COMMERCIAL REAL ESTATE, INC. (the “Broker”) has been retained on an exclusive basis to market the property described herein (the “Property”). Broker has been authorized by the Seller of the Property (the “Seller”) to prepare and distribute the enclosed information (the “Material”) for the purpose of soliciting offers to purchase from interested parties. More detailed financial, title and tenant lease information may be made available upon request following the mutual execution of a letter of intent or contract to purchase between the Seller and a prospective purchaser. You are invited to review this opportunity and make an offer to purchase based upon your analysis. If your offer results in the Seller choosing to open negotiations with you, you will be asked to provide financial references. The eventual purchaser will be chosen based upon an assessment of price, terms, ability to close the transaction and such other matters as the Seller deems appropriate.
The Material is intended solely for the purpose of soliciting expressions of interest from qualified investors for the acquisition of the Property. The Material is not to be copied and/or used for any other purpose or made available to any other person without the express written consent of Broker or Seller. The Material does not purport to be all-inclusive or to contain all of the information that a prospective buyer may require. The information contained in the Material has been obtained from the Seller and other sources and has not been verified by the Seller or its affiliates. The pro forma is delivered only as an accommodation and neither the Seller, Broker , nor any of their respective affiliates, agents, representatives, employees, parents, subsidiaries, members, managers, partners, shareholders, directors, or officers, makes any representation or warranty regarding such pro forma. Purchaser must make its own investigation of the Property and any existing or available financing, and must independently confirm the accuracy of the projections contained in the pro forma.
Seller reserves the right, for any reason, to withdraw the Property from the market. Seller has no obligation, express or implied, to accept any offer. Further, Seller has no obligation to sell the Property unless and until the Seller executes and delivers a signed agreement of purchase and sale on terms acceptable to the Seller, in its sole discretion. By submitting an offer, a purchaser will be deemed to have acknowledged the foregoing and agreed to release Seller and Broker from any liability with respect thereto.
Property walk-throughs are to be conducted by appointment only. Contact Broker for additional information.
Cathy Jones, CPA, SIOR, CCIM Renae E. Russo, LEED GACEO Vice [email protected] [email protected]

3 of 121168 & 1170 Center Point Drive OM
Market Overview Section 2
Las Vegas Industrial & SE Las Vegas/Henderson Submarket ReviewArea Demographics
Property Summary Section 1
Property SummaryProperty PhotosFloor PlanAssessor Parcel MapLas Vegas Valley Location MapSurrounding Aerial Map
table of Contents

PROPERTY HIGHLIGHTS
• Ideal for value-add investor or owner/user• Sale includes all FFE’s - furniture, fixtures and equipment• Below replacement cost• Office 90% / Warehouse 10%• Suite 1168 - ±3,100 square feet with 10% warehouse • Suite 1170 - ±2,548 square feet with 10% warehouse• Demising wall may be removed for single tenant use• Office 100% HVAC• Year Built: 1998• (2) grade roll up doors - Clearance height 18’• Warehouse evap cooled• Power: 400w 3/phase• Security System with close circuit TV (remains with property sale)• Complete Phone System (remains with property sale)• Parking Ratio: 2.56/1000• Cox Fiber Optic Internet
Energy Efficient Lighting ♦ All exterior security lighting is LED ♦ 1168 - T-5 CFL with Electronic Ballast ♦ 1170 - All CFL
PROPERTY DESCRIPTION
This ±5,648 SF Property consists of a one-story multi-tenant office/flex building with excellent street exposure on Gallagher Road.
1168 Center Point is ±3,100 SF, includes an open reception area, two restrooms, large conference room, work space, break room, (3) offices. Warehouse is approximately 300 SF with (1) roll up door and 18’ clear height.
1170 Center Point is ±2,548 SF, includes an open reception area, five offices, break area, two restrooms, a large open bullpen area and conference room. The warehouse is approximately, 300 SF with (1) roll up door and 18’ clear height. Owner has requested a 30-day notice be given to current tenant upon open of escrow.
ProPerty summary
THE OFFERING
Sun Commercial Real Estate, Inc. is proud to present an exceptional opportunity to purchase a ±5,648 SF Energy Efficient stand alone office/flex building on a 0.48 acre site. The property is located at 1168 & 1170 Center Point Road, Henderson, Nevada 89074, within the Southeast submarket.
PROPERTY LOCATION
The Property is located south of Gibson Road at the corner of Center Point and Gallagher Road with exceptional curb appeal. Located within Gibson Business Park, a master planned office/industrial business park, having the civic address of 1168 & 1170 Center Point. In addition, the property enjoys close proximity to restaurants and amenities such as the Galleria Mall and Henderson Auto Mall. Property offers easy access to I-215, 93/95 freeways, McCarran International Airport, and the Las Vegas Strip.
Asking Price:
Occupancy:
Site Size:
$931,920 ($165 PSF)
50%
±0.48 Acres
(IG) General Industrial Zoning:
SUMMARY
4 of 121168 & 1170 Center Point Drive OM

5 of 121168 & 1170 Center Point Drive OM
ProPerty Photos
6 of 121168 & 1170 Center Point Drive OM
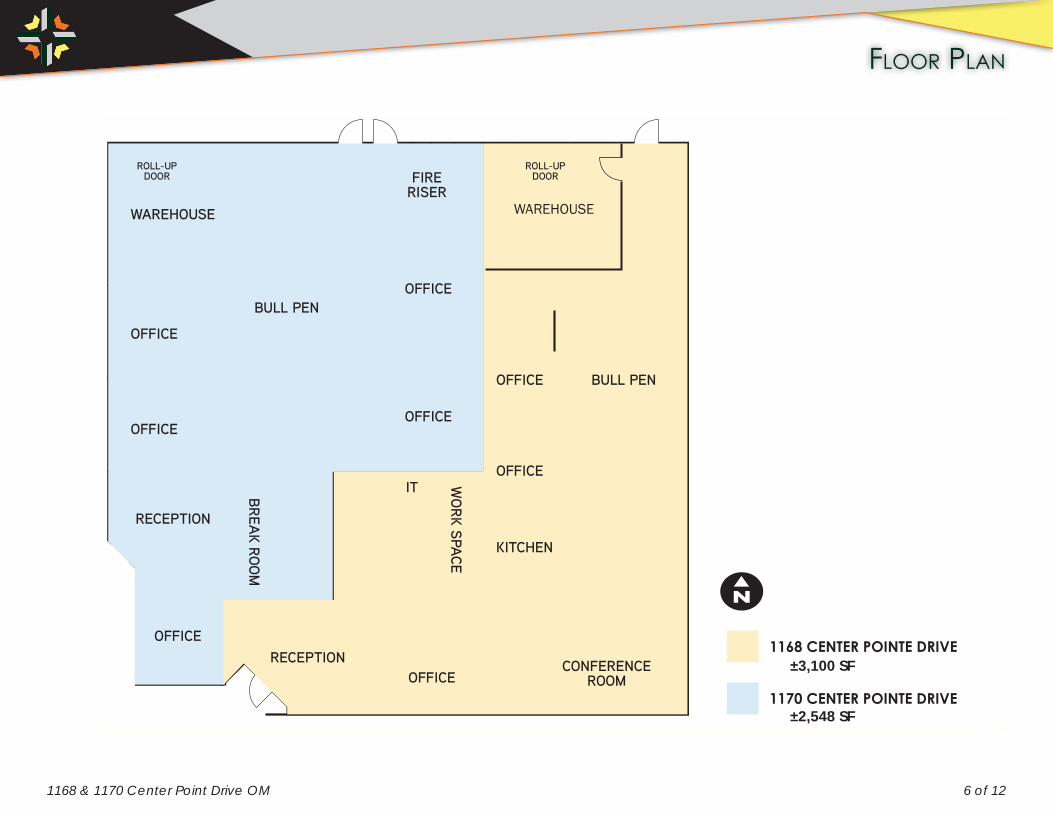
floor Plan
1168 CENTER POINTE DRIVE
1170 CENTER POINTE DRIVE
N
WAREHOUSEWAREHOUSE
FIRERISER
CONFERENCEROOM
ROLL-UPDOOR
ROLL-UPDOOR
RECEPTION
RECEPTION
BREAK ROOM
WORK SPACE
BULL PEN
BULL PEN
OFFICE
OFFICE
OFFICE
OFFICE
OFFICE
OFFICE
OFFICE
KITCHEN
OFFICE
IT
±3,100 SF
±2,548 SF
WAREHOUSE
7 of 121168 & 1170 Center Point Drive OM
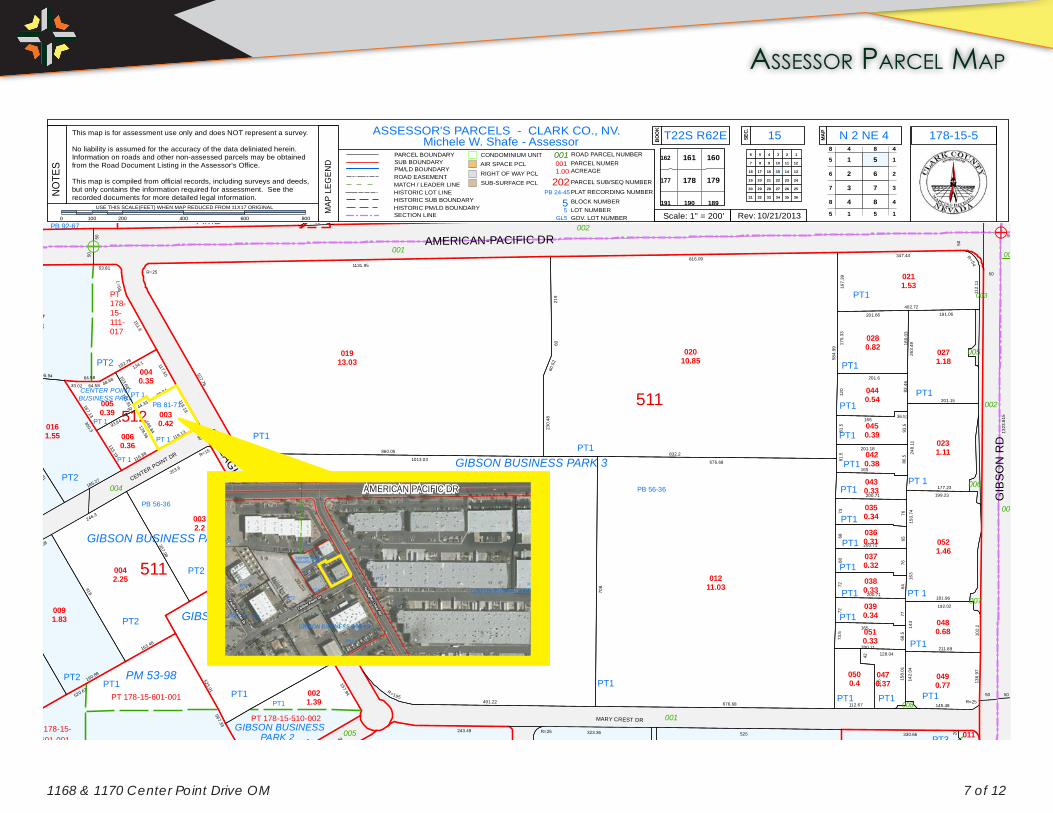
assessor ParCel maP
>>
PT 178-15-601-001
PT 178-15-601-001
PT178-15-111-017
811
510
511
111
611610
611
SHREVEPORT AVE
RUTLAND AVE
RIOORO AVE
MARY CREST RD
CENTER POINT DR
MARY CREST DR
MARSHMALLOW LN
00697-004007008
008
AMERICAN PACIFIC DRAMERICAN-PACIFIC DR
GIB
SO
N R
D
GALLAG
HER CREST RD
PB 79-44PB 80-61
PB 48-30
PB 56-36
PB 56-36
PB 81-71
PT 634 5
6G
14 15 14 15 14 15
DF
14 14 15151415B
C
A 3
PT 8
PT 8
PT1
PT2
PT2
PT1
PT2
PT2
PT2
PT2
PT1PT1
PT 1
PT 1
PT 1
PT3
PT1
PT1
PT1PT1
PT3
PT 1
PT 1
PT1
PT1
PT1
PT1
PT1
PT1
PT1
PT1
PT1
PT1
PT1
PT1
PT1
PT1
PT1
R=3050
50
51
51
724.9
R=54
50
50
470
306.
23
277.71
R=25
R
=25
50
50
50
567.33
525.01
R=15
90
R=25 525
214.81
238.67
341.8
431.69
232.88
300.3
R=25
708
491.22
R=195
705.29
676.68
414.57
418
190.88
163.48
185.27
204.08
65.32
125.68
246.3
253.6
341.08
520.67
323.36243.49
254.66
202
231
256
64.5833.02
117.55
118.1944.33
146.84
116.88
30
167.13
133.19
134.1
128.56
93.84
89.84
119.13
1013.03 676.68
527.76
584.
99
860.05 832.2
1131.95816.09
230.
4860
.52
6021
9
466.14 53.81
151.6
L=90
265.94 64.58
182.78
330.66
56.57
20
20
243
50
50
R=54
402.72
112.
11
347.44
167.
39
201.66 191.06
201.6
192.02
175.
33
145.48
83.4
6
201.15
180.
0326
3.49
R=25
248.
1115
0.74
199.23
163
181.96
177.23
200.71
7665
7664
77
200.71
200.71
7368
6872
72
165
86.581.5
201.18
128.04
126
42
158.
01
102.
2
211.89
143
142.
04
136.
97
165
81.5
36.51
93.5
120
165
68.5
112.67
73.5
200.71
"A"PB 92-67
812'A'
PB 93-42 AMDAMD
GIBSON BUSINESS PARK 3
GIBSON BUSINESSPARK 2
PM 53-98
512
CENTER POINTBUSINESS PARK
PT 1
103.6448.68
121.91
003GIBSON/WARM SPRINGS PHASE 2 AMD
PT1
GIBSON BUSINESS PARK 3 AMD
BLACK MOUNTAIN BUSINESS
002
PT 8
1323
.815
015
511
GIBSON BUSINESS PARK 3
357.98
PT1
GIBSON BUSINESSPARK 2
PT 178-15-510-002157.94
171.99
PB 48-30
001
007
006
005
002
004
002
001
001
005 0110.06
0490.77
0470.37
0500.4
0510.33
0480.68
0390.34
0380.33
0370.32
0091.83
0360.31
0350.34
0042.25
0521.46
0430.33
01211.03
00913.09
0032.2
0420.38
0450.39006
0.36 0231.11
0030.42
0440.54
0161.55
0040.35
0280.82 027
1.18
0174.3
01913.03
02010.85
0211.53
0050.39
0021.39
0032.85
NO
TES
This map is for assessment use only and does NOT represent a survey.
No liability is assumed for the accuracy of the data deliniated herein. Information on roads and other non-assessed parcels may be obtained from the Road Document Listing in the Assessor's Office.
This map is compiled from official records, including surveys and deeds, but only contains the information required for assessment. See the recorded documents for more detailed legal information.
MA
P LE
GE
ND
USE THIS SCALE(FEET) WHEN MAP REDUCED FROM 11X17 ORIGINAL
ASSESSOR'S PARCELS - CLARK CO., NV.
Scale: 1" = 200' 10/21/2013
T22S R62E 15 N 2 NE 4 178-15-5
31
30
19
1
1314
121110987
6 5 4 3 2
3635343332
29 28 27 26
24
25
23222120
18 17 16 15
BO
OK
SEC
.
MA
P
2
3
4
5
6
7
8
1
2
3
4
51
8
7
5
6
4 8
505
PARCEL BOUNDARYSUB BOUNDARY
ROAD EASEMENTPM/LD BOUNDARY
HISTORIC LOT LINEMATCH / LEADER LINE
ROAD PARCEL NUMBERPARCEL NUMERACREAGE
PARCEL SUB/SEQ NUMBER
PLAT RECORDING NUMBERBLOCK NUMBERLOT NUMBERGOV. LOT NUMBER
10010011.00
202PB 24-45
55
GL5
HISTORIC SUB BOUNDARYHISTORIC PM/LD BOUNDARY
15
8 4
Rev:
TAX DIST
0 200 400 600 800100 SECTION LINE
CONDOMINIUM UNITAIR SPACE PCLRIGHT OF WAY PCLSUB-SURFACE PCL
190
161162
179177 178
191
160
189
Michele W. Shafe - Assessor
>>
PT 178-15-601-001
PT 178-15-601-001
PT178-15-111-017
811
510
511
111
611610
611
SHREVEPORT AVE
RUTLAND AVE
RIOORO AVE
MARY CREST RD
CENTER POINT DR
MARY CREST DR
MARSHMALLOW LN
00697-004007008
008
AMERICAN PACIFIC DRAMERICAN-PACIFIC DR
GIB
SON
RD
GALLAGHER CREST RD
PB 79-44PB 80-61
PB 48-30
PB 56-36
PB 56-36
PB 81-71
PT 634 5
6G
14 15 14 15 14 15
DF
14 14 15151415B
C
A 3
PT 8
PT 8
PT1
PT2
PT2
PT1
PT2
PT2
PT2
PT2
PT1PT1
PT 1
PT 1
PT 1
PT3
PT1
PT1
PT1PT1
PT3
PT 1
PT 1
PT1
PT1
PT1
PT1
PT1
PT1
PT1
PT1
PT1
PT1
PT1
PT1
PT1
PT1
PT1
R=3050
50
51
51
724.9
R=54
50
50
470
306.
23
277.71
R=25
R
=25
50
50
50
567.33
525.01
R=15
90
R=25 525
214.81
238.67
341.8
431.69
232.88
300.3
R=25
708
491.22
R=195
705.29
676.68
414.57
418
190.88
163.48
185.27
204.08
65.32
125.68
246.3
253.6
341.08
520.67
323.36243.49
254.66
202
231
256
64.5833.02
117.55
118.1944.33
146.84
116.88
30
167.13
133.19
134.1
128.56
93.84
89.84
119.13
1013.03 676.68
527.76
584.
99
860.05 832.2
1131.95816.09
230.
4860
.52
6021
9
466.14 53.81
151.6
L=90
265.94 64.58
182.78
330.66
56.5720
20
243
50
50
R=54
402.72
112.
11
347.44
167.
39
201.66 191.06
201.6
192.02
175.
33
145.48
83.4
6
201.15
180.
0326
3.49
R=25
248.
1115
0.74
199.23
163
181.96
177.23
200.71
7665
7664
77
200.71
200.71
7368
6872
72
165
86.581.5
201.18
128.04
126
42
158.
01
102.
2
211.89
143
142.
04
136.
97
165
81.5
36.51
93.5
120
165
68.5
112.67
73.5
200.71
"A"PB 92-67
812'A'
PB 93-42 AMDAMD
GIBSON BUSINESS PARK 3
GIBSON BUSINESSPARK 2
PM 53-98
512
CENTER POINTBUSINESS PARK
PT 1
103.6448.68
121.91
003GIBSON/WARM SPRINGS PHASE 2 AMD
PT1
GIBSON BUSINESS PARK 3 AMD
BLACK MOUNTAIN BUSINESS
002
PT 8
1323
.815
015
511
GIBSON BUSINESS PARK 3
357.98
PT1
GIBSON BUSINESSPARK 2
PT 178-15-510-002
157.94
171.99
PB 48-30
001
007
006
005
002
004
002
001
001
005 0110.06
0490.77
0470.37
0500.4
0510.33
0480.68
0390.34
0380.33
0370.32
0091.83
0360.31
0350.34
0042.25
0521.46
0430.33
01211.03
00913.09
0032.2
0420.38
0450.39006
0.36 0231.11
0030.42
0440.54
0161.55
0040.35
0280.82 027
1.18
0174.3
01913.03
02010.85
0211.53
0050.39
0021.39
0032.85
NO
TES
This map is for assessment use only and does NOT represent a survey.
No liability is assumed for the accuracy of the data deliniated herein. Information on roads and other non-assessed parcels may be obtained from the Road Document Listing in the Assessor's Office.
This map is compiled from official records, including surveys and deeds, but only contains the information required for assessment. See the recorded documents for more detailed legal information.
MAP
LEG
END
USE THIS SCALE(FEET) WHEN MAP REDUCED FROM 11X17 ORIGINAL
ASSESSOR'S PARCELS - CLARK CO., NV.
Scale: 1" = 200' 10/21/2013
T22S R62E 15 N 2 NE 4 178-15-5
31
30
19
1
1314
121110987
6 5 4 3 2
3635343332
29 28 27 26
24
25
23222120
18 17 16 15
BOO
K
SEC.
MAP
2
3
4
5
6
7
8
1
2
3
4
51
8
7
5
6
4 8
505
PARCEL BOUNDARYSUB BOUNDARY
ROAD EASEMENTPM/LD BOUNDARY
HISTORIC LOT LINEMATCH / LEADER LINE
ROAD PARCEL NUMBERPARCEL NUMERACREAGE
PARCEL SUB/SEQ NUMBER
PLAT RECORDING NUMBERBLOCK NUMBERLOT NUMBERGOV. LOT NUMBER
10010011.00
202PB 24-45
55
GL5
HISTORIC SUB BOUNDARYHISTORIC PM/LD BOUNDARY
15
8 4
Rev:
TAX DIST
0 200 400 600 800100 SECTION LINE
CONDOMINIUM UNITAIR SPACE PCLRIGHT OF WAY PCLSUB-SURFACE PCL
190
161162
179177 178
191
160
189
Michele W. Shafe - Assessor
AMERICAN PACIFIC DR

8 of 121168 & 1170 Center Point Drive OM
las Vegas Valley area maP

9 of 121168 & 1170 Center Point Drive OM
surrounding aerial maP
SUBJECT
Galleria at Sunset
Stephanie Street Shopping Center
N Stephanie St
AmericAn PAcific Dr
center Point Dr GAllAGher crest rD
10 of 121168 & 1170 Center Point Drive OM
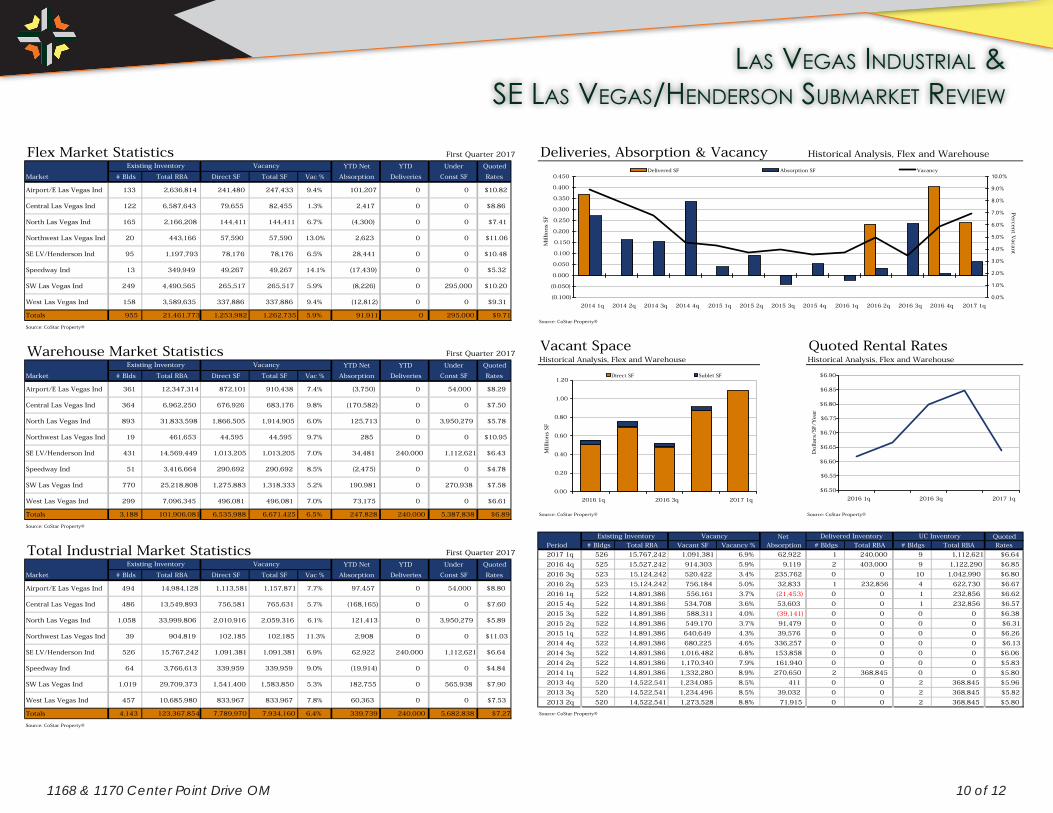
las Vegas industrial & se las Vegas/henderson submarket reView
8 CoStar Industrial Statistics ©2017 CoStar Group, Inc.
Las Vegas � First Quarter 2017
Las Vegas Industrial MarketFirst Quarter 2017 – Las Vegas
Las Vegas Industrial Market
©2017 CoStar Group, Inc. CoStar Industrial Statistics 9
Flex Market Statistics First Quarter 2017
YTD Net YTD Under Quoted
Market # Blds Total RBA Direct SF Total SF Vac % Absorption Deliveries Const SF Rates
Airport/E Las Vegas Ind 133 2,636,814 241,480 247,433 9.4% 101,207 0 0 $10.82
Central Las Vegas Ind 122 6,587,643 79,655 82,455 1.3% 2,417 0 0 $8.86
North Las Vegas Ind 165 2,166,208 144,411 144,411 6.7% (4,300) 0 0 $7.41
Northwest Las Vegas Ind 20 443,166 57,590 57,590 13.0% 2,623 0 0 $11.06
SE LV/Henderson Ind 95 1,197,793 78,176 78,176 6.5% 28,441 0 0 $10.48
Speedway Ind 13 349,949 49,267 49,267 14.1% (17,439) 0 0 $5.32
SW Las Vegas Ind 249 4,490,565 265,517 265,517 5.9% (8,226) 0 295,000 $10.20
West Las Vegas Ind 158 3,589,635 337,886 337,886 9.4% (12,812) 0 0 $9.31
Totals 955 21,461,773 1,253,982 1,262,735 5.9% 91,911 0 295,000 $9.71
Source: CoStar Property®
Warehouse Market Statistics First Quarter 2017
YTD Net YTD Under Quoted
Market # Blds Total RBA Direct SF Total SF Vac % Absorption Deliveries Const SF Rates
Airport/E Las Vegas Ind 361 12,347,314 872,101 910,438 7.4% (3,750) 0 54,000 $8.29
Central Las Vegas Ind 364 6,962,250 676,926 683,176 9.8% (170,582) 0 0 $7.50
North Las Vegas Ind 893 31,833,598 1,866,505 1,914,905 6.0% 125,713 0 3,950,279 $5.78
Northwest Las Vegas Ind 19 461,653 44,595 44,595 9.7% 285 0 0 $10.95
SE LV/Henderson Ind 431 14,569,449 1,013,205 1,013,205 7.0% 34,481 240,000 1,112,621 $6.43
Speedway Ind 51 3,416,664 290,692 290,692 8.5% (2,475) 0 0 $4.78
SW Las Vegas Ind 770 25,218,808 1,275,883 1,318,333 5.2% 190,981 0 270,938 $7.58
West Las Vegas Ind 299 7,096,345 496,081 496,081 7.0% 73,175 0 0 $6.61
Totals 3,188 101,906,081 6,535,988 6,671,425 6.5% 247,828 240,000 5,387,838 $6.89
Source: CoStar Property®
Total Industrial Market Statistics First Quarter 2017
YTD Net YTD Under Quoted
Market # Blds Total RBA Direct SF Total SF Vac % Absorption Deliveries Const SF Rates
Airport/E Las Vegas Ind 494 14,984,128 1,113,581 1,157,871 7.7% 97,457 0 54,000 $8.80
Central Las Vegas Ind 486 13,549,893 756,581 765,631 5.7% (168,165) 0 0 $7.60
North Las Vegas Ind 1,058 33,999,806 2,010,916 2,059,316 6.1% 121,413 0 3,950,279 $5.89
Northwest Las Vegas Ind 39 904,819 102,185 102,185 11.3% 2,908 0 0 $11.03
SE LV/Henderson Ind 526 15,767,242 1,091,381 1,091,381 6.9% 62,922 240,000 1,112,621 $6.64
Speedway Ind 64 3,766,613 339,959 339,959 9.0% (19,914) 0 0 $4.84
SW Las Vegas Ind 1,019 29,709,373 1,541,400 1,583,850 5.3% 182,755 0 565,938 $7.90
West Las Vegas Ind 457 10,685,980 833,967 833,967 7.8% 60,363 0 0 $7.53
Totals 4,143 123,367,854 7,789,970 7,934,160 6.4% 339,739 240,000 5,682,838 $7.27
Source: CoStar Property®
Existing Inventory Vacancy
Existing Inventory Vacancy
Existing Inventory Vacancy
Figures at a Glance
18 CoStar Industrial Statistics ©2017 CoStar Group, Inc.
Las Vegas – First Quarter 2017
Las Vegas Industrial MarketMARKET HIGHLIGHTS - Flex & Warehouse
©2017 CoStar Group, Inc. CoStar Industrial Statistics 19
First Quarter 2017 – Las Vegas
Las Vegas Industrial MarketMARKET HIGHLIGHTS - Flex & Warehouse
S E L V / H e n d e r s o n M a r k e t
Deliveries, Absorption & Vacancy Historical Analysis, Flex and Warehouse
Source: CoStar Property®
Vacant Space Quoted Rental RatesHistorical Analysis, Flex and Warehouse Historical Analysis, Flex and Warehouse
Source: CoStar Property® Source: CoStar Property®
Net QuotedPeriod # Bldgs Total RBA Vacant SF Vacancy % Absorption # Bldgs Total RBA # Bldgs Total RBA Rates
2017 1q 526 15,767,242 1,091,381 6.9% 62,922 1 240,000 9 1,112,621 $6.64
2016 4q 525 15,527,242 914,303 5.9% 9,119 2 403,000 9 1,122,290 $6.85
2016 3q 523 15,124,242 520,422 3.4% 235,762 0 0 10 1,042,990 $6.80
2016 2q 523 15,124,242 756,184 5.0% 32,833 1 232,856 4 622,730 $6.67
2016 1q 522 14,891,386 556,161 3.7% (21,453) 0 0 1 232,856 $6.62
2015 4q 522 14,891,386 534,708 3.6% 53,603 0 0 1 232,856 $6.57
2015 3q 522 14,891,386 588,311 4.0% (39,141) 0 0 0 0 $6.38
2015 2q 522 14,891,386 549,170 3.7% 91,479 0 0 0 0 $6.31
2015 1q 522 14,891,386 640,649 4.3% 39,576 0 0 0 0 $6.26
2014 4q 522 14,891,386 680,225 4.6% 336,257 0 0 0 0 $6.13
2014 3q 522 14,891,386 1,016,482 6.8% 153,858 0 0 0 0 $6.06
2014 2q 522 14,891,386 1,170,340 7.9% 161,940 0 0 0 0 $5.83
2014 1q 522 14,891,386 1,332,280 8.9% 270,650 2 368,845 0 0 $5.80
2013 4q 520 14,522,541 1,234,085 8.5% 411 0 0 2 368,845 $5.96
2013 3q 520 14,522,541 1,234,496 8.5% 39,032 0 0 2 368,845 $5.82
2013 2q 520 14,522,541 1,273,528 8.8% 71,915 0 0 2 368,845 $5.80
Source: CoStar Property®
UC InventoryDelivered InventoryExisting Inventory Vacancy
(0.100)
(0.050)
0.000
0.050
0.100
0.150
0.200
0.250
0.300
0.350
0.400
0.450
2014 1q 2014 2q 2014 3q 2014 4q 2015 1q 2015 2q 2015 3q 2015 4q 2016 1q 2016 2q 2016 3q 2016 4q 2017 1q
Millions
SF
0.0%
1.0%
2.0%
3.0%
4.0%
5.0%
6.0%
7.0%
8.0%
9.0%
10.0%
Percen
t Vacan
t
Delivered SF Absorption SF Vacancy
$6.50
$6.55
$6.60
$6.65
$6.70
$6.75
$6.80
$6.85
$6.90
2016 1q 2016 3q 2017 1q
Dollar
s/SF
/Yea
r
0.00
0.20
0.40
0.60
0.80
1.00
1.20
2016 1q 2016 3q 2017 1q
Millions
SF
Direct SF Sublet SF

11 of 121168 & 1170 Center Point Drive OM
Demographic and Income Profile1168 Center Point Dr, Henderson, Nevada, 89074 Prepared by EsriRing: 1 mile radius Latitude: 36.03958
Longitude: -115.03860
Summary Census 2010 2016 2021Population 12,313 14,247 15,761Households 4,767 5,506 6,051Families 3,025 3,456 3,784Average Household Size 2.58 2.59 2.60Owner Occupied Housing Units 2,606 2,747 3,000Renter Occupied Housing Units 2,161 2,759 3,052Median Age 36.0 37.7 38.3
Trends: 2016 - 2021 Annual Rate Area State NationalPopulation 2.04% 1.43% 0.84%Households 1.91% 1.30% 0.79%Families 1.83% 1.28% 0.72%Owner HHs 1.78% 1.29% 0.73%Median Household Income 2.50% 2.14% 1.89%
2016 2021 Households by Income Number Percent Number Percent
<$15,000 626 11.4% 676 11.2%$15,000 - $24,999 464 8.4% 474 7.8%$25,000 - $34,999 541 9.8% 604 10.0%$35,000 - $49,999 716 13.0% 418 6.9%$50,000 - $74,999 1,160 21.1% 1,308 21.6%$75,000 - $99,999 922 16.7% 1,116 18.4%$100,000 - $149,999 768 13.9% 1,027 17.0%$150,000 - $199,999 177 3.2% 260 4.3%$200,000+ 130 2.4% 169 2.8%
Median Household Income $56,462 $63,891Average Household Income $68,754 $76,599Per Capita Income $27,212 $30,145
Census 2010 2016 2021 Population by Age Number Percent Number Percent Number Percent
0 - 4 697 5.7% 783 5.5% 882 5.6%5 - 9 767 6.2% 763 5.4% 838 5.3%10 - 14 831 6.7% 830 5.8% 845 5.4%15 - 19 747 6.1% 854 6.0% 851 5.4%20 - 24 903 7.3% 936 6.6% 1,055 6.7%25 - 34 2,011 16.3% 2,416 17.0% 2,576 16.3%35 - 44 1,859 15.1% 2,021 14.2% 2,342 14.9%45 - 54 1,716 13.9% 1,930 13.5% 2,000 12.7%55 - 64 1,353 11.0% 1,651 11.6% 1,854 11.8%65 - 74 885 7.2% 1,238 8.7% 1,474 9.4%75 - 84 443 3.6% 639 4.5% 789 5.0%
85+ 101 0.8% 184 1.3% 254 1.6%Census 2010 2016 2021
Race and Ethnicity Number Percent Number Percent Number PercentWhite Alone 9,034 73.4% 9,896 69.5% 10,353 65.7%Black Alone 726 5.9% 980 6.9% 1,200 7.6%American Indian Alone 68 0.6% 77 0.5% 84 0.5%Asian Alone 1,044 8.5% 1,389 9.7% 1,759 11.2%Pacific Islander Alone 78 0.6% 96 0.7% 117 0.7%Some Other Race Alone 647 5.3% 863 6.1% 1,092 6.9%Two or More Races 717 5.8% 946 6.6% 1,155 7.3%
Hispanic Origin (Any Race) 2,107 17.1% 2,796 19.6% 3,445 21.9%Data Note: Income is expressed in current dollars.
Source: U.S. Census Bureau, Census 2010 Summary File 1. Esri forecasts for 2016 and 2021.
June 05, 2017
©2016 Esri Page 1 of 6
Demographic and Income Profile1168 Center Point Dr, Henderson, Nevada, 89074 Prepared by EsriRing: 1 mile radius Latitude: 36.03958
Longitude: -115.03860
AreaStateUSA
Trends 2016-2021Trends 2016-2021
Annual
Rat
e (i
n p
erce
nt)
2.42.2
21.81.61.41.2
10.80.60.40.2
0Population Households Families Owner HHs Median HH Income
20162021
Population by AgePopulation by Age
Perc
ent
16
14
12
10
8
6
4
2
00-4 5-9 10-14 15-19 20-24 25-34 35-44 45-54 55-64 65-74 75-84 85+
2016 Household Income 2016 Household Income
<$15K11.4%
$15K - $24K8.4%
$25K - $34K9.8%
$35K - $49K13.0%
$50K - $74K21.1%
$75K - $99K16.8%
$100K - $149K14.0%
$150K - $199K3.2%
$200K+2.4%
2016 Population by Race2016 Population by Race
Perc
ent
65605550454035302520151050
White Black Am. Ind. Asian Pacific Other Two+
2016 Percent Hispanic Origin: 19.6%
Source: U.S. Census Bureau, Census 2010 Summary File 1. Esri forecasts for 2016 and 2021.
June 05, 2017
©2016 Esri Page 2 of 6
area demograPhiCs (1 mile radius)

12 of 121168 & 1170 Center Point Drive OM
area demograPhiCs (3 mile radius)Demographic and Income Profile1168 Center Point Dr, Henderson, Nevada, 89074 Prepared by EsriRing: 3 mile radius Latitude: 36.03958
Longitude: -115.03860
Summary Census 2010 2016 2021Population 100,827 108,489 117,061Households 39,951 42,362 45,330Families 25,640 27,048 28,888Average Household Size 2.52 2.55 2.58Owner Occupied Housing Units 23,320 22,883 24,380Renter Occupied Housing Units 16,631 19,479 20,950Median Age 37.3 38.4 38.6
Trends: 2016 - 2021 Annual Rate Area State NationalPopulation 1.53% 1.43% 0.84%Households 1.36% 1.30% 0.79%Families 1.32% 1.28% 0.72%Owner HHs 1.28% 1.29% 0.73%Median Household Income 2.67% 2.14% 1.89%
2016 2021 Households by Income Number Percent Number Percent
<$15,000 4,519 10.7% 4,757 10.5%$15,000 - $24,999 3,537 8.3% 3,542 7.8%$25,000 - $34,999 3,975 9.4% 4,538 10.0%$35,000 - $49,999 5,968 14.1% 3,652 8.1%$50,000 - $74,999 8,428 19.9% 8,888 19.6%$75,000 - $99,999 6,506 15.4% 7,617 16.8%$100,000 - $149,999 5,757 13.6% 7,634 16.8%$150,000 - $199,999 1,949 4.6% 2,601 5.7%$200,000+ 1,723 4.1% 2,101 4.6%
Median Household Income $57,151 $65,185Average Household Income $74,871 $83,214Per Capita Income $29,529 $32,461
Census 2010 2016 2021 Population by Age Number Percent Number Percent Number Percent
0 - 4 6,032 6.0% 6,235 5.7% 6,750 5.8%5 - 9 6,399 6.3% 6,245 5.8% 6,611 5.6%10 - 14 6,792 6.7% 6,633 6.1% 6,818 5.8%15 - 19 6,726 6.7% 6,556 6.0% 6,596 5.6%20 - 24 6,479 6.4% 7,319 6.7% 7,361 6.3%25 - 34 14,635 14.5% 16,230 15.0% 18,268 15.6%35 - 44 14,864 14.7% 14,690 13.5% 16,126 13.8%45 - 54 14,785 14.7% 15,101 13.9% 14,770 12.6%55 - 64 12,107 12.0% 13,659 12.6% 14,606 12.5%65 - 74 7,304 7.2% 9,909 9.1% 11,630 9.9%75 - 84 3,630 3.6% 4,471 4.1% 5,771 4.9%
85+ 1,075 1.1% 1,442 1.3% 1,753 1.5%Census 2010 2016 2021
Race and Ethnicity Number Percent Number Percent Number PercentWhite Alone 75,299 74.7% 76,792 70.8% 78,549 67.1%Black Alone 6,002 6.0% 7,433 6.9% 8,822 7.5%American Indian Alone 647 0.6% 724 0.7% 785 0.7%Asian Alone 7,148 7.1% 9,001 8.3% 11,235 9.6%Pacific Islander Alone 675 0.7% 776 0.7% 908 0.8%Some Other Race Alone 5,848 5.8% 7,295 6.7% 9,012 7.7%Two or More Races 5,208 5.2% 6,468 6.0% 7,749 6.6%
Hispanic Origin (Any Race) 17,223 17.1% 21,309 19.6% 25,615 21.9%Data Note: Income is expressed in current dollars.
Source: U.S. Census Bureau, Census 2010 Summary File 1. Esri forecasts for 2016 and 2021.
June 05, 2017
©2016 Esri Page 3 of 6
Demographic and Income Profile1168 Center Point Dr, Henderson, Nevada, 89074 Prepared by EsriRing: 3 mile radius Latitude: 36.03958
Longitude: -115.03860
AreaStateUSA
Trends 2016-2021Trends 2016-2021
Annual
Rat
e (i
n p
erce
nt)
2.5
2
1.5
1
0.5
0Population Households Families Owner HHs Median HH Income
20162021
Population by AgePopulation by Age
Perc
ent
14
12
10
8
6
4
2
00-4 5-9 10-14 15-19 20-24 25-34 35-44 45-54 55-64 65-74 75-84 85+
2016 Household Income 2016 Household Income
<$15K10.7%
$15K - $24K8.3%
$25K - $34K9.4%
$35K - $49K14.1%
$50K - $74K19.9%
$75K - $99K15.4%
$100K - $149K13.6%
$150K - $199K4.6%
$200K+4.1%
2016 Population by Race2016 Population by Race
Perc
ent
7065605550454035302520151050
White Black Am. Ind. Asian Pacific Other Two+
2016 Percent Hispanic Origin: 19.6%
Source: U.S. Census Bureau, Census 2010 Summary File 1. Esri forecasts for 2016 and 2021.
June 05, 2017
©2016 Esri Page 4 of 6
13 of 121168 & 1170 Center Point Drive OM
Demographic and Income Profile1168 Center Point Dr, Henderson, Nevada, 89074 Prepared by EsriRing: 5 mile radius Latitude: 36.03958
Longitude: -115.03860
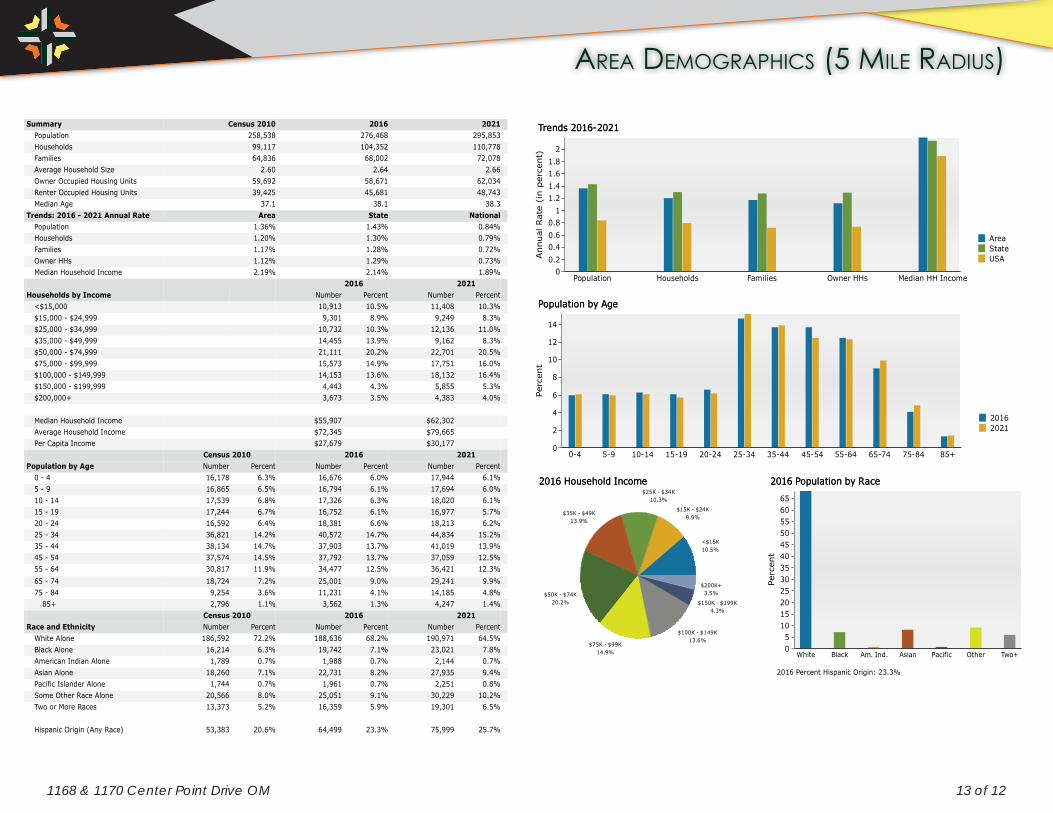
Summary Census 2010 2016 2021Population 258,538 276,468 295,853Households 99,117 104,352 110,778Families 64,836 68,002 72,078Average Household Size 2.60 2.64 2.66Owner Occupied Housing Units 59,692 58,671 62,034Renter Occupied Housing Units 39,425 45,681 48,743Median Age 37.1 38.1 38.3
Trends: 2016 - 2021 Annual Rate Area State NationalPopulation 1.36% 1.43% 0.84%Households 1.20% 1.30% 0.79%Families 1.17% 1.28% 0.72%Owner HHs 1.12% 1.29% 0.73%Median Household Income 2.19% 2.14% 1.89%
2016 2021 Households by Income Number Percent Number Percent
<$15,000 10,913 10.5% 11,408 10.3%$15,000 - $24,999 9,301 8.9% 9,249 8.3%$25,000 - $34,999 10,732 10.3% 12,136 11.0%$35,000 - $49,999 14,455 13.9% 9,162 8.3%$50,000 - $74,999 21,111 20.2% 22,701 20.5%$75,000 - $99,999 15,573 14.9% 17,751 16.0%$100,000 - $149,999 14,153 13.6% 18,132 16.4%$150,000 - $199,999 4,443 4.3% 5,855 5.3%$200,000+ 3,673 3.5% 4,383 4.0%
Median Household Income $55,907 $62,302Average Household Income $72,345 $79,665Per Capita Income $27,679 $30,177
Census 2010 2016 2021 Population by Age Number Percent Number Percent Number Percent
0 - 4 16,178 6.3% 16,676 6.0% 17,944 6.1%5 - 9 16,865 6.5% 16,794 6.1% 17,694 6.0%10 - 14 17,539 6.8% 17,326 6.3% 18,020 6.1%15 - 19 17,244 6.7% 16,752 6.1% 16,977 5.7%20 - 24 16,592 6.4% 18,381 6.6% 18,213 6.2%25 - 34 36,821 14.2% 40,572 14.7% 44,834 15.2%35 - 44 38,134 14.7% 37,903 13.7% 41,019 13.9%45 - 54 37,574 14.5% 37,792 13.7% 37,059 12.5%55 - 64 30,817 11.9% 34,477 12.5% 36,421 12.3%65 - 74 18,724 7.2% 25,001 9.0% 29,241 9.9%75 - 84 9,254 3.6% 11,231 4.1% 14,185 4.8%
85+ 2,796 1.1% 3,562 1.3% 4,247 1.4%Census 2010 2016 2021
Race and Ethnicity Number Percent Number Percent Number PercentWhite Alone 186,592 72.2% 188,636 68.2% 190,971 64.5%Black Alone 16,214 6.3% 19,742 7.1% 23,021 7.8%American Indian Alone 1,789 0.7% 1,988 0.7% 2,144 0.7%Asian Alone 18,260 7.1% 22,731 8.2% 27,935 9.4%Pacific Islander Alone 1,744 0.7% 1,961 0.7% 2,251 0.8%Some Other Race Alone 20,566 8.0% 25,051 9.1% 30,229 10.2%Two or More Races 13,373 5.2% 16,359 5.9% 19,301 6.5%
Hispanic Origin (Any Race) 53,383 20.6% 64,499 23.3% 75,999 25.7%Data Note: Income is expressed in current dollars.
Source: U.S. Census Bureau, Census 2010 Summary File 1. Esri forecasts for 2016 and 2021.
June 05, 2017
©2016 Esri Page 5 of 6
Demographic and Income Profile1168 Center Point Dr, Henderson, Nevada, 89074 Prepared by EsriRing: 5 mile radius Latitude: 36.03958
Longitude: -115.03860
AreaStateUSA
Trends 2016-2021Trends 2016-2021
Annual
Rat
e (i
n p
erce
nt)
21.81.61.41.2
10.80.60.40.2
0Population Households Families Owner HHs Median HH Income
20162021
Population by AgePopulation by Age
Perc
ent
14
12
10
8
6
4
2
00-4 5-9 10-14 15-19 20-24 25-34 35-44 45-54 55-64 65-74 75-84 85+
2016 Household Income 2016 Household Income
<$15K10.5%
$15K - $24K8.9%
$25K - $34K10.3%
$35K - $49K13.9%
$50K - $74K20.2%
$75K - $99K14.9%
$100K - $149K13.6%
$150K - $199K4.3%
$200K+3.5%
2016 Population by Race2016 Population by Race
Perc
ent
65605550454035302520151050
White Black Am. Ind. Asian Pacific Other Two+
2016 Percent Hispanic Origin: 23.3%
Source: U.S. Census Bureau, Census 2010 Summary File 1. Esri forecasts for 2016 and 2021.
June 05, 2017
©2016 Esri Page 6 of 6
area demograPhiCs (5 mile radius)