summer training project
DESCRIPTION
financial statement analysisTRANSCRIPT
A SUMMER TRAINING REPORT
ON
FINANCIAL ANALYSIS
OF
R-TEK MOULD
SUBMITTED TO
S.C.D GOVT COLLAGE LUDHIANA
In partial fulfillment of the requirement for the two years
Full time post graduate degree in
M.COM. Business innovations (M.B.I)
Supervised by: Submitted By:
Prof: Sanded Banal Ramandeep Kaur
(M.B.I)
Department of M.COM Business Innovations
S.C.D GOVT. COLLAGE. LUDHIANA.
2011-2012

CERTIFICATE
This is to certify that the project work done on Quality Management in R-Tek
Mould is a bonafide work carried out by Miss Ramandeep Kaur under my
supervision and guidance. The project report is submitted towards the partial
fulfillment of two year, full time degree of M.Com Business Innovations.
This work has not been submitted anywhere else for any other diploma/degree. The
original work is carried during 1st June 2012 to 15th July 2012 in R-Tek Mould.
Name and Sign of Industry Guide Name and Sign of Faculty
Mr. Ravinder Singh Mr. Ashwani Bhalla
_________________ __________________
Date:
Name of Student Ramandeep kaur
Roll No.
_________________________

ACKNOWLEDGEMENT
This report could not have been possible without the help of certain people and
utilising support of R-Tek Mould.
I would like to express my sincere gratitude towards Mr. Ravinder Singh (General
Manager) for his technical guidance, invaluable and constructive criticism and vital
encouragement throughout the entire project which helped me to get inside into the
working of R-Tek Moulds and to relate the theoretical knowledge imparted by our
esteemed faculty members in the course of M.Com Business Innovations to the
present scenario of corporate body.
I also express my sincere thanks to Dr. Ashwani Bhalla professor and program co-
ordinator and my respective Major Advisor Mr. Sandeep Bansal professor of
Department of Commerce and Business Innovation, S.C.D. Government College
Ludhiana, under whose valuable guidance this project was completed.
I express my sincere thanks to the whole team of R-Tek Mould for giving all the
facilities during my training period.
Indeed, the words at my command are not adequate to convey my heart full thanks
to respective parents for the encouragement and inspiration given by them.
Ramandeep Kaur

Introduction to R-Tek Mould
R-Tek Mould came into existence in 1985 under the very special guidance of Sh.
Kulwant Singh Matharu. Started from a scratch, much more research and
development work was done till 1990 and the lead was taken by Sh. Ravinder Singh
Matharu who is son of Sh. Kulwant Singh Matharu.
The concern was established as a small-scale industrial unit and now it’s one of
leading suppliers of plastic injection Moulding tools, pressure, rubber compression
moulds and polyurethane moulds and their mouldings. It is serving the industry for
about 17 years.

Besides straightening its hold on domestic market, the company has strong potential
in foreign market. The company has done some marvellous jobs dealing with some
leading brands like J.J. Jonex for Sports Die and mould, Indian Air Force for spare
parts, tools and die, Aluminium Casting, with Eastman Industries the company is
dealing Injection Moulds, Hero Cycle Limited is buying tool and die, Em Cee Cee
Sports Private Limited is dealing in tools and dies. R-Tek Mould also provides Turn
Key Projects to its clients.
The company is enjoying a prestigious market all over the globe and working with a
motive of customer satisfaction. The company prioritize is maintaining quality,
accuracy, competitive prices and professional work force.
R-Tek Mould strictly adheres to international quality and safety norms of the
automobile industry followed by leading manufacturers and automobile giants and
works to ensure zero-defect products. The company has a dedicated quality
assurance department along with a team of experienced quality control supervisors,
who ensures quality at all levels of production process. The company was endowed
with ISO 9001:2008 certification and is in process to achieve more in this line. The
company is in process of getting TS 16949 certification.
Autocrat is an integral part of R-Tek Mould. Autocrat is a reputed company since
1992, engaged in manufacture of Automobile parts, Bike Headlights Lens,
Motorcycle parts, Bike Visor, Auto parts, Visors, and other plastic products. It is
one of leading manufacturers, suppliers of Headlight glass. It provides headlight
glass to Bajaj CT 100, Bajaj Discover, Bajaj Platina, Bajaj Pulsar, and Honda
Activa. These products are fabricated with the high grade raw material that is
procured from reliable vendors to ensure that the products are of high quality and
meet the global standards.

R - T E K M O U L D
A young and dynamic organization, which have earned specialization in
manufacturing And supplying a comprehensive range of Plastic Injection mould,
Aluminum Die Casting Moulds, Aluminum Casting Products & Plastic Components.
The die casting machine capacity is from 40 to 250 Tons and also they have complete
infrastructure to finish Pressure Die Casting Components.
In Plastic Injection Moulding Section their portfolio of products includes optimum
quality Head Light Lens, and Wind Shield Glasses of Indian Bikes for replacement
market. For this they are using world’s best injection moulding machines with a
capacity from 60 to 440 Tons.
Fabricated under the supervision of well qualified and experienced professionals,
the products are acclaimed for their outstanding attributes, such as dimensional
accuracy, precise design and reliable service life.
They have developed a state-of-the-art infrastructure that aids us in efficiently
meeting all our business objectives. The Tool and Die manufacturing facility is
furnished with Vertical Machining Centers, Precision Surface Grinders, E.D.M. and
complete conventional tool room machines.
To complete target from concept to finished Product they have 3D Scanner, Cad-
Cam Software.

Objectives of the Company
Excellent distribution network
To achieve and maintain a lead position as manufacturer of automotive
components
To ensure steady growth in business and fulfill its social obligations
To build up high degree of customer confidence by sustaining standards of
excellence in product quality.
To develop human resource to increase their efficiency and productivity
Care of environment and to discharge factory waste responsibly
To build a strong customer base by satisfying them
Maintaining high quality output by implementing various quality checks.

HISTORY:-
DIE IS A BLOCK OF METAL WITH A SPECIAL SHAPE OR WITH A
PATTERN CUT INTO IT THAT IS USED FOR SHAPING OTHER
PIECES OF METAL SUCH AS COINS OR FOR MAKING PATTERNS
A MOULD IS A CONTAINER THAT YOU POUR SIFT LIQUID OR
SUBSTANCE INTO WHICH THEN BECOMES SOLID IN THE SAME
SHAPER AS THE CONTAINER E.G. WHEN IT IS COOLED OR
COOKED. A CLAY MOULD IS USED FOR CASTING BRONZE
STATUES.
R-TEK Mould came into existence in 1975 under the very special guidance of
Sh.Kulwant Singh Matharu . The idea of starting the business came to the mind from
the relatives of S. Ravinder Singh who live in Bombay and were doing the rubber
business. He took training from them in Bombay and then came back to Ludhiana
and started their own business. Started from a scratch, much more research and
development work was done till 1990 and the lead was taken by Sh. Ravinder Singh
Matharu who is the son of Sh. K.S. Matharu. Sh. Ravinder singh matharu is
currently the manager of the company. He strengthens the progress and brings the
company to the new heights.
Third generation Mr. Amrit Singh Matharu is very keen to get the
company up to a higher mark. He has done his masters from abroad and now
providing his creative skills to enhance the business growth and development.

Literature Review of R-Tek

Infrastructure
They have a well constructed infrastructure that is built in a wide area. Our
infrastructure is equipped with sophisticated and latest machineries. The
manufacturing unit is segregated into various departments such as research and
development, quality assurance, production department and packing department,
so that the business can be carried out in a synchronized manner. Our
infrastructure is capable of meeting the bulk needs of the customers.
Infrastructure is segregated into following units:-
Quality Testing
Production
Research & development
Logistics
Inventory and warehouse
Quality Testing: - The Company has its whole focus on quality. The quality testing
department helps the company to check the quality of the product as it measures the
quality so that the product can be produced according to the quality the customer
wish. Their prime motive is to provide exclusive and superior quality products to
our clients. For this, they procure products from trusted and reliable vendors.
Quality being the most crucial factor has helped them in developing a distinct
position in the market. The quality analysts ensure that the end product is free from
all kinds of defects. In order to maintain the uniform size of goods, they store and
label them. They conduct regular tests to determine the quality of products.
The products are checked on the following parameters of quality:-
Durable finish
Efficiency
Long working life
Performance

Product Range
On the strength of its expertise in the development and manufacturing
components R-Tek has explored new horizons to provide diverse range of
products.


Plastic Components


Headlight Glass


Organizational Chart
Departments
The researcher encompassed the study of four departments namely Accounts and
Administration, Designing, Production and Marketing. The basis for
departmentalization was functional.
ACCOUNTS AND ADMINISTRATION DEPARTMENT
This department is headed by Balwinder Singh. Two executives assisted them. This
department is broadly concerned with the acquisition and use of funds by the
company. It also analyze, plan and control the company’s financial affairs.
Moreover, the in house administration of the company is also taken care of. It
includes maintenance of showroom and a look into the requirements and problems
of day to day administration. It also keeps a track of things with regard to civil
construction, architectural services, networking, project co-ordination, electrical
work, etc. It is also concerned with bank facility availed by the employees. Apart
from all these, it also takes into account the installation part at the customer site
after the dispatch of the product. In a nutshell this department deals with the
trouble shooting of any problem.

DESIGNING DEPARTMENT
This department is headed by Inderpal singh. Eight creative designers assist him.
The team of designer tailor makes the products according to the needs of the
customers. Two aspects namely affordability and aesthetics are focused upon. Major
activities undertaken in this department are as follows
Setting the normal design
According to the initial measurement told by the customer, a normal design is set.
Once the normal design is finalized by the customer, a designer accompanied by
marketing personnel visits the construction site and takes the final measurement.
Then according to it a design is set and the price quotations are made.
Setting the production designs.
When the deal is finalized and after receiving 50% of the amount from the
customer, the designers make the production design. This design clearly demarcates
the technicalities so that it becomes easier for the production personnel to
understand.
Innovative designs –
The team of designers also trigger out the brain cells to create innovative
designs.

Marketing Department: This department deals with springboard of all
activities. The department is headed by Mr. Sandeep Sharma. Eight
marketing executives assist him. Various activities like product packaging,
branding, advertisement and sales promotions are taken care under this.
Marketing department is assisted by two IT personals who help in online
advertising and Search Engine Optimisation (SEO).
Human Resource Department: This department is headed by Mr.
Tajinder Singh. He is assisted by 2 executives. Various aspects of HR are
taken care of :
Leave Facility: All employees are entitled to 12 days of casual leave
and 2 days of sick leave (monthly). In case of long leave, say more
than a week, one need to inform it 10-12 days before.
Recruitment: The company spells out its requirements to the
consultancies about the suitable candidates. Candidates are recruited
after proper training.
Training: A selected candidate is put on training for 15 days to 1
month. During this period, he is not given any individual project.
Job Rotation: Job rotation is adopted by the company so that there
is development of multi-faceted skills in vacancies and to cope up with
increasing work load.

Production Department : - This department is headed by Mr.
Abhishek Kumar. Four supervisors are in charge of four different activities
such as quality control, product analyzing, production and dispatching.
Quality Control:
This sub department is mainly concerned with the inspection of raw
materials. The raw materials are supplied mainly by four companies namely
Novapan, Spacewood, Bhutan Board and Nepal Board and Nuwood.
The raw materials obtained are with respected with regard to requirements
and specifications.
Product Analyzing :
This sub-department is mainly concerned with targeting and scheduling.
After receiving the production design, it targets as to when the work needs to be
completed and schedules the whole process. Again, after completion of
production process and before dispatch, the product is thoroughly inspected
here.
Production:
26 persons comprising of machine operators and helpers are involved in
this sub-department. It consists of five operations namely cutting, molding, edge
bending, boring and hot press and post formed.

Research & development: - Research and development (R & D) is a
process intended to create new or improved technology that can provide a
competitive advantage at the business, industry, or national level. Thus this
department is very much helpful to the company. Research and
development (R&D) consortia are formed by manufacturing companies, often with
the support of government, for the purpose of conducting shared research on new
technologies for the benefit of the consortium's member companies.
Inventory and warehouse: - As there is need to store the material in the
factory so warehouse help to store the material. The fully control on the inventory is
made by the company taking EOQ model in mind. So that the wastage of time could
be reduced and production moves as smoothly. Infrastructure is one of the reasons
that provide effective customization services to clients. Their bulk investments in the
infrastructure have ensured that it is equipped with all the requisites facilities in
various sections which are detailed as under:
In Designing Sector it has:
• 3D Scanner
• Intel. Xeon. Computer.
• Cad Cam Software.
In Plastic Moulding Section it has:
• Cincinnati Feromatic 80 Ton to 440.
• Water Chillers,
• Mould temperature controllers.
• Dehumidifiers
• Auto Loaders
In Pressure Die Casting section it has:

• Machines from 80 Tons to 250 Ton Capacity.
• For Tensile test we have UTM machine.
In Tool and Die section it has:
• Surface Grinder IDROMIN -600
• Tig Welding, Mig Welding
• Lathes
• Radial & Bench Drilling Machines.
• Vertical Milling H.M.T makes
• Hydraulic Planners.
• Diamond Polishing Machines.
• Lapping Machines.
• Complete Measuring Instruments.
Annual turnover:-
Up to US$ 0.25 Million (or up to Rs. 1 Crore Approx.) Export percentage: - up to 20%
Company USP Experienced R & D Department
Good Financial Position & TQM
Large Product Line
MAJOR MARKETS:-Australia/NZ , Indian Subcontinent, Caribbean ,East/Middle Africa, North Africa,
South/West Africa, South America, South/West Europe, South East Asia, North
America
Expansion Plan
Backed by the skilled team of professionals, they are planning to launch a new and
innovative range of Tail Lamps, Head Lights & Side Indicators in the replacement
of Indian bike market. The main thing is they are going to make bullet proof head
lights for bikes.
The company has done some marvelous jobs like dealing with some of leading
brands. We are dealing J.J.JONEX for Sports Die and Mould, INDIAN AIR
FORCE for Spare Parts, tool and die, Aluminum Casting, With EASTMAN
INDUSTRIES. They are dealing Injection Moulds, HERO CYCLE LTD.is buying
Tool and Die, EM CEE CEE SPORTS PVT LTD is dealing in Tool and Die. They
are enjoying a prestigious market all over the globe and working with a motive of
"Customer Satisfaction". Their priorities are maintaining of quality, accuracy,
competitive prices and professional work force.

Product Application
Due to premium quality products, they have achieved new hikes in the competitive
market. Their products are widely applauded for its special features and unmatched
quality. The products offered by them are widely used in many sectors. They cater
products to the sectors such as:-
Sports
Sanitary & Water supply
Indian Railways
Hand Tools
Electrical
Indian Defense
Automobile
Textile
Kitchen Ware
Agricultural

WHY R-TEK MOULD???
Their Products are known for accuracy in fitment and quality as
per standards.
State-of-the-art Plastic Moulding Infrastructure.
Excellent distribution network.
Completely safe packing with heavy ply cartoons and boxes to prevent
any kind of damage
Customer oriented services
Lenses are unbreakable and having no coloring effect.
They care for environment safety.
Their workshop is equipped with all safety norms.
M O U L D S E C T I O N
"Autocrat" is a reputed company since 1992, engaged in the manufacture
and supply of Automobile Parts, Bike Headlights Lens, Motorcycle Parts, Bike
Visor, Auto Parts, Visors, and other plastic products.
Committed to impeccable quality of products, timely delivery of
consignments and competitive pricing, they at Autocrat, have successfully earned a
name for us in the market place. With years of experience, their core values have
been innovated with continuous improvements. It is their mission to establish their
wide presence at every corner of the country and offer quality products at
competitive prices. They aim at achieving continued improvement in quality,
reliability, economy and safety so as to retain competitive edge and increase our
market share. The organization incorporates novels of changing technologies and
strives to manufacture the products that confirm to international standards.

Plastic Mould - R-TEK Mould
Make : R-TEK Mould
Model : 1995
Item : Plastic Mould
Part no : Sports T
Click to view large
-------------------------------------------------------------------------------------------------------------------------------------------
Plastic Injection die - R-TEK Mould
Make : R-TEK Mould
Model : 2001
Item : Plastic Injection die
Part no : Y-Cone Textile
Click to view large
-------------------------------------------------------------------------------------------------------------------------------------------
Tool & Die - R-TEK Mould
Make : R-TEK Mould
Model : 2011
Item : Tool & Die
Part no : Agriculture Plastic Part

Click to view large
-------------------------------------------------------------------------------------------------------------------------------------------
Mould design - R-TEK Mould
Make : R-TEK Mould
Model : 2005
Item : Mould design
Part no : Model
Click to view large
-------------------------------------------------------------------------------------------------------------------------------------------
Injection Mould - R-TEK Mould
Make : R-TEK Mould
Model : 2004
Item : Injection Mould
Part no : Battery box cap
Click to view large
Pressure die casting mould - R-TEK Mould

Make : R-TEK Mould
Model : 2010
Item : Pressure die casting mould
Part no : grinder front
Click to view large
-------------------------------------------------------------------------------------------------------------------------------------------
Tool & Die - R-TEK Mould
Make : R-TEK Mould
Model : 2004
Item : Tool & Die
Part no : Battery Both Mould
Click to view large
-------------------------------------------------------------------------------------------------------------------------------------------
Injection Mould - R-TEK Mould
Make : R-TEK Mould
Model : 2001
Item : Injection Mould
Part no : Fork die
Click to view large
----------------------------------------------------------------------------------------------------------------------------------

---------
Pressure die casting mould - R-TEK Mould
Make : R-TEK Mould
Model : 2010
Item : Pressure die casting mould
Part no : Foot Rest design
Click to view large
P R O D U C T O F R - T E K
Mould design - R-TEK Mould (MODEL-2005)
Injection Mould - R-TEK Mould (MODEL-2004)
Pressure dies casting mould - R-TEK Mould (MODEL-2010)-
Unbreakable Headlight lens – Bajaj (MODEL- Pulsar Dtsi Digital)
Unbreakable Headlight lens - Hero Honda (MODEL- Splendor plus)
Unbreakable Headlight lens – Honda (MODEL- Activa)
Unbreakable Headlight lens - Hero Honda (MODEL- passion)
Unbreakable Headlight lens – Bajaj (MODEL- Platina)
Unbreakable Headlight lens – Bajaj (MODEL- Discover)
Unbreakable Headlight lens - Headlight lens- (MODEL- CT 100)

Bike head glasses
To provide the better head light solution, we are offering the superior quality of
Pulsar headlight Glass and we use the fine quality of raw materials to manufacture
these products. The design of these products is such that they can easily fit into
Pulsar. Applicability of these products is in various automobile industries and
service centers. Quality of the products is checked in various parameters to meet the
requirements of our clients.
Features:
On time delivery.
Exact fittings.
1. Long serving life. Visor glass – Baja (MODEL- pulsar)
2. Unbreakable Visor glass – Baja (MODEL- Discover Dtsi)
3. Unbreakable Visor glass - Hero Honda (MODEL- Super Splendor)
4. indicator glass - Hero Honda (MODEL- Splendor Plus)
5. indicator glass – Honda (MODEL- Activa old model)
Plastic Mould - R-TEK Mould (MODEL-1995)
Fabricated under the supervision of well qualified and experienced professionals,
our products are acclaimed for their outstanding attributes, such as dimensional
accuracy, precise design and reliable service life. We have developed a state-of-the-
art infrastructure that aids us in efficiently meeting all our business objectives. Our
Tool and Die manufacturing facility is furnished with Vertical Machining Centers,
Precision Surface Grinders, E.D.M. and complete conventional tool room machines.
An ISO 9001:2008 Certificate has been endowed to us to complete target from
concept to finished Product we have 3D Scanner, Cad-Cam Software. We consider
What they do to make mould Precision?

The function of mould, Type of mould, Flow of plastic melt, Air vents, Clamping
force required, Feeding balance, Contact of parting line, Runner design which
maximize efficiency in both raw material use and energy consumption in molding,
Corrosion resistantDurable,Precise dimension. We use material for moulds;
P-20, H-11, H-13, EN-31. Or as per customer requirement.
Standard ejector pins.
Standard Springs.
Standard Sprue bush
Standard Pillar bushes for our tool & die.
Tool & Die - R-TEK Mould (MODEL-2011)-
Our company is engaged in Tool & Die Profession since 1985.In tool & die we are
leading organization in the regional ISO 9001; 2008 has been awarded us & we are
committed to do as Standard. While designing a mould we consider;
The function of mould
Type of mould
Flow of plastic melt
Air vents
Clamping force required.
Feeding balance
Contact are of parting line
Runner design which maximize efficiency in both raw material use and
energy consumption in moulding.
Corrosion resistant
Durable
Precise dimensions

Head light glass
Being a well known manufacturer, we are engaged in manufacturing and
distributing the superior quality of Headlight Glass that are manufactured using the
fine quality of raw materials. We offer these products in various shapes and sizes to
meet the requirements of our clients. The array of products that are offered by us
includes Passion Head Glass, Ct 100 Head Glass, Pulsar Head Glass, Bajaj Platina
Head Glass, Activa Head Glass and Bajaj Discover Head Glass. (Unbreakable
Glasses)
Injection mould
Our expert teams are engaged in manufacturing and supplying the best quality of
Hot Runner Plastic Injection Mould. To manufacture these products, we use the
premium quality of plastic steel (P20) that make our products to last for longer
period of time. The design of these products is such that they provide the accurate
shape to plastics. Applicability of these products is in various industries such as
automobile electrical, textile, sports Indian defence and agriculture.
Features:-
Sturdy design
Smooth finishing
Minimum maintenance
Visor glass
Our motorcycle visor glasses are made from high quality plastic granules. This part
is unbreakable, Orignal colour, no decolouration effect and easy in fittment.Our
visor glass is as good as OEM.

R - T E K T E A M
They owe their success to dedicated and constant efforts of their proficient team.
They have vast knowledge of concern field and work with common objective of
providing utmost satisfaction to their clients. Due to their dedicated efforts they
have gained a distinct edge in the competitive market.
Team comprises of:-
Skilled employees
Quality analyst
Marketing personnel
R & D personals
QUALITY ASSURANCE OF R-TEK
An ISO 9001: 2008 Certificate has been awarded to them and they are working as per
ISO norms. With such equipped unit they are capable of meeting the mounting
demand of their customers within the given time frame. They keep in mind the safety of
their work team. They follow safety norms.
An ISO 9001:2008 Certificate has been endowed to R-TEK and they are in process
of getting TS 16949.
Quality Assurance of R-Tek Mould
R-Tek Mould is an ISO 9001:2008 certified company. They have a well equipped
unit which is capable of producing quality products thereby meeting the mounting

demand of their customers within the given time frame. They keep in mind safety of
their work team.
ISO 9001:2008
ISO 9001:2008 specifies requirements for a quality management system where an
organization:-
needs to demonstrate its ability to consistently provide product that meets
customer and applicable statutory and regulatory requirements, and
Aims to enhance customer satisfaction through the effective application of the
system, including processes for continual improvement of the system and the
assurance of conformity to customer and applicable statutory and regulatory
requirements.

All requirements of ISO 9001:2008 are generic and are intended to be applicable to
all organizations, regardless of type, size and product provided.
Where any requirement(s) of ISO 9001:2008 cannot be applied due to the nature of
an organization and its product, this can be considered for exclusion.
Where exclusions are made, claims of conformity to ISO 9001:2008 are not
acceptable unless these exclusions are limited to requirements within Clause 7, and
such exclusions do not affect the organization's ability, or responsibility, to provide
product that meets customer and applicable statutory and regulatory requirements.
TS 16949
ISO/TS16949:2002 , the technical specification, was approved and issued in
March 2002, as an automotive sector-specific QMS set of requirements which
uses ISO 9001:2000 (verbatim) as its base.

It replaced ISO/TS16949:1999 based on ISO 9001:1994, and is intended to be an
alternative to QS-9000:1998 and other national automotive OEM supplier
requirements. (See QS-9000:1998 Sanctioned Interpretations released for July 1,
2002, at www.QS-9000.org ).
Corporate Social Responsibility
R-TEK recognizes the importance for corporate social responsibility with its
partners and senior management reaching the goal in a co-ordinate and
committed fashion. They know that there is a need to maintain the highest level
of professional integrity with regard to their clients, staff and professional

regulators, along with others with whom they interact. Their work relationship
is transparent and managed with a view to guarantee personal development of
each employee and recognition for the deserving employees.
The health and safety of their employees is extremely
important and they take every measure to make R-TEK a perfect place to work
offering a cordial working environment. R-TEK specific labour and health &
safety commitments have been formalized in its “Health, Safety and Social
Policy”, which has been communicated to all R-TEK’s employees, to Suppliers
and is hereby published for External Community’s convenience.
They believe that helping the local community is not just something
they choose to do but is actually an important part of business.
R-TEK conscious efforts to monitor the impacts of its operations on
the environment and is committed to further reduce them and to be nominal.
Their objective is to combine the lower environmental impacts with operational
efficiency and cost saving. The manufacturing processes are regularly
monitored, with specific attention paid to energy consumption for which specific
programs are set to increase the efficiency and reduced the negative impact on
nature.
Company Profile
Company Name: R-Tek Mould
Office and Works: Street No. 7 1/2, Hargobind Nagar, Industrial Area - C, Ldh.

Email: [email protected]
Website: www.rtekmould.com, www.autocrat.co.in
Business Type: Manufacturer, Exporter, Service Provider
Year of Establishment: 1985
Annual Turnover: Up to Rupees 1 Crore (approx.)
Export Percentage: Up to 20 per cent
Primary Competitive Advantage:
Experienced Research and Development Department
Good Financial Position and Total Quality Management
Large Product Line
No. of Employees: 50-60 People
Major Markets: Indian Subcontinent, Australia, New Zealand, East Asia, North
Africa, Caribbean
CONTENTS

PREFACE……………….
INTRODUCTION OF FINANCIAL ANALYSIS
OBJECTIVES OF FINANCIAL ANALYSIS
IMPORTANCE OF FINANCIAL ANALISIS
COMPANY PROFILE
HISTORY OF COMPANY
MISSION OF COMPANY
TURNOVER REPORT OF COMPAY
RESEARCH METHODOLOGY:-INTRODUCTION
OBJECTIVES OF STUDY
INTRODUCTION

FINANCIAL ANALYSIS
RATIO ANALYSIS
HYPOTHESIS
RESEARCH PROCESS
OBSERVATION
ANALYSIS OF DATA
ANALYSIS OF DATA $ DATA INTERPRETATION
OBJERVATION & CONCLUSION
SUGGESTIONS AND LIMITATIONS
BIBLOGRAPHY
PREFASE

The project assigned to me was to study the financial health of any organization in
the country. I decided to choose one of India’s biggest companies in a sector that has
rapidly grown over the last few years and a company where leaders like Mr.
Ravinder Singh are made, or rather, a company that has been also made by Mr
Ravinder Singh.
Through a through industry and a company analysis, I am to understand the
external factors influencing the company and its decision making. Later, I try and
evaluate the various ratios to appreciate their impact on company’s performance
over the last three years.
The financial statements of last three years are identified, along with the analysis of
various components of the company vis-à-vis other competitors with the same
segment.
Critical decisions of distributing dividends, Issue of bonus debentures and other
current news are analyzed and their impact on the bottom line of the company is
assessed.
As a benchmark, I finally, I also study the accounting policy of the company is also
studied with respect to valuation of Fixed Asset, Inventory, Investment and
Employee related liabilities for the FY 2011.

OBJECTIVES OF STUDY
To have a deeper insight into the comparative study of R-TEK
mould using ratios.
To know about the past and present trends as well as predict
about the future.

RESEARCH METHODOLOGY
Research problem:
To access the comparative financial position of the company and suggest remedial
measure to improve the financial position in future.
Research objective:
The main objective of this project is to have a deeper insight
into the financial position if the company and make
comparative analysis of balance sheet and profit and loss
account of the company with the major competitor of the
market
.
The study will help us to know about the past and present
trends as well as predict about the future.

Research design:
Research design is a best plan or a model for the collection of formal information.
Descriptive type of research has been used; it is concerned with describing the characteristics of a particular individual or a group.
Collection of data :
Basically there are two sources through which data is collected i.e., primary and
secondary sources.
But in my project report only secondary data is used.
Secondary data :
Secondary data means data that is already available i.e., they refer to that data
which have already been collected. This method involves the study of various
documents available in the organization which may
Contain information required for the study. It includes the following documents:
Annual report and financial statement of the company.
FINANCIAL ANALYSIS
Financial analysis refers to an assessment of the viability, stability and profitability
of a business sub-business or project.
It is performed by professionals who prepare reports using ratios that make use of
information taken from financial statements and other reports. These reports are
usually presented to top management as one of their bases in making business
decisions. Based on these reports, management may:
Continue or discontinue its main operation or part of its business;
Make or purchase certain materials in the manufacture of its product;
Acquire or rent/lease certain machineries and equipment in the production of its
goods;
Issue stocks or negotiate for a bank loan to increase its working capital.
Make decisions regarding investing or lending capital;
Other decisions that allow management to make an informed selection on
various alternatives in the conduct of its business.

INTRODUCTION OF FINANCIAL ANALYSIS
Financial statements are prepared primarily for decision-making. They
play a dominant role in setting the framework of managerial decisions. But the
information provided in financial statements is not an end in itself as no meaningful
conclusion can be drawn from these statements alone. The information provided in
financial statements is of immense use in making decisions through analysis and
interpretation of financial statements. Financial analysis is the process of identifying
the financial strength and weaknesses of the firm by properly establishing
relationship between the items of balance sheet and profit and loss account.’ There
are various methods or techniques used in analyzing financial statements, such as
comparative statements, trend analysis, common-size statements, schedule of
changes in working capital, funds flow and cash flow analysis, cost-volume-profit
analysis and ratio analysis.

MEANING OF
FINANCIAL ANALYSIS
The term ‘financial analysis’, also known as analysis
and interpretation of financial statements’, refer to the process of determining
financial strength and weaknesses of the firm by establishing strategic relationship
between the items of the balance sheet, profit and loss account and other operative
data. Financial statement analysis is largely a study of relationship among the
various financial factors in a business as disclosed by a single set-of statements and
study of the trend of these factors as shown in a series of statements”.
The purpose of financial analysis is to diagnosis the information
contained in financial statements so as to judge the profitability and financial
soundness of the firm. Just like a doctor examines his patient by recording his body
temperature, blood pressure, etc before making a conclusion regarding the illness
and before giving his treatment, a financial analyst analysis the financial statements
with various tools of analysis before commenting upon the financial health or
weakness of an enterprise. By financial statements we mean two statements:-
(1) Profit ant loss account or Income Statement.
(2) Balance sheet or Position Statement.

OBJECTIVES
FINANCIAL ANALYSIS
These are main objectives of financial analysis:-
(1) Measuring the profitability: - The main objective of a business is to earn a
satisfactory return on the funds invested in it. Financial analysis helps in
ascertaining whether adequate profits are being earned on the capital
invested in the business or not. It also helps in knowing the capacity to pay
the interest and dividend.
(2) Indicating the trend of Achievement: - Financial Statements of the previous
years can be compared and the trend regarding various expenses, purchases
sales, gross profit etc. can be ascertained. Values of assets and liabilities can
be compared and the future prospects of the business can be envisaged.
(3) Assessing the growth potential of the business:- The trend and other analysis
of the business provides sufficient information indicating the growth
potential of the business
(5) Assessing the growth potential of the business:-The trend and other analysis of
the business provide Sufficient information indicating the growth potential of
the business.
(6) Assess solvency of the firm: - The different tools of an analysis tell us weather
The firm has sufficient funds to meet its short term and long term liabilities.

Goals
Financial analysts often assess the firm's:
1. Profitability - Its ability to earn income and sustain growth in both short-
term and long-term. A company's degree of profitability is usually based on the
income statement, which reports on the company's results of operations;
2. Solvency - its ability to pay its obligation to creditors and other third
parties in the long-term;
3. Liquidity - its ability to maintain positive cash flow, while satisfying
immediate obligations; Both 2 and 3 are based on the company's balance sheet, which
indicates the financial condition of a business as of a given point in time.
4. Stability- The firm’s ability to remain in business in the long run, without
having to sustain significant losses in the conduct of its business. Assessing a
company’s stability requires the use of the income statement and the balance sheet,
as well as other financial and non-financial indicators.

Methods
Financial analysts often compare financial ratios (of solvency, profitability, growth,
etc.):
Past Performance - Across historical time periods for the same firm (the
last 5 years for example),
Future Performance - Using historical figures and certain mathematical
and statistical techniques, including present and future values, This extrapolation
method is the main source of errors in financial analysis as past statistics can be
poor predictors of future.
Comparative Performance - Comparison between similar firms.
These ratios are calculated by dividing a (group of) account balance(s), taken from
the balance sheet and / or the income statement, by another, for example:
Net income / equity = return on equity (ROE)
Net income / total assets = return on assets (ROA)
Stock price / earnings per share = P/E ratio
Comparing financial ratios is merely one way of conducting financial analysis.
Financial ratios face several theoretical challenges
They say little about the firm's prospects in an absolute sense. Their insights about
relative performance require a reference point from other time periods or similar
firms
They say little about firm’s prospects in an absolute sense. Their insights about
relative performance require a reference point from other time periods or
similar firms.
One ratio holds little meaning. As indicators, ratios can be logically interpreted
in at least two ways. One can partially overcome this problem by combining several
related ratios to paint a more comprehensive picture of the firm's performance.
Seasonal factors may prevent year-end values from being representative. A
ratio's values may be distorted as account balances change from the beginning to
the end of an accounting period. Use average values for such accounts whenever
possible.
Financial ratios are no more objective than the accounting methods employed.
Changes in accounting policies or choices can yield drastically different ratio values.
They fail to account for exogenous factors like investor behavior that are not
based upon economic fundamentals of the firm or the general economy
(fundamental analysis).
Financial analysts can also use percentage analysis which involves reducing a series
of figures as a percentage of some base amounts. For example, a group of items can
be expressed as a percentage of net income. When proportionate changes in the
same figure over a given time period expressed as a percentage is known as
horizontal analysis. Vertical or common-size analysis reduces all items on a
statement to a “common size” as a percentage of some base value which assists in
comparability with other companies of different sizes. Another method is
comparative analysis. This provides a better way to determine trends. Comp-motive
analysis presents the same information for two or more time periods and is
presented side-by side to allow for easy analysis.

Types of Financial Analysis
There are various types of financial analysis into different categories. But
we are classified financial statements into two categories
(1) ON THE BASIS OF MATERIAL USED
(1) External Analysis
(2) Internal Analysis
(2) ON THE BASIS OF MODUS OPERANDI
(1) Horizontal Analysis
(2) Vertical Analysis

METHODS OF
FINANCIAL ANALYSIS
The analysis and interpretation of financial statements is
used to determine the financial position and result of operations as well. A number
of methods and devices are used to study the relationship between different
statements.
The following methods of analysis are generally used:
(1) Comparative statements
(2) Common – size statements
(3) Trend Analysis
(4) Fund flow statements
(5) Cash flow statements
(6) Ratio analysis

COMPARATIVE STATEMENTS
The comparative financial statements are statements of
financial position at different periods; of time. The elements of financial position are
shown in a comparative form so as to give an idea financial position at two or more
periods. Any statement prepared in a comparative form will be covered in
comparative statements. From practical point of view, generally two statements are
prepared in comparative form for financial analysis purposes. Not only the
comparison of the figure of two periods but also be relationship between balance
sheet and income statements enables an in depth study of financial position or
operative results. The comparative statements are show:
(1) Absolute figure (rupee amount)
(2) Change in absolute figure (increase or decrease in absolute figure)
(3) Absolute data in term of percentages.
(4) Increase or decrease of percentage.
The two comparative statements are:-
(1) Comparative Balance sheet
(2) Comparative Income statement

(1) COMPARATIVE BALANCE SHEET
The comparative balance sheet analysis is the study of
the trend of same items, group of items and computed item in two or more balance
sheets of the same business enterprise on different dates. The change in periodic
balance sheet items reflects the conduct of business.
The changes can be observed by comparison of the balance sheet at the beginning
and at the end of a period and these changes can help in forming an opinion about
the progress of an enterprise. The comparative balance sheet has two columns for
the data of original balance sheets. A third column is used to show increase in
figures. The fourth column may be added for giving percentages of increase or
decrease.
Guidelines for Interpretation of Comparative Balance Sheet
While interpretation Comparative Balance Sheet the interpreter is expected
to study the following aspects:
(1) Current financial position and liquidity position.
(2) Long – term financial position.
(3) Profitability of the concern

The following is the Balance Sheet of a concern of R-TEK MOULD
for the year 2010 and 2011. Prepare a comparative Balance Sheet
and study the financial position of a concern.
Balance Sheet As on 31st March
LIABILITIES Amount Amount ASSETS Amount Amount 2010 2011 2010 2011
CAPITAL
UNSECURED LOAN
SECURED LOANS(FROM BANK)
SECURED LOANS (FROM OTHERS)
SUNDRY CREDITOR
OTHER PROVISION
10,81,946.77
6,35,181.00
8,93,068.18
11,01,708.07
15,99,493.00
1,90,208.00
23,33,636.95
10,15,181.00
20,95,300.22
--------
19,65,313.60
75,802.08
FIXED ASSETS
CASH IN HAND
BANK BALANCE
SUNDRY DEBTORS
STORES/ CONSUMABLE
INVESTMENTS
RAW- MATERIAL
STOCK-IN- PROCESS
FINISHED GOODS
ADV.RECBLE IN CASH
DEPOSITS
BALANCE WITH REV. AUTHORITIES
20,29,970.23
71,739.73
42,270.91
16,86,141.40
25,300
49,000
2,89,750.00
10,88,550.00
42,800.00
---------
1,54,700.00
21,382.75
24,03,040.23
4,81,272.11
73,336.81
2,91,221.70
69,300
49,000.00
7,92,700.00
29,75,200.00
1,16,600.00
78,863.00
1,54,700.00
-----------

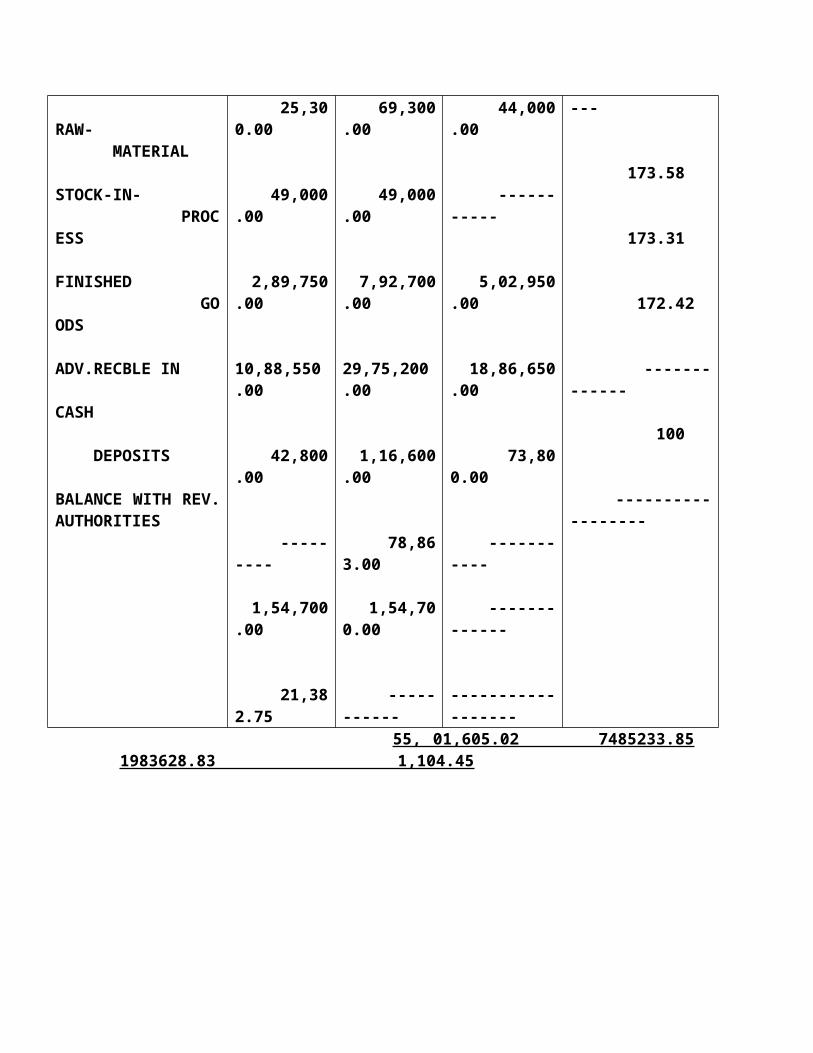
COMPARATIVE BALANCE SHEET
ASSETS 2010 2011 INCREASE/ DECREASE
PERCENTAGE
FIXED ASSETS
CASH IN HAND
BANK BALANCE
SUNDRY DEBTORS
STORES/ CONSUMABLE
INVESTMENTS
RAW- MATERIAL
STOCK-IN- PROCESS
FINISHED GOODS
ADV.RECBLE IN CASH
DEPOSITS
BALANCE WITH REV. AUTHORITIES
20,29,970.23
71,739.73
42,270.91
16,86,141.40
25,300.00
49,000.00
2,89,750.00
10,88,550.00
42,800.00
---------
1,54,700.00
21,382.75
24,03,040.23
4,81,272.11
73,336.81
2,91,221.70
69,300.00
49,000.00
7,92,700.00
29,75,200.00
1,16,600.00
78,863.00
1,54,700.00
-----------
3,73,070.00
4,09,532.38
31,065.90
-1394922.70
44,000.00
-----------
5,02,950.00
18,86,650.00
73,800.00
-----------
-------------
------------------
18.38
570.86
77.14
-82.73
173.91
----------
173.58
173.31
172.42
-------------
100
------------------ 55, 01,605.02 7485233.85 1983628.83 1,104.45

COMPARAIVE BALANCE SHEET
LIABILITIES 2010 2011 INCREASE/ DECREASE
PERCENTAGE
CAPITAL
UNSECURED LOAN
SECURED LOANS(FROM BANK)
SECURED LOANS (FROM OTHERS)
SUNDRY CREDITOR
OTHER PROVISION
10,81,946.77
6,35,181.00
8,93,068.18
11,01,708.07
15,99,493.00
1,90,208.005501605.02
23,33,636.95
10,15,181.00
20,95,300.22
--------
19,65,313.60
75,802.0874,85,233.85
12,51,690.95
3,80,000.00
1,20,22,322.04
--------------
365820..60
1,14,405.92 1983628.92
115.68
134.62
-----------
22.87
-60.15 601.72

INTERPRETATION:-
(1) The comparative balance sheet of company R-TEK reveals that during 2011
there has been increased in fixed assets of 3,73,070 i.e. 18.38% while capital has
been increased during 2011 12,51,690 i.e. 115.68%. This fact depicts that the policy
of the company is to purchase fixed assets from the long-term sources of finance
thereby not affecting the working capital.
(2) The current assets have been increased by 15, 53, and 078. 58 and cash are
also increased and liabilities are less increase compare to assets. Current liabilities
also have been less increase. This further confirms that the company has raised
long-term finances even for the current assets resulting into improvement in
liquidity position of the company.
(3) The overall financial position of the company is satisfactory.
(2) COMMPARATIVE
INCOME STATEMENT
The Income statement gives the results of the operations of a
business. The comparative income statement gives an idea of the progress of a
business over a period of a time. The change in absolute data in money value and
percentage can be determined to analyze the profitability of the business. Like
comparative balance sheet, income statement also has four columns. First two
columns give figures of various items for two years. Third and fourth columns are
used to show increase or decrease in absolute amounts and percentages respectively.

Guidelines for Interpretation of
Income Statements
The analysis and interpretation of income statement will involve the
following steps:
(1) The increase or decrease in sales should be compare with the increase or
decrease in cost of goods sold. An increase in sale will not be always meaning an
increase in profit. The amount of gross profit should be situated in the first step.
(2) The second step of analysis should be the study of operational profit. The
operating expenses such as office and administrative expenses, selling and
distribution expenses should be deducted from gross profit to find out operating
profit. An increase in operating profit will result from the increase in sale position
and control of operating expenses. A decrease in operating profit may be due to an
increase in operating expenses or decrease in sale.
(3)The increase or decrease in net profit will give an idea about the overall
profitability of the concern. Non-operating expenses such as interest paid, losses
from sale of assets, writing of deferred expenses, payment of tax, etc. decrease the
figure of operating profit. When all non-operating expenses are deducted from
operational profit, we get a figure of net profit.

The following information prepares a comparative Income Statement of R-TEK MOULD:-
2010 2011
SALES
COST OF GOODS SOLD
INDIRECT EXPENSES
RATE OF INCOME TAX
70,22,084.40
63,11,825.00
9,51,014.44
-------------
77,48,787.50
62,64,919.00
9,65,034.15
---------------

COMPARATIVE INCOME STATEMENT
PARTICULARS AMOUNT 2010
AMOUNT 2011
ABSOLUTECHANGES
PERCENTAGE %
SALES
LESS:- COST OF
GOODS SOLD
GROSS PROFIT
LESS:- INDIRECT
EXPENSES
PROFIT BEFORE
TAX
LESS:- INCOME
TAX
NET PROFIT
AFTER TAX
70,22,084.40
63,11,825.0014,91,173.60
9,51,014.44
5,40,160.00
----------
5,40,160.00
77,48,787.50
62,64,919.0014,83,868.27
9,65,034.15
5,18,834.20
----------
5,18,834.20
7,26,706.00
-46906.00 7305.33
14,020.00
21325.00
----------
21325.00
10.35
0.74 0.10 0.20
0.30
----------
0.30
INTERPRETATION:-
(1) The comparative income statement given above revel that there has been
increase in net sales of 10.35% while the cost of goods sold has decreased nearly by
0.74% thereby resulting in an decrease in gross profit of 0.10% . The indirect
expenses are increased by 0.20% and gross profit not sufficient to compensate for
the increase in indirect expenses. Net profit also decreased by 0.30%. It may be
conducted that not a sufficient progress in the company and the overall financial
position of the company is not good.

COMMON- SIZE STATEMENT
The common-size statements, balance sheet and income statement
are shown in analytical percentages. The are shown as percentage of total
assets, total liabilities are total sales. The total assets are taken as 100 and
different assets are expressed as a percentage of the total. Similarly, various
liabilities are taken as a part of total liabilities. These statements are also
known as component percentage or 100 percent statements because every
individual item is stated as a percentage of total 100. The short-coming in
comparative statements ant trend percentages where changes in items could
not be compared with the total have been covered up. The analyst is able to
assess the figure in relation to total value. The common-size statements may
be prepared in the following way:
(1) The total of assets or liabilities is taken as 100.
(2) The individual assets are expressed as a percentage of total assets 100
and different liabilities are calculated in relation to total liabilities. For
example, if total assets are rest. 5 laths and inventory value is Rs. 50000, then
it will be 10% of total assets [50000*100/500000].

(1) COMMON-SIZE BALANCE SHEET
A statement in which balance sheet items are expressed as the ratio of
each asset to total assets and the ratios of each liability are expressed as a ratio of
total liabilities is called common-size balance sheet. For example, following assets
are shown in a common-size balance sheet:
Rs. Percentage
Cash in hand and at bank 5,000 2.50
Sundry debtors 20,000 10.00
Stock 25,000 12.50
Land and building 50,000 25.00
Plant and machinery 1, 00,000 50.00
Total Assets: 2, 00,000 100.00
The total figure of assets rest. 2, 00,000, is taken as 100 and all other
assets are expressed as a percentage of total assets. The relation of each asset to total
assets is expressed in the statement. The relation of each liability to total liabilities is
similarly expressed.
The following is the Balance Sheet of a concern of R-TEK MOULD for the year 2010 and 2011. Prepare a common-size Balance Sheet and study the financial position of a concern.
Balance Sheet As on 31st March
LIABILITIES Amount Amount ASSETS Amount Amount 2010 2011 2010 2011
CAPITAL
UNSECURED LOAN
SECURED LOANS(FROM BANK)
SECURED LOANS (FROM OTHERS)
SUNDRY CREDITOR
OTHER PROVISION
10,81,946.77
6,35,181.00
8,93,068.18
11,01,708.07
15,99,493.00
1,90,208.00
23,33,636.95
10,15,181.00
20,95,300.22
--------
19,65,313.60
75,802.08
FIXED ASSETS
CASH IN HAND
BANK BALANCE
SUNDRY DEBTORS
STORES/ CONSUMABLE
INVESTMENTS
RAW- MATERIAL
STOCK-IN- PROCESS
FINISHED GOODS
ADV.RECBLE IN CASH
DEPOSITS
BALANCE WITH REV. AUTHORITIES
20,29,970.23
71,739.73
42,270.91
16,86,141.40
25,300
49,000
2,89,750.00
10,88,550.00
42,800.00
---------
1,54,700.00
21,382.75
24,03,040.23
4,81,272.11
73,336.81
2,91,221.70
69,300
49,000.00
7,92,700.00
29,75,200.00
1,16,600.00
78,863.00
1,54,700.00
-----------

COMMON-SIZE BALANCE SHEET
ASSETS 2010 PERCENTAGE 2011 PERCENTAGE
FIXED ASSETS
CASH IN HAND
BANK BALANCE
SUNDRY DEBTORS
STORES/ CONSUMABLE
INVESTMENTS
RAW- MATERIAL
STOCK-IN- PROCESS
FINISHED GOODS
ADV.RECBLE IN CASH
DEPOSITS
BALANCE WITH REV. AUTHORITIES
20,29,970.23
71,739.73
42,270.91
16,86,141.40
25,300
49,000
2,89,750.00
10,88,550.00
42,800.00
---------
1,54,700.00
21,382.7555,01,605.02
36.90
1.30
0.77
30.65
0.46
0.89
5.27
19.78
0.78
2.81
0.39 100
24,03,040.23
4,81,272.11
73,336.81
2,91,221.70
69,300
49,000.00
7,92,700.00
29,75,200.00
1,16,600.00
78,863.00
1,54,700.00
-----------74,85,233.85
32.10
6.43
0.98
3.89
0.92
0.65
10.59
39.75
1.56
1.05
2.07
----------------------- 100

COMMON-SIZE BALANCE SHEET
LIABILITIES 2010 PERCENTAGE 2011 PERCENTAGE
CAPITAL
UNSECURED LOAN
SECURED LOANS(FROM BANK)
SECURED LOANS (FROM OTHERS)
SUNDRY CREDITOR
OTHER PROVISION
10,81,946.77
6,35,181.00
8,93,068.18
11,01,708.07
15,99,493.00
1,90,208.0055,01,605.02
19.67
16.23
20.00
29.07
3.46 100
23,33,636.95
10,15,181.00
20,95,300.22
--------
19,65,313.60
75,802.08 74,85,233.85
31.17
1.56
8.63
---------------
26.25
1.01 100

INTERPRETATION
(1)

COMMON-SIZE INCOME STATEMENT
The items in income statement can be shown as percentage
of sales to show the relation of each item to sales. A significant relationship can be
established between items of income statement and volume of sales. The increase in
sales will certainly increase selling expenses and not administrative or financial
expenses. In case the volume of sales increases to a considerable extent,
administrative and financial expenses may go up. In case the sales are declining, the
selling expenses should be reduced at once. So, a relationship is established between
sales and other items in income statement and this relationship is helpful in
evaluating operational activities of the enterprise.
The following information prepares a common-size Income Statement of R-TEK MOULD:-
2010 2011
SALES
COST OF GOODS SOLD
INDIRECT EXPENSES
RATE OF INCOME TAX
70,22,084.40
63,11,825.00
9,51,014.44
-------------
77,48,787.50
62,64,919.00
9,65,034.15
---------------

COMMON-SIZE INCOME STATEMENT
PARTICULARS AMOUNT 2010
PERCENTAGE %
AMOUNT 2011
PERCENTAGE
SALES
LESS:- COST OF
GOODS SOLD
GROSS PROFIT
LESS:- INDIRECT
EXPENSES
PROFIT BEFORE
TAX
LESS:- INCOME
TAX
NET PROFIT
AFTER TAX
70,22,084.40
63,11,825.0014,91,173.60
9,51,014.44
5,40,160.00
----------
5,40,160.00
100.00
78.77 21.23
13.54
7.69
------
7.69
77,48,787.50
62,64,919.0014,83,868.27
9,65,034.15
5,18,834.20
----------
5,18,834.20
100.00
80.85 19.15
12.45
6.70
-------
6.70

INTERPRETATION
(1) The sale has been increased in 2011 as compare to 2010 but
percentage of gross profit to sales has gone down.
(2) The decrease in cost of sales as a percentage of sales has down the
profitability from 21.23 to 19.15.
(3) The indirect expenses are increased in 2011 as compare to 2010
So ratio is also goes down from 13.54% to 12.45%.

TREND ANALYSIS
The financial statement may be analyzed by computing
trends of series of information. This method determines the direction upwards or
downwards and involves the computation of the percentage relationship that each
statement item bears to the same item in base year. The information for a number of
years is taken up and one year, generally the first year, is taken as a base year. The
figure of base year are taken as 100 and trend ratios for
Other years are calculated on the basis of base year. The analyst is able to see the
trend of figures, whether upward or downward. For example, if sales figures for the
year 2003 to 2008 are to be studied, then sales of 2003 will be taken as 100 and the
percentage of sales for all other will be calculated in relation to the base year, i.e.,
2003 suppose the following trends are determined.
2003 100
2004 120
2005 110
2006 125
2007 135
2008 140
The trend of sales shows that sales have been more in all the years since 2003.

Procedure for Calculating Trends
(1) One year is taken as a base year. Generally, the first or last year taken as a
Base year.
(2) The figure of base year is taken as 100.
(3) Trend percentages are calculated in relation to base year. If a figure in other
year is less then the figure of base year the trend percentage will be less then
100 and it will be more then 100 if figure is more then base year figure. Each
year‘s figure is divided by the base year’s figure.
The interpretation of trend analysis involves a cautious study.
The mere increase or decrease in trend percentage may give misleading
Results if studied in isolation. An increase of 20% in current assets may be
Treated favorable. If this increase in current assets is accompanied by an
Equivalent increase in current liabilities, then this increase will be
unsatisfactory. The increase in sales may not increase profits if the cost of
Production has also gone up.
FUNDS FLOW STATEMENT
The basic financial statements, the balance sheet and profit and loss
account or income statement of business, reveal the net effect of the various
transactions on the operational and financial position of the company. The balance
sheet gives a summary of the assets and liabilities of an undertaking at a particular
point of time. It reveals the financial status of the company. The assets side of a
balance sheet shows the deployment of resources of an undertaking while the liabilities
side indicates its obligations the manner in which these resources were obtained. The
profit and loss account reflects the results of the business operations for a period of
time. It contains a summary of expenses incurred and the revenue realized in an
accounting period.
THE FUNDS FLOW STATEMENT IS A STATEMENT WHICH
SHOWS THE MOVEMENT OF FUNDS AND IS A REPORT OF THE FINANCIAL
OPERATIONS OF THE BUSINESS UNDERTAKING. IT INDICATES VARIOUS
MEANS BY WHICH FUNDS WERE OBTAINED DURING A PARTICULAR
PERIOD AND THE WAYS IN WHICH THESE FUNDS WERE EMPLOYED. IN
SIMPLE WORDS, IT IS A STATEMENT OF SOURCES AND APPLICATIONS OF
FUNDS.

CASH FLOW STATEMENT
Cash plays a very important role in the entire economic life of a
business. A firm needs cash to make payment to its suppliers, to incur day-to-day
expenses and to pay salaries, wages, interest and dividend, etc. In fact, what blood is to
a human body, cash is to business enterprises? It is very essential for a business to
maintain an adequate balance of cash. But many a time a concern operates profitably
and yet it becomes very difficult to pay taxes and dividends. This may be because
(1) Although huge profit have been earned yet cash may not have been received or
(2) Even if cash have been received, it may have drained out (used) for some other
purpose. This movement of cash is of vital important to the management.
CASH FLOW STATEMENT IS A STATEMENT WHICH
DESCRIBES THE INFLOWS (SOURSES) AND OUTFLOWS (USES) OF CASH
AND EQUIVALANTS IN AN ENTERPRISE DURING A SPESIFIED PERIOD OF
TIME. SUCH A STATEMENT ENUMERATES NET EFFECTS OF VARIOUS
BUSINESS TRANSACTIONS ON CASH AND ITS EQUIVALANENTS AND TAKES
INTO ACCOUNT RECEIPT AND DISBURSEMENT OF CASH. A CASH FLOW
STATEMENT SUMMARIESES THE CAUSES OF CHANGES IN CASH POSITION
OF A BUSINESS ENTERPRISES BETWEEN DATES OF TWO BALANCE
SHEETS.

RATIO ANALYSIS
Meaning
Ratio is an expression of relationship of one figure with another it may be defined as
the relationships or proportion that one amount bears to other financial ratios
express arithmetical relationships between two figures or two groups of figures
which are related to other.
Ratio analysis is a technique of analysis and interpretation of financial
statements. It is the process of establishing and interpreting various ratios for
helping in making certain decisions. However, ratio analysis is not an end in itself. It
is only a means of better understanding of financial strength and weakness of a
firm.

OBJECTIVE OF RATIO ANALYSIS
Ratio analysis is the important technique of financial analysis. It can be called as the
heart of financial analysis. The way, in which we estimate the health of our body
through heart beats, similarly through the technique of ratio analysis, estimation
can be made regarding the financial position of a business concern. The main
objectives of ratio analysis are:
1. Relative study: The facts and figures expressed in financial statements if
studied in isolation, may make no sense but if two related items are studied in
comparison to the others may suggest something significant.
2. Conciseness: - with the help of Ratio, large figures or group of figures are
presented precisely so as to make them understandable.
3. Analysis of business activities: On the basis of the comparative study of
ratios, results related to the progress or failure of a business concern can be easily
obtained.
IMPORTANCE OF RATIO ANALYSIS
Ratio analysis is the most important tool of financial analysis:
1. Helpful to management: The ratio analysis is proves to be of significant
value to the management in the process of discharge of its elementary functions such
as planning, co-ordination, communication and control.
2. Helpful in trend analysis: The ratio analysis facilitates a firm to consider the
time dimension into account, i.e. whether the financial position of a firm is showing
any improvement or deterioration over years. This is affected through the use of
trend analysis. With the help of the financial analysis one can ascertain whether the
trend is favorable or unfavorable.
3. Helpful in communication: Through ratio analysis it is possible to know the
changes that had taken place in business between two periods.
4. Useful in comparative study: Ratio analysis is also helps in comparative
study. It helps to make an inter-firm comparison either between the different
departments of a firm or between two firms employed in the identical types of
business or between the same firms.

5. Helpful in determining the standards: Keeping in mind the old ratios and
present operating efficiency, the standard can be fixed. In this way ratio analysis is
considered to be the essential part of budgetary control and standard costing.
6. Helpful in effective control: On the basis of ratios, by establishing standards
the effective control can be exercised upon the activity of the firm.
On the comparison of standard ratios with actual ratios adverse financial position
can be found out and corrective.
7. Helpful in evaluation of financial soundness: with the help of liquidity,
solvency, profitability and capital gearing ratios is detailed information can be
gathered related to financial soundness of any institutions?

LIMITATIONS OF RATIO ANALYSIS
1. Limited Use of a Single Ratio: A single ratio in itself is meaningless; it does
not furnish a complete picture. In other words, one single ratio used without
reference to other ratios may produce misleading results. Hence, a number of
financial statements. For example, to test the Liquidity, make use of all the
Liquidity ratios.
2. Ignores Qualitative Factors: The ratio facilitates wholly quantitative
analysis only. The qualitative factors which are so important for the successful
functioning of the organization are completely ignored and hence, whatever
conclusion drawn may get distorted. For example, the grant of credit to an
enterprise may depend more upon the character and capacity of the owner than on
the conclusion drawn from the so called Ratio analysis.
3. Only a part of the information needed in the process of decision
taking: It should also be remembered that ratio analysis helps in providing only a
part of the information needed in the process of decision making.
4. Possibility of window-dressing: Ratio depends on figures of the financial
statements. But in most cases, the figures are window dressed. As a result, the
correct picture cannot be drawn up by the ratio analysis.

5. Ignores Qualitative Factors: The ratio facilitates wholly quantitative
analysis only. The qualitative factors which are so important for the successful
functioning of the organization are completely ignored and hence, whatever
conclusion drawn may get distorted. For example, the grant of credit to an
enterprise may depend more upon the character and capacity of the owner than on
the conclusion drawn from the so called Ratio analysis.
6. Limited Use of a Single Ratio: A single ratio in itself is meaningless; it does
not furnish a complete picture. In other words, one single ratio used without
reference to other ratios may produce misleading results. Hence, a number of
financial statements. For example, to test the Liquidity, make use of all the
Liquidity ratios.

Different meaning to accounting terms
Comparisons are also made difficult due to differences in definition of
various terms used in computing ratios.
1. Variations in Accounting Policies: Comparison between two variables
proves worth provided their basis of valuation is identical but in reality it is not
possible.
2. Difficulty in Evolving Standard Ratio: It is very difficult to ascertain the
normal or standard ratio in order to make proper comparison.
3. Historical Analysis: Ratios delve in the past as they are obtaining from the
financial statements which are considered to be historical documents. A financial
analyst is more concerned the probable happenings in the future rather than those
in the past.
4. Effect of price changes are not taken into account: A change in the price
level can seriously affect the validity of comparisons of ratios computed for different
time periods.
5. Personal bias: Ratios are only means of financial analysis and not end in itself.
They can be affected with the personal ability and bias of the analyst.

CLASSIFICATION OF FINANCIAL RATIOS
1. Liquidity Ratios
2. Capital Structure Ratios
3. Activity or Turnover Ratios
4. Profitability or Profit Earning Capacity

ANALYSIS AND INTERPRTATION
KEY RATIOS:-
(1) CURRENT RATIO
(2) LIQUID RATIO
(3) STOCK TURNOVER RATIO
(4) ABSOLUTE LIQUID RATIO
(5) GROSS PROFIT RATIO
(6) NET PROFIT RATIO
(7) FIXED ASSETS TURNOVER RATIO
(8) TOTAL ASSETS TURNOVER RATIO
(9) WORKING CAPITAL TURNOVER RATIO

(1) CURRENT RATIO:-
Current ratio is defined as an indicator of short-term debt paying ability of a
company. It is determined by dividing current assets by current liabilities. The
higher the ratio, it is believed that, the more liquid the company.
CURRENT RATIO = CURRENT ASSETS
CURRENT LIBILITIES
Here we observe that the current ratio of R-TEK MOULD is increase in
FY 2009 and 2010 and increase in last year also. This is evident from the table and
graph given below:-
YEAR CURRENT ASSETS
CURRENT LIABILITIES
CURRENT RATIOS
2009 18,82,291.58 11,17,984.00 1.68 2010 32,46,552.04 15,99493.00 2.03 2011 47,99,630.60 19,65,313.60 2.48
Current Ratio
0
10
20
30
40
50
60
1 2 3 4
year
0
0.5
1
1.5
2
2.5
3
current asset current liabilities current ratio

(2) LIQUID RATIO:-
Liquid Ratio also known as Quick Ratio or Acid test ratio is
more rigorous test of liquidity than the current ratio. The term ‘liquidity’ refers to
the ability of a firm to pay its short- term obligations as and when they become due.
Liquid ratio may be defined as the relationship between current or liquid assets or
current or liquid liabilities. An asset is said to be liquid if it can be converted into
cash within a short period without loss of value. It is determined by dividing liquid
assets by current liabilities.
LIQUID RATIO= LIQUID ASSETS
CURRENT LIBILITIES
Here we observe that the liquid ratio of R-TEK MOULD is
increase in FY 2009 and 2010 but decrease in last year. This is evident from the
table and graph given below:-
YEAR LIQUID ASSETS CURRENT LIABILITIES
LIQUID RATIOS
2009 6,15,691.58 11,17,984.00 0.55 2010 18,00,152.04 15,99,493.00 1.125

2011 19,65,313.62 19,65,313.60 0.43
liquid ratio
0
10
20
30
40
50
60
70
1 2 3 4
year
0
0.2
0.4
0.6
0.8
1
1.2
liquid asset current liabilities liqud ratio
(3) STOCK TURNOVER RATIO:-
Stock turnover ratio is also known as inventory turnover
ratio is normally calculated as sales/average inventory or cost of goods sold/average
inventory. It would indicate whether inventory has been efficiently used or not. The
purpose is to see whether only the required minimum funds have been locked up in
inventory. Inventory turnover ratio indicates the number of times the stock have
been turned over during the period of times the stock have been turned over during
the period and evaluate the efficiency with which a firm is able to manage its

inventory. It is determined by dividing the cost of goods sold by amount of average
inventory at cost.
STOCK TURNOVER RATIO= COST OF GOODS SOLD
AVERAGE INVENTORY AT COST
Here we observe that the stock turnover ratio of
R-TEK MOULD is increase in FY 2009 and 2010 but decrease in last year. This is
evident from the table and graph given below:--
YEAR COST OF GOODS SOLD
AVERAGE INVENTORY AT COST
STOCK TURNOVER RATIOS
2009 28,56,079.37 11,69,400.00 2.44 2010 63,11,825.00 14,21,100.00 4.44 2011 62,64,919.00 38,84,500.00 1.61

S T R
0
10
20
30
40
50
60
70
1 2 3 4
year
0
0.5
1
1.5
2
2.5
3
3.5
4
4.5
5
rati
o
COGS AVERAGE INVENTORY STR
(4) ABSOLUTE LIQUID RATIO:-
Although receivables, debtors and bills receivable are
generally more liquid than inventories, yet there may be doubts regarding their
realization into cash immediately or in time. Hence, some authorities are of the
opinion that the absolute liquid ratio should also be calculated together with current
ratio and acid test ratio so as to exclude even receivable from the current assets and
find out the absolute liquid assets. It is determined by dividing the absolute liquid
assets by current liabilities.
ABSOLUTE LIQUID RATIO= ABSOLUTE LIQUID ASSETS
CURRENT LIBILITIES

Here we observe that the absolute liquid assets ratio of
R-TEK MOULD is increase in FY 2009 but decrease in 2010 but increase in last
year also. This is evident from the table and graph given below:--
YEARS ABSOLUTE LIQUID ASSETS
CURRENT LIBILITIES
ABSOLUTE LIQUID RATIOS
2009 3,59,632.65 11,17,984.00
0.32
2010 1,14,010.64 15,99493.00
0.07
2011 5,54,313.60 19,65,313.60
2.82

Absolute Liquid Ratio
0
5
10
15
20
25
1 2 3 4
year
0
0.5
1
1.5
2
2.5
3
rati
o
ABSOLUTE LIQUID ASSET CURRENT ASSET
ABSOLUTE LIQUID RATIO
(5) GROSS PROFIT RATIO:- Gross profit ratio measures the relationship of gross profit to
net sales and is usually represented as a percentage. Thus, it is calculated by
dividing the gross profit by sales.
GROSS PROFIT RATIO= GROSS PROFIT *100
NET SALES
OR
GROSS PROFIT RATIO= SALES- COST OF GOODS SOLD * 100
SALES

Here we observe that the gross profit
ratio of R-TEK MOULD is increase in FY 2009 but decrease in 2010 and decrease
in last year 2011 also. This is evident from the table and graph given below:-
YEARS GROSS PROFIT SALES GROSS PROFIT RATIO
2009 9,75,040.63 24,40,520.00 39.95
2010 14,91,173.60 70,22,084.40 21.23
2011 14,83,868.27 77,48,787.50 19.14
G.P Ratio
0
10
20
30
40
50
60
70
80
90
1 2 3 4
year
0
5
10
15
20
25
30
35
40
45
rati
o
GROSS PROFIT SALES GROSS PROFIT RATIO

(6) NET PROPIT RATIO:-
Net Profit ratio establishes a relationship between net profit
(after taxes) and sales, and indicates the efficiency of the management in
manufacturing, selling, administrative and other activities of the firm. This ratio is
the overall measure of firm’s profitability and is calculated by dividing the NET
PROFIT AFTER TAX by NET SALES.
NET PROFIT RATIO= NET PROFIT AFTER TAX *100
NET SALES
OR
NET PROFIT RATIO= NET OPERATING PROFIT *100
NET SALES
Here we observe that the net profit ratio of R-TEK
MOULD is increase in FY 2009 but decrease in 2010 and decrease in last year 2011
also. This is evident from the table and graph given below:-
YEARS NET PROFIT SALES NET PROFIT RATIO
2009 4,16,529.58 24,40,520.00 17.06
2010 5,40,159.16 70,22,084.40 7.69
2011 5,18,834.12 77,48,787.50 6.69

N.P Ratio
0
10
20
30
40
50
60
70
80
90
1 2 3 4
year
0
2
4
6
8
10
12
14
16
18
rati
o
NET PROFIT SALES NET PROFIT RATIO
(7) FIXED ASSETS TURNOVER RATIO:-
Fixed assets turnover ratio is the relationship between
sales or cost of goods sold and fixed/capital assets employed in a business. Fixed
assets turnover ratio is calculated by dividing COST OF GOODS SOLD by FIXED
ASSETS.
FIXED ASSETS TURNOVER RATIO= COST OF GOODS SOLD
FIXED ASSETS
OR
FIXED ASSETS TURNOVER RATIO= SALES
CAPITAL EMPLOYED

Here we observe that the fixed assets turnover
ratio of R-TEK MOULD is increase in FY 2009 and increase in 2010 and increase in
last year 2011 also. This is evident from the table and graph given below:-
YEAR COST OF GOODS
SOLD FIXED ASSETS
FIXED ASSETS TURNOVER RATIO
2009 28,56,079.37 15,80,205.23 1.80 2010 63,11,825.00 20,29,270.23 3.1 2011 62,64,919.00 24,03,040.23 2.6
F.A.T.R
0
10
20
30
40
50
60
70
1 2 3 4
year
0
0.5
1
1.5
2
2.5
3
3.5
rati
o
COST OF GOODS SOLD
FIXED ASSETS
FIXED ASSETS TURNOVER RATIO

(8) TOTAL ASSETS TURNOVER RATIO:-
Total assets turnover ratio is the relationship
between sales or cost of goods sold and total/capital assets employed in a business.
Total assets turnover ratio is calculated by dividing COST OF GOODS SOLD by
TOTAL ASSETS.
TOTAL ASSETS TURNOVER RATIO= COST OF GOODS SOLD
TOTAL ASSETS
OR
TOTAL ASSETS TURNOVER RATIO= SALES
CAPITAL EMPLOYED
Here we observe that the total assets turnover
ratio of R-TEK MOULD is increase in FY 2009 and decrease in 2010 and decrease
in last year 2011 also. This is evident from the table and graph given below:-
YEAR COST OF GOODS
SOLD TOTAL ASSETS
TOTAL ASSETS TURNOVER RATIO
2009 28,56,079.37 9,76,933.63 2.92 2010 63,11,825.00 55,01,605.02 1.15 2011 62,64,919.00 74,85.233.85 0.83

T.A.T.R
0
10
20
30
40
50
60
70
80
1 2 3 4
YEAR
0
0.5
1
1.5
2
2.5
3
3.5
RA
TIO
COST OF GOODS SOLD
TOTAL ASSETS
TOTAL ASSETS TURNOVER RATIO
(9) WORKING CAPITAL TURNOVER RATIO:-
Working capital turnover ratio of a concern is directly
related to sales, the current assets like debtors, bills receivables, cash, stock etc. The
working capital is taken as:
WORKING CAPITAL= CURRENT ASSETS – CURRENT LIBILITIES
Working capital turnover ratio indicates the velocity of the utilization of net
working capital. This ratio is indicates the number of times the working capital is
turned over in the course of a year. The working capital ratio is calculated as
dividing by COST OF GOODS SOLD by AVERAGE WORKING CAPITAL.

WORKING CAPITAL TURNOVER RATIO= COST OF GOODS SOLD
(AVERAGE) WORKING CAPITAL
Here we observe that the working capital
turnover ratio of R-TEK MOULD is increase in FY 2009 and increase in 2010 but
decrease in last year 2011 also. This is evident from the table and graph given
below:-
YEAR COST OF GOODS
SOLD WORKING CAPITAL
WORKING CAPITAL RATIO
2009 28,56,079.37 8,72,480.57 3.27 2010 63,11,825.00 14,23,502.99 4.43 2011 62,64,919.00 26,56,061.46 2.36
W.C.T.R
0
10
20
30
40
50
60
70
1 2 3 4
YEAR
0
0.5
1
1.5
2
2.5
3
3.5
4
4.5
5R
AT
IO
COST OF GOODS
WORKING CAPITAL
WORKING CAPITAL TUROVER RATIO

FINDINGS $ CONCLUSION
COMPARATIVE CHAT
R-TEK MOULD
KEY RATIOS 2009 2010 2011
CURRENT RATIO 1.68 2.03 2.48
LIQUID RATIO 0.55 1.125 0.43
STOCK TURNOVER RATIO
2.44 4.44 1.61
ABSOLUTE LIQUID RATIO
0.32 0.07 2.82
GROSS PROFIT RATIO
39.95 21.23 19.14
NET PROFIT RATIO 17.06 7.69 6.69
FIXED ASSETS TURNOVER RATIO
1.8 3.1 2.6
TOTAL ASSET TURNOVER RATIO
3.27 4.43 2.36
WORKING CAPITAL TURNOVER RATIO
2.92 1.15 0.83


Types of Financial Analysis
There are various types of financial analysis into different categories. But we are classified financial statements into two categories
(1) ON THE BASIS OF MATERIAL USED
(1) External Analysis

(2) Internal Analysis
(2) ON THE BASIS OF MODUS OPERANDI
(1) Horizontal Analysis
(2) Vertical Analysis
METHODS OF
FINANCIAL ANALYSIS
The analysis and interpretation of financial statements is used to determine the financial position and result of operations as well. A number of methods and devices are used to study the relationship between different statements.
The following methods of analysis are generally used:

(2) Comparative statements
(3) Common – size statements
(4) Trend Analysis
(4) Fund flow statements
(5) Cash flow statements
(6) Ratio analysis
(7) Cost- volume profit analysis
COMPARATIVE STATEMENTS The comparative financial statements are statements of financial position at different periods; of time. The elements of financial position are shown in a comparative form so as to give an idea financial position at two or more periods. Any statement prepared in a comparative form will be covered in comparative statements. From practical point of view, generally two statements are prepared in comparative form for financial analysis purposes. Not only the comparison of the figure of two periods but also be relationship between balance sheet
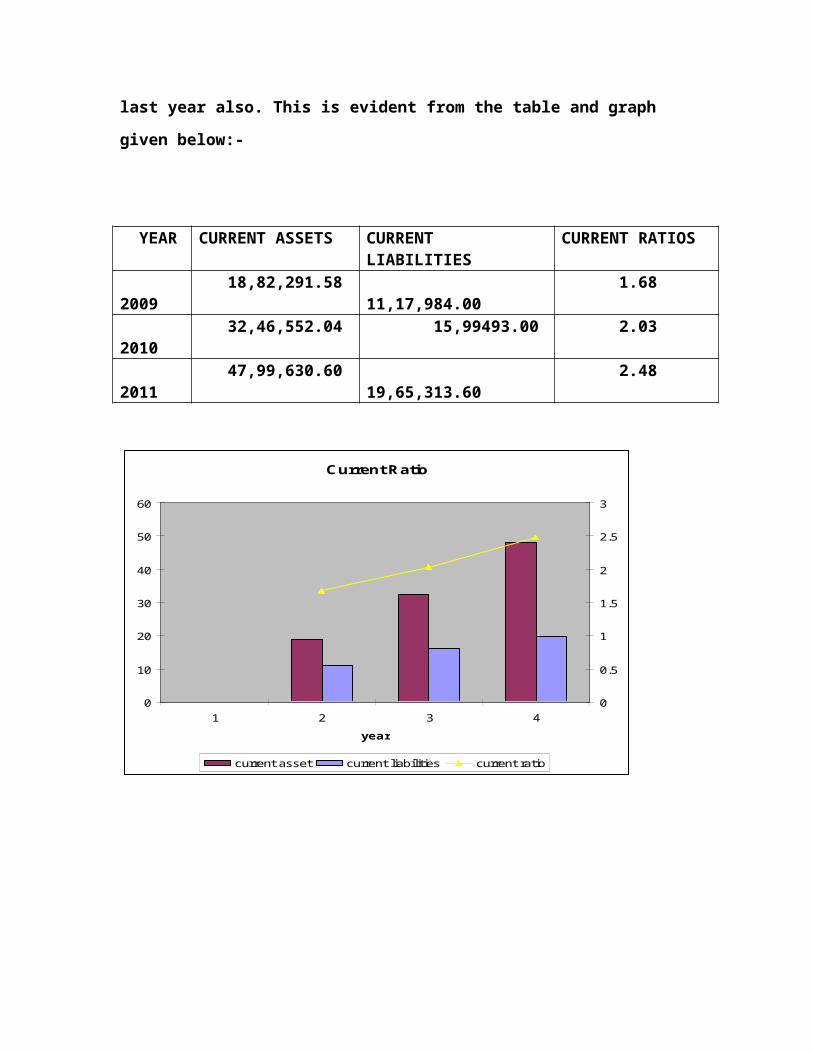
and income statements enables an in depth study of financial position or operative results. The comparative statements are show:
(5) Absolute figure (rupee amount)
(2) Change in absolute figure (increase or decrease in absolute figure)
(3) Absolute data in term of percentages.
(4) Increase or decrease of percentage. The two comparative statements are:-
(1) Comparative Balance sheet
(2) Comparative Income statement

(1) COMPARATIVE BALANCE SHEET
The comparative balance sheet analysis is the study of the trend of same items, group of items and computed item in two or more balance sheets of the same business enterprise on different dates. The change in periodic balance sheet items reflects the conduct of business. The changes can be observed by comparison of the balance sheet at the beginning and at the end of a period and these changes can help in forming an opinion about the progress of an enterprise. The comparative balance sheet has two columns for the data of original balance sheets. A third column is used to show increase in figures. The fourth column may be added for giving percentages of increase or decrease.

Guidelines for Interpretation of
Comparative Balance Sheet
While interpretation Comparative Balance Sheet the interpreter is expected to study the following aspects:
(1) Current financial position and liquidity position.
(2) Long – term financial position. (3) Profitability of the concern.
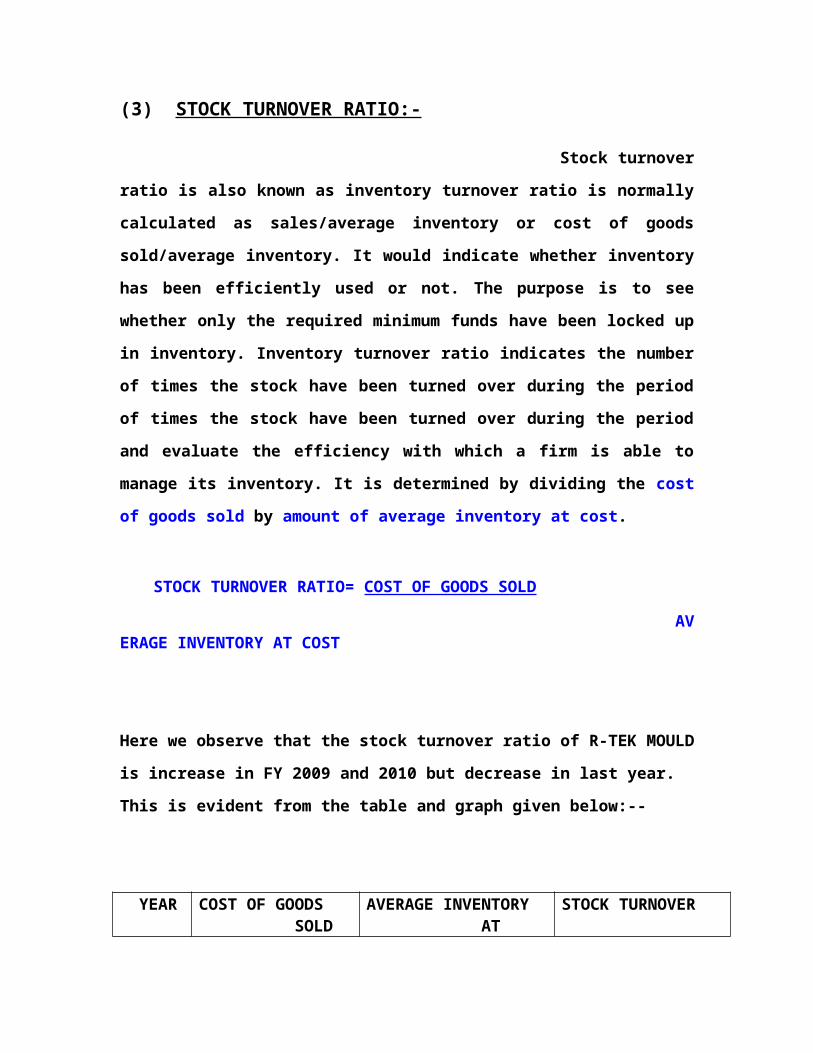
The following is the Balance Sheet of a concern of R-TEK MOULD for the year 2010 and 2011. Prepare a comparative Balance Sheet and study the financial position of a concern.
Balance Sheet As on 31st March
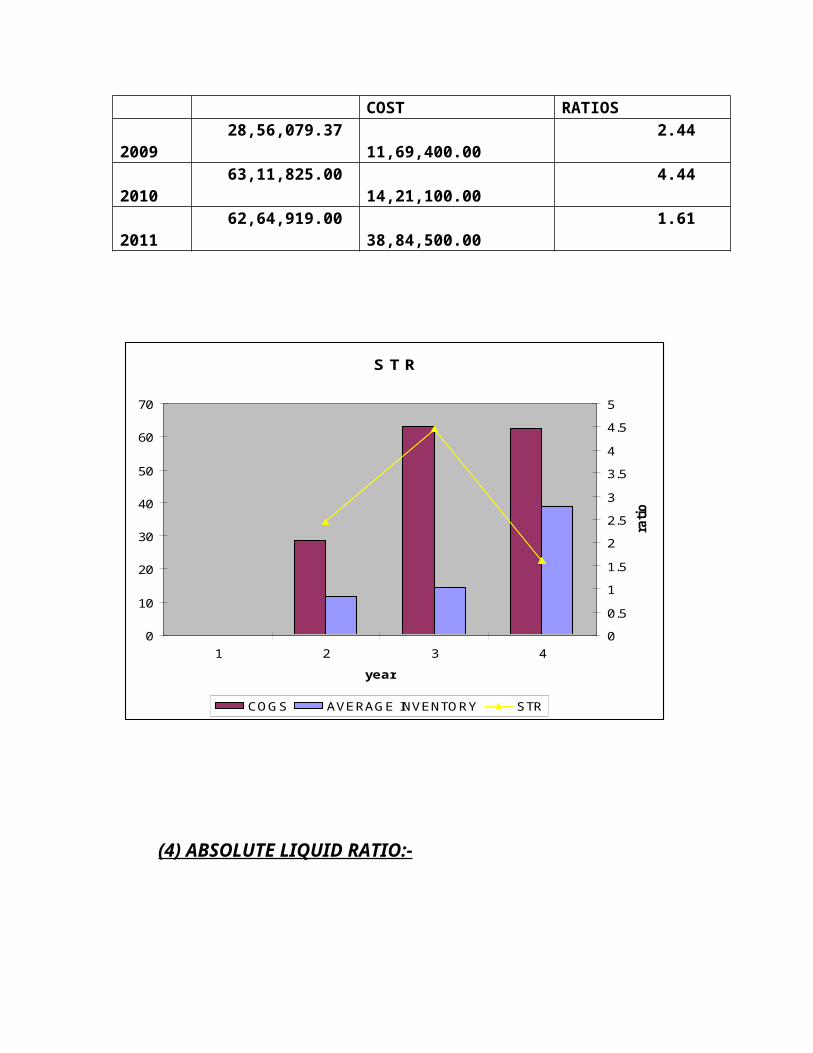

INTERPRETATION

(2) COMPARATIVE INCOME STATEMENT
The Income statement gives the results of the operations of a business. The comparative income statement gives an idea of the progress of a business over a period of a time. The change in absolute data in money value and percentage can be determined to analyze the profitability of the business. Like comparative balance sheet, income statement also has four columns. First two columns give figures of various items for two years. Third and fourth columns are used to show increase or decrease in absolute amounts and percentages respectively.

Guidelines for Interpretation of
Income Statements The analysis and interpretation of income statement will involve the following steps:

(1) The increase or decrease in sales should be compare with the increase or decrease in cost of goods sold. An increase in sale will not be always meaning an increase in profit. The amount of gross profit should be situated in the first step. (2) The second step of analysis should be the study of operational profit. The operating expenses such as office and administrative expenses, selling and distribution expenses should be deducted from gross profit to find out operating profit. An increase in operating profit will result from the increase in sale position and control of operating expenses. A decrease in operating profit may be due to an increase in operating expenses or decrease in sale.
(3) The increase or decrease in net profit will give an idea about the overall profitability of the concern. Non-operating expenses such as interest paid, losses from sale of assets, writing of deferred expenses, payment of tax, etc. decrease the figure of operating profit.
COMPARATIVE INCOME STATEMENT

EX

INTERPRETATION

COMMON- SIZE STATEMENT
The common-size statements, balance sheet and income statement are shown in analytical percentages. The are shown as percentage of total assets, total

liabilities are total sales. The total assets are taken as 100 and different assets are expressed as a percentage of the total. Similarly, various liabilities are taken as a part of total liabilities. These statements are also known as component percentage or 100 percent statements because every individual item is stated as a percentage of total 100. The short-coming in comparative statements ant trend percentages where changes in items could not be compared with the total have been covered up. The analyst is able to assess the figure in relation to total value. The common-size statements may be prepared in the following way:
(1) The total of assets or liabilities is taken as 100.
(2) The individual assets are expressed as a percentage of total assets 100 and different liabilities are calculated in relation to total liabilities. For example, if total assets are rest. 5 laths and inventory value is Rs. 50000, then it will be 10% of total assets [50000*100/500000].
(1) COMMON-SIZE BALANCE SHEET A statement in which balance sheet items are expressed as the ratio of each asset to total assets and the ratios of each liability are expressed as a ratio of total liabilities is called common-size balance sheet. For

example, following assets are shown in a common-size balance sheet:
Rs. PercentageCash in hand and at bank 5,000 2.50Sundry debtors 20,000 10.00Stock 25,000 12.50Land and building 50,000 25.00Plant and machinery 1, 00,000 50.00 Total Assets: 2, 00,000 100.00
The total figure of assets rest. 2, 00,000, is taken as 100 and all other assets are expressed as a percentage of total assets. The relation of each asset to total assets is expressed in the statement. The relation of each liability to total liabilities is similarly expressed.
BALANC SHEET


