summary positionadmin.fifedirect.org.uk/weborgs/nhs/uploadfiles/... · web viewgynae-oncology has...
TRANSCRIPT

Delivering for QualityIntegrated Performance Report
June 2016
Page 1

Contents Page(s)
Executive Summary 3 - 7
Section A – LDP Standards Performance Summary 8 - 10
Targets on Track Short Report 11
Chief Executive’s Performance Escalation
Colour Coding Key 12
Cancer 62-Day RTT 13 - 14
18 Weeks RTT 15
Patient TTG 16
Outpatient Waiting Times 17
A&E 4-Hour Waits 18 - 19
HAI Sabs 20
Sickness Absence 21 - 25
Dementia Post-Diagnostic Support 26 - 27
Delayed Discharge 28
Smoking Cessation 29
CAMHS Waiting Times 30
Psychological Therapies Waiting Times 31
Section B - Capital Programme 33 - 39
Section C - Financial Position 40 - 45
Section D - Scottish Patient Safety Programme 46 - 53
Section E - FOI 54
Section F - Complaints 55 - 59
Page 2

EXECUTIVE SUMMARY
PURPOSE OF THE REPORT
The purpose of the Integrated Performance Report (IPR) is to provide assurance to the Board on NHS Fife’s performance relating to National Standards (as described in the Local Delivery Plan), local priorities and significant risks.
INTRODUCTION
This report is comprised of Sections A to F as per the Contents page.
The most up to date information available is used to populate the various sections however, due to different reporting timetables, the most current information is not always available.
The Executive Directors Group reviews the Board’s performance every month prior to presentation to the Board or the Finance, Performance and Resources Committee. This process is further supported by scrutiny from the Acute Services Division and Integration Joint Board.
The ‘Healthcheck’, which is presented at each Board Meeting, contains areas of duplication, and a review of this is in progress, with the intention of producing an overarching Quality Report in due course.
KEY PERFORMANCE OBSERVATIONS
SECTION A – NATIONAL (LDP) STANDARDS
Planned Care
IVF Waiting Times
At least 90% of eligible patients will be screened within 12 months of referral from Secondary Care
All eligible patients continue to be screened within 12 months of referral from secondary care, an achievement of 100%. The Board has consistently performed at 100% since this measure was introduced in March 2014.
18 Weeks Referral to Treatment (RTT)
At least 90% of planned/elective patients will commence treatment within 18 weeks of referral
The percentage of patients treated in May remained above the 90% Standard for the third successive month, with the performance of 91.8% being the highest since May 2014. At-risk specialties include Neurology (75 breaches in the month), Urology (65 breaches in the month) and Oral Surgery (61 breaches in the month). Staff vacancies and the ongoing demand-capacity gap are impacting on achievement of standards in all specialties. Work is ongoing with the Scottish Government and Regional partners to resolve.
Patient Treatment Time Guarantee (TTG)
We will ensure that all eligible patients receive Inpatient or Day Case treatment within 12 weeks of such treatment being agreed
In June, 96.9% of patients were seen within 12 weeks, a 2% improvement on May and equivalent to 57 patient breaches out of 1,561 patients treated. This standard has not been met since November 2013, although there have been a number of months where
Page 3

the number of breaches have been under 10. At-risk specialties include Orthopaedics (3 breaches in the month), General Surgery (5 breaches in the month), Urology (27 breaches in the month), Ophthalmology (5 breaches in the month) and Oral Maxillo Facial (8 breaches in the month). Staff vacancies and the ongoing demand-capacity gap are impacting on achievement of standards in all specialties. Work is ongoing with the Scottish Government and Regional partners to resolve.
Outpatients Waiting Times
At least 95% of patients (stretch target of 100%) will receive their first outpatient appointment within 12 weeks of referral
The Outpatients Waiting Times performance remained above the Standard in June at 96.9% (96.4% in May), with the numbers of patients waiting over 12 and 16 weeks also continuing to fall. The number waiting over 12 weeks (420) was the lowest since June 2013, while the number waiting over 16 weeks (162) was the lowest since we started reporting on this in April 2015.
The at-risk specialties are Neurology, Gastroenterology, Oral and Orthopaedics, with the first of these accounting for 252 of the 12-week breaches. Staff vacancies and the ongoing demand-capacity gap are impacting on achievement of standards in all specialties. Work is ongoing with the Scottish Government and Regional partners to resolve.
Cancer 62-Day RTT
At least 95% of patients urgently referred with a suspicion of cancer will start treatment within 62 days
In May, performance against the Standard improved to 95.1% (90.1% in April). However, this achievement remains extremely fragile and is unlikely to be sustained in the short term.
There are capacity issues for outpatients and/or surgery for Breast, Lung, Gynaecology and Urology. In general Head & Neck, Lung and Upper GI cancers remain at risk due to a combination of complexity, liaison with tertiary providers, visiting oncology capacity and surgical capacity. Significant capacity issues within radiology are impacting on breast outpatient appointments and the support to Multi-Disciplinary team meetings
Cancer 31-Day Decision-to-Treat-to-Treatment (DTT)
We will treat at least 95% of cancer patients within 31 days of decision to treat
In May, performance against the Cancer treatment 31-day Standard improved to 97.6% (91.9% in April). The Standard has been met in 14 out of the last 16 months.
Emergency Care
A&E 4-Hour Waiting Time
At least 95% of patients (stretch target of 98%) will wait less than 4 hours from arrival to admission, discharge or transfer for Accident and Emergency Treatment
The annually-measured 4-hour performance (96.5%) continued to be above the Standard, a position maintained since the end of October 2015. In the month of June, 97.2% of the 7,880 patients attending A&E or a Minor Injuries Unit were treated within 4 hours of arrival, equating to 222 patient 4-hour breaches. The number of 8-hour breaches was 10 (the lowest monthly figure since December 2015), with no 12-hour breaches for the second successive month.
Page 4

Clinical Access and Support
Diagnostics Waiting Times
No patient will wait more than 6 weeks to receive one of the 8 Key Diagnostics Tests
At the end of May, 188 patients had breached the Standard, with all these patients waiting for a non-obstetric ultrasound test. There are ongoing Consultant and Sonographer workforce issues which are impacting on our capacity. Actions are being taken to source additional capacity, however it is anticipated that this pressure may continue throughout 2016-17.
Detect Cancer Early
At least 29% of cancer patients will be diagnosed and treated in the first stage of breast, colorectal and lung cancer by the end of December 2015
Local management information for the final 2-year target period (covering 2014 and 2015) shows that NHS Fife detected 28% of Breast, Colorectal and Lung cancers at Stage 1. Although slightly under the target, there has been an improvement of 5.8% in Stage 1 Detection over the last 4 years, with Breast and Colorectal increasing by around 2% and Lung increasing by 9.6%.
Board Wide
HAI Sabs
We will achieve a maximum rate of Sabs (including MRSA) of 0.24
After two successive monthly falls, the HAI Sabs infection rate rose to 0.41 for the 12-month period ending June, with 11 cases being recorded in the month. The rate for the quarter ending June was, however, the lowest since the quarter ending March 2015.
Hospital acquired SABs are increasing with vascular access devices being identified as the predominant primary cause. A multi-disciplinary focused improvement programme has been established in cardiology with external support from Health Improvement Scotland to refocus on safe harm free care related to vascular access device management.
HAI C Diff
We will achieve a maximum rate of C diff infection in the over 15s of 0.32
The C Diff infection rate for the 12-month period ending June was 0.24, with 8 cases being recorded in the month. NHS Fife performance has been consistently better than the Standard since April 2013.
Sickness Absence
We will achieve and sustain a sickness absence rate of no more than 4% (measured on a rolling 12-month basis)
The average sickness absence rate for the 12 months to May fell to 5.01% (from 5.04% for the 12 months to April), as a result of noticeable monthly falls in all areas of NHS Fife. NHS Fife as a whole has not yet achieved a 4% rate, but the Clinical Access and Support and Planned Care Directorates along with the Partnership’s West Division all recorded levels less than 4% in May.
Page 5

Health and Social Care
Delayed Discharge
No patient will be delayed in hospital for more than 2 weeks after being judged fit for discharge
At the June census point, there were 58 patients in delay, 38 of whom had been in delay for more than 14 days. Both these figures have dropped since the May census, when 80 patients were in delay, 41 of whom had been in delay for more than 14 days.
Smoking Cessation
We will deliver a minimum of 602 post 12-weeks smoking quits in the 40% most deprived areas of Fife
The number of successful smoking quits in FY 2015-16 was 502, 100 less than the target of 602. There were 171 successful quits in the final quarter of the year, which was better than the initial target of 50 per month and may indicate that recovery actions are becoming increasingly effective as we focus on the increased target of 779 quits for 2016-17.
Alcohol Brief Interventions
In FY 2015-16, we will deliver a minimum of 4,187 interventions, at least 80% of which will be in priority settings
There were 5,423 ABIs delivered in 2015-16, comfortably exceeding the Standard as in all previous years.
Antenatal Access
At least 80% of pregnant women in each SIMD quintile will book for antenatal care by the 12th week of gestation
NHS Fife has continued to record a performance level of over 80% in all SIMD quintiles. The lowest-performing quintile for the first quarter of 2016 was Quintile 1 (Quintile 1 is most-deprived, Quintile 5 is least-deprived), at 89.8%. The highest-performing quintile was Quintile 3 (95.0%), while the overall NHS Fife figure was 91.7%.
Dementia Post-Diagnostic Support
All patients with a diagnosis of dementia will have a minimum of 1 year's post-diagnostic support and a person-centred support plan
Guidance for measuring and reporting on this target, and the target itself is yet to be published by the Scottish Government Health and Social Care Directorate. It is likely that the focus of the PDS measure will be on patients diagnosed with dementia and their initial contact with a link support worker.
Dementia Registration
We will have a QOF-registered proportion of diagnosed dementia patients consistent with the European measure of prevalence
The number of patients registered as suffering from Dementia at the end of June was 3,335, above the calculated Standard of 3,176.
Page 6

Drugs & Alcohol Treatment Waiting Times
At least 90% of clients will wait no longer than 3 weeks from referral to treatment
June’s Information Services Division publication showed that 97.5% of patients were seen within 3 weeks of referral for treatment between January and March 2016. This remains significantly above the Standard, a position which has been sustained since the start of 2013. The Scottish average was 94.8%.
CAMHS Waiting Times
At least 90% of clients will wait no longer than 18 weeks from referral to treatment for specialist Child and Adolescent Mental Health Services
The performance against the CAMHS Waiting Times Standard continued to show small month-on-month improvement, with the percentage of patients starting treatment within 18 weeks of referral increasing to 85.3% during May (83.8% in April). This is the highest figure reported since June 2014.
In May, 118 (86.8%) of the 136 patients who started treatment did so within the 18-Week Standard. The number of patients waiting to start treatment was 557, 24 less than in April and 83 less than in May 2015. Of the 557, 97 had already exceeded the 18-Week waiting time.
Psychological Therapies Waiting Times
At least 90% of clients will wait no longer than 18 weeks from referral to treatment for Psychological Therapies
There was another improvement in performance, with the percentage of patients starting treatment within 18 weeks of referral increasing to 75.6% in May (from 72.8% in April).
In May, 349 (78.8%) of the 443 patients who started treatment did so within the 18-Week Standard. The number of patients waiting to start treatment was 2,448, 47 less than in April but virtually unchanged from the number waiting in May 2015. Of the 2,448, 736 had already exceeded the 18-Week waiting time.
SECTION B - CAPITAL
At the end of June, expenditure of £3.275m has been incurred against the planned capital programme. This is broadly in line with the trajectory for the period.
SECTION C – FINANCIAL POSITION
There is a reported £4.6m overspend (against the £9.4m gap) on the revenue resource limit at the end of June. Across the system, the budgetary position remains broadly breakeven, with a number of over and under spends against operational budgets. The key driver of the reported position, however, is the impact of unidentified savings at this point in the year.
The current gap in funding plus an element of unidentified savings contribute to a projected outturn for the year of £9.4m.
SECTION F - COMPLAINTS
The complaints completion rate in May was 72%, with 21 out of 29 complaints received being completed on time. This is a significant improvement on the April figure of 45% but still below the planned performance for 2016-17 of 75% (increased from 70% previously).
100% of complaints were acknowledged within 3 days.
Page 7

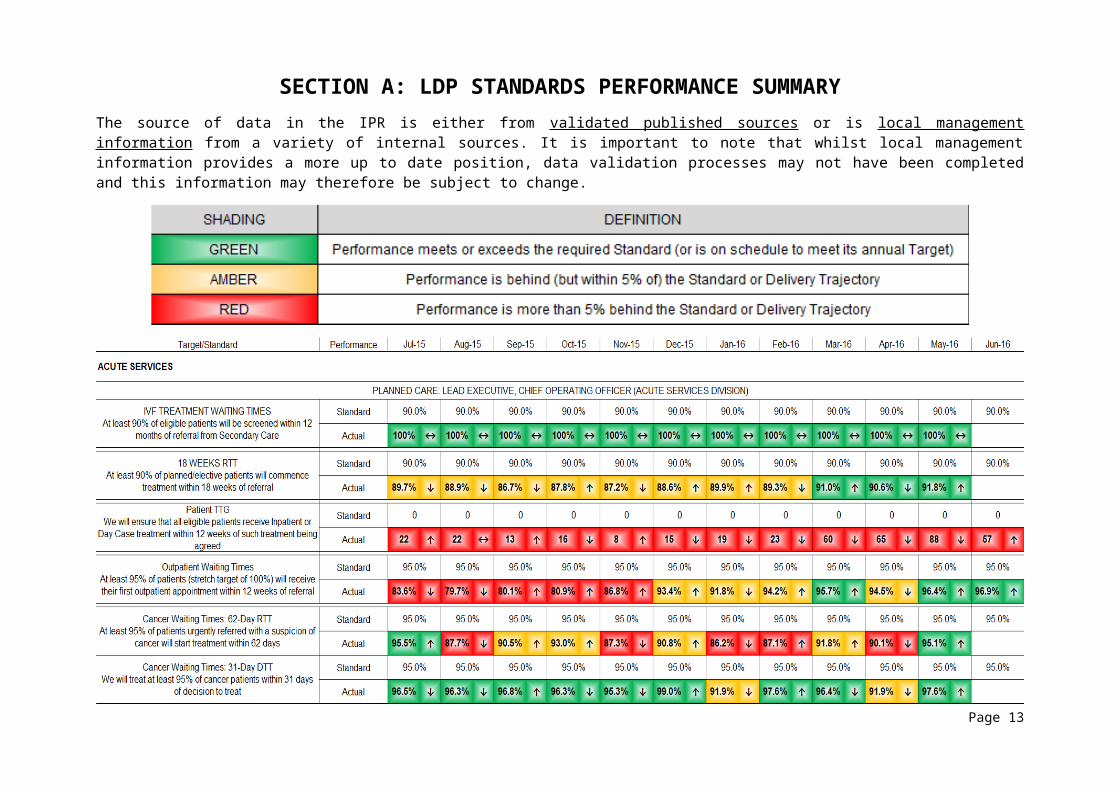
SECTION A: LDP STANDARDS PERFORMANCE SUMMARYThe source of data in the IPR is either from validated published sources or is local management information from a variety of internal sources. It is important to note that whilst local management information provides a more up to date position, data validation processes may not have been completed and this information may therefore be subject to change.
Page 8

Page 9

Page 10

TARGETS ON TRACKNHS Fife continues to meet or perform ahead of the following National Targets and Standards:
Antenatal Access: at least 80% of pregnant women in each SIMD quintile will book for antenatal care by the 12th week of gestationLocal management information shows that NHS Fife has continued to record a performance level of over 80% in all SIMD quintiles. The lowest-performing quintile for the first quarter of 2016 was Quintile 1 (Quintile 1 is most-deprived, Quintile 5 is least-deprived), at 89.8%. The highest-performing quintile was Quintile 3 (95.0%), while the overall NHS Fife figure was 91.7%.HAI: we will achieve a maximum rate of C diff infection in the over 15s of 0.32Local management data for the 12-month period to June indicates a C difficile rate of 0.24, continuing a sustained performance significantly better than the standard of 0.32.IVF: no eligible patient will wait longer than 12 months for screening following referral from Secondary CareAll NHS Fife patients continue to be screened within 12 months, with 81 patients having been screened in the whole of 2015-16. The latest management information showed that 19 patients were on the waiting list, none of whom had waited more than 12 months.Cancer Waiting Times - we will treat any cancer patient within 31 days of decision to treatLocal management information shows that performance for May was 97.6%, comfortably above the standard of 95.0%. This is a significant improvement on Aprils figure of 91.9%Drug and Alcohol Waiting Times: at least 90% of clients will wait no longer than 3 weeks from referral to treatmentThe June ISD publication showed that 97.5% of patients were seen within 3 weeks of referral for treatment between January and March 2016. This remains significantly above the 90% standard, a position NHS Fife has sustained since the start of 2013. The Scottish average was 94.8%.Diagnostics Waiting Times: no patient will wait more than 6 weeks to receive one of the 8 key diagnostic tests - barium studies, non-obstetric ultrasound, CT, MRI, upper endoscopy, lower endoscopy, colonoscopy, cystoscopyLocal Management information shows that 188 patients had waited more than 6 weeks for a non-obstetric ultrasound at the end of May. There are ongoing Consultant and Sonographer workforce issues which are impacting on our capacity. Actions are being taken to source additional capacity, however it is anticipated that this pressure may continue throughout 2016-17.Detect Cancer Early: at least 29% of cancer patients will be diagnosed and treated in the first stage of breast, colorectal and lung cancerThis target ran until the end of December 2015, and then became a Standard. Local management information for the final 2-year target period (covering 2014 and 2015) shows that NHS Fife detected 28% of Breast, Colorectal and Lung cancers at Stage 1. Although slightly under the target, there has been an improvement of 5.8% in Stage 1 Detection over the last 4 years, with Breast and Colorectal increasing by around 2% and Lung increasing by 9.6%. Alcohol Brief Interventions: we will deliver a minimum of 4,187 interventions, at least 80% of which will be in priority settingsNHS Fife has to deliver the same number of ABI in 2016-17 as in 2015-16. The 2015-16 figure of 4,187 was exceeded by approximately 30%, and we are confident the processes and system are embedded in the Health and Social Care Partnership to achieve the target again in 2016-17. The first data (for Quarter 1) will not be available until the end of July.Dementia Registration: We will have a QOF-registered proportion of diagnosed dementia patients consistent with the European measure of prevalenceThe number of patients registered as suffering from Dementia at the end of June was 3,335, above the calculated Standard of 3,176.
Page 11

CHIEF EXECUTIVE’S PERFORMANCE ESCALATIONIn the following sections, cells in the Recovery Plan Trajectory and Recovery Plan Actions Tables are shaded as follows:
Recovery Trajectory
Recovery Plan
Page 12
ACUTE SERVICESPLANNED CARECANCER 62 DAY REFERRAL TO TREATMENT
At least 95% of patients urgently referred with a suspicion of cancer will start treatment within 62 days
Key Concerns & Risks
There continues to be a number of areas of risk which contribute to our ability to achieve this target. There are capacity issues for outpatients and or surgery for Breast, Lung, Gynaecology and Urology. In general Head & Neck, Lung and Upper GI cancers remain at risk due to a combination of complexity, liaison with tertiary providers, visiting oncology capacity and surgical capacity. Significant capacity issues within radiology are impacting on breast outpatient appointments and the support to Multi-Disciplinary team meetings.
Performance against the 62-day target continues to be significantly challenging.
Recovery PlanLeads: Kathy Nicoll / Andrea Wilson / Professor Scott McLean
Month Jan Feb Mar Apr May Jun Jul Aug Sep Oct Nov Dec Jan Feb MarActual 86.2% 87.1% 91.6% 90.1% 95.1%
Planned 95.0% 95.0% 95.0% 95.0% 95.0% 95.0% 95.0% 95.0% 95.0% 95.0% 95.0% 95.0% 95.0% 95.0% 95.0%
Action
1.1
1.2
1.3
1.4
1.5
1.6
1.7
1.8
1.9
1.10
1.11
1.12
1.13
1.14Review and agree model to support Consultant Radiologist input to MDT meetings
2017
Review and improve processes to deliver an MDT decision and referral to tertiary centres by day 31 for patients receiving active treatment e.g. surgery chemotherapy, radiotherapy
Review and create suffi cient oncology outpatient capacity as part of the oncology review - Urology
Surgery -Review and create suffi cient capacity for urgent/planned cancer cases - Urology, Gynaecology
% of Patients Starting Treatment Within 62 Days of an Urgent ReferralStandard = 95%
2016
Agree and implement actions to improve reporting turnaround times for radiology.
Identify an alternative Cancer tracking system (as part of TrakCare implementation) to replace existing eOASIS system
Redesign pathways and explore options to expand GP direct access to diagnostics
Review and improve processes post OPA/investigations in line with pathway
Deliver high level review of all Cancer pathways to identify the elements that regularly experience pressure and provide recommendations for improvementReview capacity and demand data and create suffi cient capacity to meet 2 weeks wait for initial appointment/test
Review and improve processes post DTT to deliver treatment within target date- Urology, Gynaecology
Review and improve processes to deliver a DTT by day 31 for patients receiving active treatment in Fife, e.g. surgery chemotherapy
Deliver changes to Cancer Operational Delivery Structure including performance management processReview Standard Operating procedures to ensure consistency of tracking and MDT procedures
Situational Analysis
There are 3 actions which have an Amber RAG status.
Gynae-oncology has secured additional outpatient capacity and is meeting demand for surgery however, waits for the breast one stop clinic are challenging due to capacity issues within both the breast and radiology services. Delays to 1st lung OPA are slowly improving but it is anticipated that the impact of previous delays will be evident for the rest of quarter 2.
Patients requiring urgent imaging are currently still being seen within 14 days of referral however it is anticipated that radiological reporting may be delayed for all cancer sites. These delays are impacting on MDT discussions in particular for Urology and Upper
Page 13

Gastroenterology. 2 new actions have been added to the recovery plan in this respect (1.13 and 1.14).
Challenges in urology remain due to consultant vacancies. Waits to 1st OPA in uro-oncology have improved as the new Oncologist is now in post.
Cancer Performance Trend by Specialty
The Performance Trend for both Cancer Treatment measures, broken down by Specialty, is shown in the tables below. (In certain specialties, for example Cervical and Ovarian, the numbers are very low, i.e. < 5, so are not disclosed as actual numbers).
For May both the 62-day and 31-day standards were achieved (95.1% and 97.6%, respectively). There were 3 breaches for patients on the 62-day pathway, ranging from 6 to 14 days. There were 2 breaches for patients on the 31-day pathway, ranging from 2 to 16 days. Waits to surgery was the reason for delay.
62-Day RTT
May-15 Jun-15 Jul-15 Aug-15 Sep-15 Oct-15 Nov-15 Dec-15 Jan-16 Feb-16 Mar-16 Apr-16 May-16
95.0% 95.0% 95.0% 95.0% 95.0% 95.0% 95.0% 95.0% 95.0% 95.0% 95.0% 95.0% 95.0%
100.0% 100.0% 87.5% 100.0% 100.0% 85.7% 100.0% 100.0% 83.3% 100.0% 100.0% 100.0% 91.7%
↔ ↔ ↓ ↑ ↔ ↓ ↑ ↔ ↓ ↑ ↔ ↔ ↓100.0% 100.0% 100.0% 100.0% 100.0% 100.0% 0.0% 0.0% 100.0% 0.0% 50.0% 0.0% 100.0%
↔ ↔ ↔ ↔ ↔ ↔ ↓ ↔ ↑ ↓ ↑ ↓ ↑100.0% 100.0% 100.0% 85.7% 88.9% 100.0% 91.7% 100.0% 90.0% 100.0% 90.0% 100.0% 90.0%
↑ ↔ ↔ ↓ ↑ ↑ ↓ ↑ ↓ ↑ ↓ ↑ ↓100.0% 75.0% 100.0% 100.0% 100.0% 66.7% 100.0% 100.0% 100.0% 60.0% 100.0% 100.0% 100.0%
↔ ↓ ↑ ↔ ↔ ↓ ↑ ↔ ↔ ↓ ↑ ↔ ↔100.0% 88.2% 95.0% 90.9% 81.8% 94.1% 83.3% 82.4% 85.0% 100.0% 91.7% 86.4% 100.0%
↑ ↓ ↑ ↓ ↓ ↑ ↓ ↓ ↑ ↑ ↓ ↓ ↑100.0% 100.0% 100.0% 100.0% 100.0% 100.0% 100.0% 100.0% 100.0% 100.0% 100.0% 100.0% 100.0%
↔ ↔ ↔ ↔ ↔ ↔ ↔ ↔ ↔ ↔ ↔ ↔ ↔100.0% 0.0% 66.7% 100.0% 100.0% 75.0% 100.0% 100.0% 100.0% 100.0% 100.0% 100.0% 100.0%
↔ ↓ ↑ ↑ ↔ ↓ ↑ ↔ ↔ ↔ ↔ ↔ ↔100.0% 100.0% 100.0% 100.0% 100.0% 100.0% 100.0% 100.0% 33.3% 100.0% 75.0% 100.0% 80.0%
↔ ↔ ↔ ↔ ↔ ↔ ↔ ↔ ↓ ↑ ↓ ↑ ↓100.0% 87.5% 100.0% 100.0% 100.0% 100.0% 83.3% 77.8% 100.0% 100.0% 100.0% 85.7% 100.0%
↔ ↓ ↑ ↔ ↔ ↔ ↓ ↓ ↑ ↔ ↔ ↓ ↑81.8% 100.0% 100.0% 72.2% 91.7% 100.0% 75.0% 100.0% 88.9% 54.5% 100.0% 86.7% 100.0%
↑ ↑ ↔ ↓ ↑ ↑ ↓ ↑ ↓ ↓ ↑ ↓ ↑
62 dayMonth
Standard
BreastAchieved
Trend
CervicalAchieved
Trend
ColorectalAchieved
Trend
Head & Neck
Achieved
Trend
LungAchieved
Trend
LymphomaAchieved
Trend
MelanomaAchieved
Trend
UrologicalAchieved
Trend
OvarianAchieved
Trend
Upper GIAchieved
Trend
31-Day DTT
May-15 Jun-15 Jul-15 Aug-15 Sep-15 Oct-15 Nov-15 Dec-15 Jan-16 Feb-16 Mar-16 Apr-16 May-16
95.0% 95.0% 95.0% 95.0% 95.0% 95.0% 95.0% 95.0% 95.0% 95.0% 95.0% 95.0% 95.0%
100.0% 100.0% 90.9% 100.0% 100.0% 95.0% 100.0% 100.0% 100.0% 100.0% 100.0% 100.0% 100.0%
↔ ↔ ↓ ↑ ↔ ↓ ↑ ↔ ↔ ↔ ↔ ↔ ↔100.0% 100.0% 100.0% 100.0% 100.0% 100.0% 100.0% 100.0% 100.0% 100.0% 100.0% 100.0% 100.0%
↔ ↔ ↔ ↔ ↔ ↔ ↔ ↔ ↔ ↔ ↔ ↔ ↔100.0% 100.0% 93.3% 100.0% 94.7% 95.0% 100.0% 100.0% 100.0% 100.0% 100.0% 100.0% 100.0%
↔ ↔ ↓ ↑ ↓ ↑ ↑ ↔ ↔ ↔ ↔ ↔ ↔100.0% 100.0% 100.0% 100.0% 100.0% 100.0% 100.0% 100.0% 100.0% 100.0% 100.0% 100.0% 100.0%
↔ ↔ ↔ ↔ ↔ ↔ ↔ ↔ ↔ ↔ ↔ ↔ ↔100.0% 100.0% 100.0% 100.0% 100.0% 100.0% 100.0% 100.0% 100.0% 100.0% 100.0% 100.0% 100.0%
↔ ↔ ↔ ↔ ↔ ↔ ↔ ↔ ↔ ↔ ↔ ↔ ↔100.0% 100.0% 100.0% 100.0% 100.0% 100.0% 100.0% 100.0% 100.0% 100.0% 100.0% 100.0% 100.0%
↔ ↔ ↔ ↔ ↔ ↔ ↔ ↔ ↔ ↔ ↔ ↔ ↔100.0% 100.0% 100.0% 100.0% 100.0% 100.0% 100.0% 100.0% 100.0% 100.0% 100.0% 100.0% 100.0%
↔ ↔ ↔ ↔ ↔ ↔ ↔ ↔ ↔ ↔ ↔ ↔ ↔100.0% 100.0% 100.0% 100.0% 100.0% 100.0% 85.7% 100.0% 0.0% 100.0% 83.3% 50.0% 80.0%
↔ ↔ ↔ ↔ ↔ ↔ ↓ ↑ ↓ ↑ ↓ ↓ ↑100.0% 100.0% 100.0% 100.0% 100.0% 100.0% 100.0% 100.0% 100.0% 100.0% 100.0% 90.0% 100.0%
↔ ↔ ↔ ↔ ↔ ↔ ↔ ↔ ↔ ↔ ↔ ↓ ↑96.0% 88.2% 95.2% 91.2% 90.0% 92.6% 86.4% 96.3% 83.3% 90.5% 86.7% 82.4% 95.0%
↑ ↓ ↑ ↓ ↓ ↑ ↓ ↑ ↓ ↑ ↓ ↓ ↑
CervicalAchieved
Trend
31 dayMonth
Standard
BreastAchieved
Trend
Head & Neck
Achieved
Trend
ColorectalAchieved
Trend
LymphomaAchieved
Trend
LungAchieved
Trend
OvarianAchieved
Trend
MelanomaAchieved
Trend
UrologicalAchieved
Trend
Upper GIAchieved
Trend
Page 14

18 WEEKS REFERRAL TO TREATMENT
At least 90% of planned elective patients will commence treatment within 18 weeks of referral
Leads: Andrea Wilson / Professor Scott McLeanMonth Jan Feb Mar Apr May Jun Jul Aug Sep Oct Nov Dec Jan Feb MarActual 88.6% 89.9% 91.0% 90.6% 91.8%
Planned 91.0% 91.0% 91.0% 90.0% 90.0% 90.0% 90.0% 90.0% 90.0% 90.0% 90.0% 90.0% 90.0% 90.0% 90.0%
2017
% of Patients Treated Within 18 Weeks of ReferralStandard = 90%
2016
Key Concerns & Risks
The key specialties which remain at risk of not meeting 18 weeks RTT are Urology, Oral Surgery and Neurology. This is driven by vacancies and an ongoing demand-capacity gap.
Additional activity continues to be undertaken when available to improve and sustain Outpatient, Diagnostic and Inpatient Day Case waiting times. Work continues in consultation with the Scottish Government to review the size and resourcing of the demand-capacity gap.
Recovery Plan
The Recovery Plan for 18 Weeks RTT is covered by the delivery of the Patient Treatment Time Guarantee and Outpatient Waiting Times Recovery Plans shown in the relevant sections on the following pages.
Page 15

PATIENT TREATMENT TIME GUARANTEE
We will ensure that all eligible patients receive inpatient or day case treatment within 12 weeks of such treatment being agreed
Key Concerns & Risks
At-risk specialties for Inpatients and Day Cases remain unchanged and are Orthopaedics, General Surgery, Urology, Ophthalmology and Oral Maxillo Facial. This is driven by vacancies and ongoing demand and capacity gap.
Efforts continue to undertake additional activity but challenges still remain with the availability of anaesthetic cover, use of locums, availability of Operating Department Practitioner (ODP) staff and availability of beds. It is likely that this pressure will continue into the second quarter of 2016-17.
Recovery Plan
Situational Analysis
There are 3 actions which have an Amber or Red RAG status.
The capacity tables for inpatient and daycases have been validated and NHS Fife continues to meet with the Scottish Government regarding the resilience of this target. Discussions are live around the size and resourcing of the demand capacity gap and it is anticipated that the plans for 2016/7 will be agreed in August.
It has not been possible to provide sufficient additional activity internally to clear the backlog of Inpatient and Day Case procedures in Urology. Discussions continue with the Scottish Government around additional external activity to assist in reducing this backlog. This is reflected in the Red status. It is anticipated that this will not be recovered until Q2 of 2016-17.
Page 16

OUTPATIENT WAITING TIMES
At least 95% of patients (stretch target of 100%) will have their first outpatient appointment within 12 weeks of referral. Additionally, we must eradicate waits over 16 weeks.
Key Concerns & Risks
The at-risk specialties are Neurology, Gastroenterology, Oral and Orthopaedics. Recruitment into Consultant vacancies in Neurology and gastroenterology remains particularly challenging.
Work continues to identify and secure short term and sustainable solutions to meet the ongoing gap in outpatient capacity as well as short term gaps due to absence and vacancies. Neurology remains a significant challenge in this respect.
Activity is being outsourced and local waiting times initiatives continue in all of the at-risk specialties to improve performance.
Recovery Plan
Situational Analysis
The recovery plan shows that one action is rated as Amber for delivery.
The focus is on sustaining the improvement in outpatients waiting over 12 weeks, managing short term issues as they arise, whilst continuing to manage the ongoing capacity issues in Neurology and Gastroenterology. There are difficulties in securing the volume of additional activity required for Neurology and Gastroenterology and this is reflected in the continued Amber status. Discussions continue with the Scottish Government in regards to this.
Page 17

EMERGENCY CAREA&E 4-HOUR WAITING TIME
At least 95% of patients (stretch target of 98%) will wait less than 4 hours from arrival to admission, discharge, or transfer for accident and emergency treatment
Key Concerns & Risks
A number of risks remain in the system including admission numbers exceeding discharge numbers particularly at weekends, flexibility of the ambulance service response to same day discharge and the ongoing challenge of patients in delay.
Recovery Plan
Note that the ‘Actual Performance’ figures shown are 12-month averages, not figures for the individual months.
The performance figure for all Fife for the single month of June was 97.2%, with the ED at VHK itself recording a performance of 95.9%, 2% higher than in May.
The average ED weekly performance from the beginning of October 2015 through to the end of June (a 40-week period) was 94.6%, against the all-Scotland ED figure of 93.5%.
The new assessment model in AU1 continues to discharge 29% of patients on the day of admission. Improvements have been achieved in the time patients spend within the assessment unit prior to discharge or decision to admit. ECAS continues to expand the range of interventions available, preventing short-stay emergency admissions to hospital.
A baseline for morning and weekend discharges during 2015-16 has been finalised, against which 2016-17 performance will be measured. Improvement work has commenced within the Emergency Care Directorate to review discharge processes, particularly in relation to the timely completion of eIDL and discharge prescriptions. Recommendations will be shared and discussed within the multi-disciplinary team to determine what actions can be taken to increase a.m. and weekend discharges.
April
May
June July
Aug
Sept Oct
Nov
Dec
Jan
Feb
Mar
0%
5%
10%
15%
20%
90010001100120013001400
ECD - % of weekday a.m. discharges 2015-16 Tot 2016-17 Tot 2015-16 Dx 2016-17 Dx
%o
of D
ischa
rges
Tota
l Disc
harg
es
Page 18

April
May
June July
Aug
Sept Oct
Nov
Dec
Jan
Feb
Mar
0%5%
10%15%20%25%30%35%
050100150200250300350
ECD - Daily rate of weekend discharges 2015-16 Tot 2016-17 Tot 2015-16 2016-17
No
of D
ischa
rges
Tota
l Disc
harg
es
Further work will be led by Dr Baker, Clinical Lead to determine what redesign within the AU1 Assessment Area requires to take place to improve the pathway, minimise patient stay to improve overall patient experience. The aim is to eliminate bottlenecks.
Further promotion of the “Know Who to Turn To” campaign to reduce the number of inappropriate attendances at ED will be co-ordinated. During 2015-16 a total of 2,148 patients were redirected from the ED at Victoria Hospital. This equates to 3.4% of total attendances or almost 6 patient presentations per day. It is evident that the number of patients being redirected from ED has reduced for April and May when compared with the same period last year.
April
May
June July
Aug
Sept Oct
Nov
Dec
Jan
Feb
Mar
0%
1%
2%
3%
4%
5%
440046004800500052005400560058006000
ECD - Redirections as a % of total attendances2015-16 2016-17 % 2015-16 % 2016-17
No
of D
ischa
rges
Tota
l Att
enda
nces
Page 19

BOARD WIDEHAI SABS
We will achieve a maximum rate of staphylococcus aureas bacteraemia (including MRSA) of 0.24
Key Concerns & Risks
The actions described will support the reductions in preventable (hospital acquired) SAB numbers being increased. Infections related to invasive devices such as peripheral venous cannulae (PVC) constitute the single biggest preventable cause and are a particular area of focus.
The trend in the relative rate of SABs acquired in a hospital environment as opposed to arising spontaneously in the community, over the last 6 months, is shown in the table below.
12-Month Period Ending Jan-16 Feb-16 Mar-16 Apr-16 May-16 Jun-16
Hospital SABS 38 41 43 45 41 42
Community SABS 73 75 74 71 65 69
Total SABS 111 116 117 116 106 111
% SABS Acquired in Hospital 34.2% 35.3% 36.8% 38.8% 38.7% 37.8%
Recovery Plan
Situational Analysis
Various improvement initiatives have been started in order to address areas of concern in relation to the incidence of SAB infections. It is hoped that these will result in reduced infections in 2016.
Hospital acquired SABs are increasing with vascular access devices being identified as the predominant primary cause. A multi-disciplinary focused improvement programme has been established in cardiology with external support from Health Improvement Scotland to refocus on safe harm free care related to vascular access device management.
Early intervention in needle exchange schemes is also being brought into focus to see if this approach can identify localised infection in the intravenous drug population and offer systemic treatment to prevent invasive infection. This work remains at the early stages of implementation.
Where any improvements are noted, areas of good practice will be shared with peers and new challenges reported widely.
Page 20

SICKNESS ABSENCE
We will achieve and sustain a sickness absence rate of no more than 4%
Key Concerns & Risks
As previously reported, each of the operational parts of the system have developed action plans in partnership or are reviewing existing plans to reflect the move to the Health & Social Care structure. At a time of significant change, this is more difficult to manage and monitor for services in the community.
The three biggest risks to sustaining the planned reductions are:
Management and HR capacity Any community outbreak of illness (e.g. norovirus) which can impact on short term
absence Increased pressure on the system in terms of patient numbers which in turn increases
pressure on staff capacity and can result in increased absence
Recovery Plan
NOTE – the figures quoted are 12-month rolling absence rates, not those for the individual month. This is a better way of demonstrating an improvement trend.
The May sickness absence rate for NHS Fife was 4.40%, a decrease of 0.28% from 4.68% in April. This was as a result in decreases in all operational units across the Board.
The chart below demonstrates that the last four months of 2015-16 and the first two months of 2016-17 had a lower rate of absence than that of the corresponding period of the previous financial year. This is a positive start to the 2016-17 financial year.
Page 21

Apr May Jun Jul Aug Sep Oct Nov Dec Jan Feb Mar0.00%
1.00%
2.00%
3.00%
4.00%
5.00%
6.00%
7.00%
NHS Fife Sickness Absence2014/15, 2015/16 and 2016/17 Comparison
2014/152015/162016/17
Long Term / Short Term Trend Analysis
Detailed analysis of the sickness absence trends during the rolling year from June 2015 to May 2016 shows that while long term and short term absence rates continue to fluctuate on a month to month basis, there has been sustained improvement.
In May, there was an increase of 962.87 hours in the total hours lost due to long term absence, when compared to April. Despite this increase, the overall trend in hours lost due to long term absences has been reducing in the previous 12 months.
The total hours lost due to short term absence reduced by 4,185.36 hours, when compared to April, and this was the fifth month in a row where a reduction was achieved.
Jun-15Jul-1
5
Aug-15
Sep-15
Oct-15
Nov-15
Dec-15
Jan-16
Feb-16
Mar-16
Apr-16
May-16
0
5,000
10,000
15,000
20,000
25,000
30,000
35,000
40,000
45,000
Sickness Absence Trend June 2015 to May 2016
Hours Lost by Short and Long Absence
Long TermShort Term
Tota
l Hou
rs Lo
st
Page 22

The chart below details the long term and short term sickness absence by operational unit during May. This highlights that short term absence is higher within the Corporate Services areas, whereas short term absence continues to be lower in the other three operational units. All areas of concern are being followed-up by the respective HR staff, with additional support from the Programme Management Office.
NHS Fife Acute Services DivisionCorporate Directorate H&SCP0
10203040506070
Long term and Short Sickness AbsenceBy Operational Unit
May 2016Long TermShort Term
Further analysis of the trends within NHS Fife during the 2016-17 financial year to date shows that the sickness absence levels within the Acute Services Division were within the 4% range in April (4.69%) and May (4.63%). In addition, the Health and Social Care Partnership areas were also within the 4% range for April (4.64%) and May (4.28%).
Jun-15 Jul-15 Aug-15 Sep-15 Oct-15 Nov-15 Dec-15 Jan-16 Feb-16 Mar-16 Apr-16 May-160.00
1.00
2.00
3.00
4.00
5.00
6.00
7.00
NHS Fife Sickness Absence Data by Operational Unit
June 2015 to May 2016
NHS Fife Acute Services Corporate Services Health and Social Care
Collectively, it is positive to note that the overall hours lost within NHS Fife have decreased in excess of 10,000 hours from March, supported, in part, by a reduction in the total hours lost for Nursing and Midwifery of 7,500 hours.
Page 23

Next Steps
The Staff Health & Well Being Action Plan will be implemented by the Well at Work Group, to support the application of the Health & Well Being Strategy for the Board. The Action Plan for 2016-17 concentrates on the following themes:
The Healthy Harmonies Staff Choir held its summer performance on 26 June, which was hugely successful and a further performance is planned for 27 August, at the Edinburgh Fringe Festival
The Fife Walking Challenge took place during May and was well received; a further 30 day activity team challenge is being planned for September
The Well@Work Group is promoting the “Walk to Rio”, which is encouraging staff to take part in Fife’s Summer challenge and “Walk to Rio” for the Olympic Games; this challenge is open to individuals and teams and suitable for all abilities
Fruit and Vegetable stalls are well established within the Acute Hospital sites and are available all year round. Recognising that it is often difficult to leave clinical areas, an new e-mail service is available to the clinical teams 48 hours before the stalls are on site, so that staff who previously did not have time to use this facility can request an order in advance.
The local Well@Work Groups are supporting different workshops / themes / events throughout the year to promote staff health. Hydration Week was celebrated with bottles of water being served alongside new menu options in the canteen, and a taster menu with bottles of water offered to staff, patients and relatives in the foyer of the Acute Hospitals.
We supported Mental Health Awareness Week in May and, taking account of what we know about staff absence relating to Mental Health issues, we are actively promoting the Steps on Stress programme throughout 2016. Any member of staff can access a programme of three sessions held within community premises, which provide guidance for managing stress, both within and outwith the workplace.
Keep Well Staff Mini Health Checks are taking place over the coming months, details of which are publicised to staff via the Intranet and poster campaigns on notice boards.
Following NHS Fife being awarded the Gold Healthy Working Lives Award in May, arrangements are being made to build on this achievement and to implement the minor recommendations made by Healthy Working Lives in the Award Report. This links to on-going work to refresh the Health Promoting Health Service agenda within the Board.
In terms of Attendance Management, all areas of the Board, supported by HR and the Programme Management Office, continue to review their Action Plans detailing the recovery steps required within their areas to ensure NHS Fife as a whole achieves the agreed 4.5% sickness absence trajectory by 31 March 2017.
These recovery plans continue to build on the following points:
Review & Improvement Panel meetings continue to take place to review short and long term absence cases
Identification of the core reasons for sickness absence within Divisions and Directorates, and what supportive steps can be implemented to minimise absences occurring in future
Analysis of sickness absence trends (e.g. patterns of absence, are instances of short term sickness absence increasing, or are the duration of instances increasing)
Identification of steps required to prevent increases in short term absence during the first two years of employment
Page 24

Consideration of a range of measures to support the return to work of staff on long term absence
Whether there is a correlation between sickness absence trends within the Divisions and Directorates and the entitlement to Occupational Sick Pay, and the steps managers are taking to address this
Roll-out of the Management of Attendance Resource pack on a targeted basis continues and to all areas thereafter, with publication of supporting documentation via the Intranet
Page 25

HEALTH & SOCIAL CARE INTEGRATIONThe Chief Officer (Director of Health and Social Care) reports to the Chief Executive, NHS Fife and the Chief Executive, Fife Council. Joint performance review meetings involving both Chief Executives and the Director of Health and Social Care take place on a regular basis in accordance with each organisation’s normal performance management arrangements. The Director of Health & Social Care has overall responsibility for the delivery of the Standards reported in this section and for determining further activity, commissioning and performance data for measuring progress in delivering the aims and objectives of the partnership.
DEMENTIA POST-DIAGNOSTIC SUPPORT
All patients diagnosed with Dementia will have a minimum of a year’s post-diagnostic support and a person centred support plan
Background
The offer of Dementia Post-Diagnostic Support (DPDS) which meets the Alzheimer’s Scotland (5 Pillars) standard is relatively new and is in direct response to the national standard having been set. It is in addition to other support care treatment which would have been taking place as a matter of routine work.
The current workforce identified for the task comprises a mixture of mental health, psychology, Alzheimer’s Scotland and other resources operating from three geographically based hubs. There has been success in clearly articulating and streamlining pathways to diagnosis and to PDS. This success has now left us with the challenge of managing high referral volumes.
In order to future proof the offer of DPDS in Fife we have reviewed existing workforce budgets and devised a management arrangement which provides a functional level of coordination, standardisation and quality assurance.
Performance
Guidance for measuring and reporting on this target, and the target itself, was expected to be available in December, possibly as part of the guidance for the 2016-17 Local Delivery Plan. The latter was not issued until mid-January, but guidance regarding PDS performance was not included. This is being pursued with ISD and the SGHSCD.
It is likely that the focus of the PDS measure will be on patients diagnosed with dementia and their initial contact with a link support worker, rather than the previous focus of having 1-year post-diagnostic support and a support plan. When this is clarified, we expect to be able to provide some local performance information and to then consider what type of recovery improvement is required.
Key Concerns & Risks
The main risk to achieving this target is:
Managing demand and capacity
Recovery Trajectory
This is not available at present, pending further guidance from the Scottish Government around predicted dementia prevalence and the support target.
In the absence of a meaningful measure and improvement trajectory, we are able to provide some relevant data from the monthly Management Reports produced by ISD. At the end of May, the summary position was as shown below.
Page 26

Month EndCumulative Referrals for
Dementia PDS
12 Months PDS Completed
Referrals, yet to Start or Complete
PDSPDS Ongoing
May-16 1188 287 901 460
These figures date back to March 2014, when data was first collected.
A number of patients who have been referred to the service will either be waiting to be allocated a Link Worker, waiting for first contact with a Link Worker, have refused support or have died.
Recovery Plan
Leads:Month Apr May Jun Jul Aug Sep Oct Nov Dec Jan Feb MarActualPlanned
Action
1.1
1.2
1.3
1.4
TBD
2016
Redesign service in order to ensure current resources are more evenly spead throughout Fife, and that there is increased throughput and shortened waiting
Identify additional capacity (approx 8 wte workers) for dementia post diagnostic support from within existing budgets
Work to achieve across agency operational and strategic join up of dementia related services
Modernise IT infrastructure to anable electronic reporting
2017Sally O'Brien / Margaret Pirie / Julie Paterson
Situational Analysis
We have been unable to identify additional capacity within the existing workforce. However, new management arrangements have been put in place, and this has enabled a review of existing provision and implementation of systems and processes which will ensure a more flexible and efficient use of the existing resource.
The waiting time continues to reduce monthly across Central Fife with the longest wait now under 3 months (33 patients on the list). West Fife has 4 patients waiting over 9 months, 4 waiting over 6 months and 24 waiting between 3 and 6 months but overall the number of people waiting continues to reduce. There is currently no waiting time in North East Fife area.
A plan in which we are aiming to reduce the waiting time for new referrals to the DPDS to two weeks is currently being implemented. In addition, we are aiming for all people currently on the waiting list for support to be appointed to a worker and be seen within the next 8 weeks.
Page 27

DELAYED DISCHARGE
No patient will be delayed in hospital for more than 2 weeks after being judged fit for discharge
(From 1st April, the Integration Joint Board is focusing on a 72-hour discharge target as one of its Key Performance Indicators, and we will reflect this in our own reporting in due course).
Key Concerns & Risks
The joint Delayed Discharge Task Group continues to monitor and manage the demand for placements and services across the partnership on a weekly basis. A significant amount of modeling work has been undertaken to try to understand the pressures across the system and in particular the reason people are in delay.
The Delayed Discharge Action Plan is closely monitored at weekly senior management meetings (DDTG) and every effort will be made to mitigate any risk.
Recovery PlanLeads: Belinda Morgan / Claire Dobson
Monthly Census Jan Feb Mar Apr May Jun Jul Aug Sep Oct Nov Dec Jan Feb MarActual 45 37 29 28 41 38
Planned 0 0 0 0 0 0 0 0 0 0 0 0 0 0 0
Action
1.1
1.2
1.3
1.4
1.5
1.6 Complete a consultation exercise with service users and families
Roll out START - wraparound model of home care for all discharges
Re-commence front door assessments and home care from the Victoria Hospital
Review STAR beds across the 4 sites and implement recommendations from the evaluation
Develop and implement two integrated assessment units
Implement a joint standardised discharge planning bundle across all sites and associated staff / client branded information
2017
Number of Patients Waiting > 2 Weeks for DischargeStandard = 0
2016
Note that the ‘Actual Performance’ figures relate to the situation at the monthly census, currently generally taken around the 15 th of the month (changing, from July 2016, to be the last Thursday of the month) – the number in delay will vary from day to day.
Situational Analysis
As part of wider intermediate care planning, the STAR bed unit in Ostlers Way has opened. The unit has capacity for 12 patients, increasing our capacity to 34 beds Fife-wide, across four units (Alan McLure, Ostlers Way, Preston House and Valley House). The intention is to increase STAR beds to 50 across an additional 2 units. An additional 12-bed assessment unit at Raith Manor was opened at the end of May with patient admissions from the start of June, with a further assessment unit to support capacity across the East locality being planned to open by the end of July.
After a successful pilot for re-starts for home care packages, full implementation for all new re-starts of packages of care has been implemented across the VHK and all community hospitals. Consideration is now being given to extend this to include an additional 5 hours of care as part of the re-start discharge plan.
Home care models continue to be strengthened to ensure timely access to appropriate care within a person’s own home. To this end the START model of rapid access to home care from the VHK, and QMH commenced 11th July. The Avenue front door model which supports early access to home care at the point of pre admission to an acute setting also commenced at the beginning of July. Together these will greatly improve waiting times for care at home, thus reducing delays
Page 28

SMOKING CESSATION
We will deliver a minimum of 602 post 12 weeks smoking quits in the 40% most deprived areas of Fife
Note: This is the target for 2015-16. The final figure for the year is now available, and we will start to report against the new target (779 quits) next month.
Key Concerns & Risks
The actions described will ensure NHS Fife delivers good outcomes in relation to quit rates, but the data trend suggests we will not achieve the 2015-16 target.
There are a number of risks that must be considered:
Pharmacy changes which require a new follow-up model to become embedded The increasing rise of e-cigarettes (seen by smokers as a stop smoking aid)
These challenges are addressed at monthly management meetings and a quarterly task meeting. Actions are put in place accordingly.
Recovery Trajectory
Recovery Plan (2016-17)Leads: Belinda Morgan / Julie Paterson
At Month End Apr May Jun Jul Aug Sep Oct Nov Dec Jan Feb MarActual QuitsPlanned Quits 65 130 195 260 325 390 455 520 585 650 715 779
Action
Specialist
1.1
1.2
1.3
1.4
Pharmacy
2.1
3.1
2017
Number of Successful Post-3 Month Quits in 40% Most Deprived CommunitiesTarget/Standard = 779
2016
Partnerships with other groups / organisations
Improve links and representation at appropriate MCNs
Monitor and evaluate standardised procedures within centralised Fife wide team to ensure effective service delivery
Continue to develop innovative approaches to target hard to reach clients
Review follow-up rates to see if further improvement can be targeted
Plan and deliver appropriate training programmes across the workforce and to priority staff groups
Develop pathways which ensure a targeted approach is being taken for the appropriate communites
Situational Analysis
Clinic activity has been re-orientated to target high prevalence and SIMD 1 and 2 communities practices. New clinics are now on stream with additional late night opening and the expansion of Quitfit model within Cowdenbeath Leisure Centre.
New pathways are being developed in populations with highest smoking prevalence which include clients with mental health issues, teenage parents and pregnant woman, and greater opportunities to support clients within social services are being explored.
A mid-year review workshop is being held in August to review any lessons learned from current performance and support operational planning for the future.
Page 29

CHILD AND ADOLESCENT MENTAL HEALTH SERVICE WAITING TIMES
At least 90% of clients will wait no longer than 18 Weeks from referral received to treatment for specialist child and adolescent mental Health Services (CAMHS)
Key Concerns & Risks
The process to recruit staff to work with the Therapeutic Service for Looked After Children and the Health Psychologist to support front line childrens’ services workers is underway. The Therapeutic Service for Looked After Children will improve access to CAMHS for looked after children but will only have a modest impact on waiting times. The appointment of the Health Psychologist is part of a strategic development to provide specialist training, advice and support to the wider children’s workforce to enable earlier intervention by these workers and reduce the need for referral to specialist CAMHS.
The current improvements in waiting times to access CAMHS has been brought about by the recovery plan which amongst other initiatives increased the number of new cases that each CAMHS clinician is expected to see in a month. There are early indications that improvement will not be sustained in the long term without additional staff. This is because case loads are becoming saturated with young people with complex and serious problems who require longer term therapeutic input and monitoring.
Another consequence of increasing the face to face activity of CAMHS staff is that they are less available to support other frontline childrens’ services workers resulting in an increase in referrals to tier three CAMHS.
The sustainability of the current approach depends on the allocation of new Scottish Government funding (£85 million over five years) to deploy a team of Primary Mental Health Workers (PMHW). These PMHW alongside the Health Psychologist and Playfield Institute will take up the role of supporting frontline children’s services workers to help them intervene earlier reducing the need to refer to tier three CAMHS. The PMHW will also provide more high volume low intensity work such as brief therapy and group work and so increase the capacity of CAMHS. A detailed proposal has been prepared and is awaiting approval and the allocation of the new government funding.
Recovery PlanLeads: Graham Buchanan / Margret Pirie / Julie Paterson
3 Months Ending Jan Feb Mar Apr May Jun Jul Aug Sep Oct Nov Dec Jan Feb MarActual 82.9% 83.0% 83.6% 83.8% 85.3%
Planned 88.0% 90.0% 90.0% 84.0% 84.5% 85.0% 85.0% 86.0% 87.0% 88.0% 89.0% 89.0% 90.0% 90.0% 90.0%
Action
1.1
1.2
1.3
1.4
1.5
1.6 Appoint project manager for rolling out new IT systems
Build services for LAAC children in accordance with current plans for multi-agency integrated delivery
Build service for children who have been sexually abused in accordance with current plans for multi-agency integrated delivery
Build capacity of school nursing through additional training
Use promised SG new investment for new posts/capacity, especially with a view to delivering more groupwork
Modernise IT infrastructure to enable DCAQ work
2017
% Patients Starting Treatment Within 18 Weeks of ReferralStandard = 90%
2016
Note that the ‘Actual Performance’ figures shown are for 3-month periods ending those months, not for the individual months themselves. In May alone, performance was 86.8%.
Situational Analysis
While the redesign of the CAMHS tier three services and the increase in case load work have brought about short term improvements in waiting times this is creating a perverse effect by reducing support to other frontline childrens’ services workers resulting in an increase in the number of referrals to CAMHS. The solution to this continues to be the appointment of a Health Psychologist and Primary Mental Health Workers to improve support to frontline childrens’ services workers and to more provide high volume high low intensity interventions.
Page 30

PSYCHOLOGICAL THERAPIES WAITING TIMES
At least 90% of clients will wait no longer than 18 weeks from referral received to treatment for psychological therapies
Key Concerns & Risks
The 2015-16 improvement plan initially focused heavily on investing in additional therapists utilising the Scottish Government new monies attached to this target. Due to a delay in the release of these funds, additional staff have not yet been recruited, and it is anticipated that recruitment will start midway through the FY.
The plan and trajectory have therefore been reviewed and updated. Alongside the additional recruitment, work continues to increase access to an enhanced range of psychological interventions and therapies within a tiered model of service delivery. The model includes online delivery of evidence-based therapy and group programmes as well as individual therapy.
The main risks to achieving the Standard are as follows:
Inadequate capacity to meet demand An absence of suitable community venues across Fife
Recovery PlanLeads: Dr Katherine Cheshire / Margaret Pirie / Julie Paterson
3 Months Ending Jan Feb Mar Apr May Jun Jul Aug Sep Oct Nov Dec Jan Feb MarActual 72.2% 72.2% 72.0% 72.8% 75.6%
Planned 76.0% 82.0% 90.0% 71.0% 72.0% 73.0% 74.0% 75.0% 76.0% 78.0% 80.0% 82.0% 84.0% 87.0% 90.0%
Action
1.1
1.2
1.3
1.4
1.5
1.6
1.7
1.8
Scope the workforce to better understand current capacity
Make sure that clinicians have access to clinic space across Fife
Modernise IT infrastructure to enable DCAQ and reporting
Appoint PT Development Lead
Appoint PT Training Co-ordinator
Introduce access to computerised CBT as alternative to referral
Set up 'clinics' to enable continuous access across Fife to groups for anxiety/depression
Use promised new investment to appoint 8 wte new therapists
2017
% Patients Starting Treatment Within 18 Weeks of ReferralStandard = 90%
2016
Note that the ‘Actual Performance’ figures shown are for 3-month periods ending those months, not for the individual months themselves. In May alone, performance was 79%.
Situational Analysis
Task 1.7 Lack of suitable clinics community venues continues to restrict access and reduce efficiency; further work is required to identify additional options, though there will be some progress when QMH opens up additional clinic space in late Summer
Task 1.8 Implementation of TIARA will begin within Psychology in August; a start date for implementation of Trakcare within Mental Health has yet to be agreed; it is currently not possible to provide a revised forecast completion date for this action
Page 31

RECOMMENDATION
The Finance, Performance and Resources Committee are asked to:
Note the key items of information highlighted within the Integrated Performance Report, in particular those listed in the Executive Summary
Carol Potter Jann GardnerInterim Director of Finance Director of Planning 26 July 2016 and Strategic Partnerships
26 July 2016
Page 32

SECTION BCAPITAL PROGRAMME 2016/17
CAPITAL RESOURCE LIMIT
Health Boards are required to work within the capital resource limit set by the Scottish Government Health & Social Care Directorates (SGHSCD). This is monitored by SGHSCD via the monthly Financial Performance Return.
1. INTRODUCTION
1.1 This report provides an overview on the capital expenditure position as at the end of June 2016, based on the Capital Plan 2016/17, as approved by the NHS Board on 23 February 2016.
2. EXPENDITURE TO DATE / MAJOR SCHEME PROGRESS
2.1 Details of the expenditure position across all projects is attached as Appendix A.
2.2 Project Leads have provided an estimated spend profile against which actual expenditure is being monitored. This is based on current commitments and historic spending patterns. The overall profile will need to be adjusted once the Capital Equipment Programme has been finalised.
2.3 The estimated spend profile for the period to 30 June 2016 is £3.273m (29.3% of the total allocation).
2.4 The expenditure to date amounts to £3.275m, in line with the plan, as shown in Appendix B. The expenditure for the first three months reflects the on-going work on the Board’s three major capital schemes which commenced in 2015/16, with the main areas of spend since the previous report to the Board include:
Telephone System £0.245m Queen Margaret Carnegie Unit £0.0.70m Statutory Compliance/Backlog Maintenance £0.075m
2.5 The final element of the funded General Hospitals and Maternity Services Project is the completion of the Carnegie Unit on the Queen Margaret Hospital site. The project is running to timescale and was handed over by the contractor at the beginning of July. The project is within budget subject to confirmation of the VAT position.
2.6 The Replacement Telephone System is a scheme costing £4.3m in total. The project has started with the installation of the core kit and the first of the deployments on the Lynebank Hospital site. This phase has been completed, with the system going live on the 1 June 2016. The next phase of the project involves the deployment of the new system to Queen Margaret Hospital and this is currently due to go live by the end of August. The system is then being rolled out to other premises with the final community hospitals going live in February 2017. The Victoria Hospital site is scheduled to go live in September.
3. CHANGES TO CAPITAL RESOURCE LIMIT
Page 33

3.1 The Board has received its Formula Allocation of £7.394m and also £3.777m in Specific Allocations which fund the Telephone System and the Stratheden IPCU.
4. CHANGES TO PLANNED EXPENDITURE 2016/17
2.2 Appendix C shows the changes in the plan since the previous Report to the Board. The changes this month are small in value and reflect the allocation of additional monies for backlog maintenance schemes.
5. CAPITAL RECEIPTS
5.1 The Board’s Capital Programme is partly funded through Capital Receipts. This is currently estimated at £2.195m in the Local Delivery Plan. Work continues on asset sales with several disposals planned:
Lynebank Hospital Land Plot 2 (South) - Negotiations with Preferred Bidder are continuing. The Developer has submitted Full Planning Application to Fife Council and a decision is expected in July 2016;
Lynebank Hospital Land (Plot 1) (North) - Property Advisor has begun negotiations with the preferred bidder;
Forth Park Maternity Hospital – Property Advisor remarketing the site with a closing date for offers to be set;
Netherlea Hospital – Three bids have been received for the site and following evaluation by the Property and Legal advisors a preferred offer is being accepted;
Barrie Street Clinic – This property will now go for remarketing; Townhill Day Hospital – A Property Adviser has been appointed and marketing of
the property will commence in the next couple of weeks; Abbeyview Clinic - Property Adviser appointed and is currently developing
marketing strategy; and Carnegie Clinic - Property Adviser appointed and is currently developing
marketing strategy.
5.2 To support implementation of the Board’s clinical strategy and the wider financial strategy, a detailed review of all assets will be taken forward over the coming weeks and months. This will proactively seek opportunities to accelerate any asset disposals.
5. CAPITAL EXPENDITURE OUTTURN
5.1 At this stage of the financial year it is currently estimated that the Board will spend the Capital Resource Limit in full.
6. RECOMMENDATION
6.1 The Finance, Performance & Resources Committee are asked to:
note the capital expenditure position to 30 June 2016;
Page 34

APPENDIX ANHS FIFE - TOTAL REPORTS
CAPITAL PROGRAMME EXPENDITURE REPORT - JUNE 2016
FOR FINANCIAL YEAR 2016/17
CRL Total Projected New Expenditure Expenditure Projected Funding to Date 2016/17 VarianceProject £ £ £ £ Major Capital Stratheden - IPCU 320,000 320,000 320,000 Statutory Compliance Kirkcaldy Health Centre - Workplace Transport 20,000 20,000 Stratheden Hospital - Lomond Ward Fire Hazard Rooms 40,000 40,000 40,000 NE Fife Asbestos Removal 30,000 30,000 NE Fife Legionella Works 20,000 20,000 West Fife Asbestos Removal 60,000 60,000 West Fife Legionella Works 20,000 20,000 Lynebank - Air Handling Unit Installation 30,000 30,000 Lynebank - Replacement Water Mains 80,000 80,000 Lynebank - Roofing Replacement 50,000 610 50,000 Lynebank - Workplace Transport 20,000 20,000 Total Statutory Compliance 370,000 40,610 370,000 Capital Minor Works Community Minor Works Balance 170,500 170,500 Whytemans Brae - Seaview Works 30,000 30,000 Glenrothes Hospital - Reception Area 35,000 35,000 Lynebank - Mayfield Unit Noise Reduction 32,000 32,000 Total Minor Works 267,500 267,500 Capital Equipment Capital Equipment Balance 120,000 120,000 Total Capital Equipment 120,000 120,000 Information Technology Telephone System 3,654,000 1,459,672 3,654,000 Data Centre Upgrades 200,000 200,000 Desktop Replacement 350,000 86,506 350,000 Network Development 50,000 50,000 Server/System Replacement 491,000 491,000 Total I.T. 4,745,000 1,546,178 4,745,000 Vehicle Replacement Vehicle Balance 89,850 89,850 Citroen Berlingo Panel Van 150 150 150 Total Vehicle Replacement 90,000 150 90,000
Page 35

Acute Services Division Main Schemes GHMS - Carnegie QMH 635,000 576,000 635,000 Total Main Schemes 635,000 576,000 635,000 Acute Services Div Statutory Compliance VHK - Asbestos Removal 50,000 3,577 50,000 VHK - Cold Water Fill Point 9,000 9,000 VHK - Drainage Replacement Ph2 20,000 2,000 20,000 VHK - Fire Detection System Upgrade 60,000 18,000 60,000 VHK - Fire Escape Stairwells 290,000 70 290,000 VHK - Laundry Roof Lights 100,000 100,000 VHK - Legionella Works 40,000 40,000 VHK - LV System 95,000 20,685 95,000 VHK - Pneumatic Tube System 110,000 110,000 110,000 VHK - Roofing Replacement 60,000 60,000 VHK - Ward 13 Fire Hazard Rooms 30,000 15,000 30,000 VHK - Ward 5 Water Ingress 480,000 480,000 VHK - Workplace Transport 28,500 735 28,500 QMH - Fire Hazard Rooms 75,000 75,000 QMH - LV System 55,000 55,000 QMH - Maternity Services 400,000 400,000 QMH - Roofing Replacement 100,000 100,000 Total Statutory Compliance 2,002,500 170,067 2,002,500 Acute Services Division Minor Capital Acute Minor Works Balance 138,116 138,116 VHK - Dermatology Works 60,000 60,000 VHK - Door Closers 37,500 37,500 VHK - Orthodontic Corridor Works 35,000 35,000 VHK - Tower Block Office Upgrade 10,000 3,000 10,000 VHK - Ph3 Theatre Ventilation 30,000 30,000 VHK - Midwives Clean Store Area 10,000 10,000 VHK - Ward 9 6,884 6,884 6,884 Total Minor Works 327,500 9,884 327,500 Acute Services Division Capital Equipment Capital Equipment Balance 774,853 774,853 Theatre Table System 603,544 603,544 603,544 Sure Store Conditioning Unit 29,995 29,995 Home Dialysis Set Up 3,641 3,641 3,641 Colonoscope * 2 84,000 84,000 ICU Monitors * 4 52,163 52,163 Scopeguide 43,500 43,500 Incubators * 2 24,304 24,304 Lab Autoclaves 216,000 216,000 Total Capital Equipment 1,832,000 607,185 1,832,000 Condemned Equipment Condemned Equipment Balance 90,000 90,000 Total Condemned Equipment 90,000 90,000 NHS Fife Wide Statutory Compliance/Backlog Maintenance Fife Wide Stat Compliance Balance 93,500 93,500 ADC - Roller Shutter Door Replacement 5,000 5,000 Fife Wide - Energy Management Scheme 200,000 200,000 Fife Wide - Gas Compliance Works 30,000 4,937 30,000 Total Statutory Compliance/Backlog Maintenance 328,500 4,937 328,500
Page 36

Fife Wide Scheme Development 43,000 43,000 TOTAL ALLOCATION FOR 2016/17 11,171,000 3,275,011 11,171,000
Page 37

Apr May June July Aug Sept Oct Nov Dec Jan Feb Mar0
5000
10000
15000
Capital Spend Profile 2016/17
ActualForecast
Months
Cum
ulat
ive
£000
's
Page 38

APPENDIX CChanges to Planned Expenditure Capital Expenditure 2016/17 Board June F & R 28/06/2016 Adj £ £ £ Specific Schemes Community & Primary Care Stratheden IPCU 320,000 320,000 Acute Services Division General Hospitals & Maternity Services - QMH Carnegie 635,000 635,000 Fife Wide Telephone System 3,654,000 3,654,000 4,609,000 4,609,000 Routine Expenditure Community & Primary Care Minor Capital 267,500 267,500Capital Equipment 120,000 120,000Statutory Compliance 370,000 370,000 Acute Services Division Capital Equipment 1,832,000 1,832,000Minor Capital 327,500 327,500Statutory Compliance 1,989,500 13,000 2,002,500 Fife Wide Vehicles 90,000 90,000Information Technology 1,091,000 1,091,000Backlog Maintenance/Statutory Compliance 341,500 (13,000) 328,500Condemned Equipment 90,000 90,000Scheme Development 43,000 43,000 6,562,000 6,562,000 11,171,000 11,171,000
Page 39

SECTION C
FINANCIAL POSITION TO 30 JUNE 2016
REVENUE RESOURCE LIMIT
Health Boards are required to work within the revenue resource limit set by the Scottish Government Health & Social Care Directorates (SGHSCD). This is monitored by SGHSCD via the monthly Financial Performance Return.
Key Concerns & Risks
The Local Delivery Plan and supporting Financial Plan were discussed at the Board meeting on 28 June 2016 and subsequently submitted to SGHSCD.
The Revenue Resource Limit position for NHS Fife for the three months to 30 June 2016 is showing anoverspend of £4.576m. This compares favourably against the £5.775m overspend shown in the estimated trajectory as detailed in the table below. The forecast outturn is currently estimated at £10.335m compared to the overall target of £9.4m.
A detailed report is set out on the following pages
Page 40
Financial TrajectoriesMonth May June July Aug Sept Oct Nov Dec Jan Feb MarchActual 2,403 4,576Plan 3,850 5,775 7,699 9,625 11,550 11,474 11,400 11,325 10,683 10,041 9,400Forecast Outturn 10,335Overall Target 9,400 9,400 9,400 9,400 9,400 9,400 9,400 9,400 9,400 9,400 9,400

1. Summary Position
1.1. At the end of June NHS Fife is reporting an overspend of £4.576m against the revenue resource limit (RRL). The position is detailed in Table 1 below.
Table 1: Financial Position by Operational Unit for the Period ended June 2016
Year end FY CY YTD Actual Variance Variance Forecast
£'000 £'000 £'000 £'000 £'000 % £'000
Acute Services Division- Planned Care & Surgery 82,603 86,470 21,707 21,930 223 1.03% 939- Emergency Care & Medicine 63,098 66,840 17,048 17,420 372 2.18% 816- Clinical Support And Access 32,592 33,384 8,441 8,457 16 0.19% 0- Acute Nursing 692 692 203 202 (1) -0.49% 0- Other 2,421 3,674 182 181 (1) -0.55% 0Total 181,406 191,060 47,581 48,190 609 1.28% 1,755Integration Joint Board- West Division 28,714 31,043 7,759 7,713 (46) -0.59% 75- Fife Wide Division 88,486 92,536 23,488 22,949 (539) -2.29% (1,776)- East Division 22,059 23,877 5,901 6,132 231 3.91% 1,080- Prescribing 75,205 75,205 18,507 21,014 2,507 13.55% 3,500- PMS 41,412 43,161 10,814 10,821 7 0.06% 30- FHS 35,889 41,441 10,361 10,361 0 0.00% 0- Resource Transfer & Board Vol Orgs 20,709 22,461 5,846 5,844 (2) -0.03% 0- Integration Fund & Other Allocations 32,113 26,072 0 0 0 0.00% 0- IJB Savings (9,150) (9,150) (563) 0 563 -100.00% 2,250Total 335,437 346,646 82,113 84,834 2,721 3.31% 5,159IJB Non-delegated 12,134 12,284 3,126 3,084 (42) -1.34% (61)Estates & Facilities- Estates 18,667 18,667 4,667 4,705 38 0.81% (199)- Facilities 47,765 47,765 11,882 11,686 (196) -1.65% (673)Total 66,432 66,432 16,549 16,391 (158) -0.95% (872)Board Admin & Other Services- Board Admin 24,164 29,118 7,110 6,997 (113) -1.59% (550)- Board Other 7,345 7,565 1,901 1,937 36 1.89% 799- OHSAS 2,580 2,721 786 774 (12) -1.53% 0- Depreciation 19,144 19,148 4,518 4,518 0 0.00% 0Total 53,233 58,552 14,315 14,226 (89) -0.62% 249Non Fife & Other Healthcare Providers 78,980 78,361 19,639 19,799 160 0.81% 1,297NHS Fife Commitments- Impairments & provisions 10,000 10,013 0 0 0 0.00% 0- General 24,559 9,104 377 0 (377) -100.00% (4,267)Efficiency Savings - HB (13,648) (13,510) (1,787) 0 1,787 -100.00% 7,150Total Expenditure 748,533 758,942 181,913 186,524 4,611 2.53% 10,410
Miscellaneous Income (71,947) (71,947) (18,747) (18,782) (35) 0.19% (75)
Net position including income 676,586 686,995 163,166 167,742 4,576 2.80% 10,335
Budget Expenditure
1.2. The underlying issue during the period is the overspend resulting from the recognition of the unidentified savings. Further detail on the operational budget performance is provided in section 3 below.
1.3. An early estimate of the annual outturn has been included this month and would suggest that the Board has a projected year end overspend of £10.3m. This is in excess of the £9.4m overspend shown in the LDP as unidentified savings.
Page 41

2. Revenue Resource Limit
2.1. Since the previous Report to the Board additional allocations totaling £60.281m have been received. The Boards total Core Revenue Resource Limit (RRL) now stands at £663.680m for the year.
2.2 The major additional allocations received during the month included £45.301m for the annual Primary Medical Services funding, £2.236m for Public Dental Services and £1.718m for Primary Medical Enhanced Services. The Outcomes Framework funding of £9.888m has also been received. This allocation is the amalgamation of several bundled allocations which were received individually in previous years. These former allocations are shown in Appendix 1.
3. Operational Financial Performance
3.1. Across all operational areas, the agreed cash releasing efficiency savings targets (CRES) have been removed from opening budgets, as agreed by the Finance & Resources Committee in March; these total £7.7m across the system. The reported positions therefore, reflect these reductions in budget and any over or underspend at an operational level is net of the savings delivery.
Acute Services
3.2. The Acute Services Division is reporting an overspend of £609k for the period. With the application of cost pressure funding to the budgets this year, this has made a significant improvement to the position in comparison to the previous year’s outturn.
3.3. There are a number of budget over and underspends across departments in both pay and supplies, including medical staffing, instruments & sundries and diagnostic supplies. The main driver of the reported overspend is the impact of the budget reduction in respect of the CRES target and the extent to which agreed savings plans are in place and implemented at this early point in the year. Work continues in partnership to identify further savings opportunities to achieve the CRES target required, with a robust process in place via the Acute Services Management Team.
Integration Services
3.4. The Integration Joint Board budgets (encompassing the former CHP budgets, primary medical services, primary care emergency service (PCES) and family health services) show a net overspend of £2,721k for the 3 months to date. This position comprises an overspend of £2,507k across prescribing and £563k of unidentifed savings to date, offset in part by an underspend within community services of £349k
3.5. The overspend within prescribing is based on one month’s actual data and informed estimates for the other two months and reflects the known increases in the average costs and volumes of medicines.
3.6. There are underspends across a range of budgets largely due to: vacancies in community nursing, health visiting, school nursing, community and general dental services, and administrative posts. However, these are offset by the level of expenditure on complex care packages, and unidentified efficiency savings at this early point in the financial year.
Page 42

Estates & Facilities
3.7. The Estates & Facilities Directorate is underspent by £157k for the period. The key areas of overspend include property rates (£101k) due to a loss of disabled rent relief and postages (£41k) due to an increase in the volume of activity. These overspends are offset by underspends related to a number of vacant posts.
3.8. The Directorate has delivered £397k current year and £363k full year cash releasing savings against a target of £1m, with further detailed work underway on a range of other proposals.
Corporate Departments
The Corporate Departments are collectively reporting an underspend of £77k. Vacancies account for most of the underspend, with the departments closely monitoring any potential for non replacement of staff and staff mix changes where possible. Legal fees are showing an overspend of £166k to date and the average spend per month is £91k when compared to monthly budget of £35k.
3.9. Efficiency savings of £1,663k have been removed from budgets of which £1,429k has been identified in the current year and £1,334k on a full year basis
Service Level Agreements and Other Healthcare Providers
3.10. An overspend of £160k is shown for the period. Whilst Service Level Agreements with other Scottish Boards is showing a £196k underspend there is a combined overspend of £356k on OATS and UNPACS Activity. The main reason for the overspend is due to the transfer of a Learning Disability patient from Lynebank to a private facility in England.
Income
3.11. A small over-recovery of £35k is shown for the period.
4. Subjective Analysis
4.1. Analysis of the pan NHS Fife financial position by subjective heading is summarised in Table 2 below.
Table 2: Subjective Analysis for the Period ended June 2016
Annual Budget
Budget to date
Actual to Date
Over/ (Under)
£'000 £'000 £'000 £'000Pay 322,392 80,474 79,913 (561)GP Prescribing 75,205 18,507 21,014 2,507Drugs 31,542 7,916 7,801 (115)Other Non Pay 312,443 77,845 77,798 (48)Efficiency Savings (22,660) (2,350) 0 2,350Operational CRES (5,169) (855) 0 855Commitments 45,189 377 0 (377)Income (71,947) (18,747) (18,782) (35)Net over/(under)spend 686,995 163,167 167,744 4,576
Page 43

Pay
4.1 The overall Pay budget currently shows an underspend of £561k; however underspends across a number of other staff groups mask the position within Nursing and Midwifery, where there is an overspend of £199k for the period.
Drugs & Prescribing
4.2 Across the system, there is an overspend of £2,392k on medicines. This is due to an overspend of £2,507k in GP Prescribing areas offset by the underspend of £322k in the cost of drugs prescribed by the Community Services Divisions. A small overspend of £207k is shown for Acute Services Drugs.
GP Prescribing is reporting both an increase in cost per item of 3.49% (38p per item) and a 6.59% increase in the number of scripts against the same period 2015/16. Despite a 4% increase in budget the budget available for the period April to June 2016 is less than that for 2015/16 due to the removal of prior year savings of £2,947k and current year investment in Scriptswitch.
All of the above have resulted in the overspend reported to date.
4.3 It is important to note that funding for SMC approvals and new medicines is held at a corporate level at this point in the year. Given the volatility of both the price and volume of medicines, and the impact of individual high cost drugs, this is an area that will be monitored closely as the year progresses and funding allocated as appropriate.
Other Non Pay
4.4 Other non pay budgets across NHS Fife are collectively underspent by £48k, although within this there is an overspend on equipment of £242k. This will be reviewed further to determine the key drivers and any remedial management action required.
5 Reserves
5.1 Included within the Reserves is £10.012m in respect of Impairments and Annually Managed Expenditure (AME) which is the estimate of funding to be received from SGHSCD once Property Valuations and the calculation of Pensions / Early Retirement provisions have been made.
6 Efficiency & Productivity
6.1 The Financial Plan presented to the Board in June 2016 highlighted the requirement for £30.8m cash efficiency savings to support financial balance in 2016/17. Of this target, £7.7m is assumed to be delivered through general operational efficiencies (ie CRES), with a further £5m identified against potential service changes, an estimated £7m associated with national initiatives and £1.7m of financial flexibility. The current reported shortfall is therefore £9.4m for 2016/17. At the time of writing this is subject to further discussion with SGHSCD
Page 44

6.2 CRES schemes totalling £3.5m have so far been identified and removed from budgets. Proposals to deliver the remaining balance of CRES targets and potential service changes are continuing to be developed in partnership and through the leadership of the Executive Directors.
7 Key Actions
7.1 The immediate key actions are the continued identification of further opportunities to close the residual gap and review the GP prescribing information with a view to lowering the current overspend in this area. Where efficiency proposals have already been identified, every effort is being made to ensure they are implemented timeously.
8 Recommendation
8.1 The Finance, Performance and Resources Committee are asked to:
Note the reported overspend of £4.6m to 30 June 2016.
Page 45

SECTION DSCOTTISH PATIENT SAFETY PROGRAMME REPORT
NHS FIFE BOARD VALUE: Safety First
We aspire to be Clinically excellent
We will:
ensure there is no avoidable harm; embed patient safety consistently across all aspects of healthcare provision
1. Purpose of the Report
1.1. This report covers June 2016. Its purpose is to provide assurance to the Board on the Scottish Patient Safety Programme provided across NHS Fife.
1.2 The SPSI harms identified by the Scottish Patient Safety Indicator (SPSI) are:
Cardiac arrests Falls Pressure ulcers CAUTI
1.3 We report on the following measures:
Core:
Outcome measures relating to the harms of SPSI (including CAUTI) Process measures relating to the harms of SPSI (including CAUTI and Sepsis) Measures relating to Medicines
Supplementary:
Process measures relating to VTE, Heart Failure and Surgical Site Infection
1.4 The revised measurement plan highlights a change to the pressure ulcer indicator, which is seeking a 50% reduction in the pressure ulcer rate by December 2017.
2. Discussion of Key Areas
2.1 HSMR
Title Hospital Standardised Mortality Ratio (Victoria Hospital and Queen Margaret Hospital)
Numerator Total number of in-hospital deaths and deaths within 30 days of discharge from hospital
Denominator Predicted total number of deaths Goal Reduce HSMR by 20% by December 2015Source ISD Scotland
Page 46

Chart 1
Table 1
2.1.1 Chart 1 demonstrates NHS Fife’s current position with regression line. The percentage reduction since the final quarter of 2007 is 22.2% and the HSMR ratio is 0.96 as illustrated in Table 1. This is a slight deterioration in performance compared to the previous quarter (June to September 2015), where the HSMR was 0.89 (22.9% reduction from Q4 of 2007).
Page 47

Chart 2
2.1.2 Chart 2 demonstrates NHS Fife’s HSMR position in comparison to the aggregated performance across NHS Scotland. The data was published on 24th May.
2.1.3 This is the last HSMR release reporting on progress towards the current phase of the Scottish Patient Safety Programme. The next update, reporting on admissions to 31st March 2016, will use a refined methodology.
2.2. Falls
Title Falls and Falls with HarmGoal To reduce falls with harm by 20% by December 2015
To reduce falls by 25% by December 2015Source Datix
Chart 3
Page 48

Chart 4
2.2.1 The aggregated NHS Fife data for
NHS Fife (All Falls), Chart 3, demonstrates common cause variation NHS Fife (Falls with Harm), Chart 4, demonstrates sustained improvement
between August 2014 and April 2015 when a shift of nine points resulted in the median being changed from May 2015 to 3.1.
2.2.2 The Strategic Falls Prevention Steering Group has been reconvened and will meet quarterly to review learning from the Older Peoples’ Collaborative and provide a mechanism for wider (pan Fife) testing and potential roll out of improvement initiatives.
The Datix Review Group is currently addressing improved fields for reporting of incidents along with guidance which will support staff in the process of grading incidents and the ongoing review process.
2.3 Cardiac Arrest
Title Cardiac Arrest Rate per 1000 DischargesGoal 50% reduction in cardiac arrest rate by December 2015Source Cardiac Arrest Database
Page 49

Chart 5
2.3.1 Chart 5 illustrates the rate of cardiac arrests in the Acute Services Division, and demonstrates common cause variation.
2.3.2 Following an eighteen month mortality review a Steering Group was set up to establish priorities to be taken forward to reduce the number of cardiac arrests occurring and to ensure that systems and processes are in place to improve patient outcomes for patients at risk of “deteriorating”.
2.3.3 The team is focusing on two key pieces of work to drive improvement:
A 12-week pilot on the use of a Hospital Anticipatory Care Pathway in five wards which incorporates “ceilings of care” tools is currently being evaluated.
Cardiac arrest SBARs for every patient are screened by a small team and escalated to a higher level Emergency Bleep Meeting for a Team Review to ensure any learning from the incident is shared with the Team caring for the patient.
2.3.4 The Scottish Structured Response Template has been rolled out across the Acute Division. The SSR comprises of a bundle of interventions that should be undertaken when a patient triggers the Fife Early Warning Score. The team is developing a measurement plan to capture compliance with the process within VHK; the plan will incorporate a feedback mechanism to ensure that learning is shared across VHK.
2.4 Pressure Ulcers
Title Pressure ulcers reported grade 2-4 (Hospital Acquired)Goal To reduce pressure ulcer rate by 50% by December 2017 Source Datix
Chart 6
Page 50

2.4.1 NHS Fife (Pressure Ulcers Grade 2 to 4 Developed in Healthcare), Chart 6, demonstrates an increased shift from August 2015.
The National Acute Adult Delivery Group acknowledged that a number of boards had demonstrated an upward shift and that they are working with NHS Boards to understand this data and if it reflects a true increase in pressure ulcers or changes in reporting. The SPSP team will explore with NHS Boards how historical work on pressure ulcers has been translated into improvement methods. The AADG agreed that the current upward trend in pressure ulcer rate provides a better understanding of current state that will support future improvement work.
2.4.2 The Tissue Viability Group has been set up to take forward and prioritise improvement initiatives across NHS Fife
2.4.3 A short life working group has met to scope the elements required to standardise and simplify process measurement across the partnership.
2.4.4 A Community of Practice for Tissue Viability is being established to raise awareness of Tissue Viability information, research and resources to support the work around tissue viability across NHS Fife and to support the work around avoidable and unavoidable pressure ulcers.
2.4.5. A locally developed NHS Fife Driver Diagram has been developed to agree the key components that need to be widely implemented to drive improvement forward for these measures.
Page 51
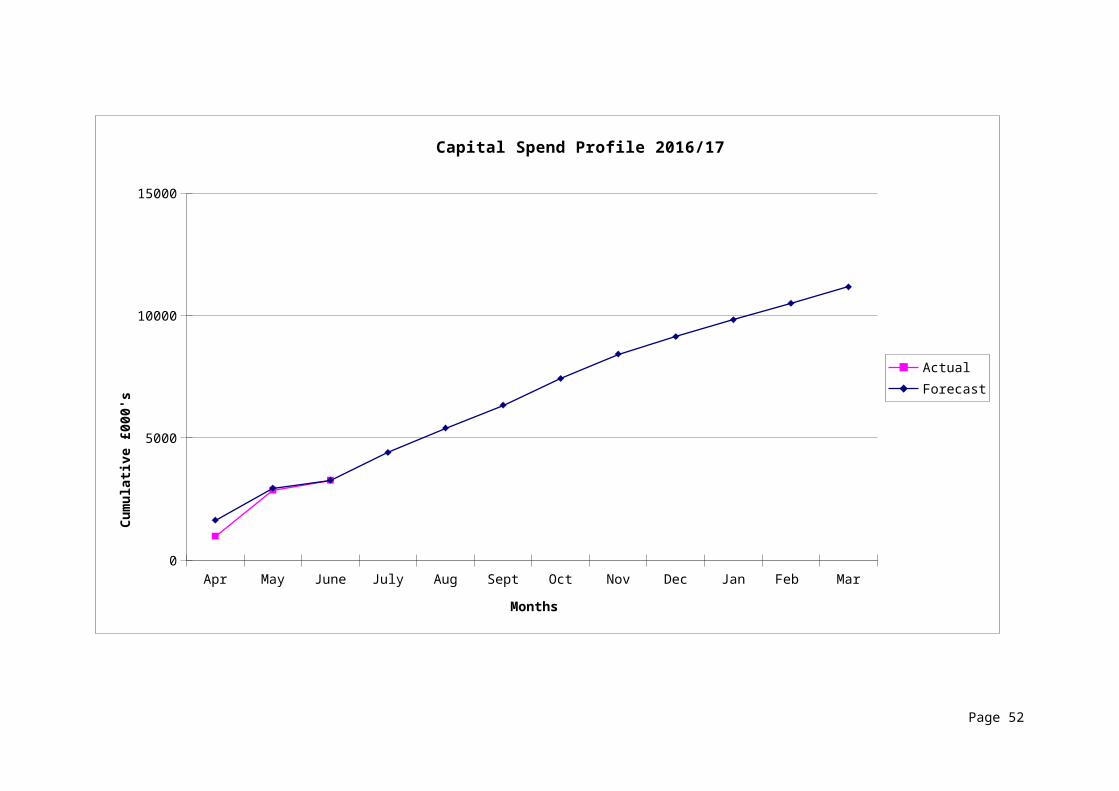
2.5.1 Catheter Urinary Tract Infections (CAUTI)
The Insertion and Maintenance Bundles appear to be well embedded with the Acute Hospitals measuring compliance. The incidence of infection appears to be low within NHS Fife and a group is being re-convened to address the appropriate improvement initiatives that should be taken forward in NHS Fife.
2.6 SepsisChart 7
Jan Feb Mar Apr May Jun Jul Aug Sep Oct Nov Dec00:00
00:07
00:14
00:21
00:28
00:36
00:43
00:50
00:57
01:04A & E - Average time/month first antibiotic administered
2.6.1 NHS Fife A&E Average Time to First Antibiotic – Part of the Sepsis Bundle, Chart 7 demonstrates the amount of time averaged out each month that it takes for patients to receive their first dose of antibiotic when the sepsis screen tool is triggered. The target for this measure is 1 hour. The chart demonstrates performance highlighted for each year. The average for June was 28 minutes.
Chart 8
Jan-13
Mar-13
May-13
Jul-1
3
Sep-13
Nov-13
Jan-14
Mar-14
May-14
Jul-1
4
Sep-14
Nov-14
Jan-15
Mar-15
May-15
Jul-1
5
Sep-15
Nov-15
Jan-16
Mar-16
May-16
0
10
20
30
40
50
60
70
20
1312
2216
30
18
32
152121
43
2327
2422
44
2732
23
4238
6964
51
39
17
312725
40
27
4441
49
65
454442
24
3842
Patients who triggered the Sepsis Six Tool in Resus A & EDec 2012 - June 2016
Patie
nts
Page 52

2.5.2 Chart 8 demonstrates the number of patients that trigger the “Sepsis 6” criteria in A&E. The chart demonstrates a clear increase in the number of patients identified since the sepsis initiative began within the Department and consequently are receiving timely medical intervention.
2.5.3 Key Events Visits
SPSP Falls Networking Event 30th August
SPSP HAI Networking Event 27th October
SPSP National Conference 29th November
2 day SPSP Faculty Visit 8th and 9th December
RECOMMENDATIONS
The Finance, Performance and Resources Committee are asked to:
Note the overview of progress for each work stream.
Advise on aspects of the report that they found valuable and if they would value continuing reports in this format
Page 53

SECTION EFREEDOM OF INFORMATION REQUESTS
1. INTRODUCTION
The purpose of this report is to update the Finance, Performance and Resources Committee on the Freedom of Information requests received for the month 1st – 30th
June 2016.
2. BACKGROUND
The Freedom of Information (Scotland) Act is an Act of Scottish Parliament which came into force in January 2005, and gives everyone the right to ask for any information held by a Scottish Public Authority. NHS Fife has received a steadily increasing number of requests every year.
All Public Bodies are required, by law, to respond to all reasonable requests, within 20 working days. There are however, certain conditions and exemptions which are set out in the Act, for circumstances where a response would be inappropriate.
3. CURRENT POSITION
The number of requests received in June was 52, compared to 43 received in the same period last year. The number of requests responded to so far is 22, with 2 requests having missed the 20 day deadline. Of the other 30 requests, 4 have not been responded to and have exceeded the 20 day deadline, while the remaining 26 are in line to respond to within the timescales.
The distribution across Executive Directors responsible for collating the individual responses is shown below.
0
4
8
12
Page 54

SECTION FCOMPLAINTS
We will achieve and sustain response times of no less than 95% (acknowledged within 3 working days) and 75% (responded to fully within 20 working days).
Key Concerns and Risks
The biggest risks to achieving and sustaining the planned improvements are:
Complexity of complaints which cross different organisational units Ownership of complaints Patient Relations Capacity
Recovery PlanLeads: Louise Ewing / Helen Paterson
Month Jan Feb Mar Apr May Jun Jul Aug Sep Oct Nov Dec Jan Feb MarActual 76.0% 74.0% 55.0% 44.8% 72.4%
Planned 55.0% 60.0% 70.0% 75.0% 75.0% 75.0% 75.0% 75.0% 75.0% 75.0% 75.0% 75.0% 75.0% 75.0% 75.0%
Month Jan Feb Mar Apr May Jun Jul Aug Sep Oct Nov Dec Jan Feb MarActual 95.0% 100.0% 100.0% 96.6% 100.0%
Planned 95.0% 95.0% 95.0% 95.0% 95.0% 95.0% 95.0% 95.0% 95.0% 95.0% 95.0% 95.0% 95.0% 95.0% 100.0%
Action
1.1
1.2
1.3
100% of complaints to be acknoweldged within 3 working days
Identify single point of contact across Health and Social Care Partnership Divisions
Review sign off process across Health and Social Care Partnership Divisions
2017
% of Complaints Completed Within 20 Working DaysTarget = 75%
2016
% of Complaints Receiving Response Within 3 Working DaysTarget = 95%
Situational Analysis
There are currently 32 complaints open and outstanding (39 in previous month), 6 of which are beyond 40 days; one case is in the Significant Adverse Event Review (SAER) process and the other four cases are complex complaints which require additional information following initial investigation. There are a further 3 complaints which are beyond 20 days, compared to 13 last month.
Performance improved in May but did not meet 75%. The following is a breakdown across the Board:
Acute Division 12 out of 18 completed on time, 67% compliance
Fife wide 3 out of 4 completed on time, 75% compliance
West 2 out of 2 completed on time, 100% compliance
No complaints for East partnership
Corporate 4 out of 5 completed on time, 80% compliance
There is significant improvement in compliance from Fife wide partnership following the implementation of a single point of contact and agreement regarding sign off process.
Page 55

Complaints, Concerns, Compliments and Comments
AprilMay June
July
August
Septem
ber
October
November
December
January
February
March
AprilMay
0
20
40
60
80
100
120
140
160
ComplimentsCommentsComplaintsConcerns
Context of Complaints in Relation to Other Forms of Feedback
Themes from concerns remain consistent and examples are similar to previous months, as below:
Problems with appointments (delay in notification of appointment re scheduling decision following DNA continuity issues with consultation). Liaison between departments takes place to bring about resolution.
Family members lack understanding and require explanation of care. With the patient’s consent it is often possible to resolve such issues by arranging an early meeting with key clinical staff.
Third party raises a complaint without the consent of the patient. In this situation there needs to be clear discussion about the requirements. The Patient Relations Team adopts a helpful approach and aims to overcome issues rather than put obstacles in the way of those seeking to raise a complaint.
Patient disagrees with treatment and seeks a second opinion. Again in a situation like this it is normal to encourage dialogue to ensure an adequate explanation and understanding of situation. Where required a second opinion can be sought.
Car parking is a common issue identified as a concern; however more frequently being registered as a formal complaint. Work has been identified in an effort to address the concern raised.
Smoking on hospital grounds is a common issue identified and the Board again has developed a standard response to the issue.
Page 56

Patient OpinionPatient Opinion provides a route for people to share their experience of NHS care anonymously. The graph below shows the distribution of stories received. Work is ongoing to promote awareness of Patient Opinion and to introduce new responders.
Examples from Patient Opinion:
The two extracts from Patient Opinion were responded to by the Senior Charge Nurse and Clinical Nurse Manager respectively. This demonstrates progress in increasing the number of responders on Patient Opinion and provides the opportunity for a more direct response from the Service.
Story about – Queen Margaret Hospital
The department at Queen Margaret’s hospital is friendly, efficient, quiet atmosphere and patients never made to feel like they hold up staff in any way. Everything is carefully explained regarding treatment and consideration is always shown. Appointments all made without delay as are all follow ups. How to contact if any deterioration occurs is explained with care. Written communications are all excelled, bold font and easy to read. If all NHS departments could operate to this standard it would make a great difference to patients. I cannot recommend this example too strongly.
Response
Thank you for taking the time to tell us about the Queen Margaret Hospital. It was great to read your comments about the environment and pleasing to hear you describe staff as friendly and efficient. Your refernce to the appointments system and the way in which information is provided is what we hope to ahieve across all departments. It would be helpful if you could identify the specific area you are referring to, so that I can share your positive feedback.
Thanks again for taking the time to tell us about your experience, this is very much appreciated.
Page 57
Story about – General Surgery
I was referred to Day Surgery Unit to have an operation on my toes. From the Assessment process right through to the day of my operation everyone was really nice and helpful answering any questions I had regarding the procedure.
From the moment I was admitted into the ward until I was discharged later that day the staff couldn't have been more attentive and informative about what was going to happen.
The only thing that felt drawn out was having to wait for the Physiotherapists to come from another hospital before I could be discharged.
This is the ideal forum to let staff know how your treatment went.
Response
Thank you for taking the time to tell us about your recent experience of Day Surgery. I am pleased to hear that the Patient Opinion forum suits you, we too enjoy the feedback it provides. I will gladly pass your comments on to the staff in Day Surgery and will also pass on your comments regarding the delay with physiotherapy input to establish whether this was a one off situation or is an area we could improve.
Thanks again for taking the time to post
Scottish Public Service Ombudsman (SPSO) Decisions and reports concluded:
The SPSO considered a complaint concerning a medication incident where a patient was given the wrong drug. In response to the incident the Board initiated a SAER which resulted in clear actions being identified. The SPSO’s Adviser noted that the Board acted promptly, honestly and correctly following the incident and felt that further investigation by the SPO would achieve no more for the family.
The SPSO did not uphold a complaint that hospital staff inappropriately decided not to resuscitate a patient. The SPSO’s Adviser reached a conclusion based upon the detailed documentation of staff which demonstrated compliance with national guidance on resuscitation and Do Not Attempt Cardio Pulmonary Resuscitation (DNACPR). In this case the next of kin believed they had the right to decide; however the Adviser highlighted, as the Board had done previously, that the Guidance is clear that a patient with capacity can consent or refuse CPR; however if they lack capacity the decision rests with the legally appointed proxy or with the lead clinician. The Adviser commented that it might have been helpful if the Board had included more detail of the DNACPR framework and Guidance during the complaints process. The decision and comments have been shared with staff.
The SPSO considered a complaint about aspects of clinical and nursing care. The SPSO noted that the Board had provided a comprehensive response to the complaint and detailed actions to address systematic failings; the implementation of a system to automatically flag unexpected findings to a referring clinician and the review of the administration process for providing updates on a patient’s condition to relatives. The SPSO did not consider that further investigation by their office would achieve more for the family.
The SPSO did not investigate a complaint against a Practice dating back to 2011. They found no special circumstances to prevent the complaint being raised sooner and outlined their Guidance and timescales for making a complaint. The decision reached is helpful in guiding local practice where complaints are raised out with the timescales.
The SPSO upheld a complaint that staff failed to perform hip surgery in an appropriate manner. The SPSO’s Adviser reviewed the case and concluded that it was appropriate to carry out hip surgery; however the Adviser was critical of the fact that there were no images available to show the position of the implant at the end of the operation. On that basis it was impossible for the Adviser to comment on the adequacy of the operation. The SPSO
Page 58

concluded this amounted to a failure in record keeping. The case has been discussed with the relevant teams who accept the criticism of the SPSO. An assurance statement has been provided in terms of the process of saving images; however in this case it was an unusual situation that no images were taken.
The SPSO did not uphold a complaint about an unreasonable delay by clinicians in diagnosing ovarian cancer. During the Board’s complaints process, a meeting was held to correct a misunderstanding in relation to tests and treatment and to offer an explanation. The SPSO’s Adviser concurred with the explanation offered by the Board and concluded that treatment had been appropriate. The Adviser did however note that clinical discussions had taken place, which the patient was unaware of until she made a complaint. The Adviser recommended that the Board consider how communication could be improved. The Clinical Lead subsequently shared the complaint with clinical teams to remind them of the need to be open and of the importance of sharing such information with patients.
The SPSO considered a complaint about a GP Practice where there was a failure to deal with a complaint. When the issue was raised by the SPSO, the Practice took action to redress the situation by writing to the patient directly and offering a full explanation and apology. The GP concerned accepted the situation was not handled as it should have been and agreed to discuss it as part of the appraisal process. The SPSO concluded that it was unlikely that further investigation by them would achieve more.
Page 59