summary statistics of the mass marking recovery … statistics of the mass marking recovery program...
TRANSCRIPT
Summary Statistics of the Mass Marking Recovery
Program on Lakes Michigan and Huron
Report #2017-05
Green Bay Fish and Wildlife Conservation Office
2661 Scott Tower Drive
New Franken, Wisconsin 54229
Phone: 920-866-1717; FAX 920-866-1761

2
Citation: Kornis, M. S., J. L. Webster, K. W. Pankow, A. A. Lane, S. R. Cressman, and C.R. Bronte. 2017. Summary Statistics of the Mass Marking Recovery Program on Lakes Michigan and Huron. Report #2017-05, USFWS-Green Bay Fish and Wildlife Conservation Office, New Franken, WI.
March 2017
Results are from fish tagged and recovered through the cooperative Great Lakes Mass Marking
Program
Funding provided by the Great Lakes Restoration Initiative
3
Summary Statistics of the Mass Marking Recovery Program on Lakes
Michigan and Huron
Matthew S. Kornis, James L. Webster, Kevin W. Pankow, Allen A. Lane,
Shannon R. Cressman, and Charles R. Bronte
Table of Contents
Map of statistical districts and offshore lake trout stocking locations…………………………….4
Number of fish examined each year………………………………………………………………5
Percent of wild Chinook salmon and lake trout examined in 2014 – 2016.....................................6
Estimated number of Chinook salmon smolts in L. Michigan by year class……………………...7
Relative survival index of Chinook salmon in statistical districts of lakes Michigan and Huron...8
Origin of angler-caught Chinook salmon in waters of Lake Michigan, overall and by state...…. .9
Origin of angler-caught lake trout in waters of Lake Michigan, overall and by state…………. .10
Origin of angler-caught lake trout in waters of Lake Michigan from offshore and nearshore
stocking locations…………………………………...……………………………………………11
Average and maximum length of each species from each statistical district (2012-2016)...……12
4
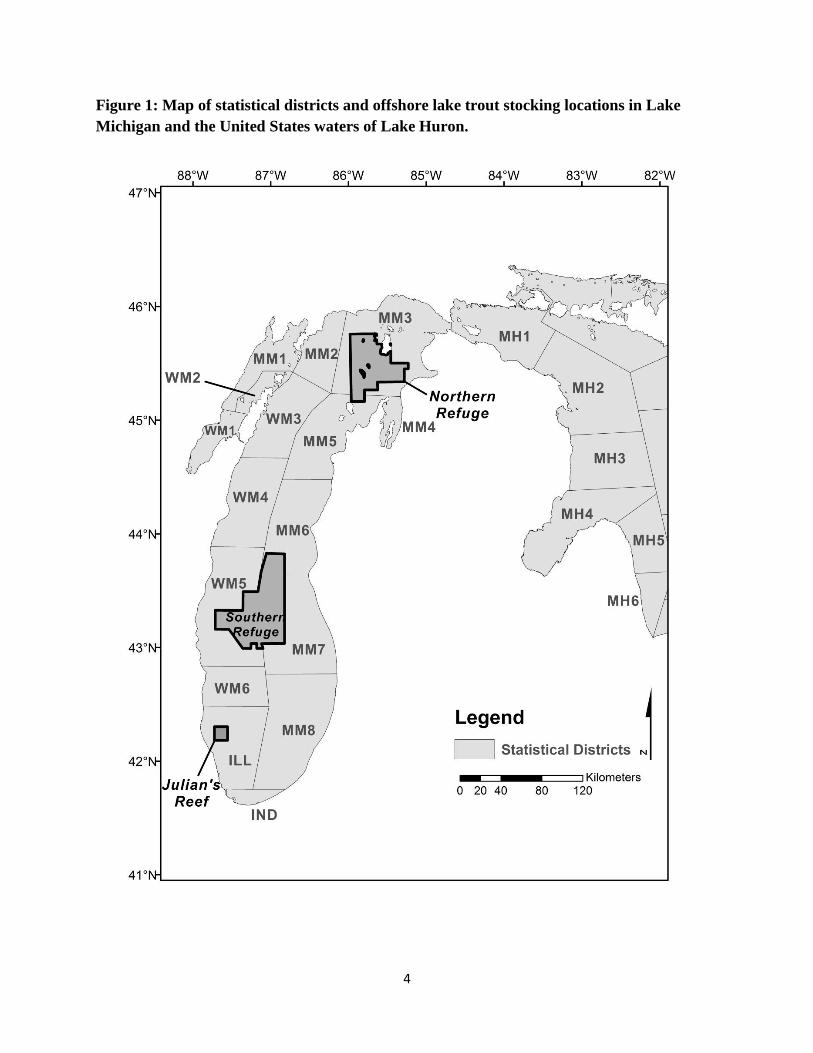
Figure 1: Map of statistical districts and offshore lake trout stocking locations in Lake
Michigan and the United States waters of Lake Huron.
5
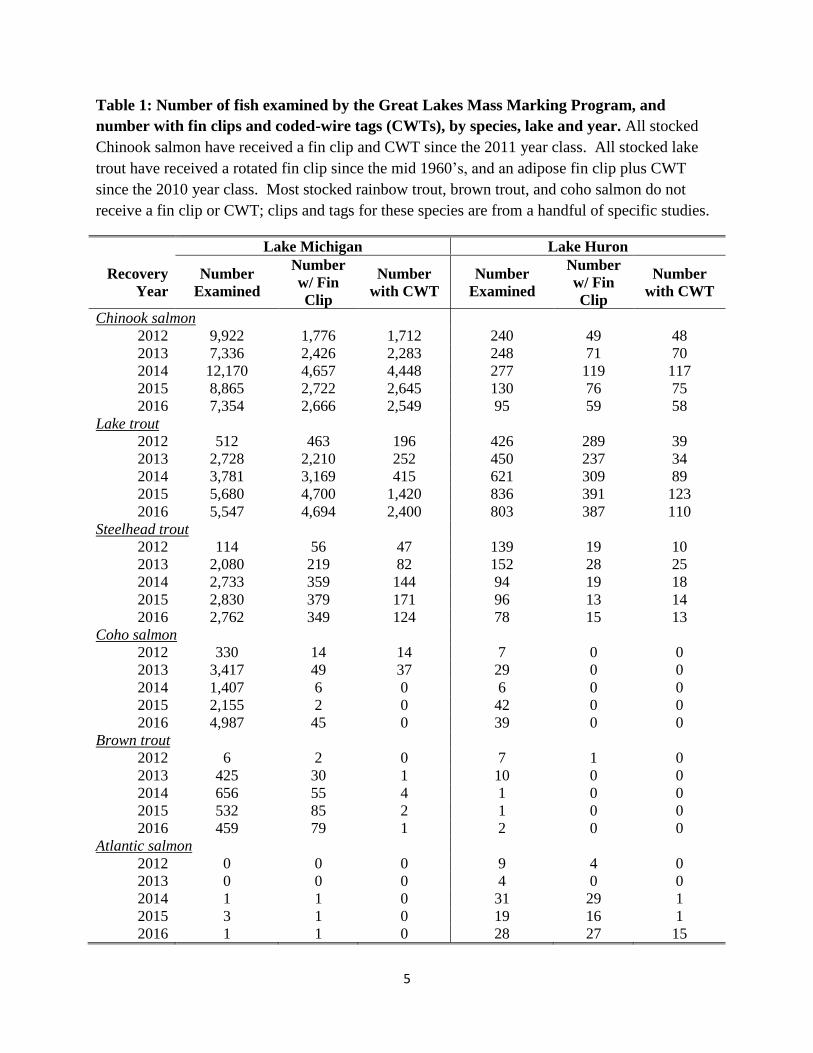
Table 1: Number of fish examined by the Great Lakes Mass Marking Program, and
number with fin clips and coded-wire tags (CWTs), by species, lake and year. All stocked
Chinook salmon have received a fin clip and CWT since the 2011 year class. All stocked lake
trout have received a rotated fin clip since the mid 1960’s, and an adipose fin clip plus CWT
since the 2010 year class. Most stocked rainbow trout, brown trout, and coho salmon do not
receive a fin clip or CWT; clips and tags for these species are from a handful of specific studies.
Lake Michigan Lake Huron
Recovery
Year
Number
Examined
Number
w/ Fin
Clip
Number
with CWT
Number
Examined
Number
w/ Fin
Clip
Number
with CWT
Chinook salmon
2012 9,922 1,776 1,712 240 49 48
2013 7,336 2,426 2,283 248 71 70
2014 12,170 4,657 4,448 277 119 117
2015 8,865 2,722 2,645 130 76 75
2016 7,354 2,666 2,549 95 59 58
Lake trout
2012 512 463 196 426 289 39
2013 2,728 2,210 252 450 237 34
2014 3,781 3,169 415 621 309 89
2015 5,680 4,700 1,420 836 391 123
2016 5,547 4,694 2,400 803 387 110
Steelhead trout
2012 114 56 47 139 19 10
2013 2,080 219 82 152 28 25
2014 2,733 359 144 94 19 18
2015 2,830 379 171 96 13 14
2016 2,762 349 124 78 15 13
Coho salmon
2012 330 14 14 7 0 0
2013 3,417 49 37 29 0 0
2014 1,407 6 0 6 0 0
2015 2,155 2 0 42 0 0
2016 4,987 45 0 39 0 0
Brown trout
2012 6 2 0 7 1 0
2013 425 30 1 10 0 0
2014 656 55 4 1 0 0
2015 532 85 2 1 0 0
2016 459 79 1 2 0 0
Atlantic salmon
2012 0 0 0 9 4 0
2013 0 0 0 4 0 0
2014 1 1 0 31 29 1
2015 3 1 0 19 16 1
2016 1 1 0 28 27 15

6
Table 2: Percent of Chinook salmon and lake trout examined by Great Lakes Mass
Marking Program technicians during 2014 – 2016 that were wild (without a fin clip or
CWT) by statistical district. Sample sizes are in parentheses. Only fish from samples in which
all Chinook salmon and lake trout were examined are included; as a result, sample sizes for
lakewide totals are less than reported in Table 1. Fish from all ages are included. Gray font
indicates sample size < 20.
Statistical
district Chinook salmon Lake trout
2014 2015 2016 2014 2015 2016
Lake Michigan
ILL 56.4 (928) 61.2 (273) 67.1 (566) 39.0 (41) 43.5 (246) 27.5 (400)
IND 65.6 (694) 65.5 (220) 69.1 (249) 18.8 (860) 18.0 (1665) 18.8 (1939)
MM1/WM1 56.4 (117) 62.2 (246) 48.7 (232) n/a (0) n/a (0) n/a (0)
MM2 72.4 (134) 64.1 (64) 61.9 (84) 0.0 (11) 1.4 (71) 0.0 (29)
MM3 60.6 (33) 50 (2) 18.2 (11) 3.3 (90) 3.0 (101) 0.0 (63)
MM4 66.7 (105) 66.7 (3) 50.0 (18) 2.0 (51) 0.0 (2) 8.7 (23)
MM5 80.8 (1037) 80.6 (325) 84.1 (132) 12.8 (188) 7.6 (132) 11.4 (114)
MM6 74.1 (1566) 79.7 (930) 82.3 (271) 14.3 (491) 8.0 (288) 7.5 (120)
MM7 62 (1355) 74.3 (672) 69.5 (308) 8.2 (536) 7.4 (1026) 8.9 (508)
MM8 59.8 (962) 65.9 (355) 75.4 (57) 15.0 (314) 23.8 (361) 15.5 (163)
WM3 42.8 (514) 69.2 (916) 60.1 (430) 0.0 (17) 7.7 (26) 12.5 (8)
WM4 41.6 (1254) 67 (2659) 58.9 (1415) 9.2 (229) 16.8 (339) 14.6 (89)
WM5 51.9 (1965) 65.7 (1597) 61.8 (1920) 18.8 (847) 20.4 (1107) 19.7 (269)
WM6 54.8 (467) 51.5 (66) 65.8 (853) 36.5 (255) 24.9 (430) 18.9 (265)
L. Michigan 59.8 (11131) 68.9 (8328) 63.5 (6546) 16.3 (3930) 17.2 (5794) 17.1 (3990)
Lake Huron
MH1 48.7 (189) 25.7 (70) 22.2 (54) 67.0 (112) 77.8 (162) 61.4 (57)
MH2 100 (13) 100 (2) 83.3 (6) 44.0 (191) 33.5 (260) 52.2 (362)
MH3 60 (5) 100 (3) 66.7 (3) 47.3 (224) 52.2 (247) 70.1 (57)
MH5 100 (9) 100 (8) (0) 52.3 (65) 58.7 (121) 70.1 (134)
MH6 100 (6) 100 (13) 85.7 (14) 44.8 (29) 69.6 (46) 39.5 (81)
Lake Huron 55.4 (222) 45.8 (96) 40.3 (77) 50.2 (621) 53.2 (836) 54.7 (691)

7
Table 3: Number of stocked Chinook salmon smolts, and estimated number of wild Chinook
salmon smolts, recruiting to the Lake Michigan population by year class. Stocked values include a
portion of the Chinook salmon stocked into northern Lake Huron based on evidence that those fish move
into Lake Michigan during spring and summer to feed. The number of wild smolts is calculated from the
known number of stocked smolts and the percentage of wild Age-1 Chinook salmon from each year class.
Estimates from the 2013 – 2015 year classes accounted for sampling and angler effort and were the
average of statistical district-specific estimates of % wild at Age-1. Estimates from 2006 – 2012 year
classes did not account for effort and were calculated from lakewide totals.
Year Class
No. Stocked
(millions)
Percent moving from
L. Huron to L.
Michigan
Percent
wild at
Age 1
Number
wild
(millions)
Total number
smolts
(millions)
OTC
2006 3.33 57.5 4.51 7.84
2007 3.97 95 55.3 4.92 8.89
2008 3.50 95 53.5 4.03 7.53
2009 3.80 95 54.4 4.54 8.34
CWT
2010 4.08 95 63.0 6.94 11.02 2011 3.93 95 54.0 4.62 8.55 2012 3.87 95 63.8 6.82 10.68 2013 2.38 90 38.6 1.50 3.88 2014 2.45 96 59.8 3.65 6.10
2015 2.45 95 48.6 2.32 4.77
Figure 1: Number of stocked Chinook salmon smolts (orange), and estimated number of wild
Chinook salmon smolts (blue), recruiting to the Lake Michigan population by year class.
8
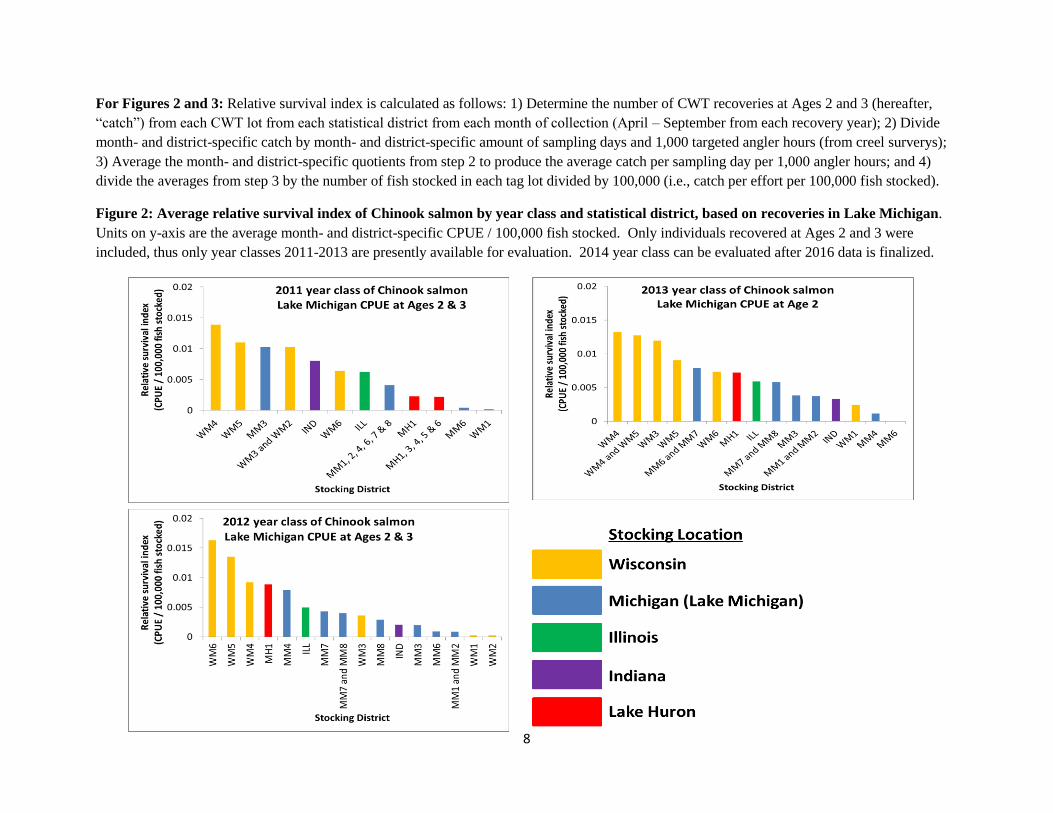
For Figures 2 and 3: Relative survival index is calculated as follows: 1) Determine the number of CWT recoveries at Ages 2 and 3 (hereafter,
“catch”) from each CWT lot from each statistical district from each month of collection (April – September from each recovery year); 2) Divide
month- and district-specific catch by month- and district-specific amount of sampling days and 1,000 targeted angler hours (from creel surverys);
3) Average the month- and district-specific quotients from step 2 to produce the average catch per sampling day per 1,000 angler hours; and 4)
divide the averages from step 3 by the number of fish stocked in each tag lot divided by 100,000 (i.e., catch per effort per 100,000 fish stocked).
Figure 2: Average relative survival index of Chinook salmon by year class and statistical district, based on recoveries in Lake Michigan.
Units on y-axis are the average month- and district-specific CPUE / 100,000 fish stocked. Only individuals recovered at Ages 2 and 3 were
included, thus only year classes 2011-2013 are presently available for evaluation. 2014 year class can be evaluated after 2016 data is finalized.

9
Figure 3: Average relative survival index of Chinook salmon by year class and statistical district, based on recoveries in Lake Huron.
Units on y-axis are the average month- and district-specific CPUE / 100,000 fish stocked. Only individuals recovered at Ages 2 and 3 were
included, thus only year classes 2011-2013 are presently available for evaluation. 2014 year class can be evaluated after 2016 data are finalized.
10
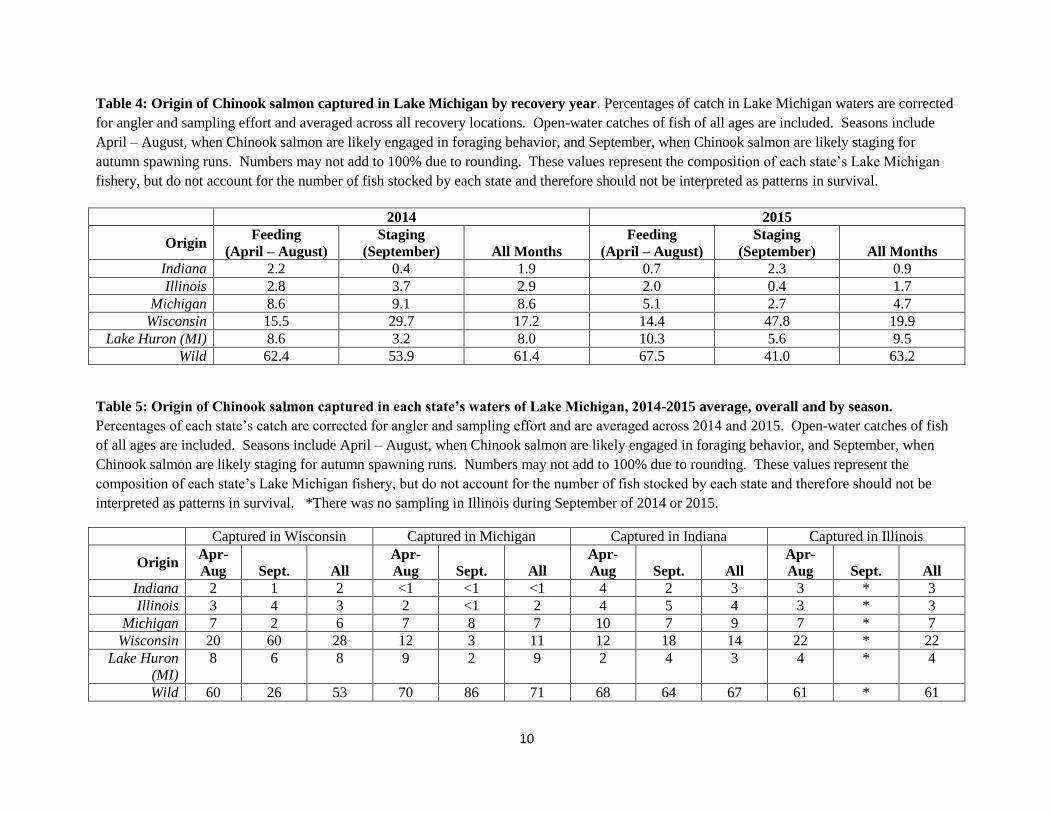
Table 4: Origin of Chinook salmon captured in Lake Michigan by recovery year. Percentages of catch in Lake Michigan waters are corrected
for angler and sampling effort and averaged across all recovery locations. Open-water catches of fish of all ages are included. Seasons include
April – August, when Chinook salmon are likely engaged in foraging behavior, and September, when Chinook salmon are likely staging for
autumn spawning runs. Numbers may not add to 100% due to rounding. These values represent the composition of each state’s Lake Michigan
fishery, but do not account for the number of fish stocked by each state and therefore should not be interpreted as patterns in survival.
Table 5: Origin of Chinook salmon captured in each state’s waters of Lake Michigan, 2014-2015 average, overall and by season.
Percentages of each state’s catch are corrected for angler and sampling effort and are averaged across 2014 and 2015. Open-water catches of fish
of all ages are included. Seasons include April – August, when Chinook salmon are likely engaged in foraging behavior, and September, when
Chinook salmon are likely staging for autumn spawning runs. Numbers may not add to 100% due to rounding. These values represent the
composition of each state’s Lake Michigan fishery, but do not account for the number of fish stocked by each state and therefore should not be
interpreted as patterns in survival. *There was no sampling in Illinois during September of 2014 or 2015.
Captured in Wisconsin Captured in Michigan Captured in Indiana Captured in Illinois
Origin Apr-
Aug Sept. All
Apr-
Aug Sept. All
Apr-
Aug Sept. All
Apr-
Aug Sept. All
Indiana 2 1 2 <1 <1 <1 4 2 3 3 * 3
Illinois 3 4 3 2 <1 2 4 5 4 3 * 3
Michigan 7 2 6 7 8 7 10 7 9 7 * 7
Wisconsin 20 60 28 12 3 11 12 18 14 22 * 22
Lake Huron
(MI)
8 6 8 9 2 9 2 4 3 4 * 4
Wild 60 26 53 70 86 71 68 64 67 61 * 61
2014 2015
Origin Feeding
(April – August)
Staging
(September) All Months
Feeding
(April – August)
Staging
(September) All Months
Indiana 2.2 0.4 1.9 0.7 2.3 0.9
Illinois 2.8 3.7 2.9 2.0 0.4 1.7
Michigan 8.6 9.1 8.6 5.1 2.7 4.7
Wisconsin 15.5 29.7 17.2 14.4 47.8 19.9
Lake Huron (MI) 8.6 3.2 8.0 10.3 5.6 9.5
Wild 62.4 53.9 61.4 67.5 41.0 63.2
11
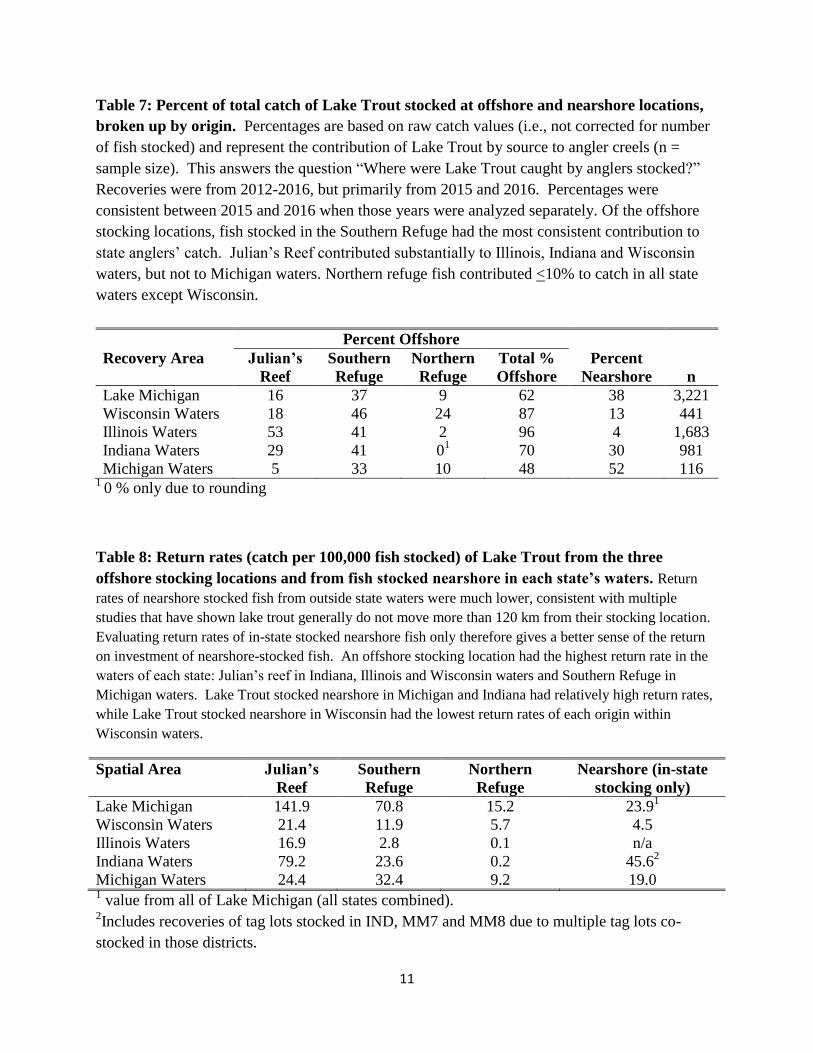
Table 7: Percent of total catch of Lake Trout stocked at offshore and nearshore locations,
broken up by origin. Percentages are based on raw catch values (i.e., not corrected for number
of fish stocked) and represent the contribution of Lake Trout by source to angler creels (n =
sample size). This answers the question “Where were Lake Trout caught by anglers stocked?”
Recoveries were from 2012-2016, but primarily from 2015 and 2016. Percentages were
consistent between 2015 and 2016 when those years were analyzed separately. Of the offshore
stocking locations, fish stocked in the Southern Refuge had the most consistent contribution to
state anglers’ catch. Julian’s Reef contributed substantially to Illinois, Indiana and Wisconsin
waters, but not to Michigan waters. Northern refuge fish contributed <10% to catch in all state
waters except Wisconsin.
Percent Offshore
Recovery Area Julian’s
Reef
Southern
Refuge
Northern
Refuge
Total %
Offshore
Percent
Nearshore n
Lake Michigan 16 37 9 62 38 3,221
Wisconsin Waters 18 46 24 87 13 441
Illinois Waters 53 41 2 96 4 1,683
Indiana Waters 29 41 01
70 30 981
Michigan Waters 5 33 10 48 52 116 1
0 % only due to rounding
Table 8: Return rates (catch per 100,000 fish stocked) of Lake Trout from the three
offshore stocking locations and from fish stocked nearshore in each state’s waters. Return
rates of nearshore stocked fish from outside state waters were much lower, consistent with multiple
studies that have shown lake trout generally do not move more than 120 km from their stocking location.
Evaluating return rates of in-state stocked nearshore fish only therefore gives a better sense of the return
on investment of nearshore-stocked fish. An offshore stocking location had the highest return rate in the
waters of each state: Julian’s reef in Indiana, Illinois and Wisconsin waters and Southern Refuge in
Michigan waters. Lake Trout stocked nearshore in Michigan and Indiana had relatively high return rates,
while Lake Trout stocked nearshore in Wisconsin had the lowest return rates of each origin within
Wisconsin waters.
Spatial Area Julian’s
Reef
Southern
Refuge
Northern
Refuge
Nearshore (in-state
stocking only)
Lake Michigan 141.9 70.8 15.2 23.91
Wisconsin Waters 21.4 11.9 5.7 4.5
Illinois Waters 16.9 2.8 0.1 n/a
Indiana Waters 79.2 23.6 0.2 45.62
Michigan Waters 24.4 32.4 9.2 19.0 1 value from all of Lake Michigan (all states combined).
2Includes recoveries of tag lots stocked in IND, MM7 and MM8 due to multiple tag lots co-
stocked in those districts.
12
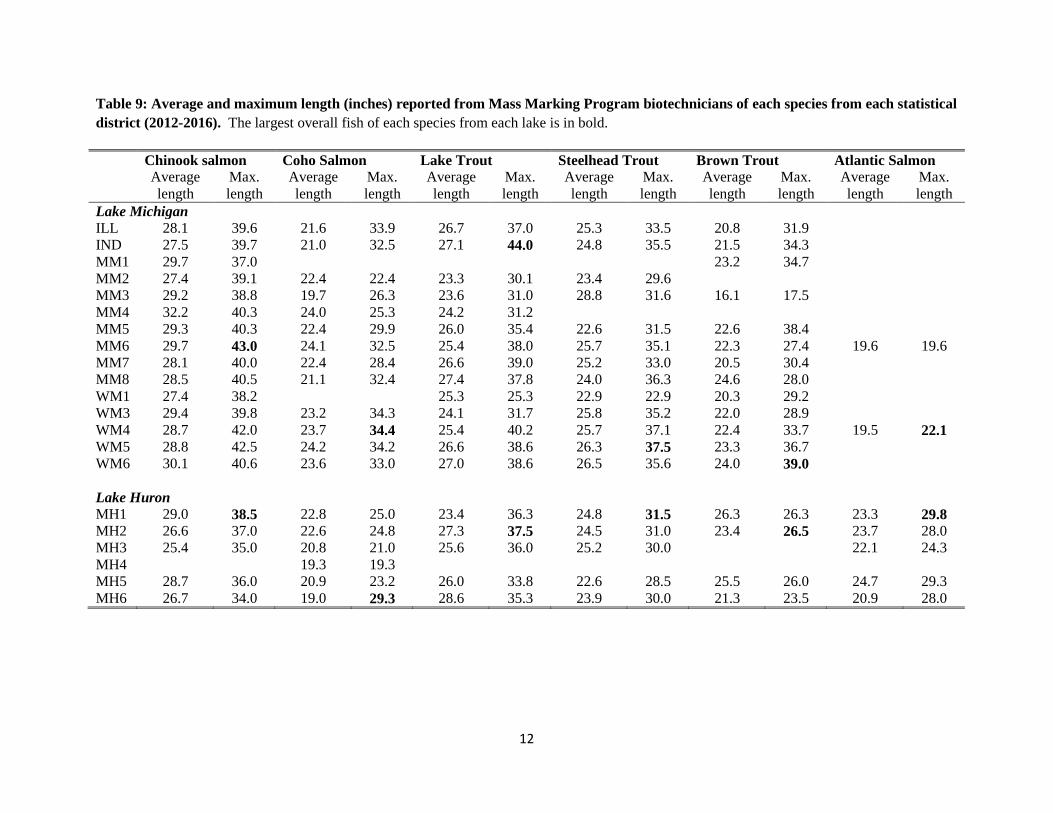
Table 9: Average and maximum length (inches) reported from Mass Marking Program biotechnicians of each species from each statistical
district (2012-2016). The largest overall fish of each species from each lake is in bold.
Chinook salmon Coho Salmon Lake Trout Steelhead Trout Brown Trout Atlantic Salmon
Average
length
Max.
length
Average
length
Max.
length
Average
length
Max.
length
Average
length
Max.
length
Average
length
Max.
length
Average
length
Max.
length
Lake Michigan
ILL 28.1 39.6 21.6 33.9 26.7 37.0 25.3 33.5 20.8 31.9
IND 27.5 39.7 21.0 32.5 27.1 44.0 24.8 35.5 21.5 34.3
MM1 29.7 37.0 23.2 34.7
MM2 27.4 39.1 22.4 22.4 23.3 30.1 23.4 29.6
MM3 29.2 38.8 19.7 26.3 23.6 31.0 28.8 31.6 16.1 17.5
MM4 32.2 40.3 24.0 25.3 24.2 31.2
MM5 29.3 40.3 22.4 29.9 26.0 35.4 22.6 31.5 22.6 38.4
MM6 29.7 43.0 24.1 32.5 25.4 38.0 25.7 35.1 22.3 27.4 19.6 19.6
MM7 28.1 40.0 22.4 28.4 26.6 39.0 25.2 33.0 20.5 30.4
MM8 28.5 40.5 21.1 32.4 27.4 37.8 24.0 36.3 24.6 28.0
WM1 27.4 38.2 25.3 25.3 22.9 22.9 20.3 29.2
WM3 29.4 39.8 23.2 34.3 24.1 31.7 25.8 35.2 22.0 28.9
WM4 28.7 42.0 23.7 34.4 25.4 40.2 25.7 37.1 22.4 33.7 19.5 22.1
WM5 28.8 42.5 24.2 34.2 26.6 38.6 26.3 37.5 23.3 36.7
WM6 30.1 40.6 23.6 33.0 27.0 38.6 26.5 35.6 24.0 39.0
Lake Huron
MH1 29.0 38.5 22.8 25.0 23.4 36.3 24.8 31.5 26.3 26.3 23.3 29.8
MH2 26.6 37.0 22.6 24.8 27.3 37.5 24.5 31.0 23.4 26.5 23.7 28.0
MH3 25.4 35.0 20.8 21.0 25.6 36.0 25.2 30.0 22.1 24.3
MH4 19.3 19.3
MH5 28.7 36.0 20.9 23.2 26.0 33.8 22.6 28.5 25.5 26.0 24.7 29.3
MH6 26.7 34.0 19.0 29.3 28.6 35.3 23.9 30.0 21.3 23.5 20.9 28.0
13
U.S. Department of the Interior U.S Fish and Wildlife Service http://www.fws.gov March 2017
“Working with partners to conserve, protect, and enhance fish, wildlife, and plants
and their habitats for the continuing benefit of the American people”