summary of workplace injury, illness and fatality ... coleman of the labour market ... summary of...
TRANSCRIPT
2012-2013
Summary of WorkplaceInjury, Illness and Fatality Statistics

Our vision: A country where workersafety, health and welfareand the safe managementof chemicals are central tosuccessful enterprise
Acknowledgements
The results presented in this report come from analysis prepared
by Helen Russell and Bertrand Maître of the Economic and
Social Research Institute as background for a research study on
trends in occupational injury and illness from boom to recession.
That study is part of a two year research programme on Health,
Safety and Wellbeing at Work involving the HSA and the ESRI
and we would like to thank the members of the research
steering group for their valuable input into the research. We are
very grateful to the CSO for the provision of the micro-data
from the QNHS for analysis and for the expertise provided by
Felix Coleman of the labour market statistics division.
Health and Safety Authority | Summary of Workplace Injury, Illness and Fatality Statistics 2012-2013 Page 1
Contents
1. Introduction, overview and methodology . . . . . . . . . . . . . . . . . . . . . . . . . . . . . . . . . . . . . . . . . . .4
1.1 Introduction . . . . . . . . . . . . . . . . . . . . . . . . . . . . . . . . . . . . . . . . . . . . . . . . . . . . . . . . . . . . . . .4
1.2 Overview for 2012 -2013 . . . . . . . . . . . . . . . . . . . . . . . . . . . . . . . . . . . . . . . . . . . . . . . . . . . . .4
Non-fatal injury . . . . . . . . . . . . . . . . . . . . . . . . . . . . . . . . . . . . . . . . . . . . . . . . . . . . . . . . . . . . .4
Work Related Illness . . . . . . . . . . . . . . . . . . . . . . . . . . . . . . . . . . . . . . . . . . . . . . . . . . . . . . . .5
Fatal injuries . . . . . . . . . . . . . . . . . . . . . . . . . . . . . . . . . . . . . . . . . . . . . . . . . . . . . . . . . . . . . . .6
Implications . . . . . . . . . . . . . . . . . . . . . . . . . . . . . . . . . . . . . . . . . . . . . . . . . . . . . . . . . . . . . . .6
1.3 Data Sources and Methodology . . . . . . . . . . . . . . . . . . . . . . . . . . . . . . . . . . . . . . . . . . . . . . .7
Health and Safety Authority (HSA) . . . . . . . . . . . . . . . . . . . . . . . . . . . . . . . . . . . . . . . . . . . . . .7
Quarterly National Household Survey (QNHS) Module on Work Related Accidents and Illness . . . . . . . . . . . . . . . . . . . . . . . . . . . . . . . . . . . . . . . . . . . . . . . . . . . . . . . . . . . . . . . .8
Eurostat Statistics . . . . . . . . . . . . . . . . . . . . . . . . . . . . . . . . . . . . . . . . . . . . . . . . . . . . . . . . .10
Occupational Injury Benefit Statistics . . . . . . . . . . . . . . . . . . . . . . . . . . . . . . . . . . . . . . . . . .10
1.4 Calculating Accident, Illness and Fatality Rates . . . . . . . . . . . . . . . . . . . . . . . . . . . . . . . . . . .11
1.5 Technical Notes . . . . . . . . . . . . . . . . . . . . . . . . . . . . . . . . . . . . . . . . . . . . . . . . . . . . . . . . . . . .11
2. Non-Fatal Injury and Illness Statistics . . . . . . . . . . . . . . . . . . . . . . . . . . . . . . . . . . . . . . . . . . . . .12
2.1 General Injury and Illness Statistics . . . . . . . . . . . . . . . . . . . . . . . . . . . . . . . . . . . . . . . . . . .12
Figure 2.1: Injuries Reported to the HSA 2004 -2013. . . . . . . . . . . . . . . . . . . . . . . . . . . . . . .12
Figure 2.2: Injuries reported by economic sector 2013 (HSA) . . . . . . . . . . . . . . . . . . . . . . . .12
Figure 2.3: Numbers employed in each economic sector 2008–2013 Four Quarter Average (Data based on CSO statistical release April 2014) . . . . . . . . . . . . . . .13
Figure 2.4: Number and rate of people suffering injury and illness 2008–2012 (CSO) . . . . . .14
Figure 2.5: Rate of injury and illness causing 4+ days’ lost per 1,000 Workers 2007–2012 (CSO) . . . . . . . . . . . . . . . . . . . . . . . . . . . . . . . . . . . . . . . . . . . . . . . . . . . . . . . . . .15
Figure 2.6: Rate of injuries (any days lost) per 1,000 workers by economic sector 2012 (CSO) . . . . . . . . . . . . . . . . . . . . . . . . . . . . . . . . . . . . . . . . . . . . . . . . .15
Figure 2.7: Rate of 4+ day injuries per 1,000 workers in selected sectors 2007-2012 (CSO) . . . . . . . . . . . . . . . . . . . . . . . . . . . . . . . . . . . . . . . . . . . . . . . . . . . .16
Figure 2.8: Rate of illness (any days lost) per 1,000 workers by economic sector 2012 (CSO) . . . . . . . . . . . . . . . . . . . . . . . . . . . . . . . . . . . . . . . . . . . . . . . . .16

Figure 2.9: Occupational injury benefit claims (DSP) . . . . . . . . . . . . . . . . . . . . . . . . . . . . . . .17
Figure 2.10: Rate of 4+ day injuries per 100,000 Workers in the EU 2011 (Eurostat) . . . . . . .17
2.2 Victim Statistics . . . . . . . . . . . . . . . . . . . . . . . . . . . . . . . . . . . . . . . . . . . . . . . . . . . . . . . . . . .18
Figure 2.11: Number and rate of injury/illness (0+ days) per 1,000 workers by economic sector and gender 2012 (CSO) . . . . . . . . . . . . . . . . . . . . . . . . . . . . . . . . . . . . .18
Figure 2.12: Rate of total injury (0+ days) per 1,000 workers by gender 2007-2012 (CSO) . .19
Figure 2.13: Rate of total illness (0+ days) per 1,000 workers by gender 2007-2012 (CSO) .19
Figure 2.14: Rates of total injury and total illness (0+ days) per 1,000 workers by age band 2012 (CSO) . . . . . . . . . . . . . . . . . . . . . . . . . . . . . . . . . . . . . . . . . . . . . . . . . . . . .20
Figure 2.15: Rates of total injury and total illness (0 + days) per 1,000 workers by occupation 2012 (CSO) . . . . . . . . . . . . . . . . . . . . . . . . . . . . . . . . . . . . . . . . . . . . . . . . . . .20
Figure 2.16: Reported non-fatal injuries by employment status 2013 (HSA) . . . . . . . . . . . . .21
Figure 2.17: Workers by nationality and economic sector 2012 (CSO statistical release April 2013) . . . . . . . . . . . . . . . . . . . . . . . . . . . . . . . . . . . . . . . . . . . .21
Figure 2.18: Distribution of reported non-fatal injuries by nationality 2013 (HSA) . . . . . . . . .22
2.3 Nature of Accidents and Type of Injuries Sustained . . . . . . . . . . . . . . . . . . . . . . . . . . . . . . .23
Figure 2.19: Non-fatal injuries by trigger 2013 (HSA) . . . . . . . . . . . . . . . . . . . . . . . . . . . . . . .23
Figure 2.20: Number and Percentage of non-fatal accidents by trigger, Selected Sectors 2013 (HSA) . . . . . . . . . . . . . . . . . . . . . . . . . . . . . . . . . . . . . . . . . . . . . . . . .23
Figure 2.21: Injury type by gender 2012 (CSO) . . . . . . . . . . . . . . . . . . . . . . . . . . . . . . . . . . .24
Figure 2.22: Illness type by gender 2012 (CSO) . . . . . . . . . . . . . . . . . . . . . . . . . . . . . . . . . . .24
Figure 2.23a: Most injured body parts, 2013 (HSA) . . . . . . . . . . . . . . . . . . . . . . . . . . . . . . . .25
Figure 2.23b: Most injured body parts, Workers 2013 (HSA) . . . . . . . . . . . . . . . . . . . . . . . . .25
Figure 2.24: Percentage of non-fatal injuries by absence from work 2013 (HSA) . . . . . . . . .26
2.4 Work Environment Statistics . . . . . . . . . . . . . . . . . . . . . . . . . . . . . . . . . . . . . . . . . . . . . . . . .26
Figure 2.25a Reported non-fatal injuries by work environment 2013 (HSA) . . . . . . . . . . . . . .26
Figure 2.25b Chart of reported non-fatal injuries by work environment 2013 (HSA) . . . . . . .27
Figure 2.26: Reported non-fatal injuries (%) by size of employing organisation 2013 (HSA) .27
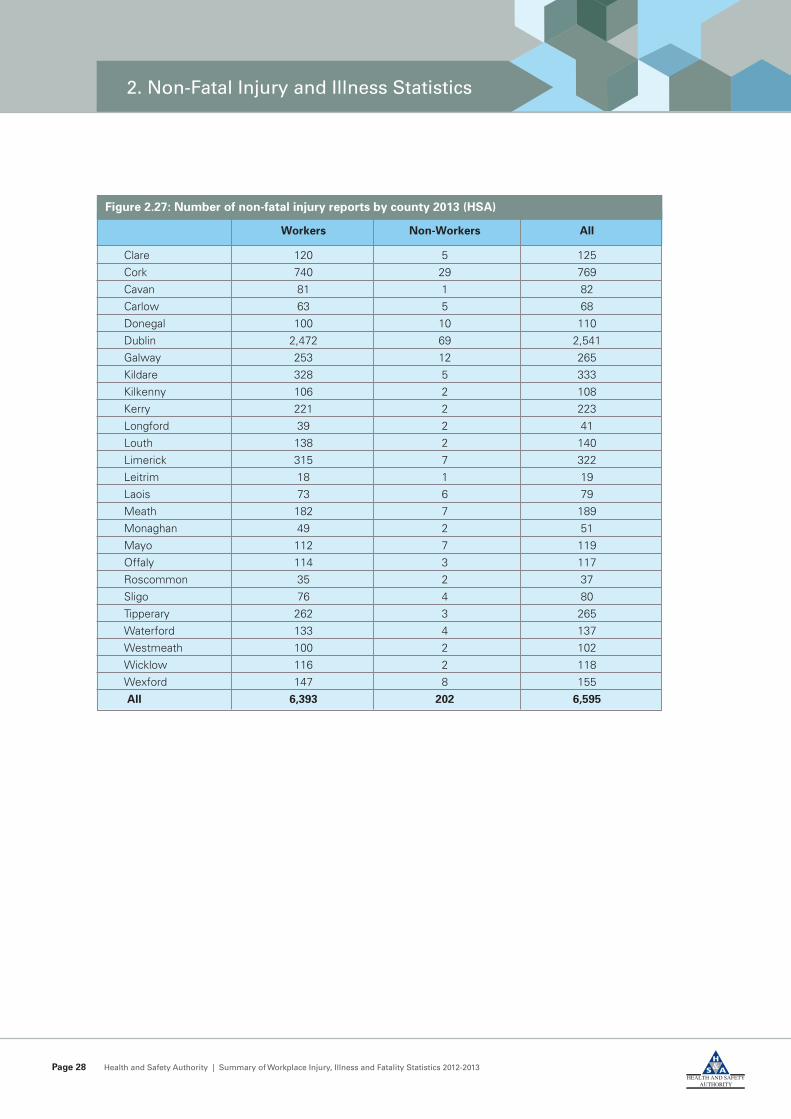
Figure 2.27: Number of non-fatal injury reports by county 2013 (HSA) . . . . . . . . . . . . . . . . .28
Page 2 Health and Safety Authority | Summary of Workplace Injury, Illness and Fatality Statistics 2012-2013
Contents
Figure 2.28: Rate of illness and injury by region 2012 (CSO) . . . . . . . . . . . . . . . . . . . . . . . . .29
3 Fatal Injury Statistics . . . . . . . . . . . . . . . . . . . . . . . . . . . . . . . . . . . . . . . . . . . . . . . . . . . . . . . . . .30
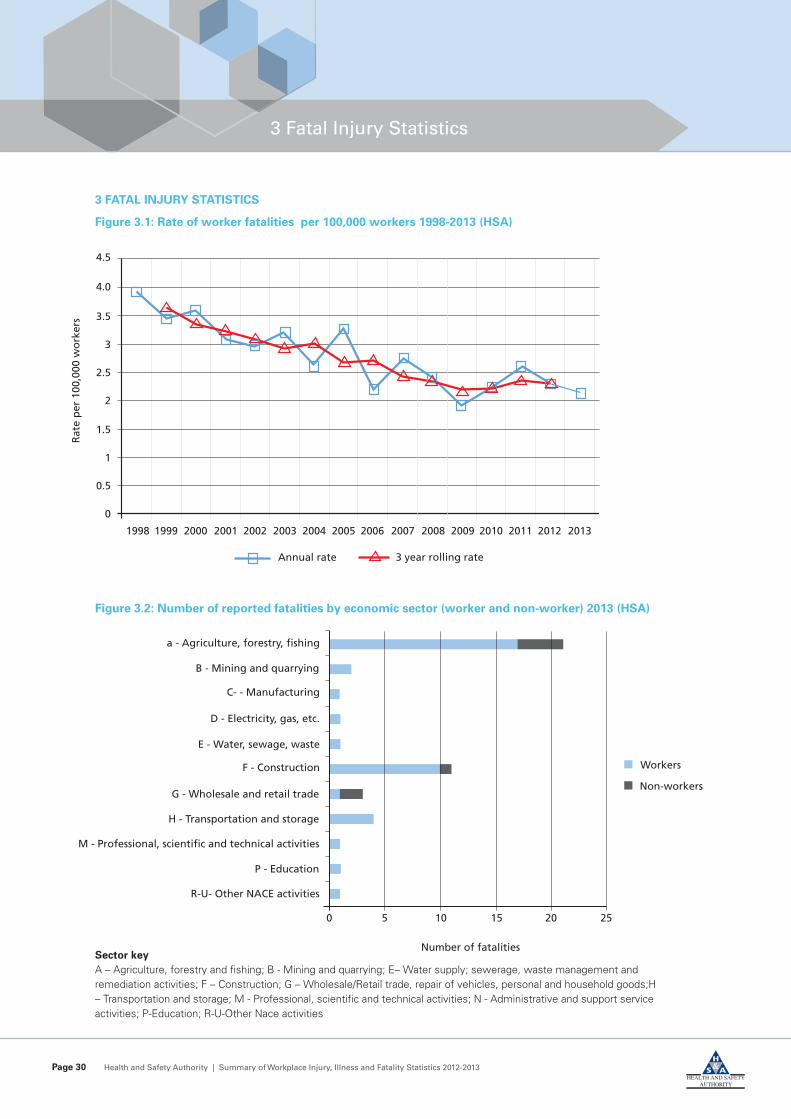
Figure 3.1: Rate of worker fatalities per 100,000 workers 1998-2013 (HSA) . . . . . . . . . . . .30
Figure 3.2: Number of reported fatalities by economic sector (worker and non-worker) 2013 (HSA) . . . . . . . . . . . . . . . . . . . . . . . . . . . . . . . . . . . . . . . . . . .30
Figure 3.3: Number of reported fatalities (worker and non-worker) by economic sector 2008- 2013 (HSA) . . . . . . . . . . . . . . . . . . . . . . . . . . . . . . . . . . . . . . . . . .31
Figure 3.4: Rate of reported worker fatalities by economic sector 2013 (HSA) . . . . . . . . . . .31
Figure 3.5: Comparison of fatality rates in selected sectors 2008–2013 (HSA) . . . . . . . . . . .32
Figure 3.6: Percentage of reported fatal injuries by employment status 2013 (HSA) . . . . . .32
Figure 3.7: Number of reported fatalities (worker and non-worker) by economic sector and age band 2013 (HSA) . . . . . . . . . . . . . . . . . . . . . . . . . . . . . . . . . . .33
Figure 3.8: Number of reported fatalities (worker and non-worker) by age band 2013 (HSA) . . . . . . . . . . . . . . . . . . . . . . . . . . . . . . . . . . . . . . . . . . . . . . . . . . . . .34
Figure 3.9: Number of reported worker fatalities by nationality and economic sector 2013 (HSA) . . . . . . . . . . . . . . . . . . . . . . . . . . . . . . . . . . . . . . . . . . . . . . . . .34
Figure 3.10: Percentage of reported worker fatalities by nationality 2013 (HSA) . . . . . . . . . .35
Figure 3.11: Reported worker fatality rates (per 100,000 workers) by nationality 2008–2013 (HSA) . . . . . . . . . . . . . . . . . . . . . . . . . . . . . . . . . . . . . . . . . . . . . . . . .35
Figure 3.12: Number of reported fatalities (worker and non-worker) by accident trigger 2013 (HSA) . . . . . . . . . . . . . . . . . . . . . . . . . . . . . . . . . . . . . . . . . . . . . . . . . .36
Figure 3.13: Number of reported fatalities (worker and non-worker) by region 2008-2013 (HSA) . . . . . . . . . . . . . . . . . . . . . . . . . . . . . . . . . . . . . . . . . . . . . . . . . . . . .36
Figure 3.14: Worker fatality rates per 100,000 workers in the EU 2011 (Eurostat) . . . . . . . .37
Appendix – Classification of Economic Activities . . . . . . . . . . . . . . . . . . . . . . . . . . . . . . . . . . . . . .38
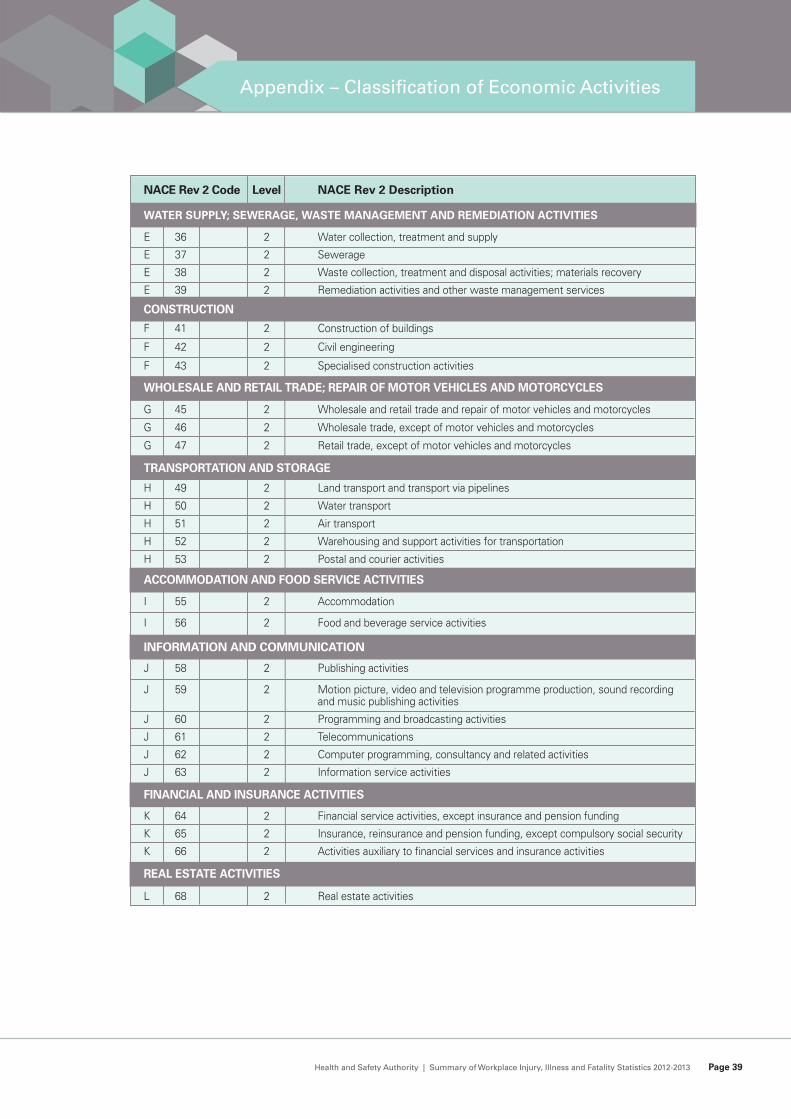
NACE Rev 2 – Level 1 & 2 . . . . . . . . . . . . . . . . . . . . . . . . . . . . . . . . . . . . . . . . . . . . . . . . . . . . . .38
References . . . . . . . . . . . . . . . . . . . . . . . . . . . . . . . . . . . . . . . . . . . . . . . . . . . . . . . . . . . . . . . . . . .41
Published by the Health and Safety Authority, The Metropolitan Building, James Joyce Street, Dublin 1.©All rights reserved. No part of this publication may be reproduced, stored in a retrieval system, or transmitted in anyform or by any means, electronic, mechanical, photocopying, recording or otherwise, without the prior permission ofthe Health and Safety Authority.
Health and Safety Authority | Summary of Workplace Injury, Illness and Fatality Statistics 2012-2013 Page 3
Contents
Page 4 Health and Safety Authority | Summary of Workplace Injury, Illness and Fatality Statistics 2012-2013
1. Introduction, overview and methodology
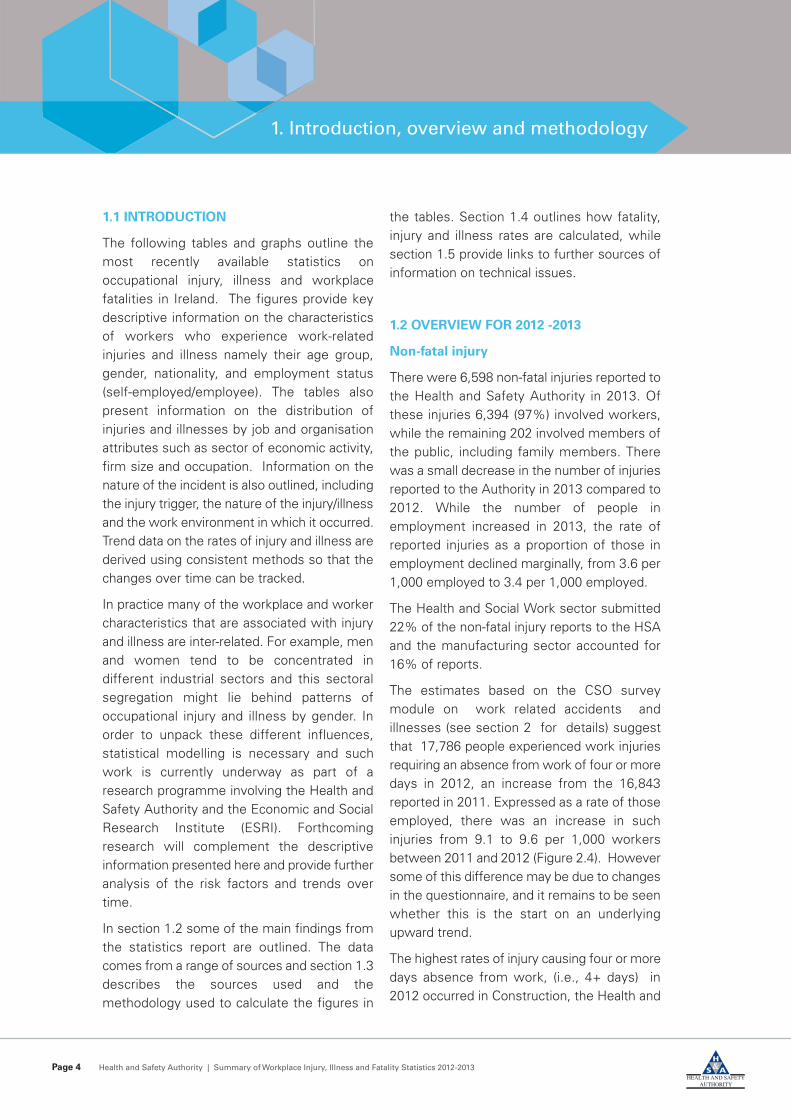
1.1 INTRODUCTION
The following tables and graphs outline themost recently available statistics onoccupational injury, illness and workplacefatalities in Ireland. The figures provide keydescriptive information on the characteristicsof workers who experience work-relatedinjuries and illness namely their age group,gender, nationality, and employment status(self-employed/employee). The tables alsopresent information on the distribution ofinjuries and illnesses by job and organisationattributes such as sector of economic activity,firm size and occupation. Information on thenature of the incident is also outlined, includingthe injury trigger, the nature of the injury/illnessand the work environment in which it occurred.Trend data on the rates of injury and illness arederived using consistent methods so that thechanges over time can be tracked.
In practice many of the workplace and workercharacteristics that are associated with injuryand illness are inter-related. For example, menand women tend to be concentrated indifferent industrial sectors and this sectoralsegregation might lie behind patterns ofoccupational injury and illness by gender. Inorder to unpack these different influences,statistical modelling is necessary and suchwork is currently underway as part of aresearch programme involving the Health andSafety Authority and the Economic and SocialResearch Institute (ESRI). Forthcomingresearch will complement the descriptiveinformation presented here and provide furtheranalysis of the risk factors and trends overtime.
In section 1.2 some of the main findings fromthe statistics report are outlined. The datacomes from a range of sources and section 1.3describes the sources used and themethodology used to calculate the figures in
the tables. Section 1.4 outlines how fatality,injury and illness rates are calculated, whilesection 1.5 provide links to further sources ofinformation on technical issues.
1.2 OVERVIEW FOR 2012 -2013
Non-fatal injury
There were 6,598 non-fatal injuries reported tothe Health and Safety Authority in 2013. Ofthese injuries 6,394 (97%) involved workers,while the remaining 202 involved members ofthe public, including family members. Therewas a small decrease in the number of injuriesreported to the Authority in 2013 compared to2012. While the number of people inemployment increased in 2013, the rate ofreported injuries as a proportion of those inemployment declined marginally, from 3.6 per1,000 employed to 3.4 per 1,000 employed.
The Health and Social Work sector submitted22% of the non-fatal injury reports to the HSAand the manufacturing sector accounted for16% of reports.
The estimates based on the CSO surveymodule on work related accidents andillnesses (see section 2 for details) suggestthat 17,786 people experienced work injuriesrequiring an absence from work of four or moredays in 2012, an increase from the 16,843reported in 2011. Expressed as a rate of thoseemployed, there was an increase in suchinjuries from 9.1 to 9.6 per 1,000 workersbetween 2011 and 2012 (Figure 2.4). Howeversome of this difference may be due to changesin the questionnaire, and it remains to be seenwhether this is the start on an underlyingupward trend.
The highest rates of injury causing four or moredays absence from work, (i.e., 4+ days) in2012 occurred in Construction, the Health and

Health and Safety Authority | Summary of Workplace Injury, Illness and Fatality Statistics 2012-2013 Page 5
1. Introduction, overview and methodology
Social Work sector, and the Agricultural sector,with rates of 16.7, 15.9, and 14.2 per 1,000workers respectively (Figure 2.7). Including lessserious accidents (0+ days absence)1 the injuryrates were highest in Agriculture and Health(both 29 per 1,000) and Accommodation andFood sector and Transport and Storage sector(27 per 1,000, see Figure 2.6).
Consistent with previous years, female workershad lower injury rates than male workers in2012 (Figure 2.12). The time series datasuggest that male injury rates have declinedmore steeply than female injury rates. For allinjuries (0+ days absence) the male injury ratefell from 38 per 1,000 in 2007 to 23 per 1,000in 2012. For women the rate fell from 19 per1,000 to 15 per 1,000 during the same timeperiod.
Non-Irish national workers comprised 14.6% ofthe Irish workforce in 2013 and 16% of non-fatal injuries notified to the Health and SafetyAuthority in 2012 involved non-Irish nationalworkers. Manual handling related injuriescontinue to account for about one third of allnon-fatal injuries reported to the Authority.
Slip, trip and fall incidents were the secondmost common accident trigger (18%).Incidents involving aggression, fright, shock orviolence accounted for 5% of the non-fatalinjury reports to the HSA, such events weremost common in the Health sector where theyaccounted for 15% of reported incidents.
Work Related Illness
The rate of illness causing four or more (4+)days absence from work has increased from10.6 cases per 1,000 workers in 2011 to 14.8 in2012 (Figure 2.4). This was the fourth year in arow in which an increase in the illness rate wasrecorded. A study underway as part of theHSA/ESRI research programme, will investigatethe factors underlying these trends.
The three sectors with the highest illness ratesin 2012 (0+ days lost) were Agriculture,Forestry and Fishing (47 per 1,000 workers),Information/Communication (41 per 1,000workers) and Education (37 per 1,000 workers).Two of these differ from the three sectors withthe highest illness rates in 2011, which were-Agriculture, Public Administration and Defenceand Administration and Support Services.
Women experienced a higher illness rate thanmen in 2012, 29 per 1,000 workers comparedto 25 per 1,000 workers. This continues apattern which emerged in 2011 (see Figure2.13). Illness rates were also somewhat higheramong older workers. The rate was 29 per1,000 workers for those aged 55 to 64compared to a rate of 25 per 1,000 workers forthose aged 25 to 34 years. Additional statisticalwork, which combines data for a number ofyears will allow further analysis of these genderand age patterns and test the statisticalsignificance (ESRI/HSA forthcoming).
1 Note that the 0+ figures include all work related injuries (illnesses) including those where there was no absencefrom work and longer spells of 4 or more days.
Page 6 Health and Safety Authority | Summary of Workplace Injury, Illness and Fatality Statistics 2012-2013
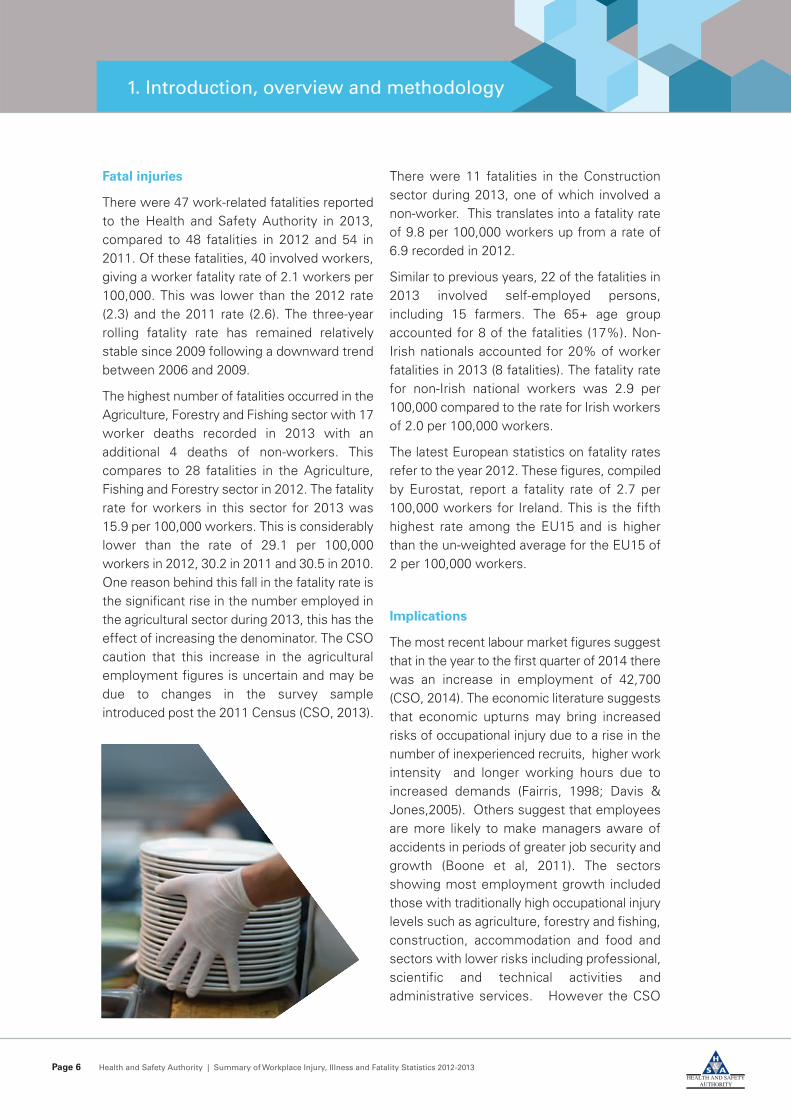
Fatal injuries
There were 47 work-related fatalities reportedto the Health and Safety Authority in 2013,compared to 48 fatalities in 2012 and 54 in2011. Of these fatalities, 40 involved workers,giving a worker fatality rate of 2.1 workers per100,000. This was lower than the 2012 rate(2.3) and the 2011 rate (2.6). The three-yearrolling fatality rate has remained relativelystable since 2009 following a downward trendbetween 2006 and 2009.
The highest number of fatalities occurred in theAgriculture, Forestry and Fishing sector with 17worker deaths recorded in 2013 with anadditional 4 deaths of non-workers. Thiscompares to 28 fatalities in the Agriculture,Fishing and Forestry sector in 2012. The fatalityrate for workers in this sector for 2013 was15.9 per 100,000 workers. This is considerablylower than the rate of 29.1 per 100,000workers in 2012, 30.2 in 2011 and 30.5 in 2010.One reason behind this fall in the fatality rate isthe significant rise in the number employed inthe agricultural sector during 2013, this has theeffect of increasing the denominator. The CSOcaution that this increase in the agriculturalemployment figures is uncertain and may bedue to changes in the survey sampleintroduced post the 2011 Census (CSO, 2013).
There were 11 fatalities in the Constructionsector during 2013, one of which involved anon-worker. This translates into a fatality rateof 9.8 per 100,000 workers up from a rate of6.9 recorded in 2012.
Similar to previous years, 22 of the fatalities in2013 involved self-employed persons,including 15 farmers. The 65+ age groupaccounted for 8 of the fatalities (17%). Non-Irish nationals accounted for 20% of workerfatalities in 2013 (8 fatalities). The fatality ratefor non-Irish national workers was 2.9 per100,000 compared to the rate for Irish workersof 2.0 per 100,000 workers.
The latest European statistics on fatality ratesrefer to the year 2012. These figures, compiledby Eurostat, report a fatality rate of 2.7 per100,000 workers for Ireland. This is the fifthhighest rate among the EU15 and is higherthan the un-weighted average for the EU15 of2 per 100,000 workers.
Implications
The most recent labour market figures suggestthat in the year to the first quarter of 2014 therewas an increase in employment of 42,700(CSO, 2014). The economic literature suggeststhat economic upturns may bring increasedrisks of occupational injury due to a rise in thenumber of inexperienced recruits, higher workintensity and longer working hours due toincreased demands (Fairris, 1998; Davis &Jones,2005). Others suggest that employeesare more likely to make managers aware ofaccidents in periods of greater job security andgrowth (Boone et al, 2011). The sectorsshowing most employment growth includedthose with traditionally high occupational injurylevels such as agriculture, forestry and fishing,construction, accommodation and food andsectors with lower risks including professional,scientific and technical activities andadministrative services. However the CSO
1. Introduction, overview and methodology

Health and Safety Authority | Summary of Workplace Injury, Illness and Fatality Statistics 2012-2013 Page 7
1. Introduction, overview and methodology
note that caution should be exercised ininterpreting these sector level trends,particularly for agriculture, due to samplechanges.
The triggers for occupational accidents haveremained remarkably stable over the recentyears. This highlights the potential to predictand prevent such accidents
In the case of fatal injuries those most at riskcontinue to be the self-employed in theconstruction and agricultural, forestry andfishing industry. The three year rolling averagesuggests that the fatality rate for workers hasremained stable over recent years,nevertheless the deaths of 40 workers and 7members of the public (including children)suggests that there is no room forcomplacency.
Ireland’s ranking position within the EU fatalitystatistics was the same in 2011 as in 2010: 5thhighest worker fatality rate within the EU15.This compares with ranking of 7th highest in2009 and 2008. In each of these years the Irishrate was above the EU15 average.
While the fatal and non-fatal injury rates haveremained stable over the three years (2010 to2012) the figures suggest that there has beenan upward trend in longer spells of work relatedillness from 2009 to 2012. Changes in the latestCSO module on occupational injuries mean thatwe must await next year’s module to confirmthe trends observed.
1.3 DATA SOURCES AND METHODOLOGY
A variety of sources are used to compile thesummary statistics presented here.
No one source provides a comprehensivepicture of occupational injury and illness so thestrengths and limitations of each data-set aredescribed.
Health and Safety Authority (HSA)
Employers are legally required to reportincidents to the Authority when injuries result infour or more days’ absence from work. TheHSA figures therefore represent a subset ofaccidents where the injury is serious enough towarrant an absence from work of four or moredays. Incidents related to a place of work or awork activity in which a member of the public isinjured are also reportable to the HSA, wherethe person requires treatment from a medicalpractitioner.2 In the tables based on the HSAdata that follow, the table headings and noteswill indicate whether the figures include orexclude ‘non-workers’.
It is known that there is significant under-reporting of accidents to the HSA as is the casein other national employer reporting systems.In 2012, 6,590 worker injuries were recorded,while the CSO figures for the same periodsuggest that there were 17,786 work-relatedaccidents that resulted in an absence of 4 ormore days (see Figure 2.4 below).3 Theseresults suggest that approximately 37% ofaccidents/injuries are captured in the HSA. Thisis similar to the level of under-reportingestimated by the Health and Safety Executivein the UK, which operates a similar reportingregime.4 The incentives and disincentives toreporting non-fatal incidents can varysignificantly across different groups.Comparison with figures from the CSO,suggests that under-reporting of accidents tothe HSA is particularly evident among the self-
2 For further information seehttp://www.hsa.ie/eng/Topics/Accident_and_Dangerous_Occurrence_Reporting/#reportableaccidents.
3 If accidents among those not employed at the time of the survey but employed in the previous 12 month periodare included in the CSO figures a total of 18,096 (4+ days) injuries are estimated.
4 It is estimated that for the period 2011/12 only 44% of worker accidents were reported to the HSE(http://www.hse.gov.uk/statistics/tables/index.htm#riddor).
Page 8 Health and Safety Authority | Summary of Workplace Injury, Illness and Fatality Statistics 2012-2013
employed and smaller employers. Forexample, less than 1% of work-relatedaccidents reported to the HSA in 2012 camefrom the self-employed compared to 21% ofthe injuries causing 4 or more days absenceidentified in the QNHS module. Similarly, 9%of non-fatal injuries reported to the HSA camefrom firms with less than ten employeescompared to 25% of injuries in the CSO data.
The HSA data also contains information onwork-related fatalities or fatalities in theworkplace during the relevant calendar year. Areview of research in other jurisdictions and apilot study in Ireland comparing coroner filesand HSA reports for one county suggest thatwork-related road traffic fatalities are under-recorded in the HSA register (Drummond,2007). Recent information on road trafficfatalities is available from the Road SafetyAuthority http://www.rsa.ie/en/RSA/Road-Safety/Our-Research/. The fatality statisticspresented also exclude deaths resulting fromlong-term work-related illness such as cancer.There are a number of alternative sources ofinformation on deaths from occupationaldiseases in Ireland such as the National CancerRegistry and the register of deaths, howeverthe diseases processes are often complex,multi-causal and can have a long latency periodmaking it difficult to attribute death tooccupational hazards (Drummond, 2007).
Despite these limitations the injuries reportedto the HSA provide a consistent record of asubset of work-related injuries and deaths thathas been collected in a similar manner over aperiod of years. The underlying definition ofreportable accidents/injuries to the HSA is setdown in legislation and has not changed inpractice since 1993.5
The occupational injury reports in theAuthority’s database are a valuable source of
information on the characteristics of theaccident victim, the nature of the incident, theworking environment and the proximate causeof the incident termed ‘triggers’. Thecategories of injury recorded, workenvironment, injury triggers and the definitionsto be used for other classification variablessuch as sector and occupation are set out byEuropean Statistics on Accidents at Work(ESAW).6
Quarterly National Household Survey
(QNHS) Module on Work Related Accidents
and Illness
Since 1998 the Central Statistics Office (CSO)has conducted an annual special module onwork related accidents and illnesses within theQNHS, though in the earliest years only a smallnumber of questions were included. Themodule is restricted to those who areemployed at the time of the survey or whowere not currently employed but workedduring the 12 month reference period.Following previous practice the illness andinjury figures reported below refer only tothose employed at the time of the survey. Themodule is usually fielded in Quarter 1 and thequestion normally relates to incidents occurringin the 12 months of the preceding calendaryear. So for example the module fielded in Q12012 asked:
“How many, if any, injuries did you incur at work (excluding commuting) during the period January 2011 to December 2011?”
The most recent data comes from the 2013module which was held in Quarter 2 2013. Themodule was part of the European-wide labourforce survey and a number of changes wereintroduced so that the data is harmonised
5 The Safety Health and Welfare at Work (General Application) Regulations, 1993.
6 Eurostat (2001) European statistics on accidents at work (ESAW) Methodology, 2001 Edition.
1. Introduction, overview and methodology

Health and Safety Authority | Summary of Workplace Injury, Illness and Fatality Statistics 2012-2013 Page 9
across the EU.7 The first change was the shiftin field date from quarter 1 to quarter 2.Secondly, the reference period was changedfrom the previous calendar year to the 12months preceding the interview date. Thirdly,changes were made to the question wording.
The information on work-related injuries wascollected in two steps. Respondents wereinitially asked:
“In the twelve months previous to this interview have you experienced any accidents at work or in the course of your work?”
(NOTE: Accidents outside working hours andaccidents during the journey from home towork or from work to home are excluded.However, accidents during a journey in thecourse of work are included).
This is followed by a question on the numberof accidents which also introduces thequalification that the incident resulted in aninjury:
How many accidents resulting in injury did you have during those months?
For the analysis that follows the injury figuresinclude only those who had an accidentresulting in an injury i.e. those who answered‘yes’ to both questions. This is the categorythat is most consistent with the previousmodules which ask about injuries incurred atwork.
Eurostat also specified a different set ofresponse categories for the question onduration of absence from work resulting fromthe accident or illness. Previous modulesallowed respondents to specify the exactnumber of days but the 2013 module providesclosed categories. One consequence of this
change is that the total number of days lost tothe economy cannot be calculated in the latestdata. Alterations to question wording orquestion order can result in non-negligiblechanges to survey responses.
This set of changes should be kept in mindwhen interpreting trends over time in the injuryrates based on the QNHS data.
Work related Illness
The QNHS module is also the source ofinformation for the work-related illnessstatistics presented below. In the 2013European-wide module information on work-related ill-health was collected using thefollowing questions
In the 12 months prior to this interview and excluding any accidents you might have highlighted already, have you suffered from any physical or mental health problems?
How many of these health problems are caused or made worse by work you are doing or have done in the past?
Again, these questions specified by Eurostatare a departure from those in previous QNHShealth and Safety Modules. In previous yearsrespondents were asked
How many, if any, illnesses or disabilities haveyou experienced during the 12 months January2010 to December 2010, that you believe werecaused or made worse by your work?
Now thinking about the time(s) when you werein employment during the 12 month, periodJanuary 2011 to December 2011 how manydays were you absent from your job as a resultof your most recent work-related illness?
7 The 2007 module was also carried out across the EU and therefore similar issues arise for that year (Venema et al, 2009).
1. Introduction, overview and methodology

Page 10 Health and Safety Authority | Summary of Workplace Injury, Illness and Fatality Statistics 2012-2013
The data in the QNHS are re-weighted toreflect the national distribution of thepopulation, and are grossed up to reflect theactual numbers in employment. In the case ofboth injury and illness statistics derived fromthe CSO the small number of respondentsexperiencing such ‘events’ in the unweighteddata mean that caution should be exercisedwhen interpreting differences between groupsand change over time. This issue is particularlyrelevant for descriptions of sub-groups such asage groups or workers within industrial sectors.
Eurostat Statistics
Eurostat, the statistical agency of the EuropeanUnion sets out methodologies for memberstates to collect information and producestatistics on occupational injuries and diseases.It compiles statistics based on injury datasupplied by Member States
European statistics on accidents at work(ESAW) is the main data source from Eurostatand provides data on accidents based onadministrative data from the Member States.The data comes from national registers, publicinsurance/social security schemes or nationalbodies responsible for the collection of data onaccidents at work. The data include non-fatalaccidents at work causing more than 3 days ofabsence as well as fatal accidents. These dataare reported in figures 2.10 and 3.15 below.There is a time-lag for the construction of thecomparative statistics so that the most recentEuropean-wide data refers to 2011. The Irishdata come from the reports to the HSA,however the number of accidents (and therates) cited by Eurostat differ from the HSAfigures. For example, the Eurostat figure forIreland is 11,101 for accidents resulting in morethan three days absence, while the HSA figureis 7,094 or 6,865 excluding nonworkers asESAW does not include members of the publicor family members (Eurostat 2001). Thedifference arises because in countries without
an insurance based system (including Ireland)Eurostat adjusts the figures based on reportinglevels by branch of economic activity. Eurostatalso calculate the harmonised rates for asubset of sectors, excluding PublicAdministration, Health and Education,Mining/Quarrying, because these workers arenot covered in many Member States.
The harmonised statistics produced byEurostat are available at http://epp.euorstat.ec.eruopa.eu/portal/page/portal/health/health_safety_work.
Occupational Injury Benefit Statistics
Figures on the number of claims foroccupational injury benefits are provided by theDepartment of Social Protection. Theserepresent claims made by insured personswho are injured during the course of their work.The injury must last at least 4 days.
A limitation of these data is that not all workersare covered by social insurance and not allinjuries result in a claim. On 6 January 2014 therules of the scheme changed so that paymentis made from the 7th day of incapacity of work,rather than the 4th day of incapacity.
1. Introduction, overview and methodology

Health and Safety Authority | Summary of Workplace Injury, Illness and Fatality Statistics 2012-2013 Page 11
This change does not affect the figurespresented below because they relate to theyear 2013. The figures on “days lost” refer tothe paid claim days, and therefore exclude thefirst three days of the claim and Sundays. Thisis the figure reported in previous HSA statisticsreport and is maintained for consistency.
1.4 CALCULATING ACCIDENT, ILLNESS
AND FATALITY RATES
In order to take account of changes in the levelof employment both economy-wide and withindifferent demographic groups and sectors therates of injury and illness are calculated per1,000 workers. Fatality rates are calculated per100,000 workers.
The question then arises as to whatemployment figure should be used for thedenominator. Previous HSA statistics reportshave used a variety of reference points. In thestatistics that follow the rates have beencalculated using the average level ofemployment across the four quarters of therelevant year. As the recorded accidents andillnesses occur over a 12 month period andbecause employment levels fluctuateseasonally, the four-quarter average provides abetter basis for calculating the incidence ratethan any one particular quarter. This calculationis used for reported accidents and illnessesfrom both the QNHS and HSA. As the latestQNHS data was collected in quarter 2 2013and refers to illness/injury in the 12 monthsprior to interview the employment levels werecalculated across the four quarters from q32012 to q2 2013.
Since the fatality numbers were reported on acalendar year basis, the denominator forcalculating the fatal injury rates is the numberemployed in the calendar year for all years. Thisis calculated by taking the average numberemployed across the four quarters of thecalendar year, as reported in the QNHSstatistics.
1.5 TECHNICAL NOTES
The HSA and the CSO use standardinternational classifications for statistics:
• Economic activity: NACE (Nomenclaturestatistique des activités économiques dansla Communauté Européenne: StatisticalClassification of Economic Activities in theEuropean Community), maintained byEurostat (Statistical Agency of the EuropeanCommission). The full classification isavailable to download from the Eurostatwebsite:http://circa.europa.eu/irc/dsis/nacecpacon/info/data/en/2007%20introduction.htm
• Occupation: ISCO (International StandardClassification of Occupations), maintained byILO (International Labour Organization).Further information on ISCO codes can befound on the ILO website:http://www.ilo.org/public/english/bureau/stat/isco/index.htm
• European Statistics on Accidents at Work(ESAW) – variables, definitions andclassifications relating to the victim, theincident and the circumstances of theincident, maintained by Eurostat:http://epp.eurostat.ec.europa.eu/cache/ITY_OFFPUB/KS-RA-12-002/EN/KS-RA-12-002-EN.PDF
1. Introduction, overview and methodology

Figure 2.1: Injuries Reported to the HSA 2004 -2013
2004 2005 2006 2007 2008 2009 2010 2011 2012 2013
Non-fatal 8,100 8,027 7,976 8,303 8,069 7,002 7,583 7,094 6,804 6,598incidents
Figure 2.2: Injuries reported by economic sector 2013 (HSA)
Workers1 Non-Workers All
N % N % N %
Q-Health & Social Work 1,413 22.1 22 10.9 1,435 21.8
C-Manufacturing 1,048 16.4 6 3.0 1,054 16.0
G-Wholesale & Retail trade 747 11.7 70 34.7 817 12.4
O-Public Administration & Defence 791 12.4 14 6.9 805 12.2
H-Transportation & Storage 798 12.5 6 3.0 804 12.2
F-Construction 398 6.2 11 5.4 409 6.2
E-Water, Sewerage, Waste 181 2.8 0 0.0 181 2.7
I-Accommodation & Food 158 2.5 21 10.4 179 2.7
P-Education 160 2.5 14 6.9 174 2.6
N-Admin & Support Service 169 2.6 1 0.5 170 2.6
S-Other Service Activities 134 2.1 1 0.5 135 2.0
K-Financial & Insurance 88 1.4 18 8.9 106 1.6
A-Agriculture, Forestry & Fishing 86 1.3 3 1.5 89 1.3
J-Information & Communication 74 1.2 0 0.0 74 1.1
M-Professional, Scientific & Technical 50 0.8 3 1.5 53 0.8
R-Arts, Entertainment 34 0.5 11 5.4 45 0.7
B-Mining & Quarrying 43 0.7 0 0.0 43 0.7
D-Electricity, Gas, Etc. 15 0.2 1 0.5 16 0.2
L-Real Estate 7 0.1 0 0.0 7 0.1
Total 6,394 100 202 100 6,596* 100
2.1 GENERAL INJURY AND ILLNESS STATISTICS
Page 12 Health and Safety Authority | Summary of Workplace Injury, Illness and Fatality Statistics 2012-2013
2. Non-Fatal Injury and Illness Statistics
Source: HSA database
Note: The figures reported in Figure 2.1 differ somewhat from those reported in the previously published HSA annualstatistics reports. There are two reasons for this discrepancy. Previously published figures for the years 2004 to 2009included ‘dangerous occurrence’ figures and these have now been removed. Secondly, the figures for more recentyears have been adjusted to include incidents that occurred within the relevant calendar year but were reported late tothe HSA.
1 The worker group includes 16 cases where employment status is missing. This applies to all statistics for ’workers’.
*Total excludes cases where the economic sector was missing.
N=Number

Figure 2.3: Numbers employed in each economic sector 2008–2013 Four Quarter Average
(Data based on CSO statistical release April 2014)
Numbers employed
Economic Sector 2008 2009 2010 2011 2012 2013
Agriculture, forestry and fishing 115,350 96,325 85,225 82,900 93,800 106,750
Industry* 288,025 259,175 245,350 240,325 236,175 240,500
Construction 239,350 158,325 121,000 107,800 100,825 102,000
Wholesale and retail trade 310,700 282,600 276,675 273,200 272,925 272,325
Transportation and storage 93,950 95,725 93,525 94,900 88,525 88,150
Accommodation and food service activities 128,950 126,925 126,700 116,525 122,825 130,825
Information and communication 71,450 73,975 74,900 76,325 79,800 80,575
Financial, insurance and real estate activities 106,950 108,075 101,875 102,000 100,925 99,300
Professional, scientific and technical activities 113,825 103,500 100,350 100,050 103,625 109,600
Administrative and support service activities 76,775 67,600 62,125 67,225 61,825 61,675
Public administration and defence; 105,175 106,275 104,675 101,300 96,500 95,350
Education 145,350 147,500 149,675 144,000 145,925 146,375
Human health and social work activities 224,275 231,575 237,700 241,175 245,700 246,325
Other NACE activities 100,725 97,050 94,675 96,875 99,925 99,875
Not stated 7,475 6,650 7,725 5,450 ** **
Total 2,128,325 1,961,275 1,882,175 1,850,050 1,851,425 1,881,150
compulsory social security
Health and Safety Authority | Summary of Workplace Injury, Illness and Fatality Statistics 2012-2013 Page 13
2. Non-Fatal Injury and Illness Statistics
Source: Central Statistics Office, Ireland.
Note: The employment figures are calculated as an average of the four quarters for the calendar year, this is a changefrom previous HSA statistics reports. For the year 2012 due to the change in the date of the QNHS module thereference period for the purpose of calculating non-fatal accident and injury rates is Q3 2012 to Q2 2013.
* Industry=Mining & quarrying + Manufacturing + Electricity; gas, steam and air conditioning supply + water supply, sewerage, waste management and remediation activities: NACE B to E.
** figure is not reported by CSO as the estimate is unreliable due to the small size of the cell.

Figure 2.4: Number and rate of people suffering injury and illness 2008–2012 (CSO)
2008 2009 2010 2011 2012
Number Rate Number Rate Number Rate Number Rate Number Rateper per per per per
1,000 1,000 1,000 1,000 1,000
Total in employment 2,128,325 1,961,275 1,882,175 1,850,050 1,851,425
Injury
Total suffering injury 41,994 19.7 32,010 16.3 40,584 21.6 40,097 21.7 35,001 18.9
0-3 days' absence 24,096 11.3 20,556 10.5 21,109 11.2 23,254 12.6 17,214 9.3
4+ days' absence 17,898 8.4 11,454 5.8 19,475 10.3 16,843 9.1 17,786 9.6
Days lost due 685,500 283,200 666,553 590,690 n.ato injury
Illness
Total suffering illness 40,874 19.2 30,593 15.6 38,704 20.6 48,436 26.2 50,210 27.1
0-3 days' absence 24,047 11.3 18,328 9.3 20,856 11.1 28,748 15.5 22,735 12.3
4+ days' absence 16,827 7.9 12,265 6.3 17,848 9.5 19,688 10.6 27,474 14.8
Days lost due 751,600 463,700 704,494 595,951 n.ato illness
Injury & Illness
Total injury or illness 82,868 38.9 62603 31.9 79,288 42.1 88,533 47.9 85,210 46.0
Total (4+ 34,725 16.3 23719 12.1 37,323 19.8 36,531 19.7 45,261 24.4days' absence)
Total days lost 1,437,100 746,900 1,371,047 1,186,641 n.a
The QNHS module on work-related injury and illness Q2 2013 does not collect the precise number of days lost so theeconomy-wide figure cannot be calculated.
Note: For all the statistics based on the CSO QNHS module that follow the numbers of injuries and illnesses refer tothose in employment at the time of the survey. The estimates are subject to sampling and other survey errors, andestimates and changes over time of a small magnitude can be taken to have lower precision.
n.a: not available
Page 14 Health and Safety Authority | Summary of Workplace Injury, Illness and Fatality Statistics 2012-2013
2. Non-Fatal Injury and Illness Statistics

Figure 2.5: Rate of injury and illness causing 4+ days’ lost per 1,000 Workers 2007–2012 (CSO)
Figure 2.6: Rate of injuries (any days lost) per 1,000 workers by economic sector 2012 (CSO)
2007
0
2
4
6
8
Rat
e p
er 1
,000
wo
rker
s
10
12
14
16
2008 2009 2010 2011 2012
4+ day injury
4+ day illness
Agriculture, forestry, fishing
Other NACE activities
Construction
Wholesale and retail trade
Transportation and storage
19
29
29
27
27
23
20
16
15Financial, insurance and real estate activities
Professional, scientific and technical activities
Total rate
Public administration and defence
Administrative and support service activities
Industry
Education
Accommodation and food service activities
Human health and social work activities
Professional, scientific and technical activities
0 5 10 15 20 25 30 35
15
14
13
9
9
8
Health and Safety Authority | Summary of Workplace Injury, Illness and Fatality Statistics 2012-2013 Page 15
2. Non-Fatal Injury and Illness Statistics
Note: The rate is calculated from the four-quarter average employment for the year as outlined in Figure 2.3

Figure 2.7: Rate of 4+ day injuries per 1,000 workers in selected sectors 2007-2012 (CSO)
Figure 2.8: Rate of illness (any days lost) per 1,000 workers by economic sector 2012 (CSO)
Rat
e p
er 1
000
wo
rker
s
20070.0
5.0
10.0
15.0
20.0
25.0
2008 2009 2010 2011 2012
All sectors Construction
Agriculture, forestry and fishing Transportation and storage
Human health and social work activitiesIndustry
0 10 30 40 505 15 25 35 4520
Agriculture, forestry, fishing
Other NACE activities
Construction
Wholesale and retail trade
Transportation and storage
Financial, insurance and real estate
Professional, scientific and technical
Total rate
Public administraton and defence
Accommodation and food services
Industry
Education
27
47
41
37
34
31
30
28
25
25
21
17
16
15
14
Administration and support services
Human health and social work
Information and communication
Page 16 Health and Safety Authority | Summary of Workplace Injury, Illness and Fatality Statistics 2012-2013
2. Non-Fatal Injury and Illness Statistics

Figure 2.9: Occupational injury benefit claims (DSP)
Year Claims allowed Days lost Avg. days lost per claim
2000 11,9952001 12,0502002 12,2802003 11,0962004 11,7052005 11,7592006 12,4162007 13,803 502,178 362008 13,017 494,866 382009 13,099 489,308 382010 11,813 423,394 362011 11,616 406,730 352012 10,927 392,436 362013 11,428 414,997 37
NO DATA
Spain
Portugal
France
Luxembourg
Germany
Belgium
Finland
Netherlands
Italy
Denmark
Austria
Greece
Ireland
United Kingdom
Sweden
3,714
3,432
2,953
2,484
2,092
2,104
2,479
2,011
2,443
1,865
2,269
1,038
874
955
519
0 1,000 1,500 2,500500 2,000 3,000 4,0003,500
Figure 2.10: Rate of 4+ day injuries per 100,000 Workers in the EU 2011 (Eurostat)
Note: The Eurostat 4+ injury rates are based on figures submitted by national agencies but are
adjusted to take account of different reporting levels across countries (see discussion in section
3 on ‘Data Sources and Methodology).
Health and Safety Authority | Summary of Workplace Injury, Illness and Fatality Statistics 2012-2013 Page 17
2. Non-Fatal Injury and Illness Statistics
Source: Department of Social Protection
Note: The number of days lost refers to the number of paid claim days and therefore does not count the first three
days of the claim or Sundays. Including these unpaid days leads to a figure of 537,862 days lost in 2013 and an
average of 47 days per claim.
2.2 VICTIM STATISTICS
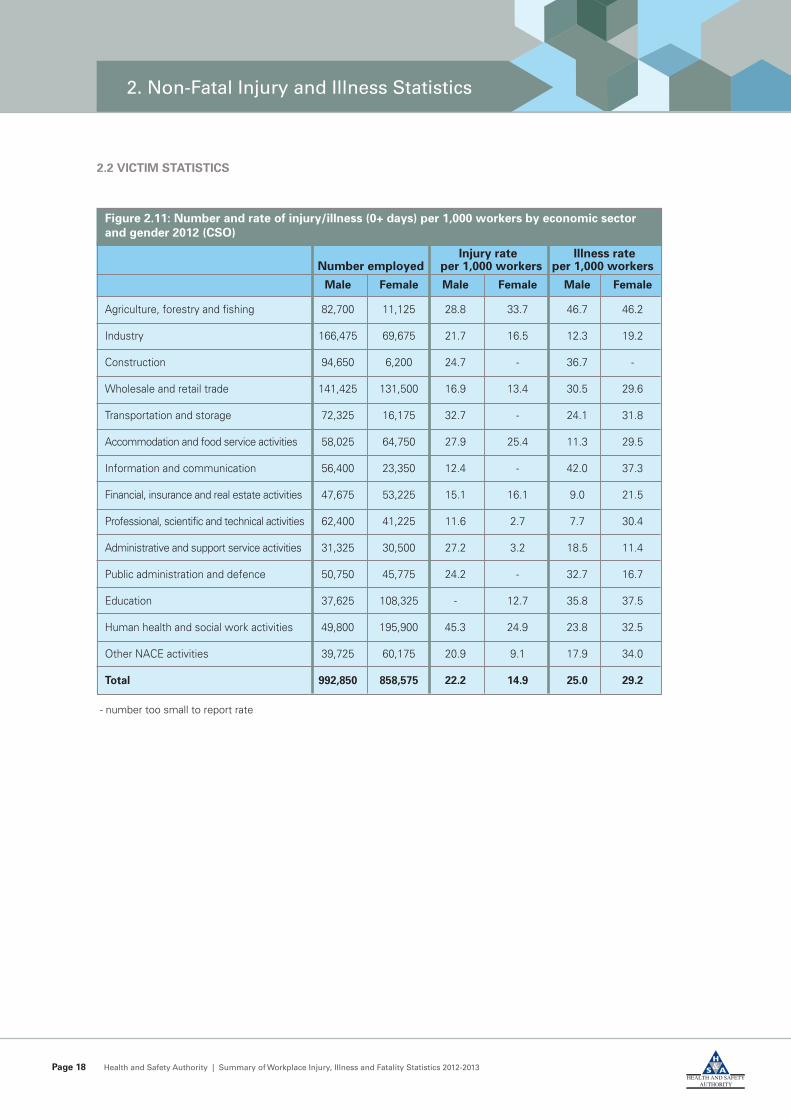
Figure 2.11: Number and rate of injury/illness (0+ days) per 1,000 workers by economic sector
and gender 2012 (CSO)
Number employed per 1,000 workers per 1,000 workers
Male Female Male Female Male Female
Agriculture, forestry and fishing 82,700 11,125 28.8 33.7 46.7 46.2
Industry 166,475 69,675 21.7 16.5 12.3 19.2
Construction 94,650 6,200 24.7 - 36.7 -
Wholesale and retail trade 141,425 131,500 16.9 13.4 30.5 29.6
Transportation and storage 72,325 16,175 32.7 - 24.1 31.8
Accommodation and food service activities 58,025 64,750 27.9 25.4 11.3 29.5
Information and communication 56,400 23,350 12.4 - 42.0 37.3
Financial, insurance and real estate activities 47,675 53,225 15.1 16.1 9.0 21.5
Professional, scientific and technical activities 62,400 41,225 11.6 2.7 7.7 30.4
Administrative and support service activities 31,325 30,500 27.2 3.2 18.5 11.4
Public administration and defence 50,750 45,775 24.2 - 32.7 16.7
Education 37,625 108,325 - 12.7 35.8 37.5
Human health and social work activities 49,800 195,900 45.3 24.9 23.8 32.5
Other NACE activities 39,725 60,175 20.9 9.1 17.9 34.0
Total 992,850 858,575 22.2 14.9 25.0 29.2
- number too small to report rate
Injury rate Illness rate
Page 18 Health and Safety Authority | Summary of Workplace Injury, Illness and Fatality Statistics 2012-2013
2. Non-Fatal Injury and Illness Statistics

Figure 2.12: Rate of total injury (0+ days) per 1,000 workers by gender 2007-2012 (CSO)
Figure 2.13: Rate of total illness (0+ days) per 1,000 workers by gender 2007-2012 (CSO)
Rat
e p
er 1
,000
wo
rker
s
40
35
30
25
20
15
10
5
0
2007 2008 2009 2010 20122011
Male injury rate
Female injury rate
Rat
e p
er 1
,000
wo
rker
s
2007 2008 2009 2010 2011 2012
35
30
25
20
15
10
5
0
Male illness rate
Female illness rate
Health and Safety Authority | Summary of Workplace Injury, Illness and Fatality Statistics 2012-2013 Page 19
2. Non-Fatal Injury and Illness Statistics

Figure 2.14: Rates of total injury and total illness (0+ days) per 1,000 workers by age band 2012 (CSO)
Age range Injury rate 2012 Illness rate 2012
15-19 * *
20-24 * *
25-34 20.5 25.4
35-44 20.0 27.6
45-54 18.9 32.0
55-64 15.2 29.5
65+ * *
Total 18.9 27.1
Figure 2.15: Rates of total injury and total illness (0 + days) per 1,000 workers by occupation 2012 (CSO)
Occupation Injury rate 2012 Illness rate 2012
Managers and Administrators 24.7 27.3
Professional 12.3 28.6
Associate Professional and Technical 24.1 31.3
Clerical and Secretarial 5.9 16.8
Craft and Related 29.5 36.4
Personal and Protective Service 24.4 37.0
Sales 9.2 23.6
Plant and Machines Operatives 29.9 27.3
Elementary Occupations* 16.2 13.7
Other/not stated - 31.1
All occupations 18.9 27.1
*includes elementary agricultural (eg. farm workers), construction, process plant (eg. packers), administration(eg. postal workers), cleaning, security, sales, storage and other occupations. See CSO (2012) for a detaileddescription of the SOC 2010.
* figure is not reported as the estimate is unreliable due to the small size of the cell.
Page 20 Health and Safety Authority | Summary of Workplace Injury, Illness and Fatality Statistics 2012-2013
2. Non-Fatal Injury and Illness Statistics

Figure 2.16: Reported non-fatal injuries by employment status 2013 (HSA)
Figure 2.17: Workers by nationality and economic sector 2012 (CSO statistical release April 2013)
Number of workers
Economic Sector Irish Non-Irish % Non-Irish
Agriculture, forestry and fishing 86,725 7,070 7.5%
Industry 193,213 42,955 18.2%
Construction 89,875 10,954 10.9%
Wholesale and retail trade 228,868 44,070 16.1%
Transportation and storage 78,169 10,344 11.7%
Accommodation and food service activities 83,305 39,524 32.2%
Information and communication 64,181 15,592 19.5%
Financial, insurance and real estate activities 91,833 9,081 9.0%
Professional, scientific and technical activities 92,615 11,010 10.6%
Administrative and support service activities 47,532 14,288 23.1%
Public administration and defence 94,356 - -
Education 136,513 9,423 6.5%
Human health and social work activities 209,620 36,057 14.7%
Other NACE activities 82,793 17,129 17.1%
Total 1,579,596 269,642 14.6%
Self-employed
Non-worker
Family worker<1%
1%
Employee95%
Not stated0%
Trainee1%
3%
Health and Safety Authority | Summary of Workplace Injury, Illness and Fatality Statistics 2012-2013 Page 21
2. Non-Fatal Injury and Illness Statistics
- unweighted number of non-nationals in public administration too small to report
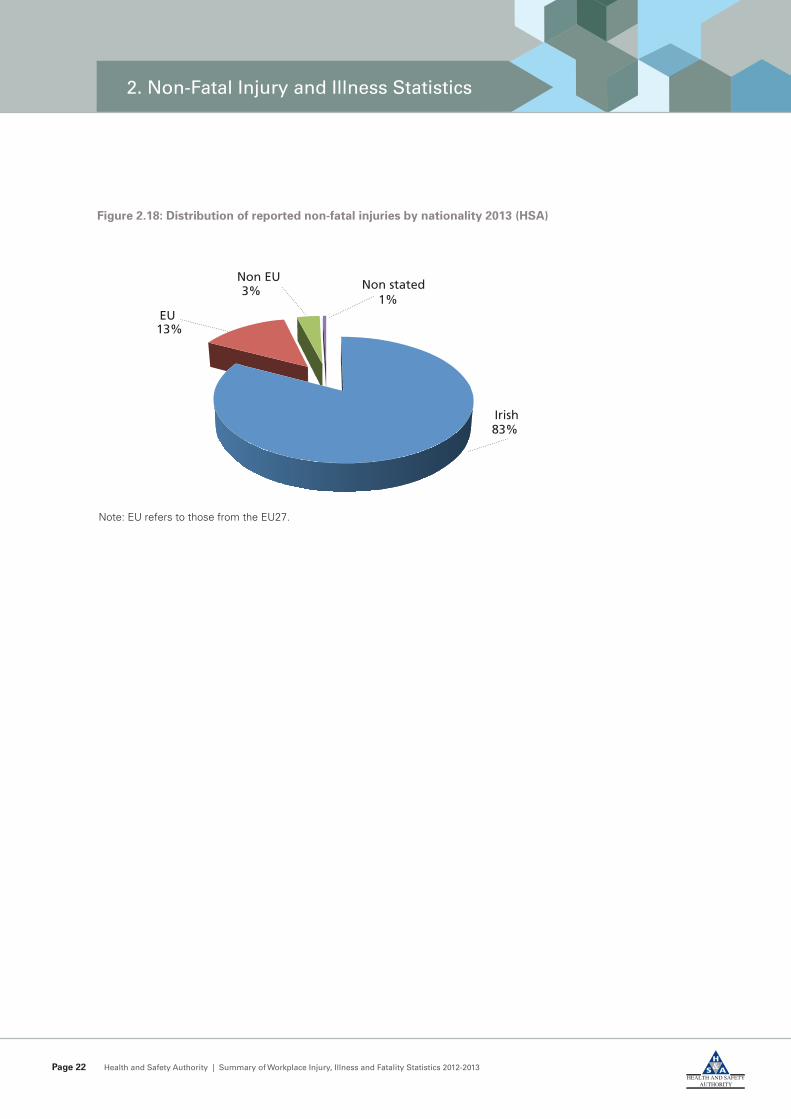
Figure 2.18: Distribution of reported non-fatal injuries by nationality 2013 (HSA)
83%Irish
13%EU
3%Non EU
1%Non stated
Page 22 Health and Safety Authority | Summary of Workplace Injury, Illness and Fatality Statistics 2012-2013
Note: EU refers to those from the EU27.
2. Non-Fatal Injury and Illness Statistics

2.3 NATURE OF ACCIDENTS AND TYPE OF INJURIES SUSTAINED
Figure 2.19: Non-fatal injuries by trigger 2013 (HSA)
Health and Safety Authority | Summary of Workplace Injury, Illness and Fatality Statistics 2012-2013 Page 23
Fall on samelevel18%
Aggression,shock,
violence5%
Fall fromheight
5%
Loss of control,transport or
handlingequipment
4%
Manualhandling
32%
All other triggers30%
Body movement(no physical stress)
6%
Figure 2.20: Number and Percentage of non-fatal accidents by trigger, Selected Sectors 2013 (HSA)
C-Manufacturing F-Construction G-Wholesale H-Transport O-Public Admin Q-Health && Retail & Storage & Defence Social Work
N % N % N % N % N % N %
Body movement no 85 8.1 28 6.8 29 3.5 34 4.2 30 3.7 113 7.9physical stress
Fall from height 50 4.7 48 11.7 40 4.9 47 5.8 38 4.7 25 1.7
Fall on same level 144 13.7 73 17.8 169 20.7 131 16.3 125 15.5 278 19.4
Manual handling 385 36.5 112 27.4 318 38.9 310 38.6 186 23.1 425 29.6
Loss of control transport or 11 1.0 17 4.2 22 2.7 41 5.1 77 9.6 35 2.4handling equipment
Aggression, shock, violence 1 .1 4 1.0 8 1.0 18 2.2 57 7.1 221 15.4
Loss of control of hand tool, 114 10.8 50 12.2 79 9.7 22 2.7 26 3.2 25 1.7machine or object being worked on
All other 264 25 77 18.8 152 18.6 201 25 266 33.0 313 21.8
Total 1,054 100 409 100 817 100 804 100 805 100 1,435 100
N = Number
2. Non-Fatal Injury and Illness Statistics
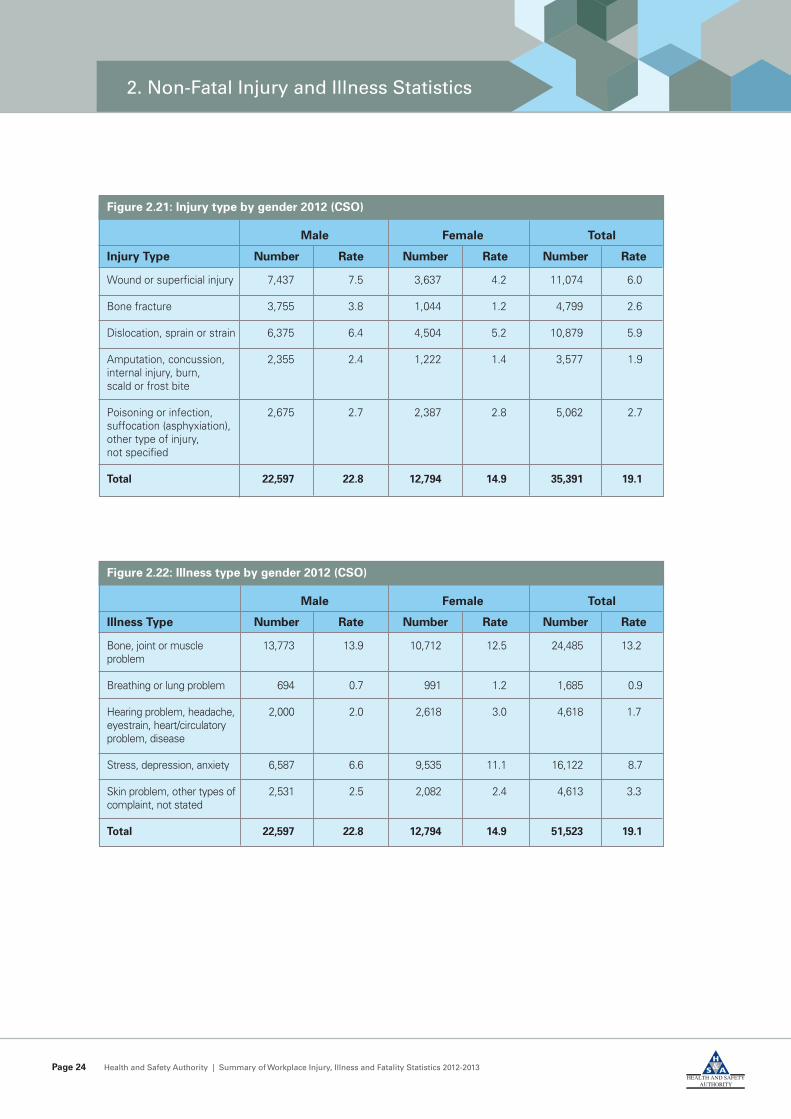
Figure 2.21: Injury type by gender 2012 (CSO)
Male Female Total
Injury Type Number Rate Number Rate Number Rate
Wound or superficial injury 7,437 7.5 3,637 4.2 11,074 6.0
Bone fracture 3,755 3.8 1,044 1.2 4,799 2.6
Dislocation, sprain or strain 6,375 6.4 4,504 5.2 10,879 5.9
Amputation, concussion, 2,355 2.4 1,222 1.4 3,577 1.9internal injury, burn, scald or frost bite
Poisoning or infection, 2,675 2.7 2,387 2.8 5,062 2.7suffocation (asphyxiation), other type of injury, not specified
Total 22,597 22.8 12,794 14.9 35,391 19.1
Page 24 Health and Safety Authority | Summary of Workplace Injury, Illness and Fatality Statistics 2012-2013
Figure 2.22: Illness type by gender 2012 (CSO)
Male Female Total
Illness Type Number Rate Number Rate Number Rate
Bone, joint or muscle 13,773 13.9 10,712 12.5 24,485 13.2problem
Breathing or lung problem 694 0.7 991 1.2 1,685 0.9
Hearing problem, headache, 2,000 2.0 2,618 3.0 4,618 1.7eyestrain, heart/circulatory problem, disease
Stress, depression, anxiety 6,587 6.6 9,535 11.1 16,122 8.7
Skin problem, other types of 2,531 2.5 2,082 2.4 4,613 3.3complaint, not stated
Total 22,597 22.8 12,794 14.9 51,523 19.1
2. Non-Fatal Injury and Illness Statistics

Figure 2.23b: Most injured body parts, Workers 2013 (HSA)
Back 23%
Hand 8%
Leg 8%
Ankle 6%
Fingers 9%
Arm 6%
Shoulder 6%
Figure 2.23a: Most injured body parts, 2013 (HSA)
All Workers Only
Number % Number %
Back, including spine & vertebra in the back 1,453 22.0 1,445 22.6
Finger(s) 593 9.0 584 9.1
Leg, including knee 502 7.6 485 7.6
Hand 499 7.6 493 7.7
Ankle 414 6.3 392 6.1
Shoulder and shoulder joints 404 6.1 396 6.2
Arm, including elbow 369 5.6 356 5.6
All others including unknown 2,364 35.8 2,245 35.1
Total 6,598 100.0 6,396 100.0
Health and Safety Authority | Summary of Workplace Injury, Illness and Fatality Statistics 2012-2013 Page 25
2. Non-Fatal Injury and Illness Statistics

2.4 WORK ENVIRONMENT STATISTICS
4-6 days 7-13 days 14-20 days 21 days - less than1 month
1 month - less than3 months
3 months - less than6 months
6 months ormore
Days lostunknown
0
5
10
15
20
25
30
36
%
25
30
13
9
17
31
2
Figure 2.24: Percentage of non-fatal injuries by absence from work 2013 (HSA)
Page 26 Health and Safety Authority | Summary of Workplace Injury, Illness and Fatality Statistics 2012-2013
Figure 2.25a Reported non-fatal injuries by work environment 2013 (HSA)
All Workers Only
Number % Number %
Construction site 227 3.4 224 3.5
Farming, Forestry, Fishing (not on vessel) 88 1.3 85 1.3
Hospital & other healthcare 1,204 18.2 1,198 18.7
Public thoroughfare 719 10.9 707 11.1
Production area, factory, workshop 1,374 20.8 1,363 21.3
Area for storage loading 445 6.7 441 6.9
Shop, sales, service activity area 651 9.9 567 8.9
Other 1,871 28.4 1,793 28.0
Unknown 19 0.3 18 0.3
Total 6,598 100 6,396 100
Note: Excludes 'non-workers' includes those whose employment status is missing
2. Non-Fatal Injury and Illness Statistics
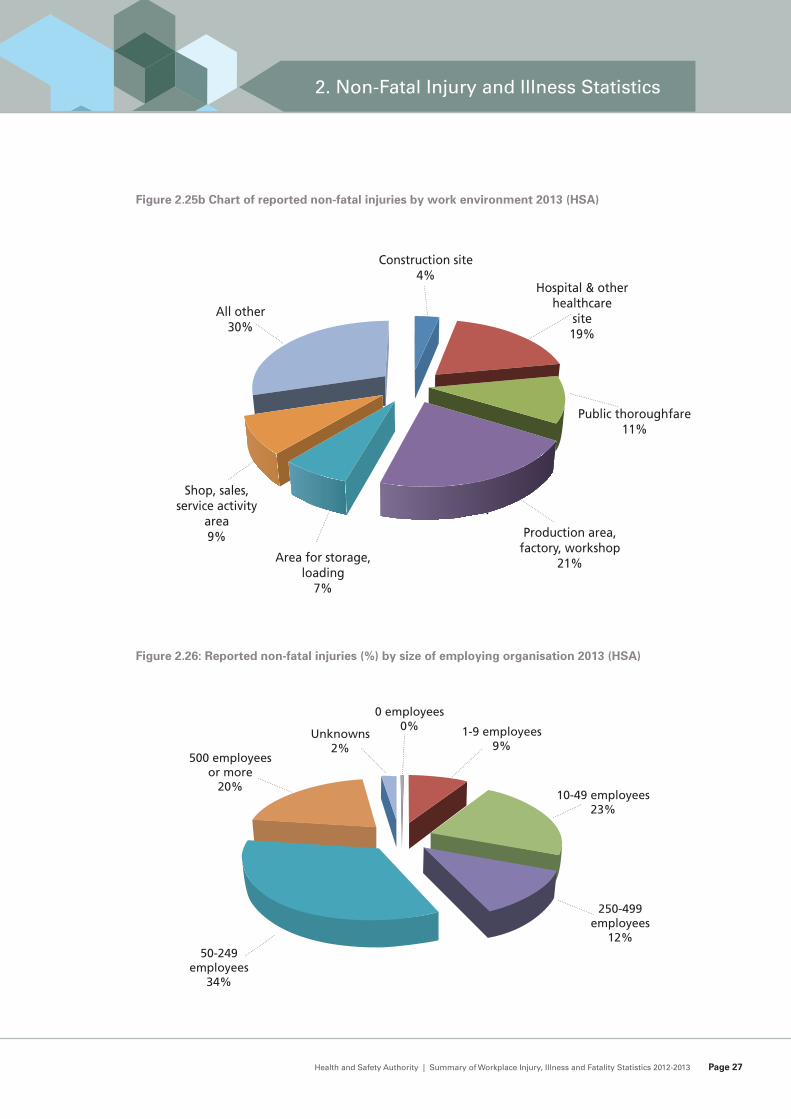
50-249employees
34%
250-499employees
12%
Unknowns2%
500 employeesor more
20%10-49 employees
23%
1-9 employees9%
0 employees0%
Figure 2.25b Chart of reported non-fatal injuries by work environment 2013 (HSA)
Health and Safety Authority | Summary of Workplace Injury, Illness and Fatality Statistics 2012-2013 Page 27
Area for storage,loading
7%
All other30%
Production area,factory, workshop
21%
Public thoroughfare11%
Shop, sales,service activity
area9%
Hospital & otherhealthcare
site19%
Construction site4%
Figure 2.26: Reported non-fatal injuries (%) by size of employing organisation 2013 (HSA)
2. Non-Fatal Injury and Illness Statistics
Page 28 Health and Safety Authority | Summary of Workplace Injury, Illness and Fatality Statistics 2012-2013
Figure 2.27: Number of non-fatal injury reports by county 2013 (HSA)
Workers Non-Workers All
Clare 120 5 125
Cork 740 29 769
Cavan 81 1 82
Carlow 63 5 68
Donegal 100 10 110
Dublin 2,472 69 2,541
Galway 253 12 265
Kildare 328 5 333
Kilkenny 106 2 108
Kerry 221 2 223
Longford 39 2 41
Louth 138 2 140
Limerick 315 7 322
Leitrim 18 1 19
Laois 73 6 79
Meath 182 7 189
Monaghan 49 2 51
Mayo 112 7 119
Offaly 114 3 117
Roscommon 35 2 37
Sligo 76 4 80
Tipperary 262 3 265
Waterford 133 4 137
Westmeath 100 2 102
Wicklow 116 2 118
Wexford 147 8 155
All 6,393 202 6,595
2. Non-Fatal Injury and Illness Statistics

Total Injury (0+ days) Illness (0+ days)
Region employed Number Rate per Number Rate per 1,000 1,000
Border 175,950 3,753 21.3 4,982 28.3
Midlands 106,900 1,802 16.9 2,467 23.1
West 182,625 2,475 13.6 4,991 27.3
Dublin 551,725 13,009 23.6 15,104 27.4
Mid-East 222,150 3,132 14.1 5,237 23.6
Mid-west 149,600 1,797 12.0 3,199 21.4
South-East 184,950 2,041 11.0 5,303 28.7
South-West 277,425 6,990 25.2 8,927 32.2
Note: The employment figures that are used to calculate the employment rates come from a household survey (QNHS)so they refer to the region where people reside rather than where they work.
Border: Cavan, Donegal, Leitrim, Louth, Monaghan, Sligo.Midlands: Laois, Longford, Offaly, WestmeathWest: Galway, Mayo, RoscommonDublin: DublinMid-East: Kildare, Meath, WicklowMid-West: Clare, Limerick, Tipperary NorthSouth-East: Carlow, Kilkenny, Tipperary South, Waterford, WexfordSouth-West: Cork, Kerry
Health and Safety Authority | Summary of Workplace Injury, Illness and Fatality Statistics 2012-2013 Page 29
South-West
South-East
Mid-West
West
Midlands
Rate per 1,000
Dublin
Mid-East
Border
0 5 10 15 20 25 30 35
Injury rate
Illness rate
Figure 2.28 Rate of illness and injury (0+ days) by region 2012 (CSO)
2. Non-Fatal Injury and Illness Statistics
3 FATAL INJURY STATISTICS
Figure 3.1: Rate of worker fatalities per 100,000 workers 1998-2013 (HSA)
Figure 3.2: Number of reported fatalities by economic sector (worker and non-worker) 2013 (HSA)
Sector key
A – Agriculture, forestry and fishing; B - Mining and quarrying; E– Water supply; sewerage, waste management andremediation activities; F – Construction; G – Wholesale/Retail trade, repair of vehicles, personal and household goods;H– Transportation and storage; M - Professional, scientific and technical activities; N - Administrative and support serviceactivities; P-Education; R-U-Other Nace activities
Number of fatalities
0 5 10 15 20 25
Workers
Non-workers
a - Agriculture, forestry, fishing
R-U- Other NACE activities
F - Construction
G - Wholesale and retail trade
H - Transportation and storage
M - Professional, scientific and technical activities
B - Mining and quarrying
D - Electricity, gas, etc.
E - Water, sewage, waste
C- - Manufacturing
P - Education
20052003 200420021998 1999 2000 2001 2006 2007 2008 2009 2010 2011 2012 2013
Rat
e p
er 1
00,0
00 w
ork
ers 3.5
4.0
4.5
3
2.5
2
1.5
1
0.5
0
Annual rate 3 year rolling rate
Page 30 Health and Safety Authority | Summary of Workplace Injury, Illness and Fatality Statistics 2012-2013
3 Fatal Injury Statistics
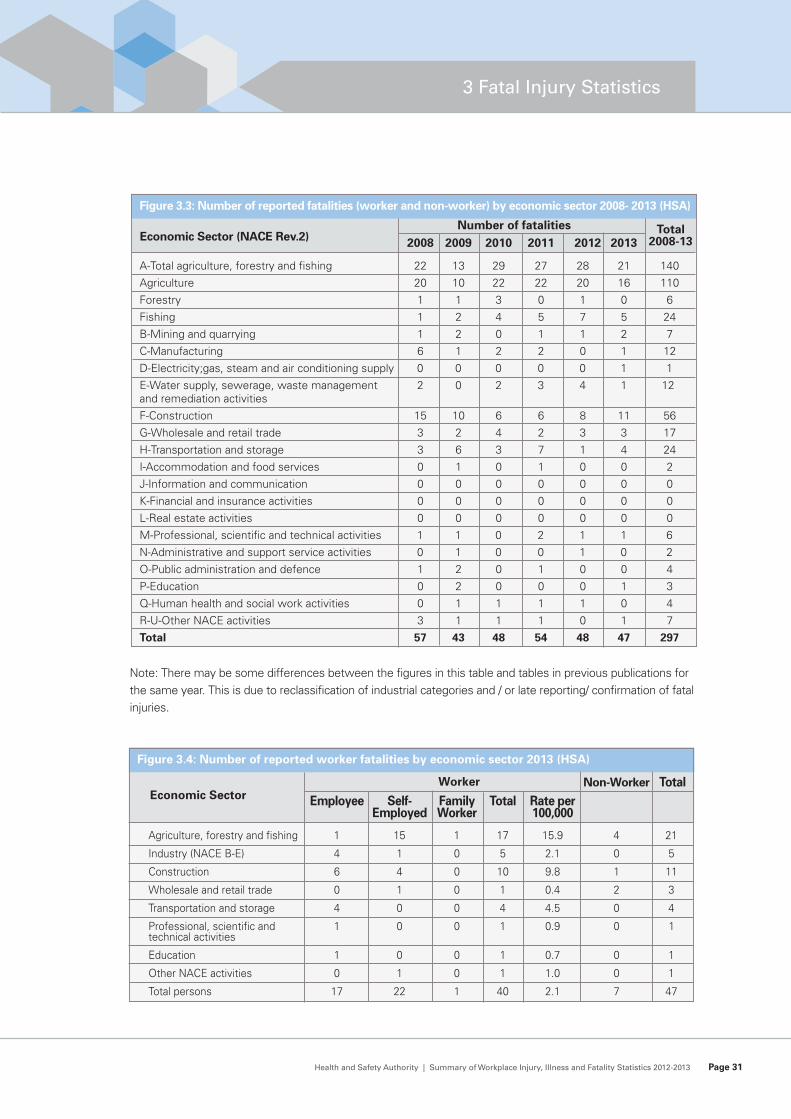
Figure 3.4: Number of reported worker fatalities by economic sector 2013 (HSA)
Worker
Employee Self- Family Total Rate per Employed Worker 100,000
Agriculture, forestry and fishing 1 15 1 17 15.9 4 21
Industry (NACE B-E) 4 1 0 5 2.1 0 5
Construction 6 4 0 10 9.8 1 11
Wholesale and retail trade 0 1 0 1 0.4 2 3
Transportation and storage 4 0 0 4 4.5 0 4
Professional, scientific and 1 0 0 1 0.9 0 1technical activities
Education 1 0 0 1 0.7 0 1
Other NACE activities 0 1 0 1 1.0 0 1
Total persons 17 22 1 40 2.1 7 47
Figure 3.3: Number of reported fatalities (worker and non-worker) by economic sector 2008- 2013 (HSA)
Number of fatalities
2008 2009 2010 2011 2012 2013
A-Total agriculture, forestry and fishing 22 13 29 27 28 21 140
Agriculture 20 10 22 22 20 16 110
Forestry 1 1 3 0 1 0 6
Fishing 1 2 4 5 7 5 24
B-Mining and quarrying 1 2 0 1 1 2 7
C-Manufacturing 6 1 2 2 0 1 12
D-Electricity;gas, steam and air conditioning supply 0 0 0 0 0 1 1
E-Water supply, sewerage, waste management 2 0 2 3 4 1 12and remediation activities
F-Construction 15 10 6 6 8 11 56
G-Wholesale and retail trade 3 2 4 2 3 3 17
H-Transportation and storage 3 6 3 7 1 4 24
I-Accommodation and food services 0 1 0 1 0 0 2
J-Information and communication 0 0 0 0 0 0 0
K-Financial and insurance activities 0 0 0 0 0 0 0
L-Real estate activities 0 0 0 0 0 0 0
M-Professional, scientific and technical activities 1 1 0 2 1 1 6
N-Administrative and support service activities 0 1 0 0 1 0 2
O-Public administration and defence 1 2 0 1 0 0 4
P-Education 0 2 0 0 0 1 3
Q-Human health and social work activities 0 1 1 1 1 0 4
R-U-Other NACE activities 3 1 1 1 0 1 7
Total 57 43 48 54 48 47 297
Economic Sector
Economic Sector (NACE Rev.2)
Health and Safety Authority | Summary of Workplace Injury, Illness and Fatality Statistics 2012-2013 Page 31
3 Fatal Injury Statistics
Total2008-13
Note: There may be some differences between the figures in this table and tables in previous publications forthe same year. This is due to reclassification of industrial categories and / or late reporting/ confirmation of fatalinjuries.
Non-Worker Total
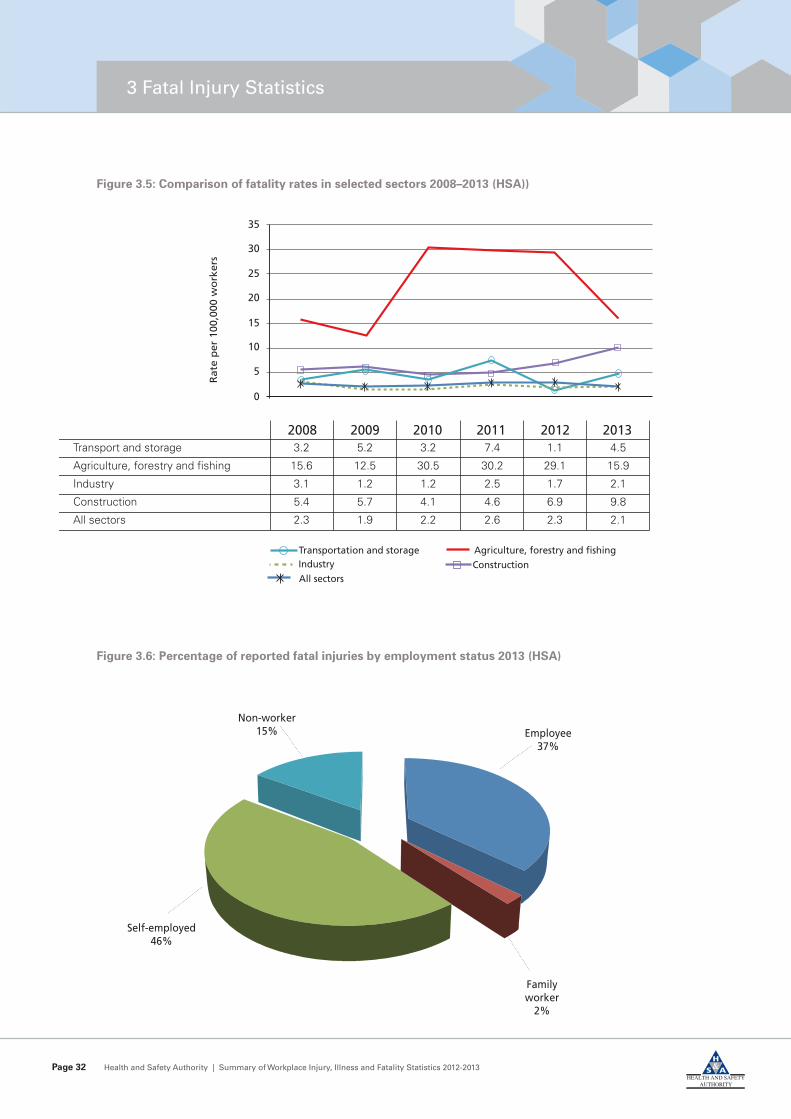
Figure 3.5: Comparison of fatality rates in selected sectors 2008–2013 (HSA))
Rat
e p
er 1
00,0
00 w
ork
ers
0
5
10
15
20
25
30
35
2008 2009 20112010 2012 2013
All sectorsConstruction
Agriculture, forestry and fishingTransportation and storageIndustry
Page 32 Health and Safety Authority | Summary of Workplace Injury, Illness and Fatality Statistics 2012-2013
3 Fatal Injury Statistics
Transport and storage 3.2 5.2 3.2 7.4 1.1 4.5
Agriculture, forestry and fishing 15.6 12.5 30.5 30.2 29.1 15.9
Industry 3.1 1.2 1.2 2.5 1.7 2.1
Construction 5.4 5.7 4.1 4.6 6.9 9.8
All sectors 2.3 1.9 2.2 2.6 2.3 2.1
Employee37%
Non-worker15%
Self-employed46%
Familyworker
2%
Figure 3.6: Percentage of reported fatal injuries by employment status 2013 (HSA)
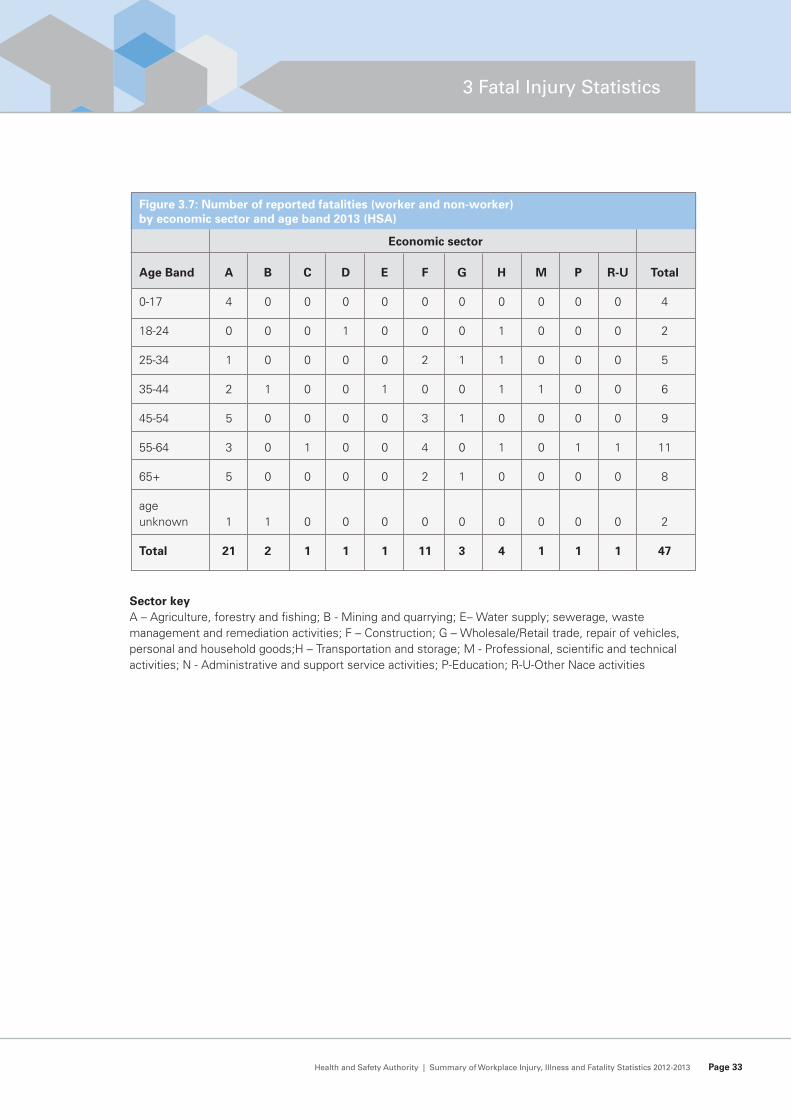
Figure 3.7: Number of reported fatalities (worker and non-worker)
by economic sector and age band 2013 (HSA)
Age Band A B C D E F G H M P R-U Total
0-17 4 0 0 0 0 0 0 0 0 0 0 4
18-24 0 0 0 1 0 0 0 1 0 0 0 2
25-34 1 0 0 0 0 2 1 1 0 0 0 5
35-44 2 1 0 0 1 0 0 1 1 0 0 6
45-54 5 0 0 0 0 3 1 0 0 0 0 9
55-64 3 0 1 0 0 4 0 1 0 1 1 11
65+ 5 0 0 0 0 2 1 0 0 0 0 8
ageunknown 1 1 0 0 0 0 0 0 0 0 0 2
Total 21 2 1 1 1 11 3 4 1 1 1 47
Economic sector
Sector key
A – Agriculture, forestry and fishing; B - Mining and quarrying; E– Water supply; sewerage, wastemanagement and remediation activities; F – Construction; G – Wholesale/Retail trade, repair of vehicles,personal and household goods;H – Transportation and storage; M - Professional, scientific and technicalactivities; N - Administrative and support service activities; P-Education; R-U-Other Nace activities
Health and Safety Authority | Summary of Workplace Injury, Illness and Fatality Statistics 2012-2013 Page 33
3 Fatal Injury Statistics
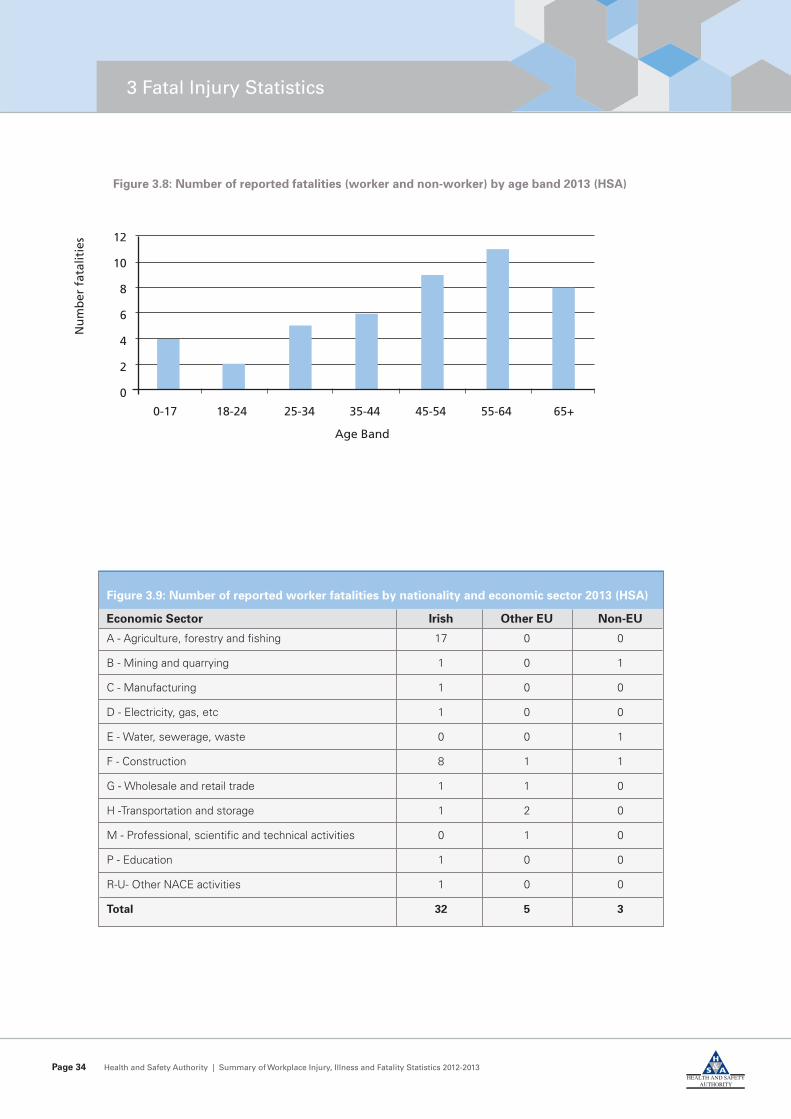
Figure 3.8: Number of reported fatalities (worker and non-worker) by age band 2013 (HSA)
Figure 3.9: Number of reported worker fatalities by nationality and economic sector 2013 (HSA)
Economic Sector Irish Other EU Non-EU
A - Agriculture, forestry and fishing 17 0 0
B - Mining and quarrying 1 0 1
C - Manufacturing 1 0 0
D - Electricity, gas, etc 1 0 0
E - Water, sewerage, waste 0 0 1
F - Construction 8 1 1
G - Wholesale and retail trade 1 1 0
H -Transportation and storage 1 2 0
M - Professional, scientific and technical activities 0 1 0
P - Education 1 0 0
R-U- Other NACE activities 1 0 0
Total 32 5 3
0-17 18-24 25-34 35-44 45-54 55-64 65+
Age Band
Nu
mb
er f
atal
itie
s 12
10
8
6
4
2
0
Page 34 Health and Safety Authority | Summary of Workplace Injury, Illness and Fatality Statistics 2012-2013
3 Fatal Injury Statistics
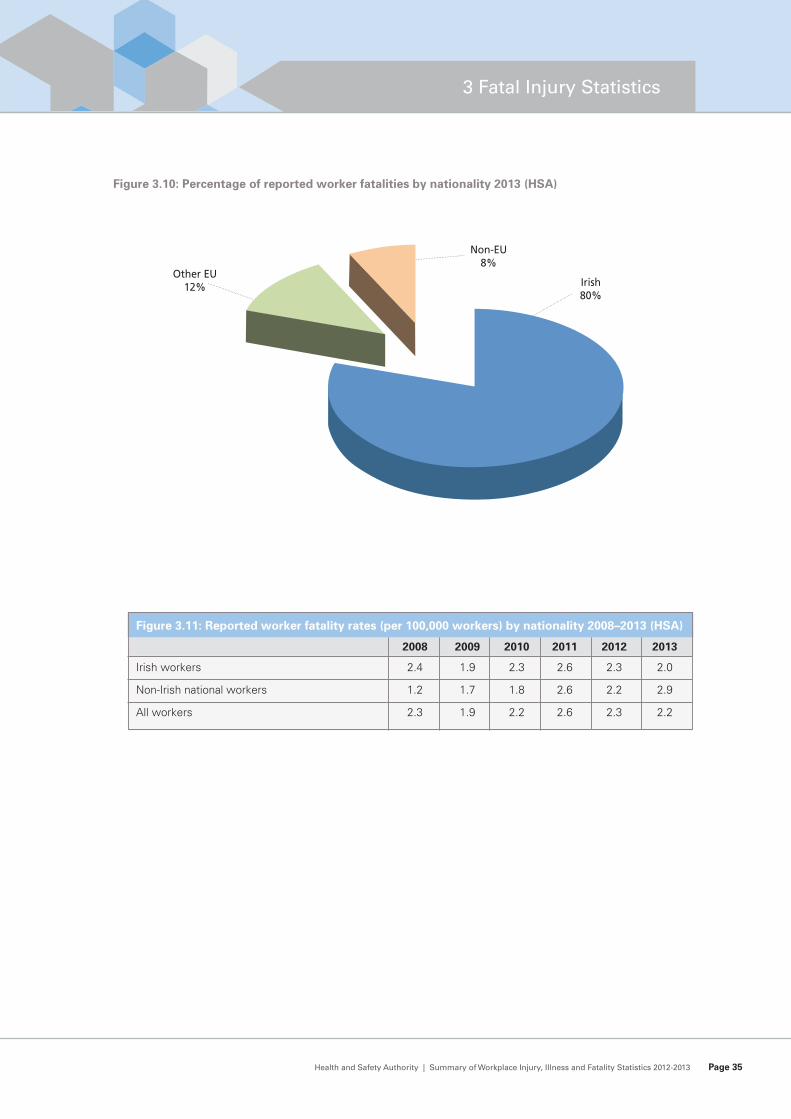
Figure 3.10: Percentage of reported worker fatalities by nationality 2013 (HSA)
Figure 3.11: Reported worker fatality rates (per 100,000 workers) by nationality 2008–2013 (HSA)
2008 2009 2010 2011 2012 2013
Irish workers 2.4 1.9 2.3 2.6 2.3 2.0
Non-Irish national workers 1.2 1.7 1.8 2.6 2.2 2.9
All workers 2.3 1.9 2.2 2.6 2.3 2.2
Irish80%
Non-EU8%
Other EU12%
Health and Safety Authority | Summary of Workplace Injury, Illness and Fatality Statistics 2012-2013 Page 35
3 Fatal Injury Statistics

Figure 3.13: Number of reported fatalities (worker and non-worker) by region 2008-2013 (HSA)
Year
2008 2009 2010 2011 2012 2013
Border 5 12 10 4 9 7
Midlands 3 2 4 4 6 4
West 5 1 5 5 6 7
Dublin 5 8 2 4 2 4
Mid-East 6 5 5 3 1 2
Mid-West 12 5 7 9 10 2
South-East 5 3 5 8 3 7
South-West 16 7 10 17 11 14
Total 57 43 48 54 48 47
Page 36 Health and Safety Authority | Summary of Workplace Injury, Illness and Fatality Statistics 2012-2013
Figure 3.12: Number of reported fatalities (worker and non-worker) by accident trigger 2013 (HSA
Number
Accident trigger unknown 4
Breakage of material at joints 1
Electrical problem - direct contact 2
Explosion 1
Fall from height 9
Fall on same level (slip, stumble etc) 1
Fall, collapse of material - from above 4
Loss of control of animal 1
Loss of control of means of transport or handling equipment 9
Loss of control of object being worked on 2
Other breakage/collapse related trigger 2
Other loss of control trigger 3
Other triggers not listed 8
Total 47
Border: Cavan, Donegal, Leitrim, Louth, Monaghan, Sligo.Midlands: Laois, Longford, Offaly, WestmeathWest: Galway, Mayo, RoscommonDublin: DublinMid-East: Kildare, Meath, WicklowMid-West: Clare, Limerick, Tipperary NorthSouth-East: Carlow, Kilkenny, Tipperary South, Waterford, WexfordSouth-West: Cork, Kerry
3 Fatal Injury Statistics
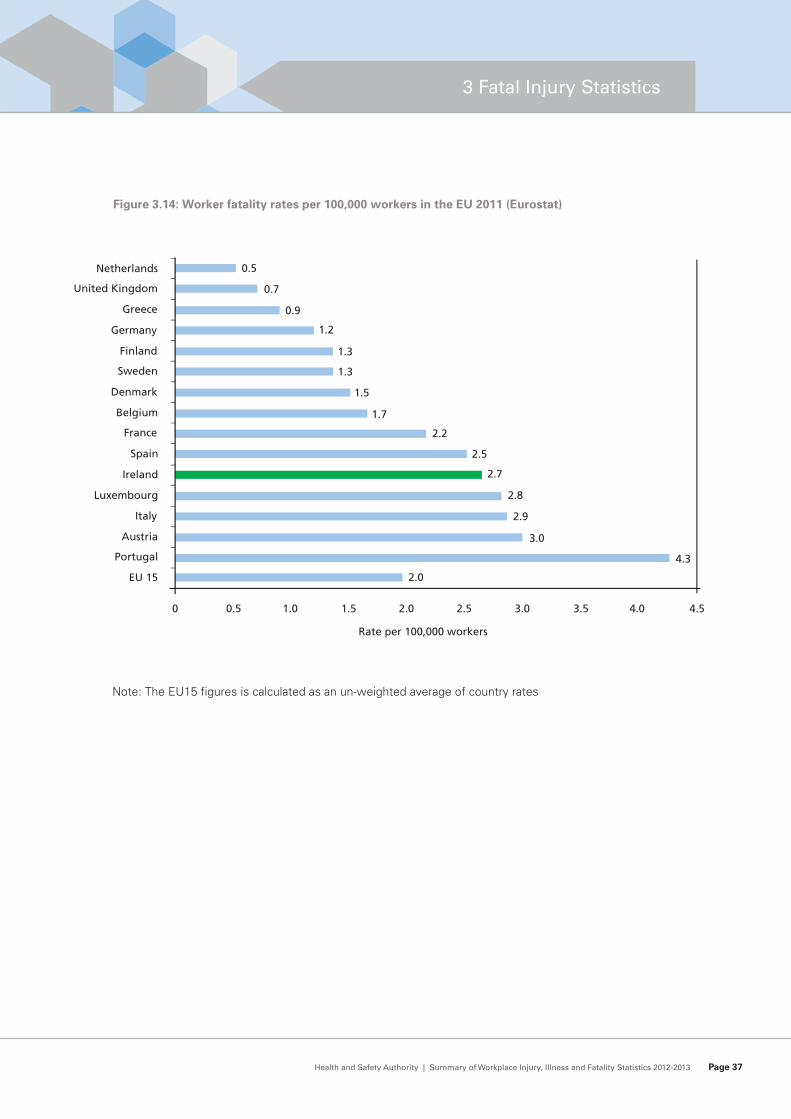
Figure 3.14: Worker fatality rates per 100,000 workers in the EU 2011 (Eurostat)
EU 15
Portugal
Austria
Greece
Spain
France
Italy
2.7
Denmark
Belgium
Ireland
Germany
Netherlands
Luxembourg
Rate per 100,000 workers
Sweden
Finland
United Kingdom
4.3
3.0
2.0
2.9
2.5
1.2
1.5
2.8
1.7
1.3
1.3
2.2
0.9
0.7
0.5
0 1.00.5 2.01.5 3.02.5 3.5 4.0 4.5
Note: The EU15 figures is calculated as an un-weighted average of country rates
Health and Safety Authority | Summary of Workplace Injury, Illness and Fatality Statistics 2012-2013 Page 37
3 Fatal Injury Statistics
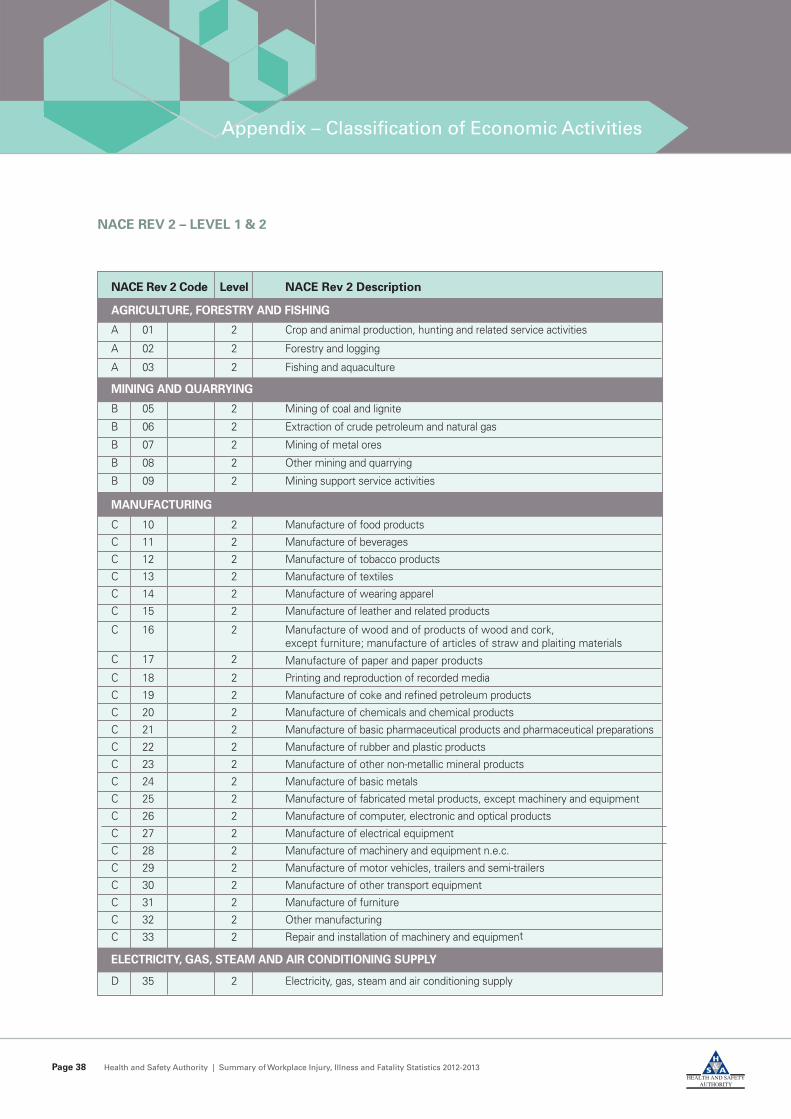
NACE Rev 2 Code Level NACE Rev 2 Description
AGRICULTURE, FORESTRY AND FISHING
A 01 2 Crop and animal production, hunting and related service activities
A 02 2 Forestry and logging
A 03 2 Fishing and aquaculture
MINING AND QUARRYING
B 05 2 Mining of coal and lignite
B 06 2 Extraction of crude petroleum and natural gas
B 07 2 Mining of metal ores
B 08 2 Other mining and quarrying
B 09 2 Mining support service activities
MANUFACTURING
C 10 2 Manufacture of food products
C 11 2 Manufacture of beverages
C 12 2 Manufacture of tobacco products
C 13 2 Manufacture of textiles
C 14 2 Manufacture of wearing apparel
C 15 2 Manufacture of leather and related products
C 16 2 Manufacture of wood and of products of wood and cork, except furniture; manufacture of articles of straw and plaiting materials
C 17 2 Manufacture of paper and paper products
C 18 2 Printing and reproduction of recorded media
C 19 2 Manufacture of coke and refined petroleum products
C 20 2 Manufacture of chemicals and chemical products
C 21 2 Manufacture of basic pharmaceutical products and pharmaceutical preparations
C 22 2 Manufacture of rubber and plastic products
C 23 2 Manufacture of other non-metallic mineral products
C 24 2 Manufacture of basic metals
C 25 2 Manufacture of fabricated metal products, except machinery and equipment
C 26 2 Manufacture of computer, electronic and optical products
C 27 2 Manufacture of electrical equipment
C 28 2 Manufacture of machinery and equipment n.e.c.
C 29 2 Manufacture of motor vehicles, trailers and semi-trailers
C 30 2 Manufacture of other transport equipment
C 31 2 Manufacture of furniture
C 32 2 Other manufacturing
C 33 2 Repair and installation of machinery and equipment
ELECTRICITY, GAS, STEAM AND AIR CONDITIONING SUPPLY
D 35 2 Electricity, gas, steam and air conditioning supply
NACE REV 2 – LEVEL 1 & 2
Page 38 Health and Safety Authority | Summary of Workplace Injury, Illness and Fatality Statistics 2012-2013
Appendix – Classification of Economic Activities
Health and Safety Authority | Summary of Workplace Injury, Illness and Fatality Statistics 2012-2013 Page 39
Appendix – Classification of Economic Activities
NACE Rev 2 Code Level NACE Rev 2 Description
WATER SUPPLY; SEWERAGE, WASTE MANAGEMENT AND REMEDIATION ACTIVITIES
E 36 2 Water collection, treatment and supply
E 37 2 Sewerage
E 38 2 Waste collection, treatment and disposal activities; materials recovery
E 39 2 Remediation activities and other waste management services
CONSTRUCTION
F 41 2 Construction of buildings
F 42 2 Civil engineering
F 43 2 Specialised construction activities
WHOLESALE AND RETAIL TRADE; REPAIR OF MOTOR VEHICLES AND MOTORCYCLES
G 45 2 Wholesale and retail trade and repair of motor vehicles and motorcycles
G 46 2 Wholesale trade, except of motor vehicles and motorcycles
G 47 2 Retail trade, except of motor vehicles and motorcycles
TRANSPORTATION AND STORAGE
H 49 2 Land transport and transport via pipelines
H 50 2 Water transport
H 51 2 Air transport
H 52 2 Warehousing and support activities for transportation
H 53 2 Postal and courier activities
ACCOMMODATION AND FOOD SERVICE ACTIVITIES
I 55 2 Accommodation
I 56 2 Food and beverage service activities
INFORMATION AND COMMUNICATION
J 58 2 Publishing activities
J 59 2 Motion picture, video and television programme production, sound recording and music publishing activities
J 60 2 Programming and broadcasting activities
J 61 2 Telecommunications
J 62 2 Computer programming, consultancy and related activities
J 63 2 Information service activities
FINANCIAL AND INSURANCE ACTIVITIES
K 64 2 Financial service activities, except insurance and pension funding
K 65 2 Insurance, reinsurance and pension funding, except compulsory social security
K 66 2 Activities auxiliary to financial services and insurance activities
REAL ESTATE ACTIVITIES
L 68 2 Real estate activities

Page 40 Health and Safety Authority | Summary of Workplace Injury, Illness and Fatality Statistics 2012-2013
Appendix – Classification of Economic Activities
NACE Rev 2 Code Level NACE Rev 2 Description
PROFESSIONAL, SCIENTIFIC AND TECHNICAL ACTIVITIES
M 69 2 Legal and accounting activities
M 70 2 Activities of head offices; management consultancy activities
M 71 2 Architectural and engineering activities; technical testing and analysis
M 72 2 Scientific research and development
M 73 2 Advertising and market research
M 74 2 Other professional, scientific and technical activities
M 75 2 Veterinary activities
ADMINISTRATIVE AND SUPPORT SERVICE ACTIVITIES
N 77 2 Rental and leasing activities
N 78 2 Employment activities
N 79 2 Travel agency, tour operator and other reservation service and related activities
N 80 2 Security and investigation activities
N 81 2 Services to buildings and landscape activities
N 82 2 Office administrative, office support and other business support activities
PUBLIC ADMINISTRATION AND DEFENCE; COMPULSORY SOCIAL SECURITY
O 84 2 Public administration and defence; compulsory social security
EDUCATION
P 85 2 Education
HUMAN HEALTH AND SOCIAL WORK ACTIVITIES
Q 86 2 Human health activities
Q 87 2 Residential care activities
Q 88 2 Social work activities without accommodation
ARTS, ENTERTAINMENT AND RECREATION
R 90 2 Creative, arts and entertainment activities
R 91 2 Libraries, archives, museums and other cultural activities
R 92 2 Gambling and betting activities
R 93 2 Sports activities and amusement and recreation activities
OTHER SERVICE ACTIVITIES
S 94 2 Activities of membership organisations
S 95 2 Repair of computers and personal and household goods
S 96 2 Other personal service activities
ACTIVITIES OF HOUSEHOLDS AS EMPLOYERS; UNDIFFERENTIATED GOODS - AND SERVICES - PRODUCING ACTIVITIES OF HOUSEHOLDS FOR OWN USE
T 97 2 Activities of households as employers of domestic personnel
T 98 2 Undifferentiated goods - and services-producing activities of private households for own use
ACTIVITIES OF EXTRA TERRITORIAL ORGANISATIONS AND BODIES
U 99 2 Activities of extraterritorial organisations and bodies
REFERENCES
Boone, J., van Ours, J.C., Wuellrich, J.-P. & Zweimuller, J. (2011) Recessions are bad for workplacesafety, IZA Discussion Paper Series, No. 5688.
CSO (2013) Quarterly National Household Survey, Quarter 3 2013, Statistical Release 26November 2013, Cork: Central Statistics Office
CSO (2014) Quarterly National Household Survey, Quarter 1 2014, Statistical Release 26 May2014, Cork: Central Statistics Office
Davis, R. & Jones, P. (2005) Trends and context to rates of workplace injury, Health and SafetyExecutive, UK Research Report 386.
Drummond, A. (2007) An Investigation into the official data sources and collection methodsused to capture work-related death statistics in the Republic of Ireland, Dublin: Department ofEnterprise, Trade and Employment and the Health and Safety Authority.
Eurostat (2001) European Statistics on Accidents at Work (ESAW) Methodology, 2001 Edition,Luxembourg: Eurostat.
Fairris, D. (1998) Institutional Change in Shop Floor Governance and the trajectory of Post-WarInjury Rates in US Manufacturing 1946-1970. Industrial and Labour Relations Review, 51(2),pp187-203.
Venema, A., van den Heuval, S. & Gueskens, G. (2009) Health and safety at work: Results ofthe Labour Force Survey 2007 ad hoc module on accidents at work and work-related healthproblems, Austria TNO.
Health and Safety Authority | Summary of Workplace Injury, Illness and Fatality Statistics 2012-2013 Page 41
References

ISBN No:978-1-84496-201-3 HSA0424
A country where worker safety, health
and welfare and the safe management
of chemicals are central to successful
enterprise