summary of uk sports rights - home - ofcom · summary of uk sports rights ... this document is...
TRANSCRIPT

Summary of UK sports rights Annex 10 to pay TV market investigation consultation
Publication date: 18 December 2007
Annex 10 to pay TV market investigation consultation – summary of UK sports rights
Annex 10
1 Summary of UK sports rights This annex contains an Ofcom-commissioned independent report produced by Spectrum Value Partners sets out an overview of the UK industry for television rights to sports content, including:
• Key sports rights bought and sold for distribution in the UK
• Relationships between broadcasters and rights holders in the UK
• The way rights have been sold in the UK
1
© Spectrum | Value Partners 2007. This document is confidential and intended solely for the use and information of the addressee
Final version
Sports Rights Review
15th November 2007
1© Spectrum | Value Partners 2007. This document is confidential and intended solely for the use and information of the addressee
Preface
• The aim of this report is to provide a factual summary of sports rights and how they are and have been sold in the UK
• The report profiles a selection of sports / events of significant importance to UK broadcasters and / or viewers- football: the Premier League, the FIFA World Cup, the UEFA Champions League, the FA Cup- other sports: the Olympic Games, cricket, rugby union, rugby league and Formula One
• We have also included shorter “case studies” on the Football League and the UEFA Cup. These have been included to highlight specific points
• For each sport / event, where the information has been available, we provide a summary of how the rights have been sold over the last two decades (including value, purchaser, duration, type of rights, regulatory interventions, listed event status)
• We also provide comments on: - how broadcasting rights affect upstream markets- broadcasters’ equity interests in sports organisations
• It should be noted that in many cases, values of rights deals are not released into the public domain by the relevant parties. Where “official” figures are lacking, the report uses a range of third party estimates which we have sourced appropriately. In cases where thirdparty estimates have been inconsistent, we have taken the value from the source that appears to be the most thorough and reliable. In cases where Spectrum Value Partners has access to relevant confidential information, we have not used this. Readers should be aware that, in the absence of official information, an element of uncertainty exists over deals
• Rights deals tend to be done in periods of 3-5 years, however, for purposes of comparison, we have averaged the value of any multi-year deals over the number of years of that deal in a constant fashion in order to obtain an annual value for the deal
• Our focus is on UK rights only. We have not assessed the international sports rights markets, either for international properties, such as the Olympic Games or for UK properties with overseas appeal, such as the Premier League
2© Spectrum | Value Partners 2007. This document is confidential and intended solely for the use and information of the addressee
Contents
Executive summary
Chapter 1 – Football
Chapter 2 – Olympic Games
Chapter 3 – Cricket
Chapter 4 – Rugby Union
Chapter 5 – Rugby League
Chapter 6 – Formula One
Appendix
3© Spectrum | Value Partners 2007. This document is confidential and intended solely for the use and information of the addressee
669
110 106 88 8555 52 40 29
~71
Premier League
FIFA World C
up2010
FA Cup &
England
Football League& C
arling Cup
UEFA
Cham
pionsLeague
2012 Summ
erO
lympics
UEFA European
Cham
pionships
English Cricket
Rugby SixN
ations
Formula O
ne
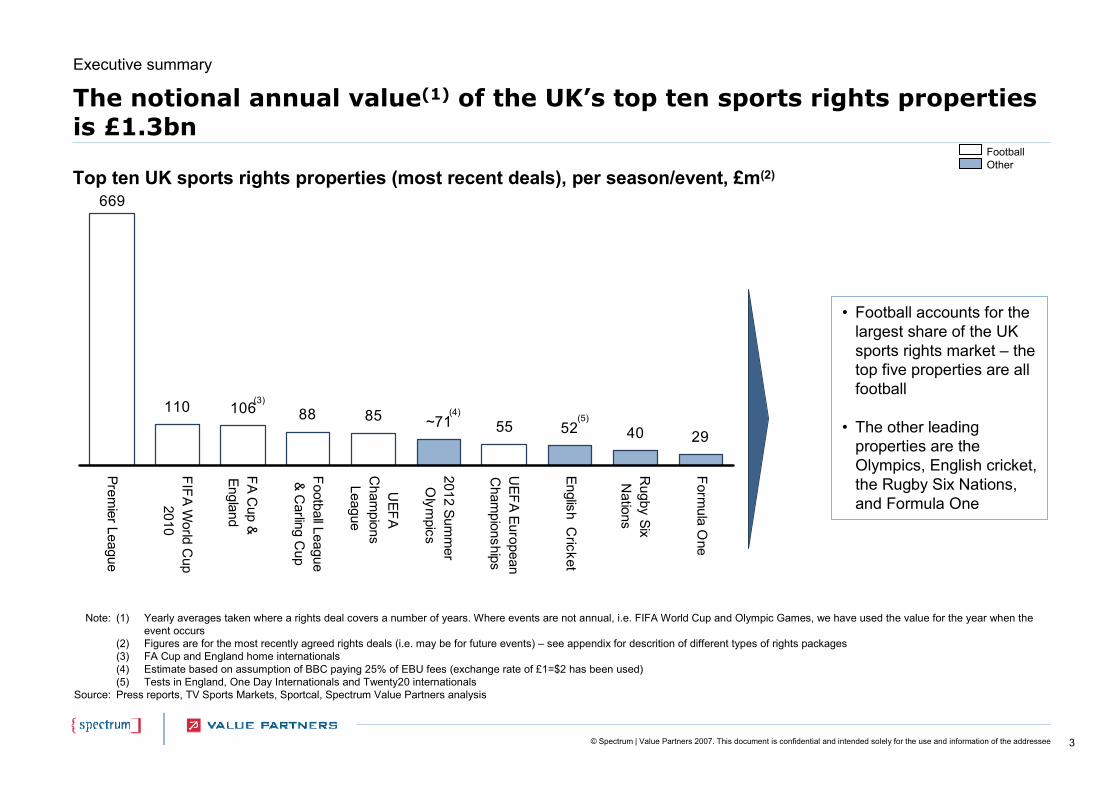
The notional annual value(1) of the UK’s top ten sports rights properties is £1.3bn
Top ten UK sports rights properties (most recent deals), per season/event, £m(2)
Executive summary
Note:
Source:
(1) Yearly averages taken where a rights deal covers a number of years. Where events are not annual, i.e. FIFA World Cup and Olympic Games, we have used the value for the year when the event occurs
(2) Figures are for the most recently agreed rights deals (i.e. may be for future events) – see appendix for descrition of different types of rights packages(3) FA Cup and England home internationals(4) Estimate based on assumption of BBC paying 25% of EBU fees (exchange rate of £1=$2 has been used)(5) Tests in England, One Day Internationals and Twenty20 internationalsPress reports, TV Sports Markets, Sportcal, Spectrum Value Partners analysis
• Football accounts for the largest share of the UK sports rights market – the top five properties are all football
• The other leading properties are the Olympics, English cricket, the Rugby Six Nations, and Formula One
(3)(4) (5)
FootballOther
4© Spectrum | Value Partners 2007. This document is confidential and intended solely for the use and information of the addressee
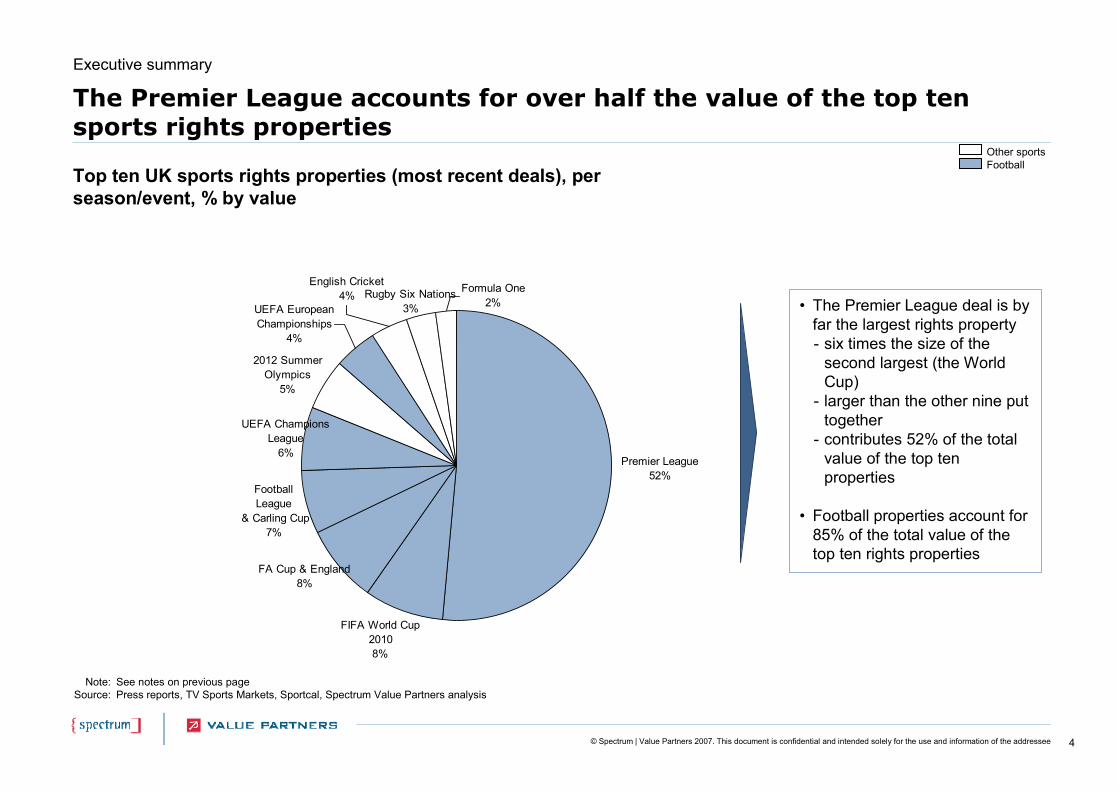
The Premier League accounts for over half the value of the top ten sports rights properties
Top ten UK sports rights properties (most recent deals), per season/event, % by value
Executive summary
Note:Source:
See notes on previous pagePress reports, TV Sports Markets, Sportcal, Spectrum Value Partners analysis
• The Premier League deal is by far the largest rights property- six times the size of the
second largest (the World Cup)
- larger than the other nine put together
- contributes 52% of the total value of the top ten properties
• Football properties account for 85% of the total value of the top ten rights properties
English Cricket4%
Formula One2%
Rugby Six Nations3%
2012 Summer Olympics
5%
UEFA European Championships
4%
UEFA ChampionsLeague
6%
FootballLeague
& Carling Cup7%
FA Cup & England 8%
FIFA World Cup 2010 8%
Premier League52%
Other sportsFootball
5© Spectrum | Value Partners 2007. This document is confidential and intended solely for the use and information of the addressee
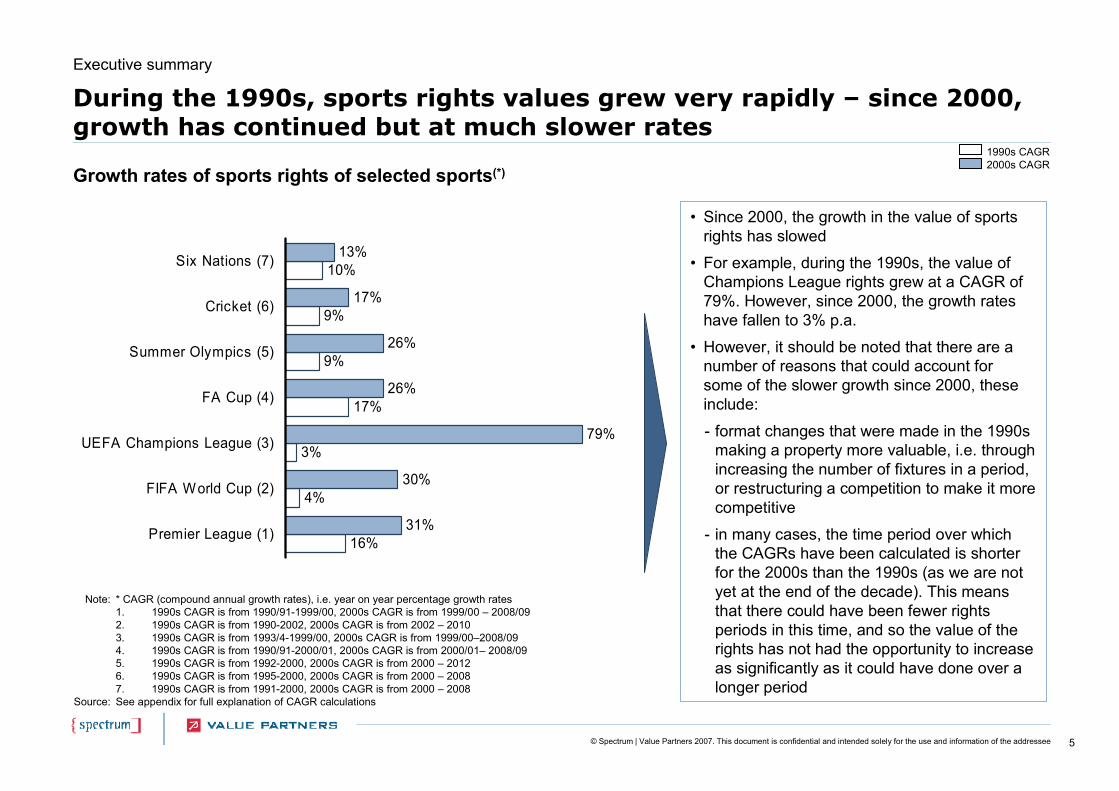
During the 1990s, sports rights values grew very rapidly – since 2000, growth has continued but at much slower rates
Growth rates of sports rights of selected sports(*)
Note:
Source:
* CAGR (compound annual growth rates), i.e. year on year percentage growth rates1. 1990s CAGR is from 1990/91-1999/00, 2000s CAGR is from 1999/00 – 2008/092. 1990s CAGR is from 1990-2002, 2000s CAGR is from 2002 – 20103. 1990s CAGR is from 1993/4-1999/00, 2000s CAGR is from 1999/00–2008/094. 1990s CAGR is from 1990/91-2000/01, 2000s CAGR is from 2000/01– 2008/095. 1990s CAGR is from 1992-2000, 2000s CAGR is from 2000 – 20126. 1990s CAGR is from 1995-2000, 2000s CAGR is from 2000 – 20087. 1990s CAGR is from 1991-2000, 2000s CAGR is from 2000 – 2008See appendix for full explanation of CAGR calculations
• Since 2000, the growth in the value of sports rights has slowed
• For example, during the 1990s, the value of Champions League rights grew at a CAGR of 79%. However, since 2000, the growth rates have fallen to 3% p.a.
• However, it should be noted that there are a number of reasons that could account for some of the slower growth since 2000, these include:
- format changes that were made in the 1990s making a property more valuable, i.e. through increasing the number of fixtures in a period, or restructuring a competition to make it more competitive
- in many cases, the time period over which the CAGRs have been calculated is shorter for the 2000s than the 1990s (as we are not yet at the end of the decade). This means that there could have been fewer rights periods in this time, and so the value of the rights has not had the opportunity to increase as significantly as it could have done over a longer period
Executive summary
16%
4%
3%
17%
9%
9%
10%
31%
30%
79%
26%
26%
17%
13%
Premier League (1)
FIFA World Cup (2)
UEFA Champions League (3)
FA Cup (4)
Summer Olympics (5)
Cricket (6)
Six Nations (7)
1990s CAGR2000s CAGR
6© Spectrum | Value Partners 2007. This document is confidential and intended solely for the use and information of the addressee
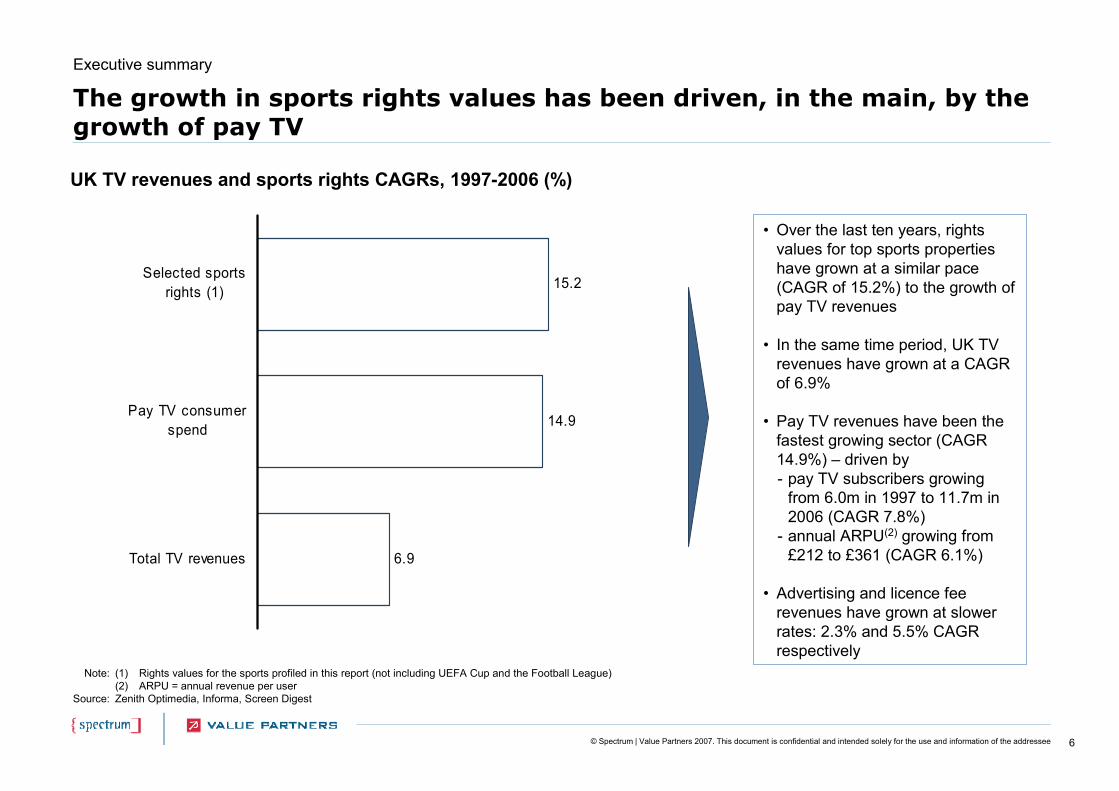
The growth in sports rights values has been driven, in the main, by the growth of pay TV
UK TV revenues and sports rights CAGRs, 1997-2006 (%)
Note:
Source:
• Over the last ten years, rights values for top sports properties have grown at a similar pace (CAGR of 15.2%) to the growth of pay TV revenues
• In the same time period, UK TV revenues have grown at a CAGR of 6.9%
• Pay TV revenues have been the fastest growing sector (CAGR 14.9%) – driven by- pay TV subscribers growing
from 6.0m in 1997 to 11.7m in 2006 (CAGR 7.8%)
- annual ARPU(2) growing from £212 to £361 (CAGR 6.1%)
• Advertising and licence fee revenues have grown at slower rates: 2.3% and 5.5% CAGR respectively
(1) Rights values for the sports profiled in this report (not including UEFA Cup and the Football League)(2) ARPU = annual revenue per userZenith Optimedia, Informa, Screen Digest
Executive summary
6.9
14.9
15.2
Total TV revenues
Pay TV consumerspend
Selected sportsrights (1)

7© Spectrum | Value Partners 2007. This document is confidential and intended solely for the use and information of the addressee
The emergence of pay TV has made possible a dramatic increase in the volume of sport on TV and encouraged widespread innovation
• Premier League football: 138 live matches were broadcast in 2006/07, compared to only 15 First Division matches in 1988/89-1991/92
• Champions League football: all 125 matches are now available live. In group stages, all eight games on match days are available (either on ITV and its digital channels or on Sky via its channels or via red button interactivity)
• Rugby League and Rugby Union: significantly increased coverage of club matches• Wide selection of overseas sport, including England’s overseas cricket tours (shown
live for the first time on Sky), European football (Italian and Spanish leagues)
Examples of increases in the volume of sport on TV• Over the last twenty years, the
volume of sport available on TV has increased dramatically –largely because increased capacity allows entire channels to be dedicated to sport
• The growth of pay TV has also encouraged a wide range of innovation in sports coverage –as the level of competition between broadcasters (both pay and FTA) has intensified
• Much of this innovation has been led by Sky Sports, who have been keen to differentiate themselves from the established terrestrial players, i.e. the BBC and ITV
• Other broadcasters have responded to the changes and made innovations of their own
• Red button interactivity: allowing viewers to choose which game they would like to watch or via which camera (e.g. Sky’s Football First, BBC Wimbledon and Olympics coverage)
• Technological innovation: Hawkeye, Snickometer (Cricket - Channel 4), enhanced 3D graphics (Six Nations - BBC, Premiership Football – Sky), high definition sports channels (Sky Sports HD – Sky)
• “Spin-off” programmes: sport themed news and magazine series, such as The Rugby Club, Soccer AM, Soccer Saturday
Examples of innovation in sports coverage
Executive summary
8© Spectrum | Value Partners 2007. This document is confidential and intended solely for the use and information of the addressee
Source: Spectrum Value Partners analysis, Press reports, Sportcal
Formula 1
Six Nations and Cricket
Wimbledon
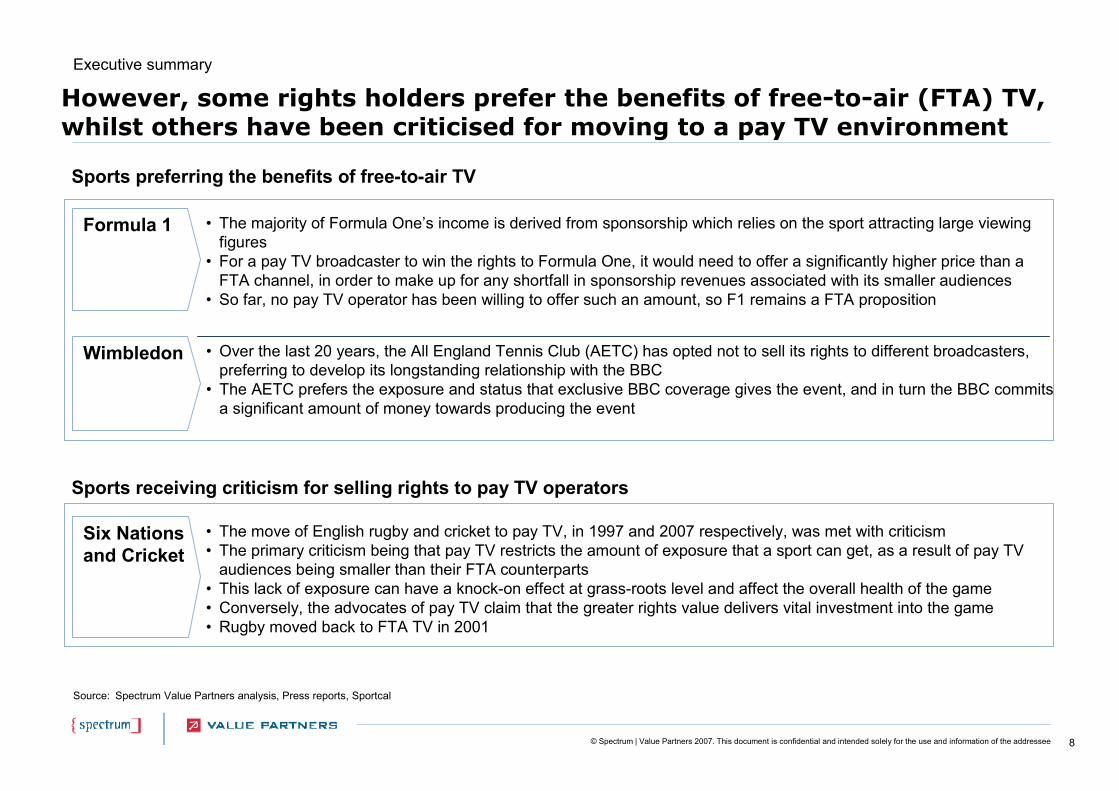
• The majority of Formula One’s income is derived from sponsorship which relies on the sport attracting large viewing figures
• For a pay TV broadcaster to win the rights to Formula One, it would need to offer a significantly higher price than a FTA channel, in order to make up for any shortfall in sponsorship revenues associated with its smaller audiences
• So far, no pay TV operator has been willing to offer such an amount, so F1 remains a FTA proposition
• The move of English rugby and cricket to pay TV, in 1997 and 2007 respectively, was met with criticism • The primary criticism being that pay TV restricts the amount of exposure that a sport can get, as a result of pay TV
audiences being smaller than their FTA counterparts• This lack of exposure can have a knock-on effect at grass-roots level and affect the overall health of the game• Conversely, the advocates of pay TV claim that the greater rights value delivers vital investment into the game• Rugby moved back to FTA TV in 2001
• Over the last 20 years, the All England Tennis Club (AETC) has opted not to sell its rights to different broadcasters, preferring to develop its longstanding relationship with the BBC
• The AETC prefers the exposure and status that exclusive BBC coverage gives the event, and in turn the BBC commits a significant amount of money towards producing the event
Sports preferring the benefits of free-to-air TV
However, some rights holders prefer the benefits of free-to-air (FTA) TV, whilst others have been criticised for moving to a pay TV environment
Executive summary
Sports receiving criticism for selling rights to pay TV operators
9© Spectrum | Value Partners 2007. This document is confidential and intended solely for the use and information of the addressee
Source: Spectrum Value Partners analysis, Press reports, Sportcal
Football League
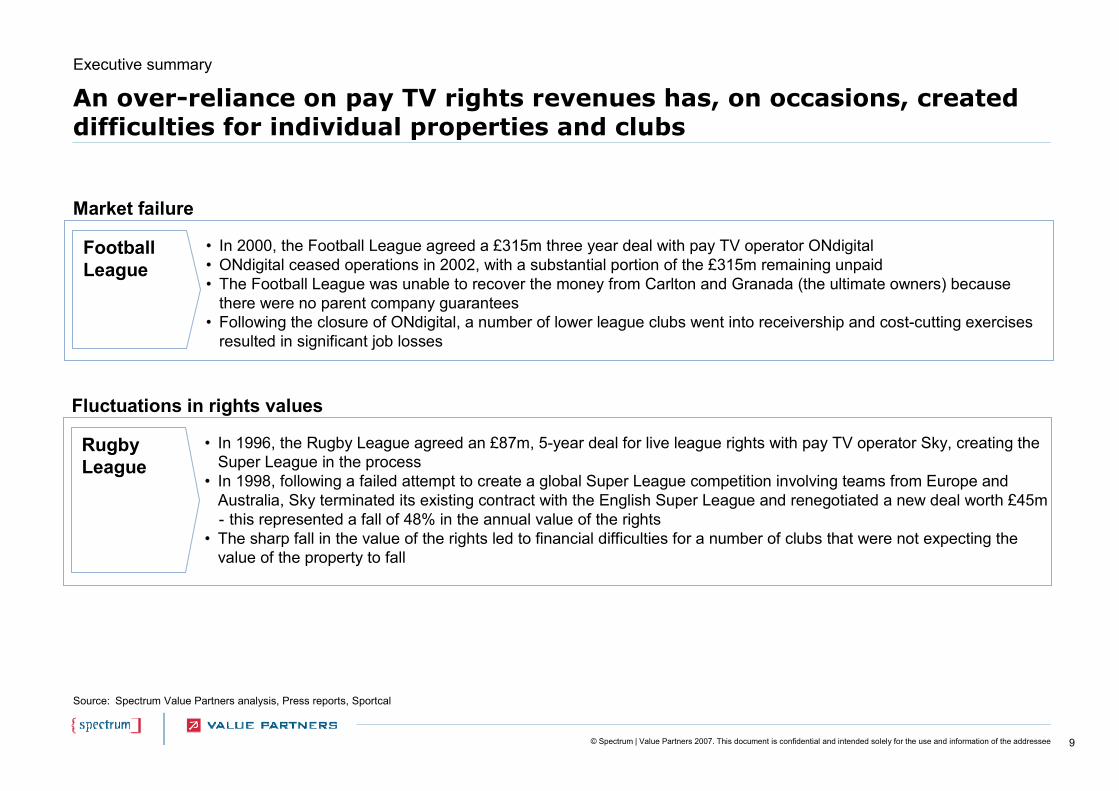
• In 2000, the Football League agreed a £315m three year deal with pay TV operator ONdigital • ONdigital ceased operations in 2002, with a substantial portion of the £315m remaining unpaid• The Football League was unable to recover the money from Carlton and Granada (the ultimate owners) because
there were no parent company guarantees• Following the closure of ONdigital, a number of lower league clubs went into receivership and cost-cutting exercises
resulted in significant job losses
Market failure
An over-reliance on pay TV rights revenues has, on occasions, created difficulties for individual properties and clubs
Executive summary
Rugby League
• In 1996, the Rugby League agreed an £87m, 5-year deal for live league rights with pay TV operator Sky, creating the Super League in the process
• In 1998, following a failed attempt to create a global Super League competition involving teams from Europe and Australia, Sky terminated its existing contract with the English Super League and renegotiated a new deal worth £45m- this represented a fall of 48% in the annual value of the rights
• The sharp fall in the value of the rights led to financial difficulties for a number of clubs that were not expecting the value of the property to fall
Fluctuations in rights values
10© Spectrum | Value Partners 2007. This document is confidential and intended solely for the use and information of the addressee
Source: Annual Review of Football Finance 2007, Deloitte; Spectrum Value Partners analysis
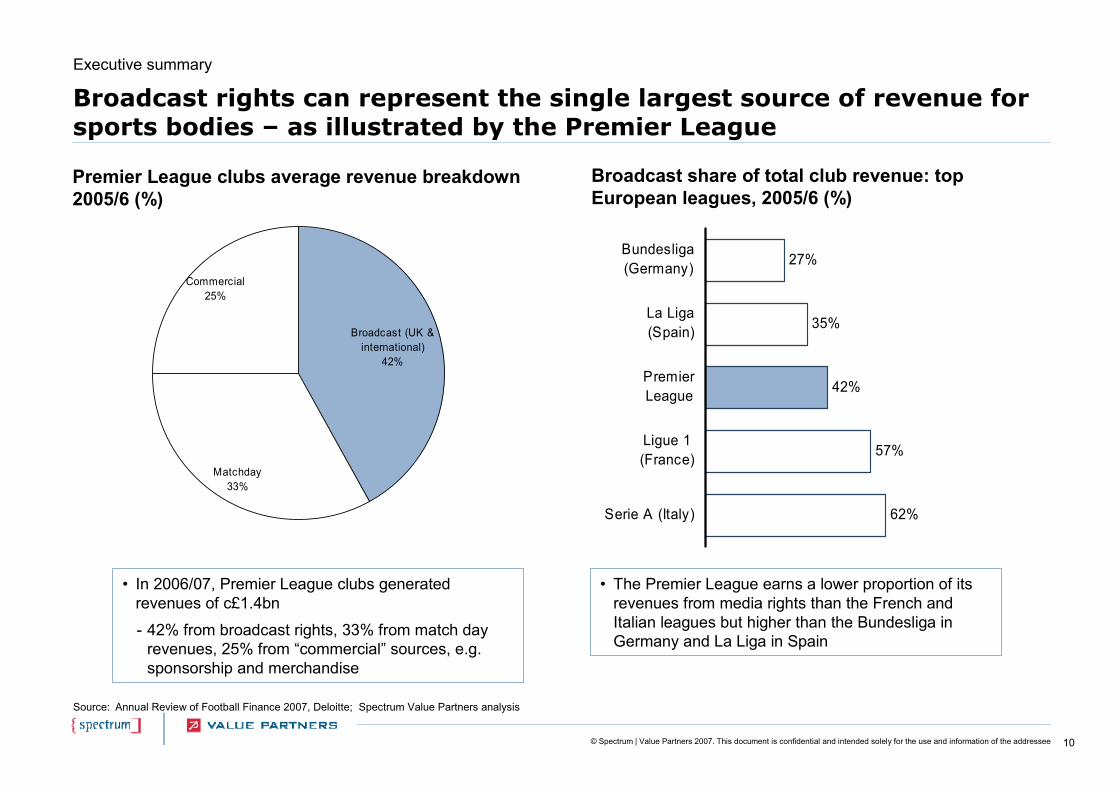
Broadcast rights can represent the single largest source of revenue for sports bodies – as illustrated by the Premier League
Premier League clubs average revenue breakdown 2005/6 (%)
Executive summary
Broadcast (UK & international)
42%
Matchday33%
Commercial25%
• In 2006/07, Premier League clubs generated revenues of c£1.4bn
- 42% from broadcast rights, 33% from match day revenues, 25% from “commercial” sources, e.g. sponsorship and merchandise
• The Premier League earns a lower proportion of its revenues from media rights than the French and Italian leagues but higher than the Bundesliga in Germany and La Liga in Spain
Broadcast share of total club revenue: top European leagues, 2005/6 (%)
62%
57%
42%
35%
27%
Serie A (Italy)
Ligue 1(France)
PremierLeague
La Liga(Spain)
Bundesliga(Germany)
11© Spectrum | Value Partners 2007. This document is confidential and intended solely for the use and information of the addressee
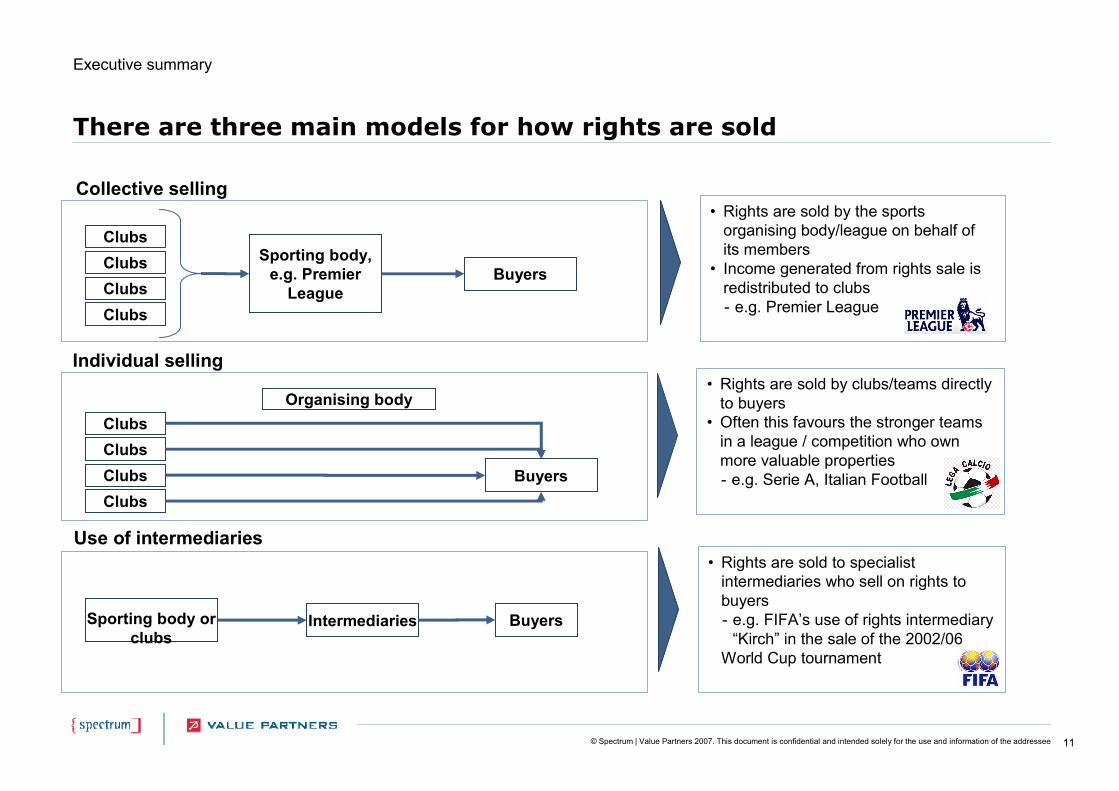
There are three main models for how rights are sold
Clubs
BuyersSporting body,
e.g. Premier League
Collective selling
ClubsClubsClubs
• Rights are sold by the sports organising body/league on behalf of its members
• Income generated from rights sale is redistributed to clubs- e.g. Premier League
Clubs
Buyers
Individual selling
ClubsClubsClubs
• Rights are sold by clubs/teams directly to buyers
• Often this favours the stronger teams in a league / competition who own more valuable properties- e.g. Serie A, Italian Football
Buyers
Use of intermediaries• Rights are sold to specialist
intermediaries who sell on rights to buyers- e.g. FIFA’s use of rights intermediary
“Kirch” in the sale of the 2002/06 World Cup tournament
Intermediaries
Executive summary
Sporting body or clubs
Organising body
12© Spectrum | Value Partners 2007. This document is confidential and intended solely for the use and information of the addressee
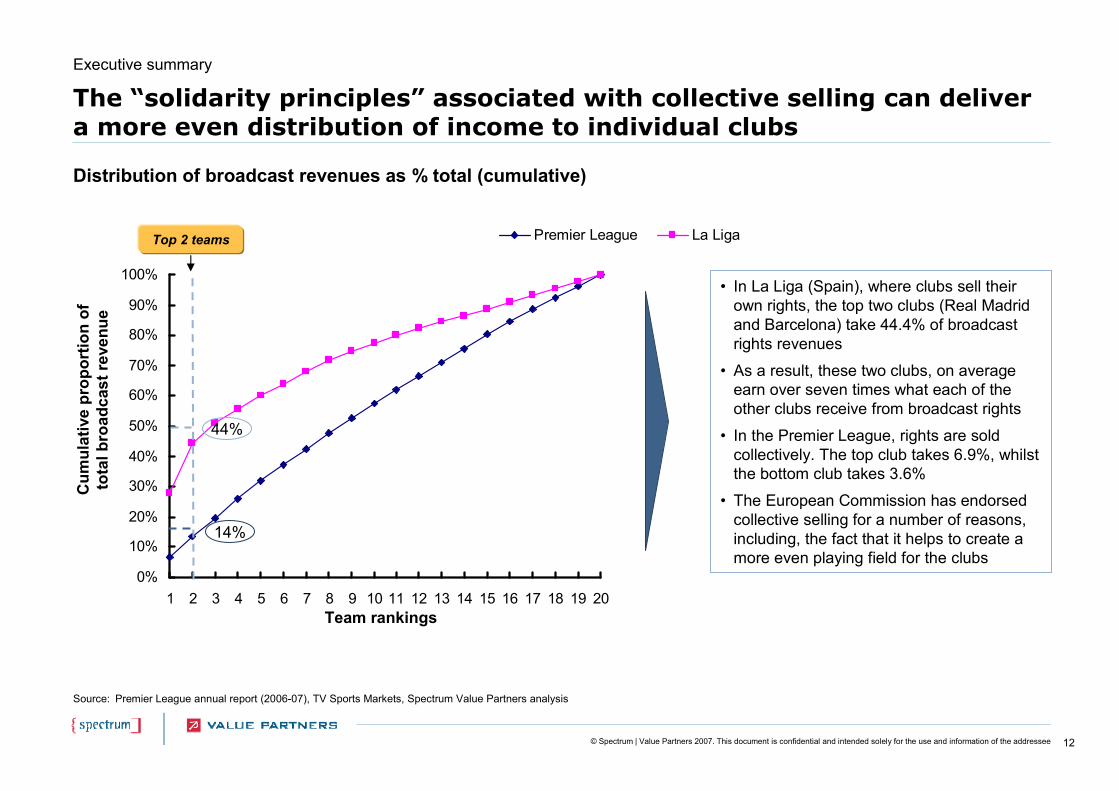
The “solidarity principles” associated with collective selling can deliver a more even distribution of income to individual clubs
Distribution of broadcast revenues as % total (cumulative)
Source: Premier League annual report (2006-07), TV Sports Markets, Spectrum Value Partners analysis
0%
10%
20%
30%
40%
50%
60%
70%
80%
90%
100%
1 2 3 4 5 6 7 8 9 10 11 12 13 14 15 16 17 18 19 20
Premier League La Liga
• In La Liga (Spain), where clubs sell their own rights, the top two clubs (Real Madrid and Barcelona) take 44.4% of broadcast rights revenues
• As a result, these two clubs, on average earn over seven times what each of the other clubs receive from broadcast rights
• In the Premier League, rights are sold collectively. The top club takes 6.9%, whilst the bottom club takes 3.6%
• The European Commission has endorsed collective selling for a number of reasons, including, the fact that it helps to create a more even playing field for the clubs
14%
44%
Team rankings
Cum
ulat
ive
prop
ortio
n of
to
tal b
road
cast
reve
nue
Executive summary
Top 2 teams
13© Spectrum | Value Partners 2007. This document is confidential and intended solely for the use and information of the addressee
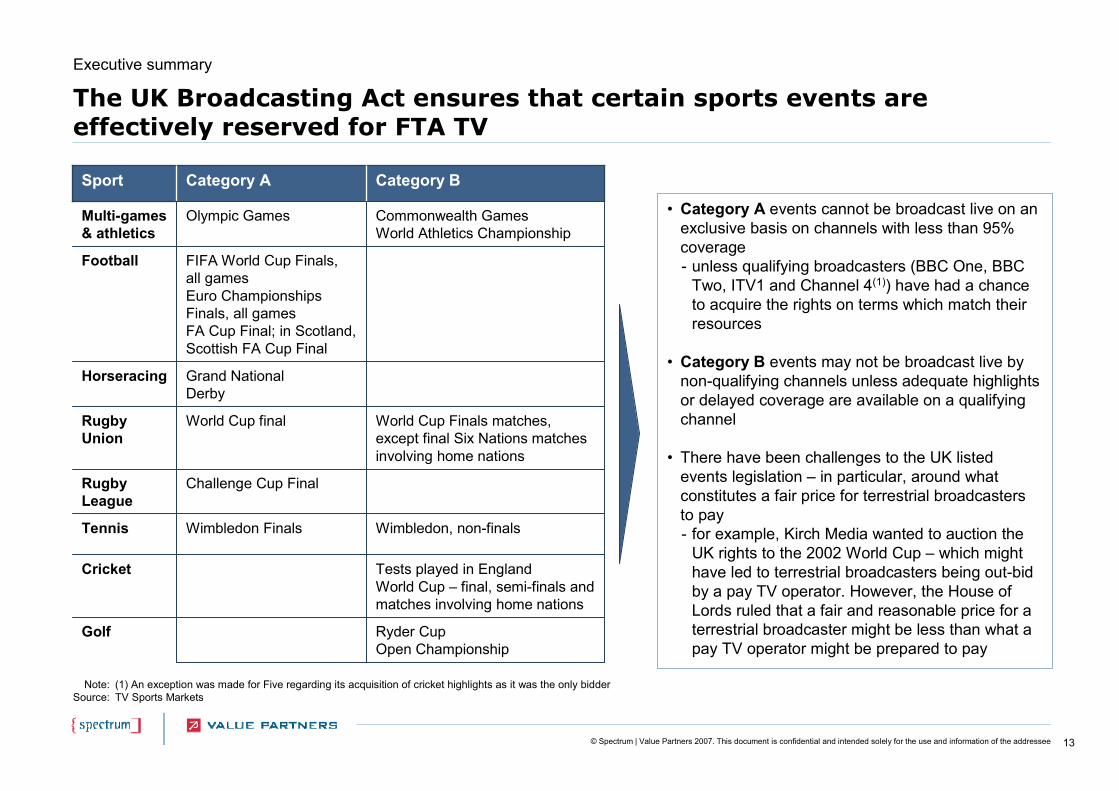
The UK Broadcasting Act ensures that certain sports events are effectively reserved for FTA TV
Wimbledon Finals
Challenge Cup Final
World Cup final
Grand NationalDerby
FIFA World Cup Finals, all gamesEuro Championships Finals, all gamesFA Cup Final; in Scotland, Scottish FA Cup Final
Olympic Games
Category A
Wimbledon, non-finals Tennis
Tests played in EnglandWorld Cup – final, semi-finals and matches involving home nations
Cricket
Ryder CupOpen Championship
Golf
Commonwealth GamesWorld Athletics Championship
Multi-games& athletics
Football
Horseracing
World Cup Finals matches, except final Six Nations matches involving home nations
RugbyUnion
Category B
RugbyLeague
Sport
• Category A events cannot be broadcast live on an exclusive basis on channels with less than 95% coverage- unless qualifying broadcasters (BBC One, BBC
Two, ITV1 and Channel 4(1)) have had a chance to acquire the rights on terms which match their resources
• Category B events may not be broadcast live by non-qualifying channels unless adequate highlights or delayed coverage are available on a qualifying channel
• There have been challenges to the UK listed events legislation – in particular, around what constitutes a fair price for terrestrial broadcasters to pay- for example, Kirch Media wanted to auction the
UK rights to the 2002 World Cup – which might have led to terrestrial broadcasters being out-bid by a pay TV operator. However, the House of Lords ruled that a fair and reasonable price for a terrestrial broadcaster might be less than what a pay TV operator might be prepared to pay
Note:Source:
(1) An exception was made for Five regarding its acquisition of cricket highlights as it was the only bidderTV Sports Markets
Executive summary
14© Spectrum | Value Partners 2007. This document is confidential and intended solely for the use and information of the addressee
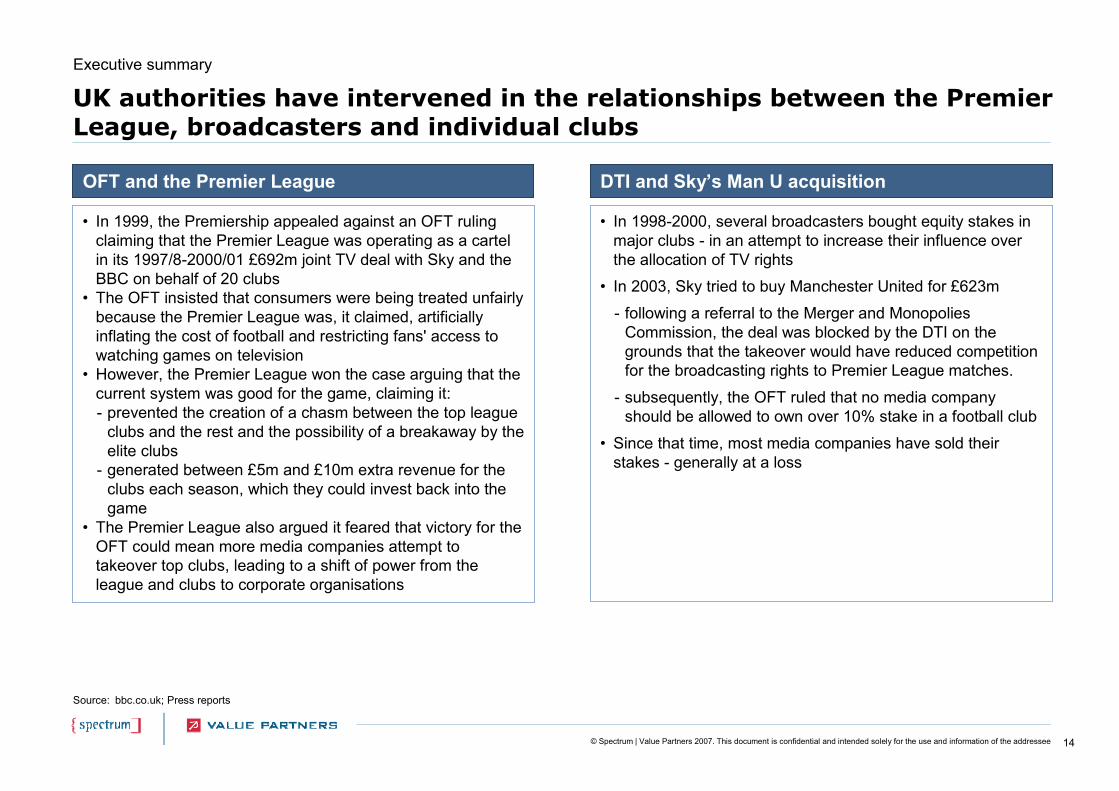
UK authorities have intervened in the relationships between the Premier League, broadcasters and individual clubs
Source: bbc.co.uk; Press reports
• In 1999, the Premiership appealed against an OFT ruling claiming that the Premier League was operating as a cartel in its 1997/8-2000/01 £692m joint TV deal with Sky and the BBC on behalf of 20 clubs
• The OFT insisted that consumers were being treated unfairly because the Premier League was, it claimed, artificially inflating the cost of football and restricting fans' access to watching games on television
• However, the Premier League won the case arguing that the current system was good for the game, claiming it:- prevented the creation of a chasm between the top league
clubs and the rest and the possibility of a breakaway by the elite clubs
- generated between £5m and £10m extra revenue for the clubs each season, which they could invest back into the game
• The Premier League also argued it feared that victory for the OFT could mean more media companies attempt to takeover top clubs, leading to a shift of power from the league and clubs to corporate organisations
OFT and the Premier League
Executive summary
• In 1998-2000, several broadcasters bought equity stakes in major clubs - in an attempt to increase their influence over the allocation of TV rights
• In 2003, Sky tried to buy Manchester United for £623m
- following a referral to the Merger and Monopolies Commission, the deal was blocked by the DTI on the grounds that the takeover would have reduced competition for the broadcasting rights to Premier League matches.
- subsequently, the OFT ruled that no media company should be allowed to own over 10% stake in a football club
• Since that time, most media companies have sold their stakes - generally at a loss
DTI and Sky’s Man U acquisition
15© Spectrum | Value Partners 2007. This document is confidential and intended solely for the use and information of the addressee
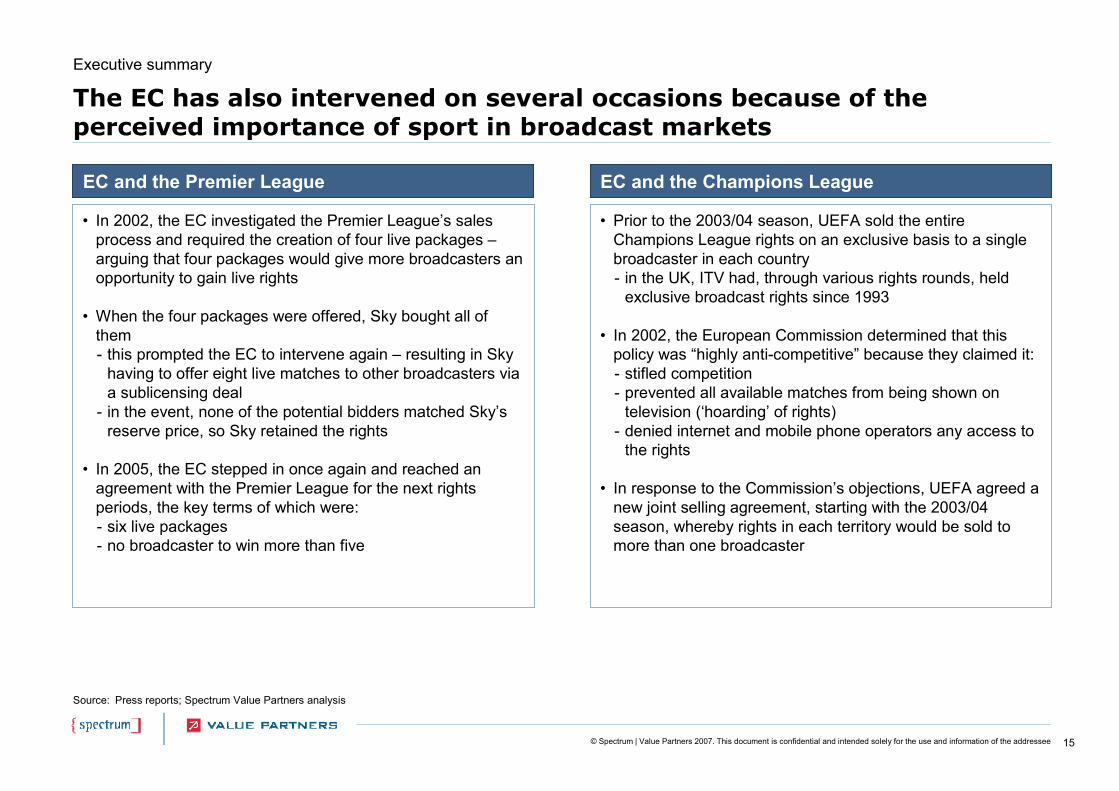
The EC has also intervened on several occasions because of the perceived importance of sport in broadcast markets
Source: Press reports; Spectrum Value Partners analysis
• In 2002, the EC investigated the Premier League’s sales process and required the creation of four live packages –arguing that four packages would give more broadcasters an opportunity to gain live rights
• When the four packages were offered, Sky bought all of them - this prompted the EC to intervene again – resulting in Sky
having to offer eight live matches to other broadcasters via a sublicensing deal
- in the event, none of the potential bidders matched Sky’s reserve price, so Sky retained the rights
• In 2005, the EC stepped in once again and reached an agreement with the Premier League for the next rights periods, the key terms of which were:- six live packages- no broadcaster to win more than five
EC and the Premier League
• Prior to the 2003/04 season, UEFA sold the entire Champions League rights on an exclusive basis to a single broadcaster in each country - in the UK, ITV had, through various rights rounds, held
exclusive broadcast rights since 1993
• In 2002, the European Commission determined that this policy was “highly anti-competitive” because they claimed it:- stifled competition- prevented all available matches from being shown on
television (‘hoarding’ of rights)- denied internet and mobile phone operators any access to
the rights
• In response to the Commission’s objections, UEFA agreed a new joint selling agreement, starting with the 2003/04 season, whereby rights in each territory would be sold to more than one broadcaster
EC and the Champions League
Executive summary
16© Spectrum | Value Partners 2007. This document is confidential and intended solely for the use and information of the addressee
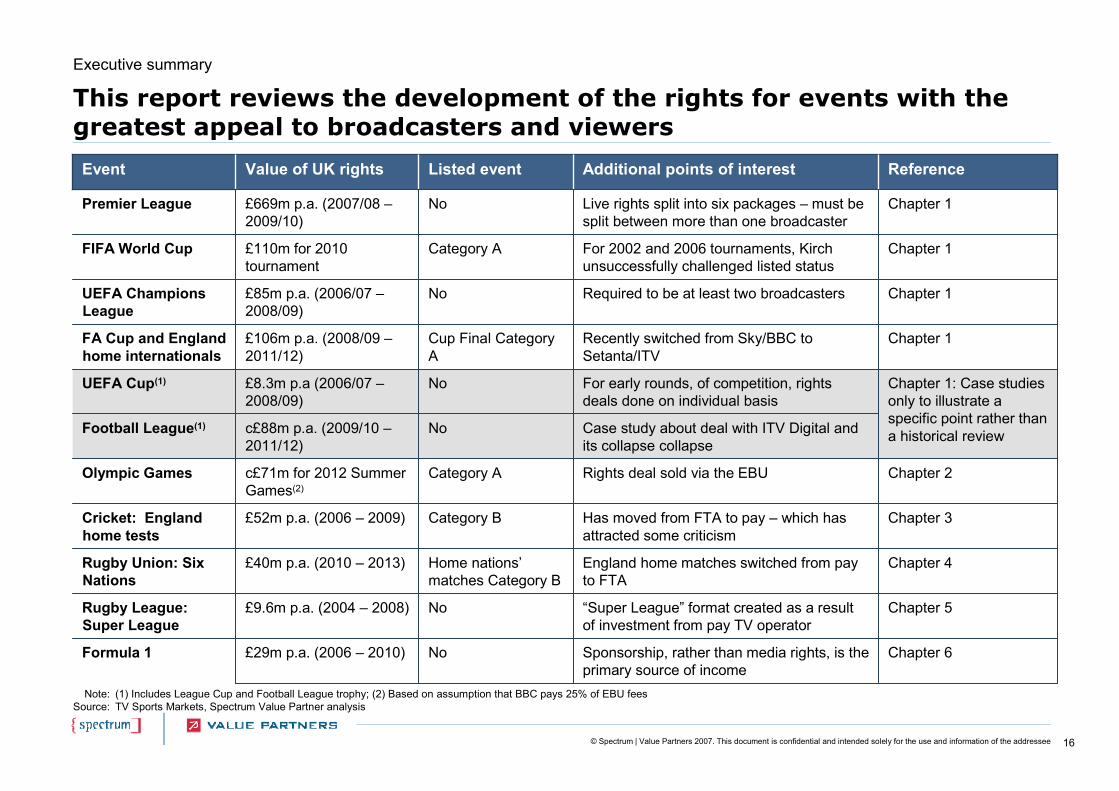
This report reviews the development of the rights for events with the greatest appeal to broadcasters and viewers
Sponsorship, rather than media rights, is the primary source of income
“Super League” format created as a result of investment from pay TV operator
England home matches switched from pay to FTA
Has moved from FTA to pay – which has attracted some criticism
Rights deal sold via the EBU
Case study about deal with ITV Digital and its collapse collapse
For early rounds, of competition, rights deals done on individual basis
Recently switched from Sky/BBC to Setanta/ITV
Required to be at least two broadcasters
For 2002 and 2006 tournaments, Kirch unsuccessfully challenged listed status
Live rights split into six packages – must be split between more than one broadcaster
Additional points of interest
Chapter 6
Chapter 5
Chapter 4
Chapter 3
Chapter 2
Chapter 1: Case studies only to illustrate a specific point rather than a historical review
Chapter 1
Chapter 1
Chapter 1
Chapter 1
Reference
Home nations’matches Category B
£40m p.a. (2010 – 2013)Rugby Union: Six Nations
No£9.6m p.a. (2004 – 2008)Rugby League: Super League
Category B£52m p.a. (2006 – 2009)Cricket: England home tests
No£29m p.a. (2006 – 2010)Formula 1
Noc£88m p.a. (2009/10 –2011/12)
Football League(1)
Category Ac£71m for 2012 Summer Games(2)
Olympic Games
No£669m p.a. (2007/08 –2009/10)
Premier League
Category A£110m for 2010 tournament
FIFA World Cup
No£85m p.a. (2006/07 –2008/09)
UEFA Champions League
Cup Final Category A
£106m p.a. (2008/09 –2011/12)
FA Cup and England home internationals
No
Listed event
£8.3m p.a (2006/07 –2008/09)
Value of UK rights
UEFA Cup(1)
Event
Note:Source:
(1) Includes League Cup and Football League trophy; (2) Based on assumption that BBC pays 25% of EBU feesTV Sports Markets, Spectrum Value Partner analysis
Executive summary

17© Spectrum | Value Partners 2007. This document is confidential and intended solely for the use and information of the addressee
Chapter 1 – Football
Chapter 1 - Football
• Premier League
• FIFA World Cup
• UEFA Champions League
• FA Cup and Home Internationals
• UEFA Cup - Case Study
• Football League - Case Study

18© Spectrum | Value Partners 2007. This document is confidential and intended solely for the use and information of the addressee
The clubs own the rights, but give the Premier League a mandate to license these rights centrally to potential buyers
• The fundamental process governing the ownership and licensing of the rights has been in place since 1994 - it has changed only marginally since this time- the Premier League is a Company Limited by Guarantee
whose shareholders are the Premier League clubs (changing every season)
- the clubs are the owners of the rights but agree that the Premier League licenses their rights collectively
- the rights ownership and licensing is governed by the Premier League constitution, any change in this needs to be approved by two thirds of the clubs
• Some of the rights are utilised directly by clubs- the club licence agreement defines which rights may be
used- after midnight on the Sunday of the football weekend, the
rights go back to the clubs to use on their own TV channels non-exclusively and after midnight on Monday, for use on their web sites
- the clubs are not allowed to sell these rights to third parties
Rights ownership and Premier League’s role
Chapter 1 – Football: Premier League
Source: Spectrum Value Partners analysis
Ceding of live coverage
rights
ClubsLicensees
(media companies)
Premier League
Collective rights sales
Clubs can exploit some non-live rights themselves
Consumers
Flow of rights
Legend
19© Spectrum | Value Partners 2007. This document is confidential and intended solely for the use and information of the addressee
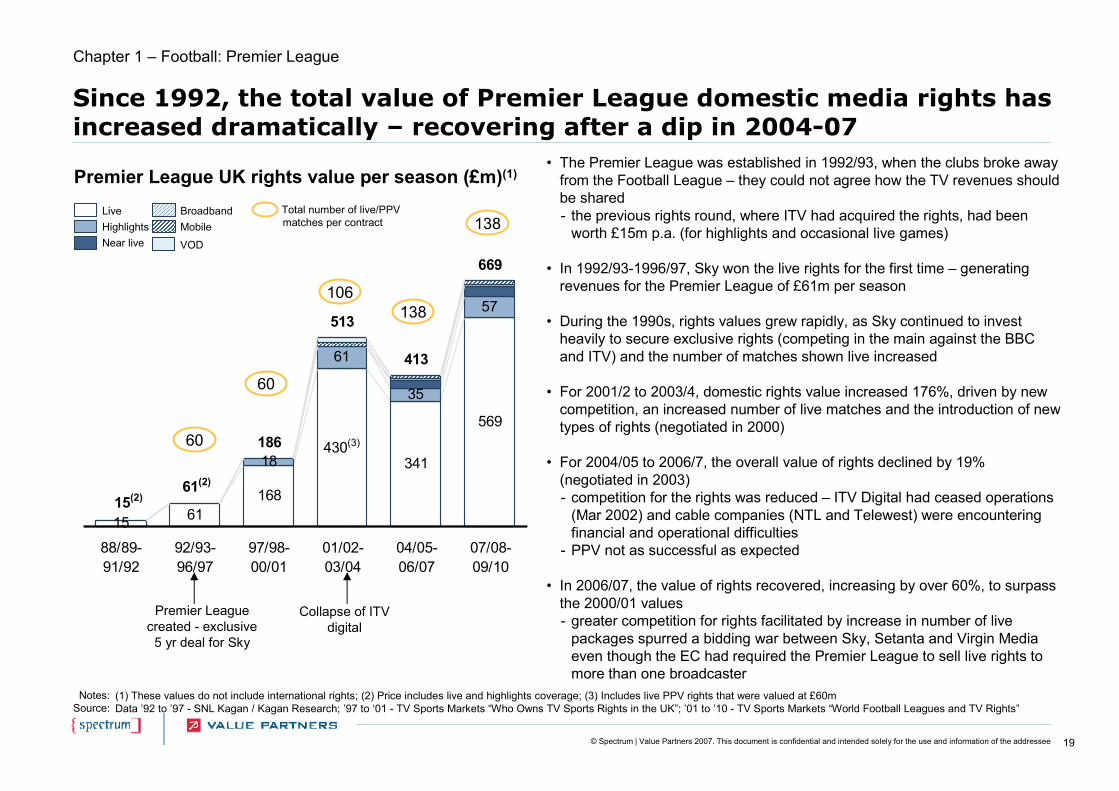
Since 1992, the total value of Premier League domestic media rights has increased dramatically – recovering after a dip in 2004-07
Premier League UK rights value per season (£m)(1)
Notes:Source:
(1) These values do not include international rights; (2) Price includes live and highlights coverage; (3) Includes live PPV rights that were valued at £60mData ’92 to ’97 - SNL Kagan / Kagan Research; ’97 to ‘01 - TV Sports Markets “Who Owns TV Sports Rights in the UK”; ’01 to ’10 - TV Sports Markets “World Football Leagues and TV Rights”
15 61
341
569
18
61
35
57
186
513
413
669
168
430(3)
61(2)
15(2)
88/89-91/92
92/93-96/97
97/98-00/01
01/02-03/04
04/05-06/07
07/08-09/10
Premier League created - exclusive
5 yr deal for Sky
Collapse of ITV digital
LiveHighlightsNear live
BroadbandMobile
VOD
Chapter 1 – Football: Premier League
60
60
106138
138
• The Premier League was established in 1992/93, when the clubs broke away from the Football League – they could not agree how the TV revenues should be shared- the previous rights round, where ITV had acquired the rights, had been
worth £15m p.a. (for highlights and occasional live games)
• In 1992/93-1996/97, Sky won the live rights for the first time – generating revenues for the Premier League of £61m per season
• During the 1990s, rights values grew rapidly, as Sky continued to invest heavily to secure exclusive rights (competing in the main against the BBC and ITV) and the number of matches shown live increased
• For 2001/2 to 2003/4, domestic rights value increased 176%, driven by new competition, an increased number of live matches and the introduction of new types of rights (negotiated in 2000)
• For 2004/05 to 2006/7, the overall value of rights declined by 19% (negotiated in 2003) - competition for the rights was reduced – ITV Digital had ceased operations
(Mar 2002) and cable companies (NTL and Telewest) were encountering financial and operational difficulties
- PPV not as successful as expected
• In 2006/07, the value of rights recovered, increasing by over 60%, to surpass the 2000/01 values- greater competition for rights facilitated by increase in number of live
packages spurred a bidding war between Sky, Setanta and Virgin Media even though the EC had required the Premier League to sell live rights to more than one broadcaster
Total number of live/PPV matches per contract
20© Spectrum | Value Partners 2007. This document is confidential and intended solely for the use and information of the addressee
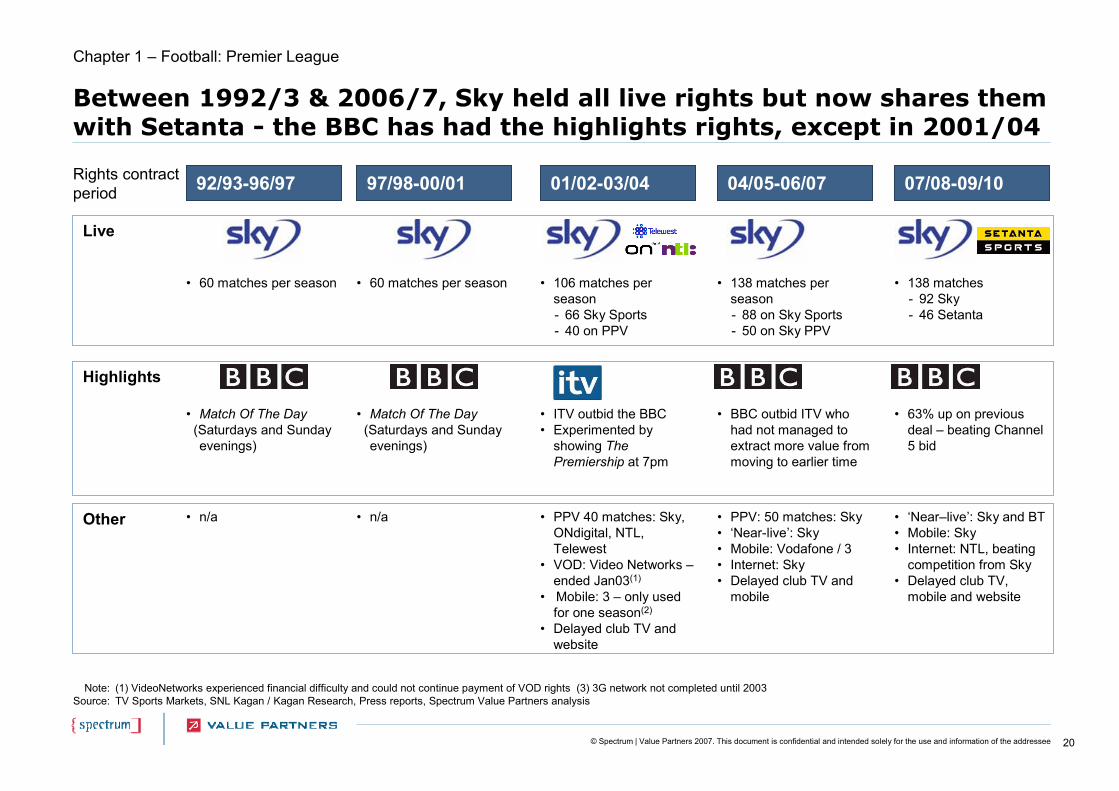
Between 1992/3 & 2006/7, Sky held all live rights but now shares them with Setanta - the BBC has had the highlights rights, except in 2001/04
Note:Source:
(1) VideoNetworks experienced financial difficulty and could not continue payment of VOD rights (3) 3G network not completed until 2003TV Sports Markets, SNL Kagan / Kagan Research, Press reports, Spectrum Value Partners analysis
Other
Rights contract period
Chapter 1 – Football: Premier League
01/02-03/04
• PPV 40 matches: Sky, ONdigital, NTL, Telewest
• VOD: Video Networks –ended Jan03(1)
• Mobile: 3 – only used for one season(2)
• Delayed club TV and website
92/93-96/97
• n/a
97/98-00/01
• n/a
04/05-06/07
• PPV: 50 matches: Sky• ‘Near-live’: Sky • Mobile: Vodafone / 3 • Internet: Sky• Delayed club TV and
mobile
07/08-09/10
Highlights
• ITV outbid the BBC• Experimented by
showing The Premiership at 7pm
• Match Of The Day (Saturdays and Sunday evenings)
• Match Of The Day (Saturdays and Sunday evenings)
• BBC outbid ITV who had not managed to extract more value from moving to earlier time
• 63% up on previous deal – beating Channel 5 bid
• ‘Near–live’: Sky and BT• Mobile: Sky• Internet: NTL, beating
competition from Sky• Delayed club TV,
mobile and website
• 106 matches per season- 66 Sky Sports- 40 on PPV
• 60 matches per season • 60 matches per season • 138 matches per season- 88 on Sky Sports- 50 on Sky PPV
• 138 matches - 92 Sky- 46 Setanta
Live
21© Spectrum | Value Partners 2007. This document is confidential and intended solely for the use and information of the addressee
01/02-03/04
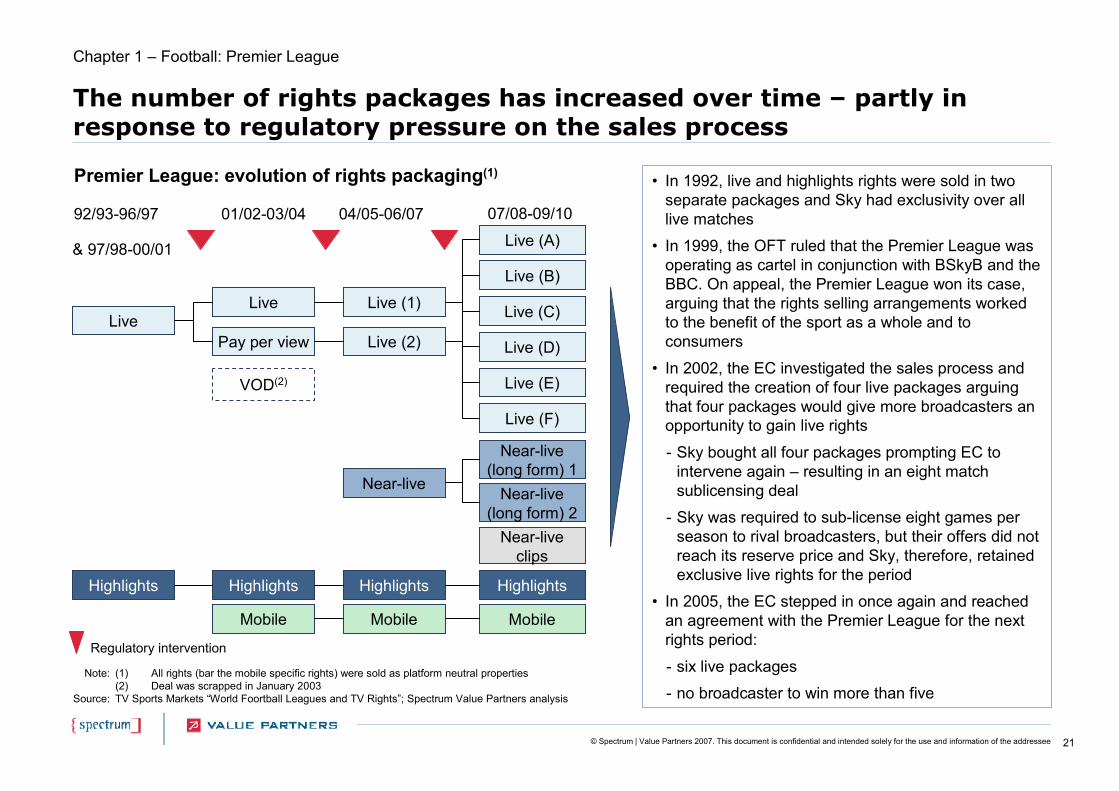
The number of rights packages has increased over time – partly in response to regulatory pressure on the sales process
Highlights
Mobile
LiveLive
VOD(2)
Note:
Source:
(1) All rights (bar the mobile specific rights) were sold as platform neutral properties(2) Deal was scrapped in January 2003TV Sports Markets “World Foortball Leagues and TV Rights”; Spectrum Value Partners analysis
Near-live
Highlights
Mobile
Premier League: evolution of rights packaging(1)
92/93-96/97
& 97/98-00/01
04/05-06/07 07/08-09/10
Live (2)
Live (1)
Live (D)
Live (B)
Live (C)
Live (A)
Live (F)
Live (E)
Near-live (long form) 1
Highlights
Mobile
Pay per view
Highlights
• In 1992, live and highlights rights were sold in two separate packages and Sky had exclusivity over all live matches
• In 1999, the OFT ruled that the Premier League was operating as cartel in conjunction with BSkyB and the BBC. On appeal, the Premier League won its case, arguing that the rights selling arrangements worked to the benefit of the sport as a whole and to consumers
• In 2002, the EC investigated the sales process and required the creation of four live packages arguing that four packages would give more broadcasters an opportunity to gain live rights
- Sky bought all four packages prompting EC to intervene again – resulting in an eight match sublicensing deal
- Sky was required to sub-license eight games per season to rival broadcasters, but their offers did not reach its reserve price and Sky, therefore, retained exclusive live rights for the period
• In 2005, the EC stepped in once again and reached an agreement with the Premier League for the next rights period:
- six live packages
- no broadcaster to win more than five
Regulatory intervention
Chapter 1 – Football: Premier League
Near-live clips
Near-live (long form) 2
22© Spectrum | Value Partners 2007. This document is confidential and intended solely for the use and information of the addressee
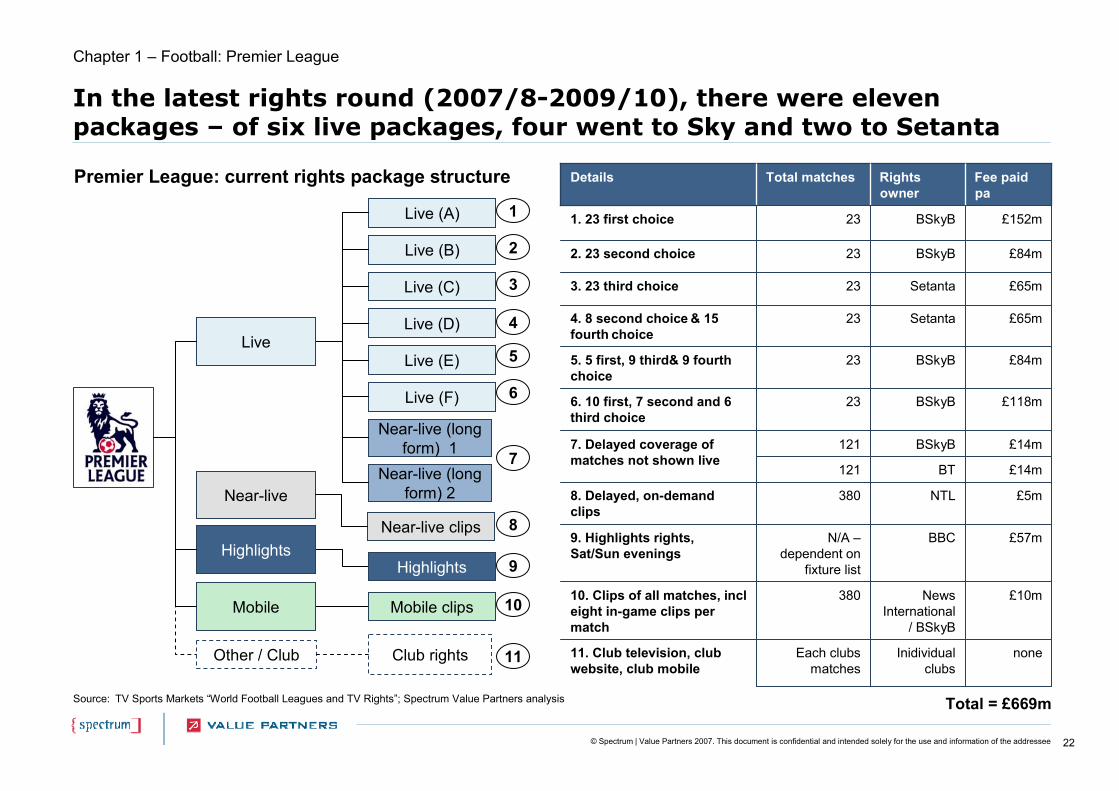
In the latest rights round (2007/8-2009/10), there were eleven packages – of six live packages, four went to Sky and two to Setanta
Source: TV Sports Markets “World Football Leagues and TV Rights”; Spectrum Value Partners analysis
Premier League: current rights package structure
Live (D)
Live (B)
Live (C)
Live (A)
Live (F)
Live (E)
Near-live (long form) 2
Near-live (long form) 1
£5mNTL3808. Delayed, on-demand clips
Inidividual clubs
News International
/ BSkyB
BBC
BT
BSkyB
BSkyB
BSkyB
Setanta
Setanta
BSkyB
BSkyB
Rights owner
noneEach clubs matches
11. Club television, club website, club mobile
£10m38010. Clips of all matches, incl eight in-game clips per match
£57mN/A –dependent on
fixture list
9. Highlights rights, Sat/Sun evenings
£152m231. 23 first choice
£84m232. 23 second choice
£65m233. 23 third choice
£65m234. 8 second choice & 15 fourth choice
121
121
23
23
Total matches
£14m
£14m
£118m
£84m
Fee paid pa
7. Delayed coverage of matches not shown live
6. 10 first, 7 second and 6 third choice
5. 5 first, 9 third& 9 fourth choice
Details
Live
HighlightsHighlights
Mobile clipsMobile
Other / Club Club rights
1
2
3
4
5
6
7
8
9
10
11
Chapter 1 – Football: Premier League
Total = £669m
Near-live
Near-live clips
23© Spectrum | Value Partners 2007. This document is confidential and intended solely for the use and information of the addressee
Source: Annual Review of Football Finance 2007, Deloitte; Spectrum Value Partners analysis
Premier League clubs average revenue breakdown 2005/6 (%)
Broadcast (UK & international)
42%
Matchday33%
Commercial25%
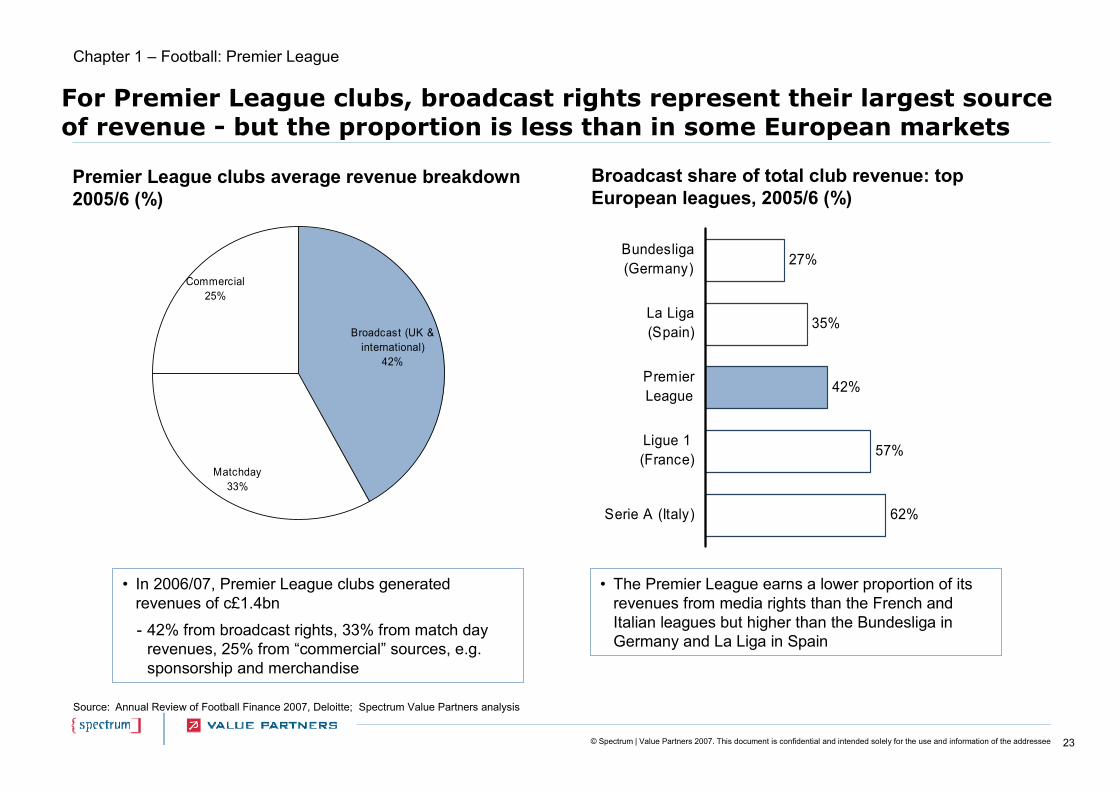
• In 2006/07, Premier League clubs generated revenues of c£1.4bn
- 42% from broadcast rights, 33% from match day revenues, 25% from “commercial” sources, e.g. sponsorship and merchandise
• The Premier League earns a lower proportion of its revenues from media rights than the French and Italian leagues but higher than the Bundesliga in Germany and La Liga in Spain
Broadcast share of total club revenue: top European leagues, 2005/6 (%)
62%
57%
42%
35%
27%
Serie A (Italy)
Ligue 1(France)
PremierLeague
La Liga(Spain)
Bundesliga(Germany)
For Premier League clubs, broadcast rights represent their largest source of revenue - but the proportion is less than in some European markets
Chapter 1 – Football: Premier League
24© Spectrum | Value Partners 2007. This document is confidential and intended solely for the use and information of the addressee
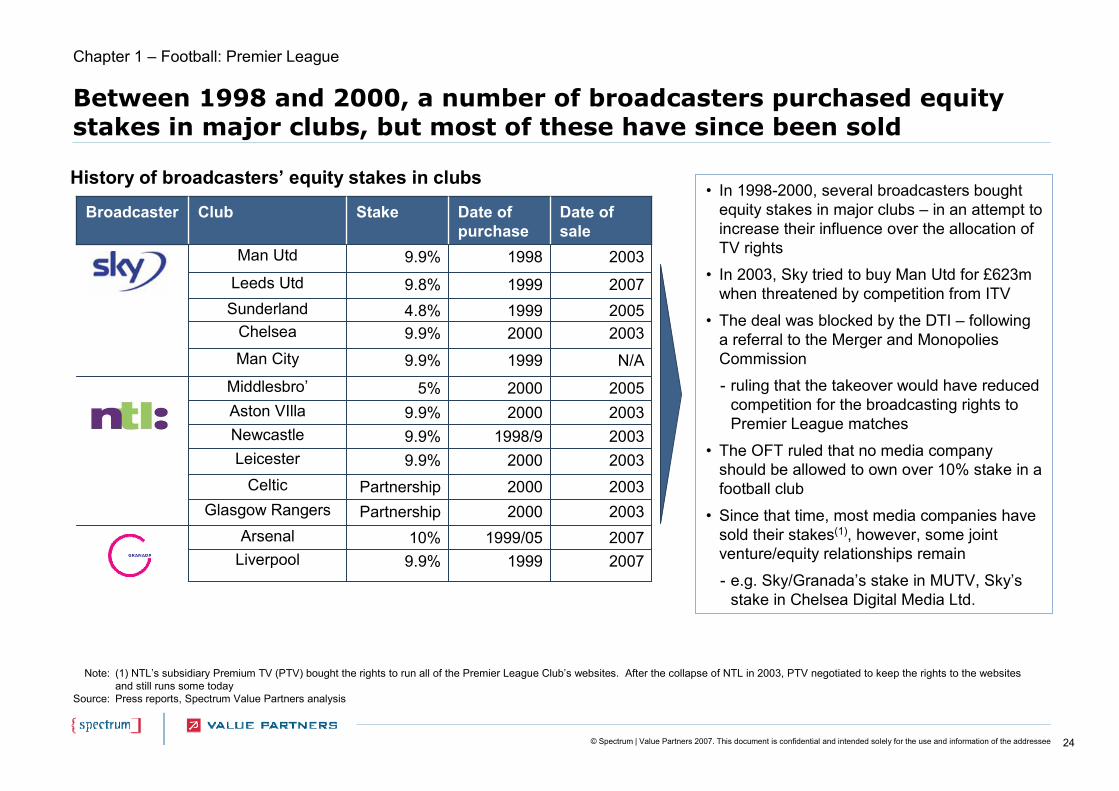
Between 1998 and 2000, a number of broadcasters purchased equitystakes in major clubs, but most of these have since been sold
200719999.9%Liverpool20071999/0510%Arsenal20032000PartnershipGlasgow Rangers20032000PartnershipCeltic200320009.9%Leicester
NewcastleAston VIllaMiddlesbro’
Man City
ChelseaSunderlandLeeds Utd
Man Utd
Club
200319989.9%
200719999.8%200519994.8%200320009.9%
1998/920002000
1999
Date ofpurchase
9.9%9.9%
5%
9.9%
Stake
200320032005
N/A
Date ofsale
Broadcaster
History of broadcasters’ equity stakes in clubs
Note:
Source:
(1) NTL’s subsidiary Premium TV (PTV) bought the rights to run all of the Premier League Club’s websites. After the collapse of NTL in 2003, PTV negotiated to keep the rights to the websites and still runs some todayPress reports, Spectrum Value Partners analysis
• In 1998-2000, several broadcasters bought equity stakes in major clubs – in an attempt to increase their influence over the allocation of TV rights
• In 2003, Sky tried to buy Man Utd for £623m when threatened by competition from ITV
• The deal was blocked by the DTI – following a referral to the Merger and Monopolies Commission
- ruling that the takeover would have reduced competition for the broadcasting rights to Premier League matches
• The OFT ruled that no media company should be allowed to own over 10% stake in a football club
• Since that time, most media companies have sold their stakes(1), however, some joint venture/equity relationships remain
- e.g. Sky/Granada’s stake in MUTV, Sky’s stake in Chelsea Digital Media Ltd.
Chapter 1 – Football: Premier League
25© Spectrum | Value Partners 2007. This document is confidential and intended solely for the use and information of the addressee
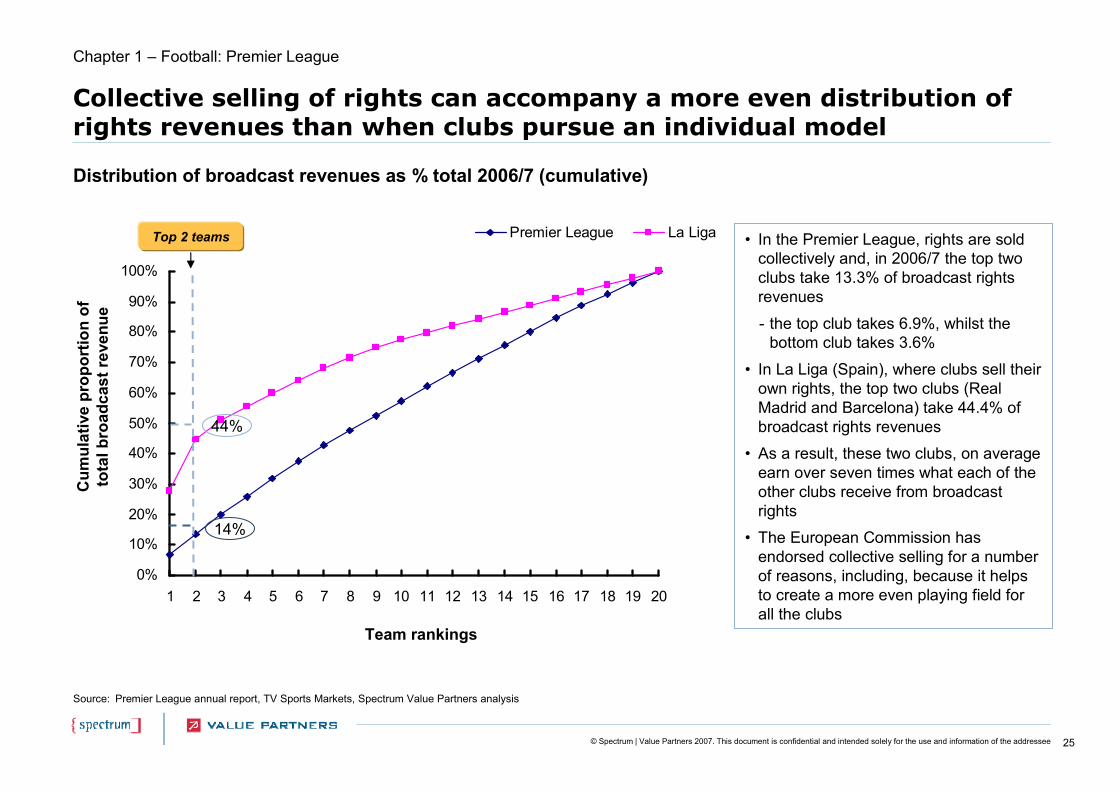
Collective selling of rights can accompany a more even distribution of rights revenues than when clubs pursue an individual model
Distribution of broadcast revenues as % total 2006/7 (cumulative)
Source: Premier League annual report, TV Sports Markets, Spectrum Value Partners analysis
• In the Premier League, rights are sold collectively and, in 2006/7 the top two clubs take 13.3% of broadcast rights revenues
- the top club takes 6.9%, whilst the bottom club takes 3.6%
• In La Liga (Spain), where clubs sell their own rights, the top two clubs (Real Madrid and Barcelona) take 44.4% of broadcast rights revenues
• As a result, these two clubs, on average earn over seven times what each of the other clubs receive from broadcast rights
• The European Commission has endorsed collective selling for a number of reasons, including, because it helps to create a more even playing field for all the clubs
Chapter 1 – Football: Premier League
0%
10%
20%
30%
40%
50%
60%
70%
80%
90%
100%
1 2 3 4 5 6 7 8 9 10 11 12 13 14 15 16 17 18 19 20
Premier League La Liga
14%
44%
Team rankings
Cum
ulat
ive
prop
ortio
n of
to
tal b
road
cast
reve
nue
Top 2 teams
26© Spectrum | Value Partners 2007. This document is confidential and intended solely for the use and information of the addressee
Chapter 1 – Football
Chapter 1 - Football
• Premier League
• FIFA World Cup
• UEFA Champions League
• FA Cup and Home Internationals
• UEFA Cup - Case Study
• Football League – Case Study
27© Spectrum | Value Partners 2007. This document is confidential and intended solely for the use and information of the addressee
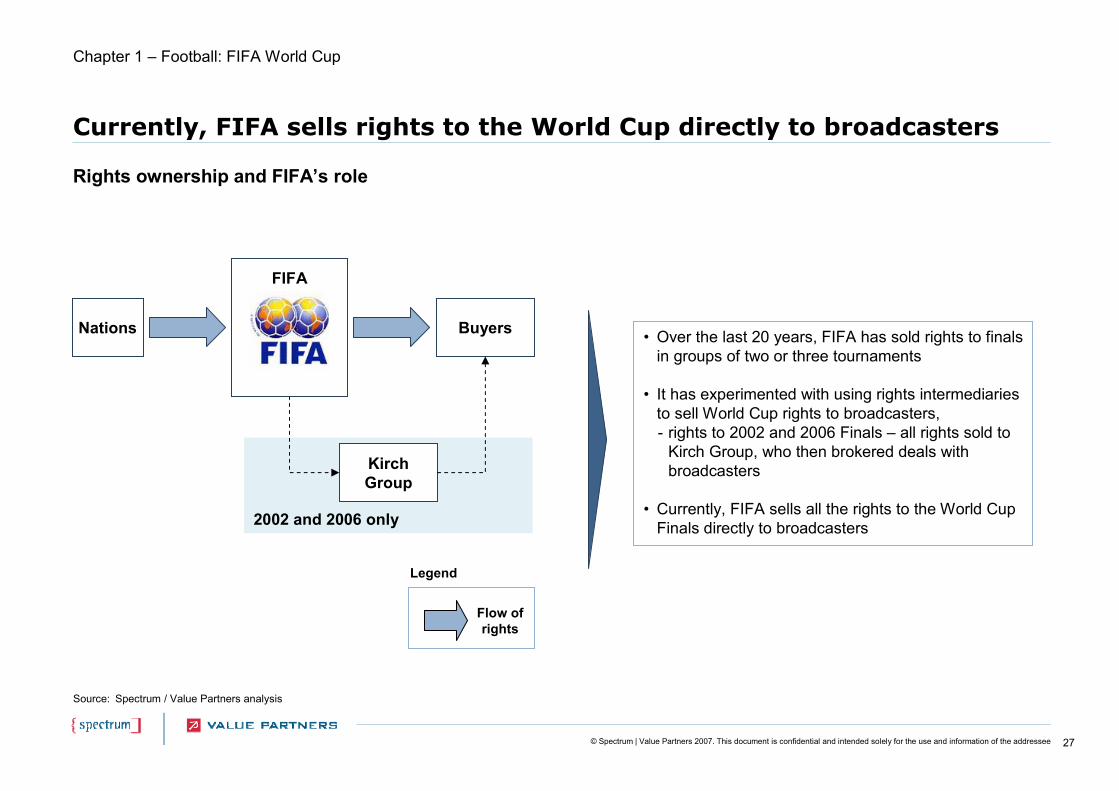
Currently, FIFA sells rights to the World Cup directly to broadcasters
• Over the last 20 years, FIFA has sold rights to finals in groups of two or three tournaments
• It has experimented with using rights intermediaries to sell World Cup rights to broadcasters, - rights to 2002 and 2006 Finals – all rights sold to
Kirch Group, who then brokered deals with broadcasters
• Currently, FIFA sells all the rights to the World Cup Finals directly to broadcasters
Rights ownership and FIFA’s role
Chapter 1 – Football: FIFA World Cup
Source: Spectrum / Value Partners analysis
2002 and 2006 only
Nations Buyers
FIFA
Kirch Group
Flow of rights
Legend
28© Spectrum | Value Partners 2007. This document is confidential and intended solely for the use and information of the addressee
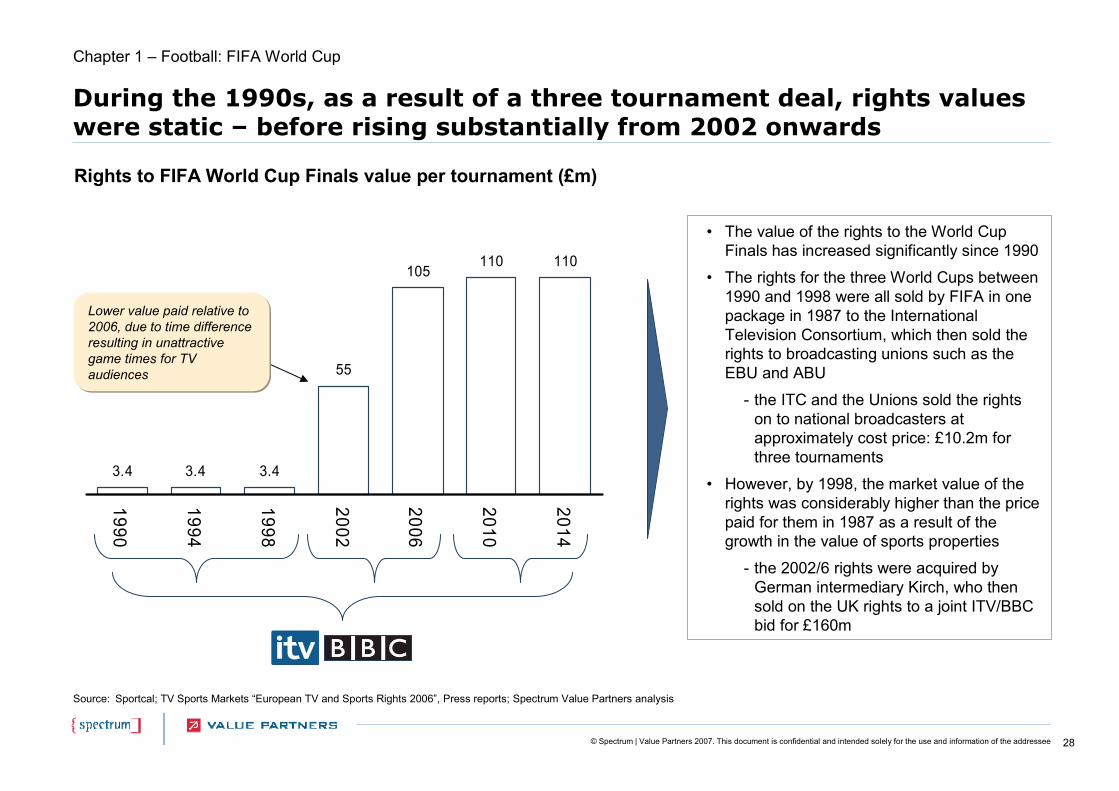
During the 1990s, as a result of a three tournament deal, rights values were static – before rising substantially from 2002 onwards
• The value of the rights to the World Cup Finals has increased significantly since 1990
• The rights for the three World Cups between 1990 and 1998 were all sold by FIFA in one package in 1987 to the International Television Consortium, which then sold the rights to broadcasting unions such as the EBU and ABU
- the ITC and the Unions sold the rights on to national broadcasters at approximately cost price: £10.2m for three tournaments
• However, by 1998, the market value of the rights was considerably higher than the price paid for them in 1987 as a result of the growth in the value of sports properties
- the 2002/6 rights were acquired by German intermediary Kirch, who then sold on the UK rights to a joint ITV/BBC bid for £160m
Source: Sportcal; TV Sports Markets “European TV and Sports Rights 2006”, Press reports; Spectrum Value Partners analysis
Rights to FIFA World Cup Finals value per tournament (£m)
3.4 3.4 3.4
55
105110 110
1990
1994
1998
2002
2006
2010
2014
Chapter 1 – Football: FIFA World Cup
Lower value paid relative to 2006, due to time difference resulting in unattractive game times for TV audiences
29© Spectrum | Value Partners 2007. This document is confidential and intended solely for the use and information of the addressee
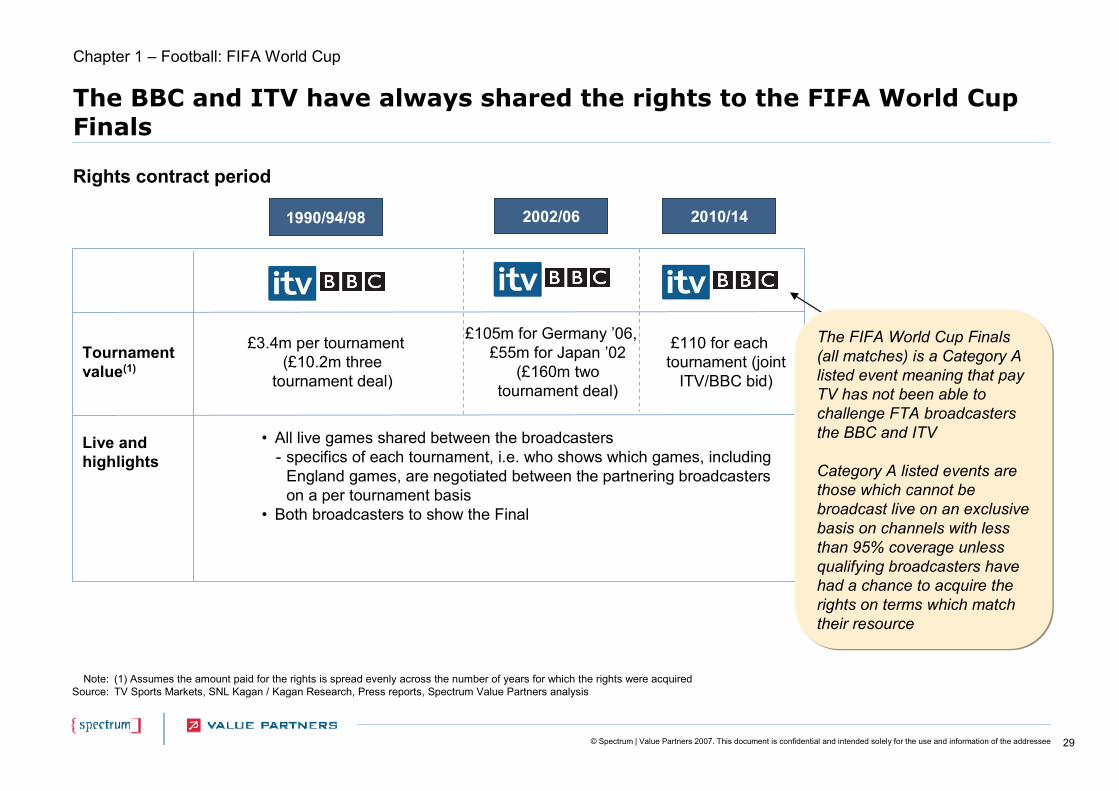
The BBC and ITV have always shared the rights to the FIFA World Cup Finals
Note:Source:
(1) Assumes the amount paid for the rights is spread evenly across the number of years for which the rights were acquiredTV Sports Markets, SNL Kagan / Kagan Research, Press reports, Spectrum Value Partners analysis
Live and highlights
2010/14
£3.4m per tournament (£10.2m three
tournament deal)
Tournament value(1)
£105m for Germany ’06, £55m for Japan ’02
(£160m two tournament deal)
£110 for each tournament (joint
ITV/BBC bid)
• All live games shared between the broadcasters- specifics of each tournament, i.e. who shows which games, including
England games, are negotiated between the partnering broadcasters on a per tournament basis
• Both broadcasters to show the Final
Chapter 1 – Football: FIFA World Cup
2002/061990/94/98
Rights contract period
The FIFA World Cup Finals (all matches) is a Category A listed event meaning that pay TV has not been able to challenge FTA broadcasters the BBC and ITV
Category A listed events are those which cannot be broadcast live on an exclusive basis on channels with less than 95% coverage unless qualifying broadcasters have had a chance to acquire the rights on terms which match their resource

30© Spectrum | Value Partners 2007. This document is confidential and intended solely for the use and information of the addressee
Note:Source:
All Euro figures converted from Swiss Francs. Exchange rate used CHF1.58 = €1 [2006 average rate, taken from FIFA Financial Report 2006]FIFA Financial Report 2006
Over half of FIFA’s revenues from the 2006 World Cup came from the sale of broadcast rights
Licencing rights3%
Accomodation and ticketing
1%
Profit share3%
Other1%
Hospitality9%
Marketing25%
Broadcasting58%
2006 FIFA World Cup RevenueTotal = €1.8bn
• FIFA received 88% of its total revenue for 2003-2006 from the 2006 World Cup, this amounted to €1.8bn- the remaining revenue came from other events (4%),
other operating income (4%) and financial income (4%)
• Broadcasting rights were the largest source of World Cup revenue by far –58% of total revenue (€1.05bn) - 45% of broadcasting revenues came from Europe, 11%
from the USA and 44% from the Rest of the World
• Marketing rights, including sponsorship payments from FIFA’s 15 Official Partners accounted for 25% (€450m) of World Cup income in 2006
• The remaining revenues came from the sale of VIP packages, product licensing, ticketing and FIFA’s share of the €99m profit made by the 2006 World Cup made
Chapter 1 – Football: FIFA World Cup
31© Spectrum | Value Partners 2007. This document is confidential and intended solely for the use and information of the addressee
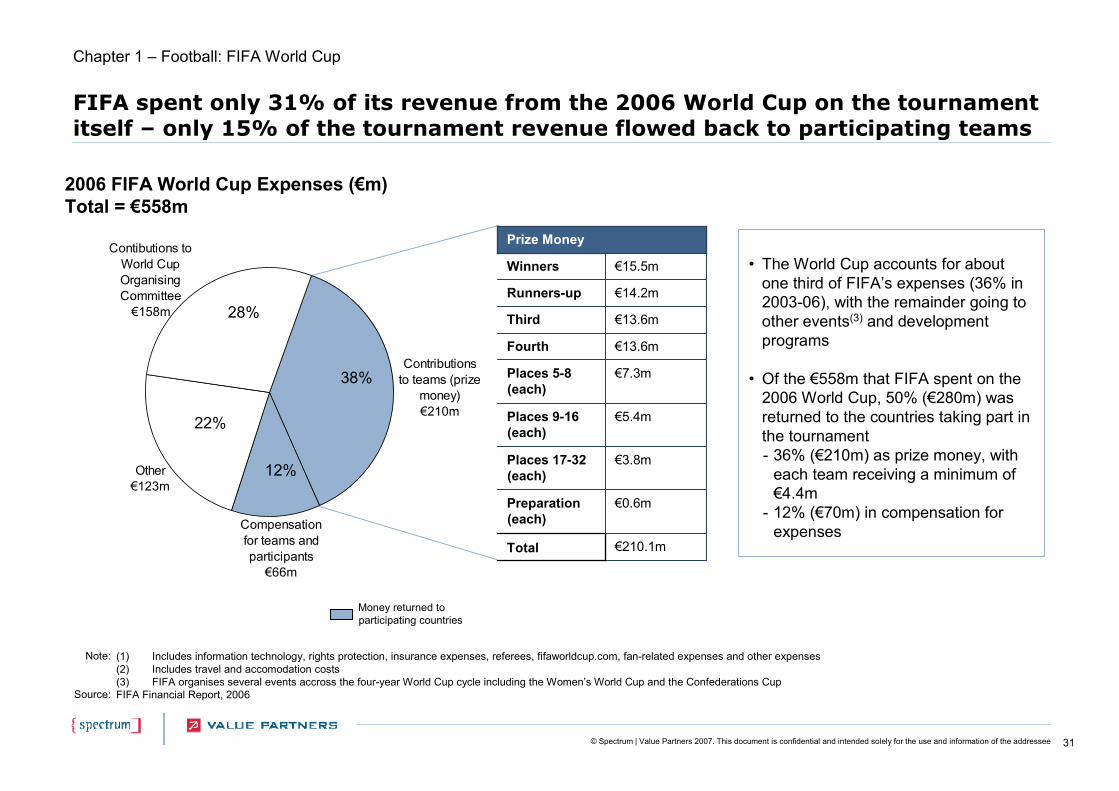
FIFA spent only 31% of its revenue from the 2006 World Cup on the tournament itself – only 15% of the tournament revenue flowed back to participating teams
2006 FIFA World Cup Expenses (€m)Total = €558m
€210.1mTotal
€0.6mPreparation (each)
€3.8mPlaces 17-32 (each)
€5.4mPlaces 9-16 (each)
€7.3mPlaces 5-8 (each)
€13.6mFourth
€13.6mThird
€14.2m
€15.5mWinners
Runners-up
Prize Money
Note:
Source:
(1) Includes information technology, rights protection, insurance expenses, referees, fifaworldcup.com, fan-related expenses and other expenses(2) Includes travel and accomodation costs(3) FIFA organises several events accross the four-year World Cup cycle including the Women’s World Cup and the Confederations CupFIFA Financial Report, 2006
• The World Cup accounts for about one third of FIFA’s expenses (36% in 2003-06), with the remainder going to other events(3) and development programs
• Of the €558m that FIFA spent on the 2006 World Cup, 50% (€280m) was returned to the countries taking part in the tournament - 36% (€210m) as prize money, with
each team receiving a minimum of €4.4m
- 12% (€70m) in compensation for expenses
Money returned to participating countries
Chapter 1 – Football: FIFA World Cup
Contibutions to World Cup Organising Committee
€158m
Other€123m
Compensation for teams and participants
€66m
Contributions to teams (prize
money)€210m
38%
12%
22%
28%
32© Spectrum | Value Partners 2007. This document is confidential and intended solely for the use and information of the addressee
Chapter 1 – Football
Chapter 1 - Football
• Premier League
• FIFA World Cup
• UEFA Champions League
• FA Cup and Home Internationals
• UEFA Cup – Case Study
• Football League – Case Study
33© Spectrum | Value Partners 2007. This document is confidential and intended solely for the use and information of the addressee
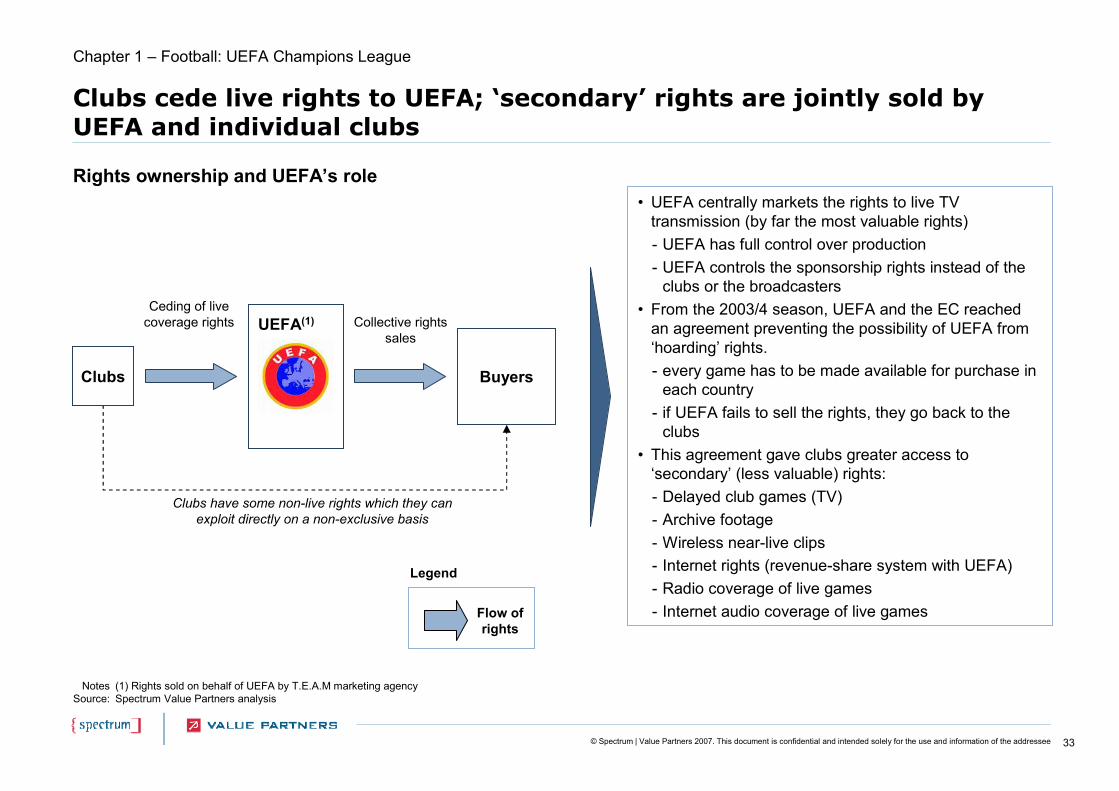
Clubs cede live rights to UEFA; ‘secondary’ rights are jointly sold by UEFA and individual clubs
• UEFA centrally markets the rights to live TV transmission (by far the most valuable rights)- UEFA has full control over production- UEFA controls the sponsorship rights instead of the
clubs or the broadcasters• From the 2003/4 season, UEFA and the EC reached
an agreement preventing the possibility of UEFA from ‘hoarding’ rights. - every game has to be made available for purchase in
each country- if UEFA fails to sell the rights, they go back to the
clubs• This agreement gave clubs greater access to
‘secondary’ (less valuable) rights:- Delayed club games (TV)- Archive footage- Wireless near-live clips- Internet rights (revenue-share system with UEFA)- Radio coverage of live games- Internet audio coverage of live games
Rights ownership and UEFA’s role
Chapter 1 – Football: UEFA Champions League
NotesSource:
(1) Rights sold on behalf of UEFA by T.E.A.M marketing agencySpectrum Value Partners analysis
Ceding of live coverage rights UEFA(1)
Clubs have some non-live rights which they can exploit directly on a non-exclusive basis
Collective rights sales
Clubs Buyers
Flow of rights
Legend
34© Spectrum | Value Partners 2007. This document is confidential and intended solely for the use and information of the addressee
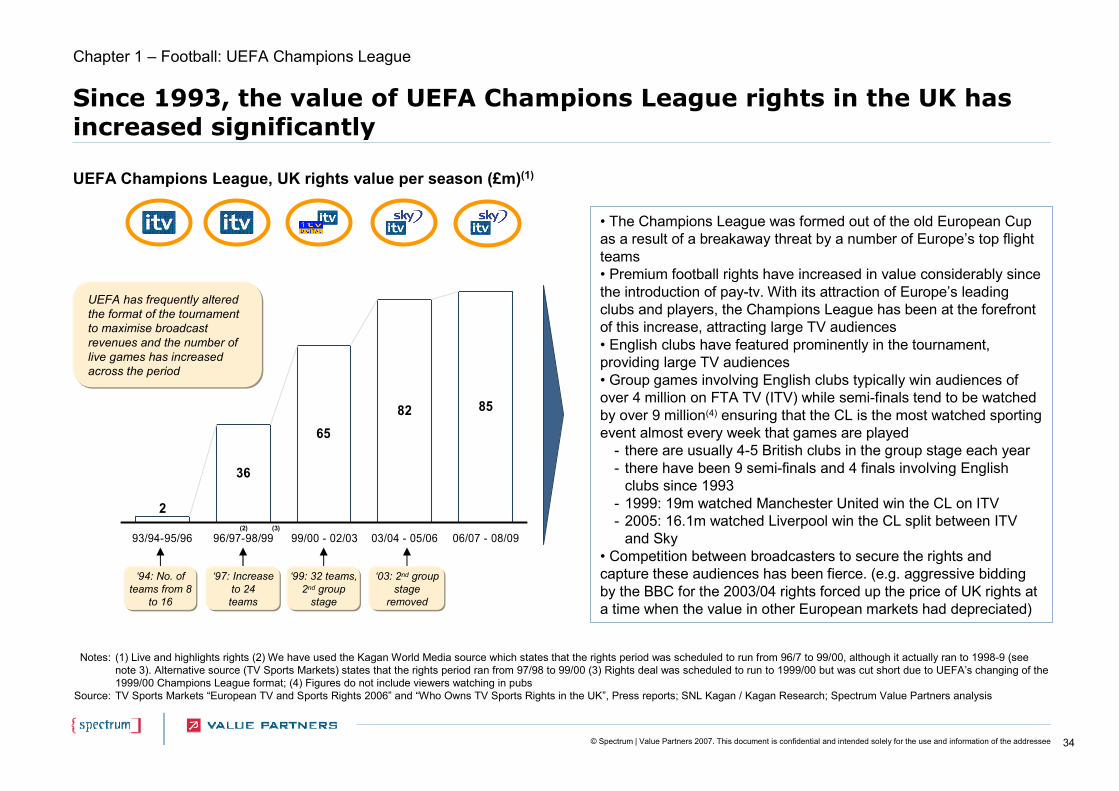
Since 1993, the value of UEFA Champions League rights in the UK has increased significantly
• The Champions League was formed out of the old European Cup as a result of a breakaway threat by a number of Europe’s top flight teams• Premium football rights have increased in value considerably since the introduction of pay-tv. With its attraction of Europe’s leading clubs and players, the Champions League has been at the forefront of this increase, attracting large TV audiences• English clubs have featured prominently in the tournament, providing large TV audiences• Group games involving English clubs typically win audiences of over 4 million on FTA TV (ITV) while semi-finals tend to be watched by over 9 million(4) ensuring that the CL is the most watched sporting event almost every week that games are played
- there are usually 4-5 British clubs in the group stage each year- there have been 9 semi-finals and 4 finals involving English
clubs since 1993- 1999: 19m watched Manchester United win the CL on ITV- 2005: 16.1m watched Liverpool win the CL split between ITV
and Sky• Competition between broadcasters to secure the rights and capture these audiences has been fierce. (e.g. aggressive bidding by the BBC for the 2003/04 rights forced up the price of UK rights at a time when the value in other European markets had depreciated)
UEFA Champions League, UK rights value per season (£m)(1)
36
6582 85
2
93/94-95/96 96/97-98/99 99/00 - 02/03 03/04 - 05/06 06/07 - 08/09
UEFA has frequently altered the format of the tournament to maximise broadcast revenues and the number of live games has increased across the period
‘94: No. of teams from 8
to 16
‘03: 2nd group stage
removed
‘97: Increase to 24 teams
‘99: 32 teams, 2nd group
stage
Notes:
Source:
(1) Live and highlights rights (2) We have used the Kagan World Media source which states that the rights period was scheduled to run from 96/7 to 99/00, although it actually ran to 1998-9 (see note 3). Alternative source (TV Sports Markets) states that the rights period ran from 97/98 to 99/00 (3) Rights deal was scheduled to run to 1999/00 but was cut short due to UEFA’s changing of the 1999/00 Champions League format; (4) Figures do not include viewers watching in pubs TV Sports Markets “European TV and Sports Rights 2006” and “Who Owns TV Sports Rights in the UK”, Press reports; SNL Kagan / Kagan Research; Spectrum Value Partners analysis
(2) (3)
Chapter 1 – Football: UEFA Champions League
35© Spectrum | Value Partners 2007. This document is confidential and intended solely for the use and information of the addressee
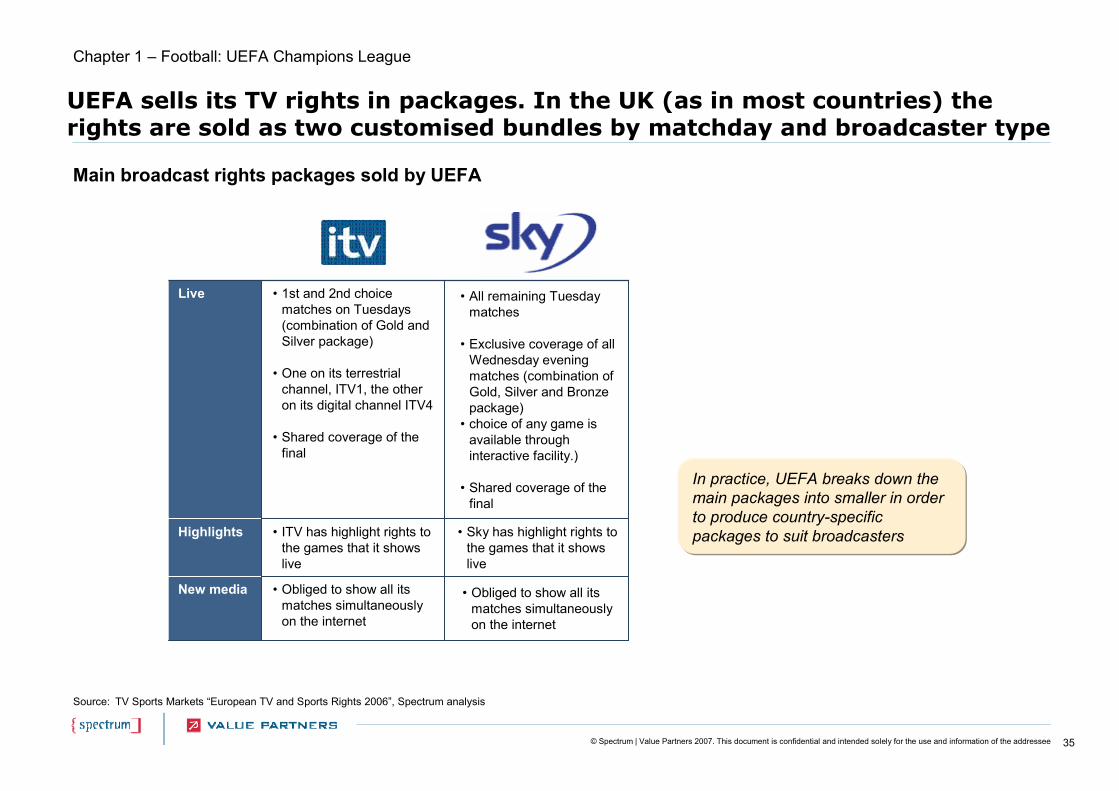
UEFA sells its TV rights in packages. In the UK (as in most countries) the rights are sold as two customised bundles by matchday and broadcaster type
Source: TV Sports Markets “European TV and Sports Rights 2006”, Spectrum analysis
New media
Highlights
Live
• Obliged to show all its matches simultaneously on the internet
• Obliged to show all its matches simultaneously on the internet
• Sky has highlight rights to the games that it shows live
• ITV has highlight rights to the games that it shows live
• All remaining Tuesday matches
• Exclusive coverage of all Wednesday evening matches (combination of Gold, Silver and Bronze package)
• choice of any game is available through interactive facility.)
• Shared coverage of the final
• 1st and 2nd choice matches on Tuesdays (combination of Gold and Silver package)
• One on its terrestrial channel, ITV1, the other on its digital channel ITV4
• Shared coverage of the final
Main broadcast rights packages sold by UEFA
In practice, UEFA breaks down the main packages into smaller in order to produce country-specific packages to suit broadcasters
Chapter 1 – Football: UEFA Champions League
36© Spectrum | Value Partners 2007. This document is confidential and intended solely for the use and information of the addressee
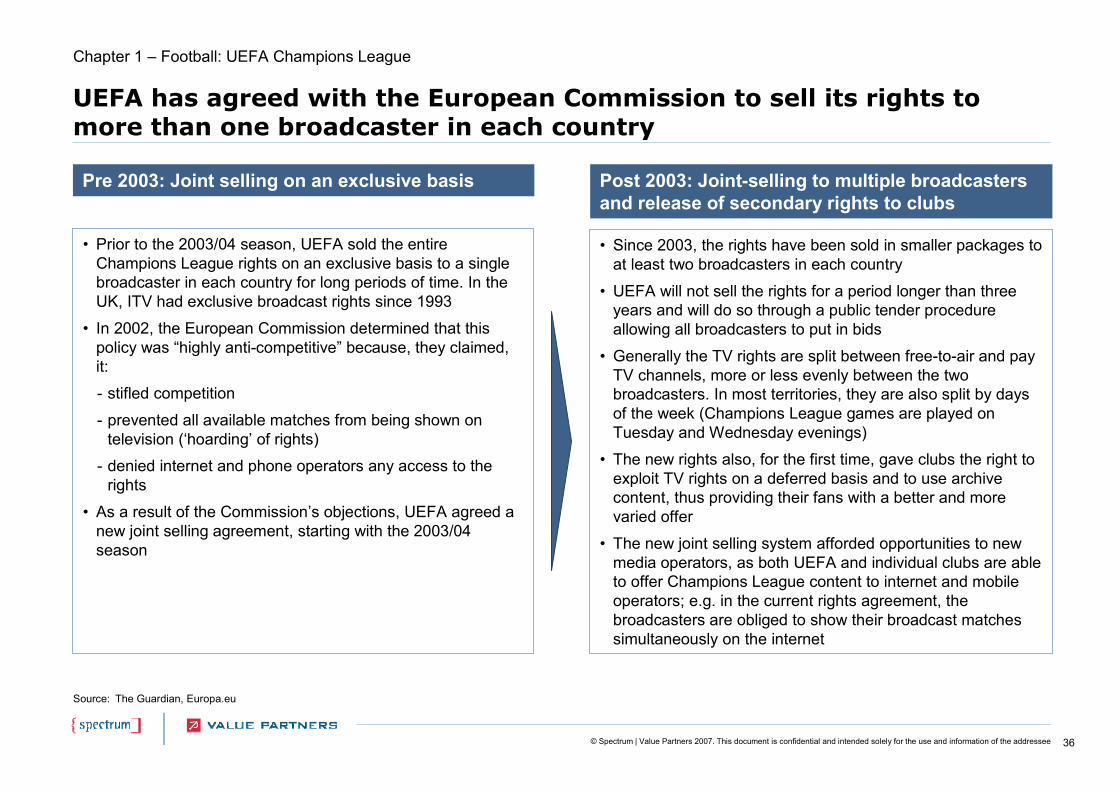
UEFA has agreed with the European Commission to sell its rights to more than one broadcaster in each country
Source: The Guardian, Europa.eu
• Prior to the 2003/04 season, UEFA sold the entire Champions League rights on an exclusive basis to a single broadcaster in each country for long periods of time. In the UK, ITV had exclusive broadcast rights since 1993
• In 2002, the European Commission determined that this policy was “highly anti-competitive” because, they claimed, it:
- stifled competition
- prevented all available matches from being shown on television (‘hoarding’ of rights)
- denied internet and phone operators any access to the rights
• As a result of the Commission’s objections, UEFA agreed a new joint selling agreement, starting with the 2003/04 season
Pre 2003: Joint selling on an exclusive basis
• Since 2003, the rights have been sold in smaller packages to at least two broadcasters in each country
• UEFA will not sell the rights for a period longer than three years and will do so through a public tender procedure allowing all broadcasters to put in bids
• Generally the TV rights are split between free-to-air and pay TV channels, more or less evenly between the two broadcasters. In most territories, they are also split by days of the week (Champions League games are played on Tuesday and Wednesday evenings)
• The new rights also, for the first time, gave clubs the right toexploit TV rights on a deferred basis and to use archive content, thus providing their fans with a better and more varied offer
• The new joint selling system afforded opportunities to new media operators, as both UEFA and individual clubs are able to offer Champions League content to internet and mobile operators; e.g. in the current rights agreement, the broadcasters are obliged to show their broadcast matches simultaneously on the internet
Post 2003: Joint-selling to multiple broadcasters and release of secondary rights to clubs
Chapter 1 – Football: UEFA Champions League
37© Spectrum | Value Partners 2007. This document is confidential and intended solely for the use and information of the addressee
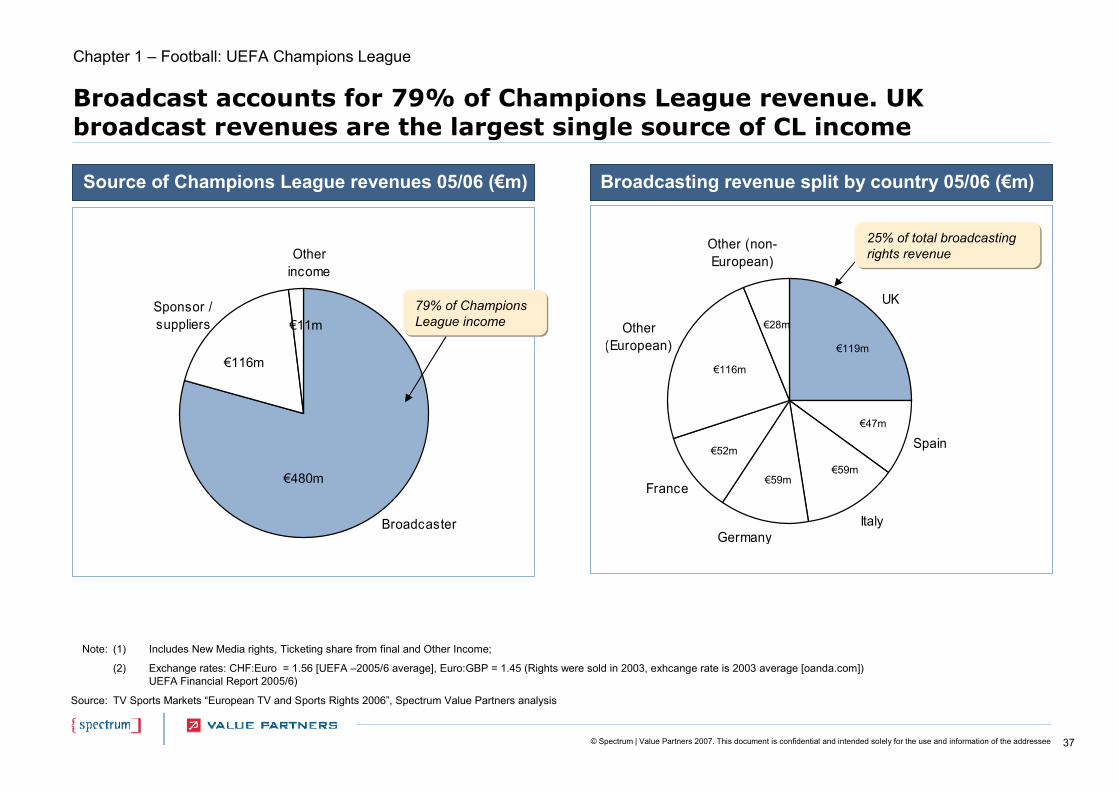
Broadcast accounts for 79% of Champions League revenue. UK broadcast revenues are the largest single source of CL income
UK
Spain
ItalyGermany
France
Other (European)
Other (non-European)
€119m
€47m
€59m€59m
€52m
€116m
€28m
Broadcasting revenue split by country 05/06 (€m)
Note: (1) Includes New Media rights, Ticketing share from final and Other Income;
(2) Exchange rates: CHF:Euro = 1.56 [UEFA –2005/6 average], Euro:GBP = 1.45 (Rights were sold in 2003, exhcange rate is 2003 average [oanda.com]) UEFA Financial Report 2005/6)
TV Sports Markets “European TV and Sports Rights 2006”, Spectrum Value Partners analysisSource:
Source of Champions League revenues 05/06 (€m)
25% of total broadcasting rights revenue
Broadcaster
Other income
Sponsor / suppliers
79% of Champions League income
€480m
€116m
€11m
Chapter 1 – Football: UEFA Champions League
38© Spectrum | Value Partners 2007. This document is confidential and intended solely for the use and information of the addressee
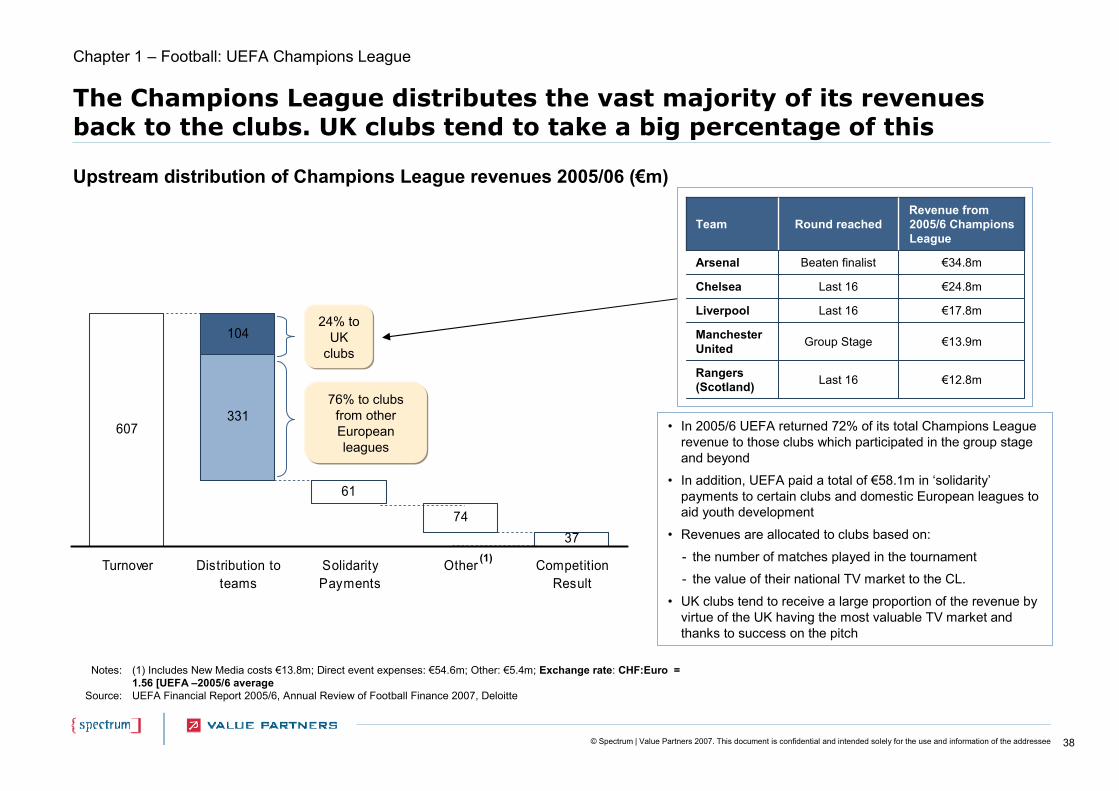
The Champions League distributes the vast majority of its revenues back to the clubs. UK clubs tend to take a big percentage of this
• In 2005/6 UEFA returned 72% of its total Champions League revenue to those clubs which participated in the group stage and beyond
• In addition, UEFA paid a total of €58.1m in ‘solidarity’payments to certain clubs and domestic European leagues to aid youth development
• Revenues are allocated to clubs based on:
- the number of matches played in the tournament
- the value of their national TV market to the CL.
• UK clubs tend to receive a large proportion of the revenue by virtue of the UK having the most valuable TV market and thanks to success on the pitch
€13.9mGroup StageManchester United
€12.8mLast 16Rangers (Scotland)
€24.8mLast 16Chelsea
€34.8mBeaten finalistArsenal
€17.8mLast 16Liverpool
Round reachedRevenue from 2005/6 Champions League
Team
607331
104
61
7437
Turnover Distribution toteams
SolidarityPayments
Other CompetitionResult
24% to UK
clubs
Upstream distribution of Champions League revenues 2005/06 (€m)
76% to clubs from other European leagues
(1)
Notes:
Source:
(1) Includes New Media costs €13.8m; Direct event expenses: €54.6m; Other: €5.4m; Exchange rate: CHF:Euro = 1.56 [UEFA –2005/6 averageUEFA Financial Report 2005/6, Annual Review of Football Finance 2007, Deloitte
Chapter 1 – Football: UEFA Champions League

39© Spectrum | Value Partners 2007. This document is confidential and intended solely for the use and information of the addressee
Participation in the Champions League is a vital source of revenue for the leading English clubs
Notes:Source:
(1) “Big Four” – Liverpool, Arsenal, Chelsea, Manchester United; (2) ‘Champions League’ revenue includes broadcast revenue and an estimate of incremental gate receiptsAnnual Review of Football Finance 2007, Deloitte
Champions League
17%
Commercial33%
Premier League
Broadcast21%
Matchday29%
£25m
£47m
£30m
£42m
Average revenue breakdown, ‘Big Four’(1) English Clubs, 2005/6 (£m/%)
• Participation and success in the Champions League is enormously valuable to the leading British clubs
• The commercial benefits from the Champions League are manifest in a number of ways:
• Direct income- Ticket sales from Champions League matches- Share of broadcasting revenue
• Indirect income- Increased international exposure through
Champions League TV audiences resulting in increased sponsorship, commercial sales, etc
Chapter 1 – Football: UEFA Champions League
40© Spectrum | Value Partners 2007. This document is confidential and intended solely for the use and information of the addressee
Chapter 1 – Football
Chapter 1 - Football
• Premier League
• FIFA World Cup
• UEFA Champions League
• FA Cup and Home Internationals
• UEFA Cup – Case study
• Football League – Case study
41© Spectrum | Value Partners 2007. This document is confidential and intended solely for the use and information of the addressee
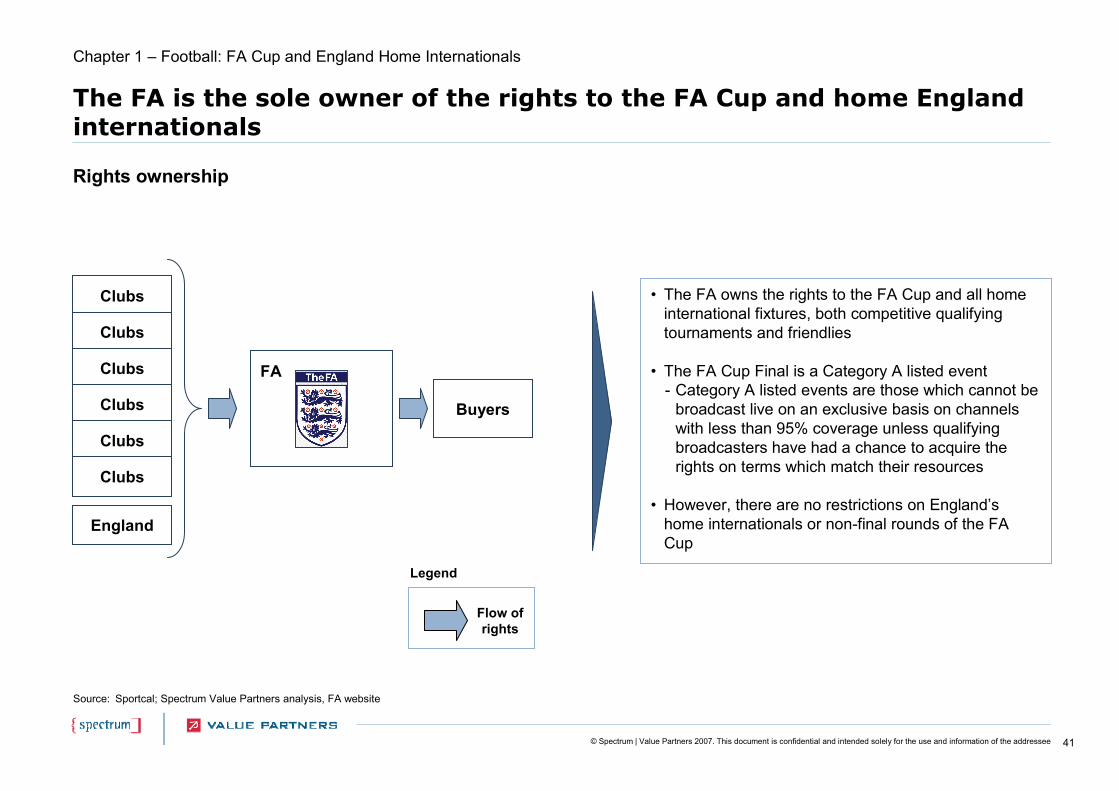
The FA is the sole owner of the rights to the FA Cup and home England internationals
• The FA owns the rights to the FA Cup and all home international fixtures, both competitive qualifying tournaments and friendlies
• The FA Cup Final is a Category A listed event- Category A listed events are those which cannot be
broadcast live on an exclusive basis on channels with less than 95% coverage unless qualifying broadcasters have had a chance to acquire the rights on terms which match their resources
• However, there are no restrictions on England’s home internationals or non-final rounds of the FA Cup
Rights ownership
Chapter 1 – Football: FA Cup and England Home Internationals
Source: Sportcal; Spectrum Value Partners analysis, FA website
Buyers
Clubs
Clubs
Clubs
Clubs
Clubs
Clubs
FA
England
Flow of rights
Legend
42© Spectrum | Value Partners 2007. This document is confidential and intended solely for the use and information of the addressee
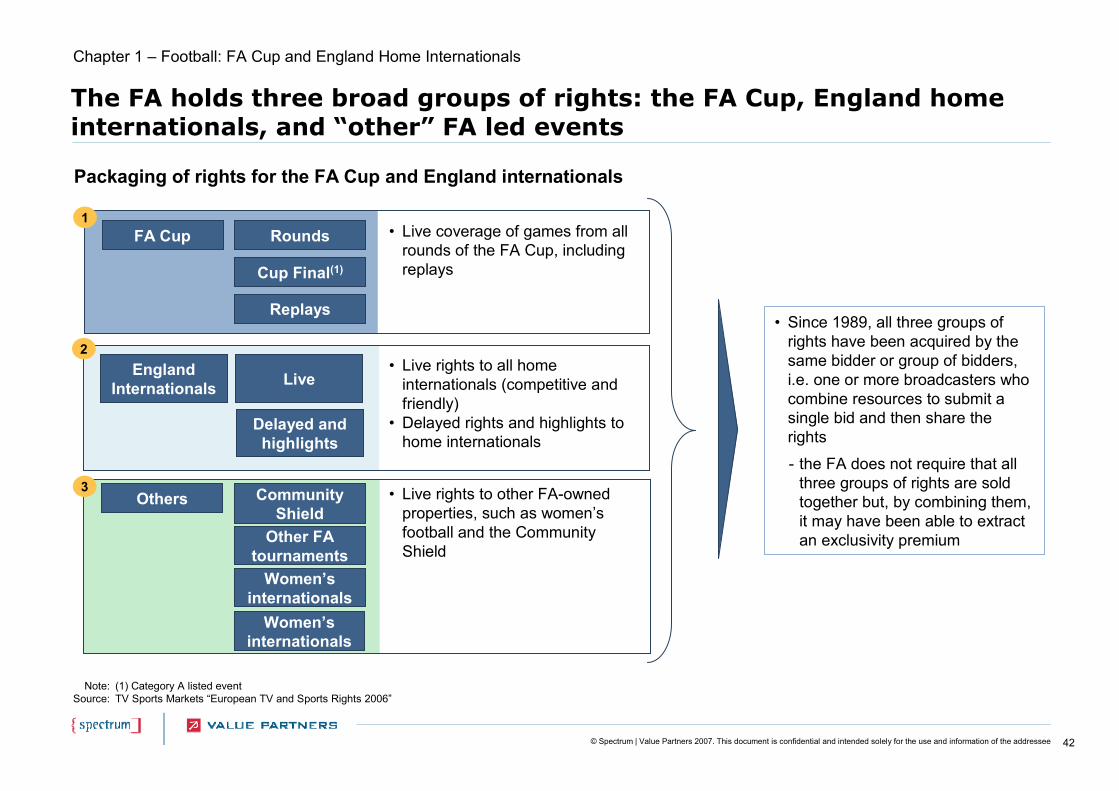
The FA holds three broad groups of rights: the FA Cup, England home internationals, and “other” FA led events
Note:Source:
(1) Category A listed eventTV Sports Markets “European TV and Sports Rights 2006”
Packaging of rights for the FA Cup and England internationals
England Internationals
FA Cup
• Since 1989, all three groups of rights have been acquired by the same bidder or group of bidders, i.e. one or more broadcasters who combine resources to submit a single bid and then share the rights
- the FA does not require that all three groups of rights are sold together but, by combining them, it may have been able to extract an exclusivity premium
• Live rights to all home internationals (competitive and friendly)
• Delayed rights and highlights to home internationals
• Live coverage of games from all rounds of the FA Cup, including replays
2
1
Live
Delayed and highlights
Rounds
Cup Final(1)
Replays
Others • Live rights to other FA-owned properties, such as women’s football and the Community Shield
3 Community Shield
Other FA tournaments
Women’s internationals
Women’s internationals
Chapter 1 – Football: FA Cup and England Home Internationals
43© Spectrum | Value Partners 2007. This document is confidential and intended solely for the use and information of the addressee
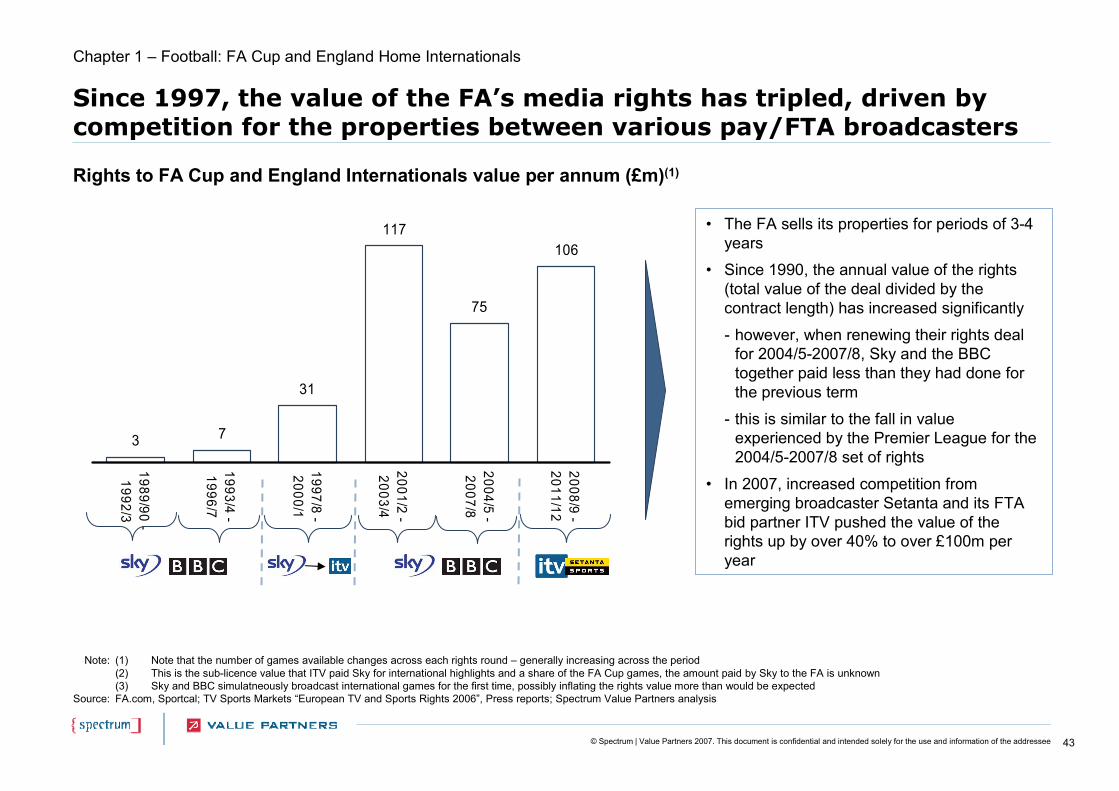
Since 1997, the value of the FA’s media rights has tripled, driven by competition for the properties between various pay/FTA broadcasters
• The FA sells its properties for periods of 3-4 years
• Since 1990, the annual value of the rights (total value of the deal divided by the contract length) has increased significantly
- however, when renewing their rights deal for 2004/5-2007/8, Sky and the BBC together paid less than they had done for the previous term
- this is similar to the fall in value experienced by the Premier League for the 2004/5-2007/8 set of rights
• In 2007, increased competition from emerging broadcaster Setanta and its FTA bid partner ITV pushed the value of the rights up by over 40% to over £100m per year
Note:
Source:
(1) Note that the number of games available changes across each rights round – generally increasing across the period(2) This is the sub-licence value that ITV paid Sky for international highlights and a share of the FA Cup games, the amount paid by Sky to the FA is unknown(3) Sky and BBC simulatneously broadcast international games for the first time, possibly inflating the rights value more than would be expectedFA.com, Sportcal; TV Sports Markets “European TV and Sports Rights 2006”, Press reports; Spectrum Value Partners analysis
Rights to FA Cup and England Internationals value per annum (£m)(1)
3 7
31
117106
75
1989/90 -1992/3
1993/4 -1996/7
1997/8 -2000/1
2001/2 -2003/4
2004/5 -2007/8
2008/9 -2011/12
Chapter 1 – Football: FA Cup and England Home Internationals
44© Spectrum | Value Partners 2007. This document is confidential and intended solely for the use and information of the addressee
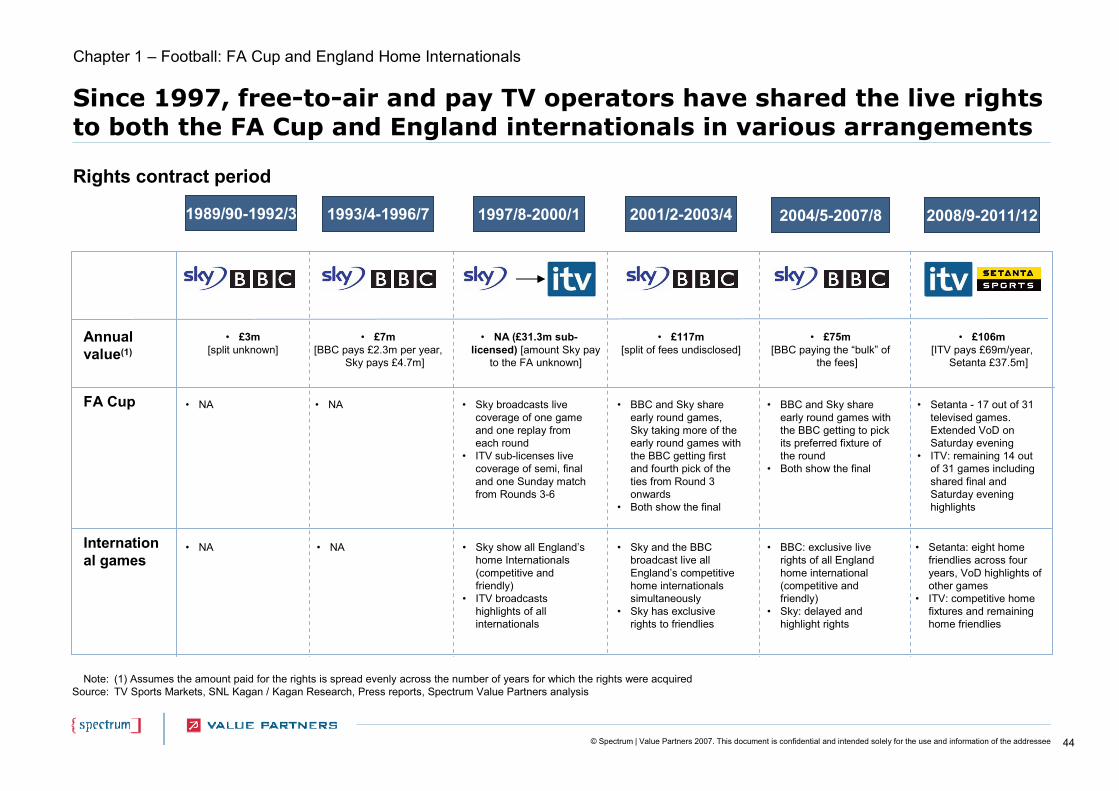
Since 1997, free-to-air and pay TV operators have shared the live rights to both the FA Cup and England internationals in various arrangements
Note:Source:
(1) Assumes the amount paid for the rights is spread evenly across the number of years for which the rights were acquiredTV Sports Markets, SNL Kagan / Kagan Research, Press reports, Spectrum Value Partners analysis
FA Cup • Setanta - 17 out of 31 televised games. Extended VoD on Saturday evening
• ITV: remaining 14 out of 31 games including shared final and Saturday evening highlights
2004/5-2007/8 2008/9-2011/122001/2-2003/41997/8-2000/1
International games
• NA (£31.3m sub-licensed) [amount Sky pay
to the FA unknown]
Annual value(1)
• £117m[split of fees undisclosed]
• £75m[BBC paying the “bulk” of
the fees]
• £106m[ITV pays £69m/year,
Setanta £37.5m]
• Sky broadcasts live coverage of one game and one replay from each round
• ITV sub-licenses live coverage of semi, final and one Sunday match from Rounds 3-6
• BBC and Sky share early round games, Sky taking more of the early round games with the BBC getting first and fourth pick of the ties from Round 3 onwards
• Both show the final
• BBC and Sky share early round games with the BBC getting to pick its preferred fixture of the round
• Both show the final
• Setanta: eight home friendlies across four years, VoD highlights of other games
• ITV: competitive home fixtures and remaining home friendlies
• Sky show all England’s home Internationals (competitive and friendly)
• ITV broadcasts highlights of all internationals
• Sky and the BBC broadcast live all England’s competitive home internationals simultaneously
• Sky has exclusive rights to friendlies
• BBC: exclusive live rights of all England home international (competitive and friendly)
• Sky: delayed and highlight rights
1993/4-1996/7
• £7m[BBC pays £2.3m per year,
Sky pays £4.7m]
• NA
• NA
1989/90-1992/3
• £3m[split unknown]
• NA
• NA
Rights contract period
Chapter 1 – Football: FA Cup and England Home Internationals
45© Spectrum | Value Partners 2007. This document is confidential and intended solely for the use and information of the addressee
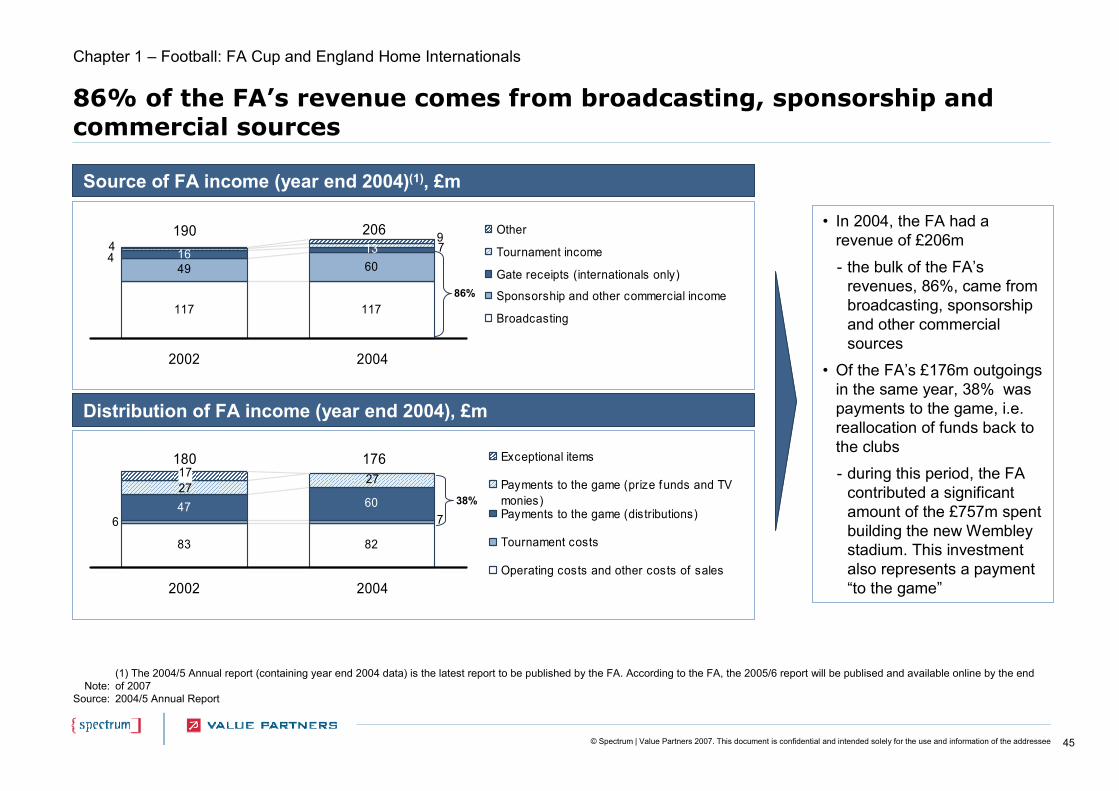
86% of the FA’s revenue comes from broadcasting, sponsorship and commercial sources
Note:Source:
(1) The 2004/5 Annual report (containing year end 2004 data) is the latest report to be published by the FA. According to the FA, the 2005/6 report will be publised and available online by the end of 20072004/5 Annual Report
• In 2004, the FA had a revenue of £206m
- the bulk of the FA’s revenues, 86%, came from broadcasting, sponsorship and other commercial sources
• Of the FA’s £176m outgoings in the same year, 38% was payments to the game, i.e. reallocation of funds back to the clubs
- during this period, the FA contributed a significant amount of the £757m spent building the new Wembley stadium. This investment also represents a payment “to the game”
Source of FA income (year end 2004)(1), £m
Distribution of FA income (year end 2004), £m
117 117
49 60
1901316 7
49
4206
2002 2004
Other
Tournament income
Gate receipts (internationals only)
Sponsorship and other commercial income
Broadcasting
83 82
180
6 747 6027
2717176
2002 2004
Exceptional items
Payments to the game (prize funds and TVmonies)Payments to the game (distributions)
Tournament costs
Operating costs and other costs of sales
86%
38%
Chapter 1 – Football: FA Cup and England Home Internationals
46© Spectrum | Value Partners 2007. This document is confidential and intended solely for the use and information of the addressee
Chapter 1 – Football
Chapter 1 - Football
• Premier League
• FIFA World Cup
• UEFA Champions League
• FA Cup and Home Internationals
• UEFA Cup – Case study
• Football League – Case study

47© Spectrum | Value Partners 2007. This document is confidential and intended solely for the use and information of the addressee
UEFA owns the rights from the quarter-finals onwards, but rights to the early rounds of the UEFA Cup are owned by the clubs
Chapter 1 – Football: UEFA Cup Case Study
Notes:Source:
(1) The GuardianPress reports, Spectrum Value Partners analysis
• TV and commercial rights before the quarter-finals are owned by the home clubs
• Some clubs agree a deal with one broadcaster for all their home games –some sell rights to each game separately
• Rights to broadcast away games involving British clubs are bought from the home team.
• Smaller broadcasters who cannot afford season-long rights deals have an opportunity to show live football, e.g.: - Five’s coverage of all Everton and some Bolton games (2007/8)- Eurosport’s coverage of some Blackburn games (2006/7)
• In some cases, where a fee cannot be agreed, games may not be broadcast in the UK - e.g. 2007/8: FC Rabotnicki (Macedonia) vs. Bolton
Selling of UEFA Cup rights
Quarter-Final, Semi-Final, Final
Rights sold centrally by UEFA
• Prior to 2006/7, UEFA controlled the TV and commercial rights to the final only
• In the current deal (2006/7 to 2008/9), UEFA owns TV and commercial rights for the quarter-final stage onwards
• ITV is reported to be paying £25 million over three years (£8.3m per season)1 for the current deal including quarter-finals, semi-finals, final and UEFA Super Cup
UEFA
Rights sold directly by clubs
Clubs Buyers
Early rounds
Flow of rights
Legend

48© Spectrum | Value Partners 2007. This document is confidential and intended solely for the use and information of the addressee
Chapter 1 – Football
Chapter 1 - Football
• Premier League
• FIFA World Cup
• UEFA Champions League
• FA Cup and Home Internationals
• UEFA Cup – Case study
• Football League – Case study

49© Spectrum | Value Partners 2007. This document is confidential and intended solely for the use and information of the addressee
In 2001/02, the Football League achieved a fourfold increased in the value of its rights - however, when ITV Digital failed, 57% of this revenue remained unpaid
Chapter 1 – Football: Football League Case Study
Football League, UK live rights value per season (£m)(1)
Notes:
Source:
(1) All deals are for live rights only (i.e. not highlights) to the Football League and also include rights to the League Cup (currently known as the Carling Cup) and the Football League Trophy (currently the Johnstone’s Paint Trophy) (2) Original rights period was supposed to run until 2003/4, however, ITV Digital collapsed in 2002. The rights to the 2002/3 season were then resold and bought by Sky as part a new four-year packageTV Sports Markets “World Football Leagues and TV Rights”, Press Reports
• In 2000, ONdigital (later re-branded as ITV Digital) paid £315m (£105m p.a.) to acquire the rights to the Football League for 2001/02 to 2003/4 – a fourfold increase on the previous rights period
• However ITV Digital struggled to achieve its targets (only 1.3m subscribers in February 2002 compared to 5.7 million for Sky) and went into administration in March 2002
• The administrators offered the Football League £74m for a renegotiated three-year deal –the League rejected this offer
• ITV Digital ceased broadcasting in May 2002 leaving two years of the three year deal unpaid – £178m of the original £315m deal was still owed to the Football League
• Rights were returned to the Football League and were then acquired by Sky for less than 25% of the amount paid by ITV Digital
(2)
105
2437
88
25
95/6-00/01 01/2-03/4 02/3-05/6 06/7-08/9 09/10-11/12
50© Spectrum | Value Partners 2007. This document is confidential and intended solely for the use and information of the addressee
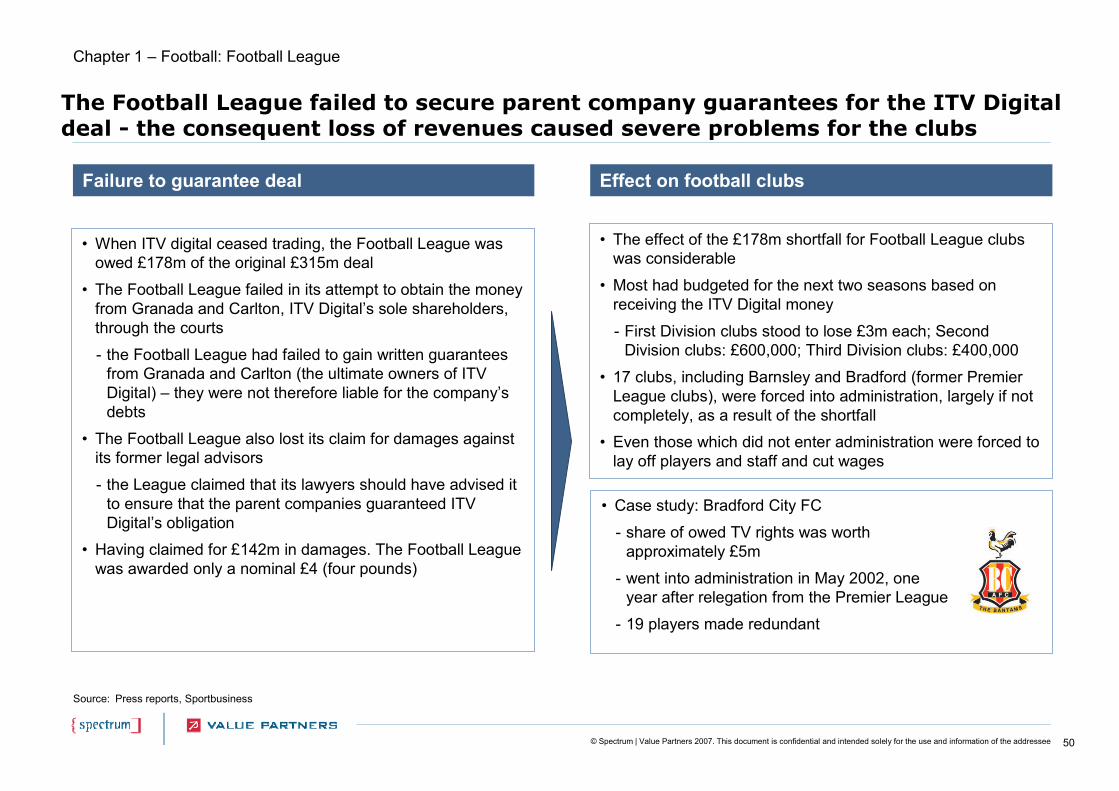
The Football League failed to secure parent company guarantees for the ITV Digital deal - the consequent loss of revenues caused severe problems for the clubs
Source: Press reports, Sportbusiness
Chapter 1 – Football: Football League
Failure to guarantee deal
• The effect of the £178m shortfall for Football League clubs was considerable
• Most had budgeted for the next two seasons based on receiving the ITV Digital money
- First Division clubs stood to lose £3m each; Second Division clubs: £600,000; Third Division clubs: £400,000
• 17 clubs, including Barnsley and Bradford (former Premier League clubs), were forced into administration, largely if not completely, as a result of the shortfall
• Even those which did not enter administration were forced to lay off players and staff and cut wages
Effect on football clubs
• When ITV digital ceased trading, the Football League was owed £178m of the original £315m deal
• The Football League failed in its attempt to obtain the money from Granada and Carlton, ITV Digital’s sole shareholders, through the courts
- the Football League had failed to gain written guarantees from Granada and Carlton (the ultimate owners of ITV Digital) – they were not therefore liable for the company’s debts
• The Football League also lost its claim for damages against its former legal advisors
- the League claimed that its lawyers should have advised it to ensure that the parent companies guaranteed ITV Digital’s obligation
• Having claimed for £142m in damages. The Football League was awarded only a nominal £4 (four pounds)
• Case study: Bradford City FC
- share of owed TV rights was worth approximately £5m
- went into administration in May 2002, one year after relegation from the Premier League
- 19 players made redundant
51© Spectrum | Value Partners 2007. This document is confidential and intended solely for the use and information of the addressee
Chapter 2 – Olympic Games
Executive summary
Chapter 1 - Football
Chapter 2 – Olympic Games
Chapter 3 – Cricket
Chapter 4 – Rugby Union
Chapter 5 – Rugby League
Chapter 6 – Formula One
Appendix
52© Spectrum | Value Partners 2007. This document is confidential and intended solely for the use and information of the addressee
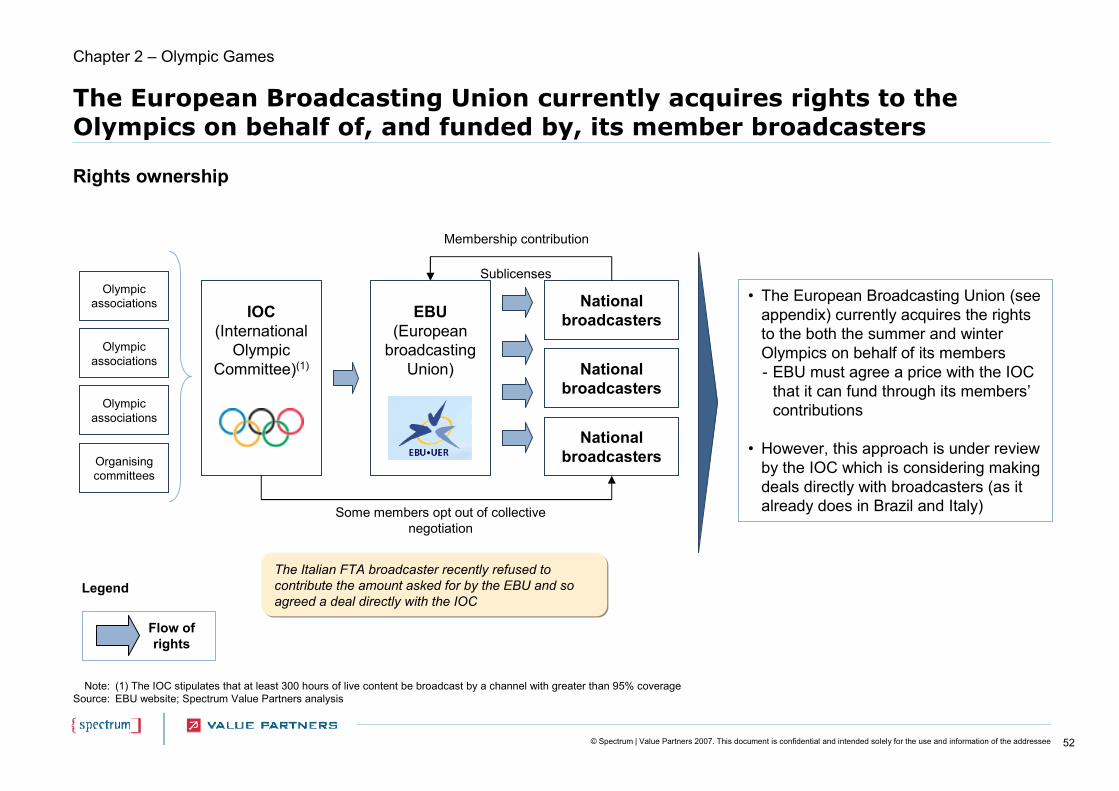
The European Broadcasting Union currently acquires rights to theOlympics on behalf of, and funded by, its member broadcasters
• The European Broadcasting Union (see appendix) currently acquires the rights to the both the summer and winter Olympics on behalf of its members- EBU must agree a price with the IOC
that it can fund through its members’contributions
• However, this approach is under review by the IOC which is considering making deals directly with broadcasters (as it already does in Brazil and Italy)
Rights ownership
Note:Source:
(1) The IOC stipulates that at least 300 hours of live content be broadcast by a channel with greater than 95% coverageEBU website; Spectrum Value Partners analysis
National broadcastersEBU
(European broadcasting
Union)
IOC(International
Olympic Committee)(1)
Membership contribution
Some members opt out of collective negotiation
Organising committees
The Italian FTA broadcaster recently refused to contribute the amount asked for by the EBU and so agreed a deal directly with the IOC
National broadcasters
National broadcasters
Chapter 2 – Olympic Games
Olympic associations
Olympic associations
Olympic associations
Sublicenses
Flow of rights
Legend
53© Spectrum | Value Partners 2007. This document is confidential and intended solely for the use and information of the addressee
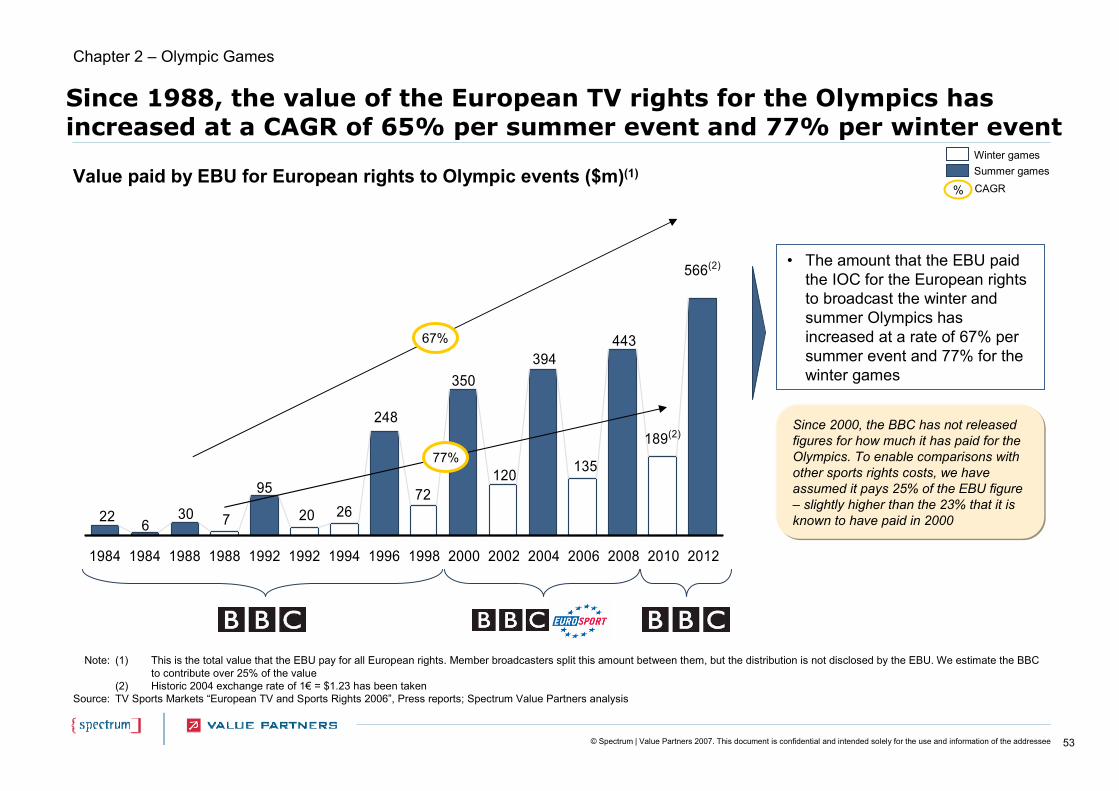
Since 1988, the value of the European TV rights for the Olympics has increased at a CAGR of 65% per summer event and 77% per winter event
• The amount that the EBU paid the IOC for the European rights to broadcast the winter and summer Olympics has increased at a rate of 67% per summer event and 77% for the winter games
Note:
Source:
(1) This is the total value that the EBU pay for all European rights. Member broadcasters split this amount between them, but the distribution is not disclosed by the EBU. We estimate the BBC to contribute over 25% of the value
(2) Historic 2004 exchange rate of 1€ = $1.23 has been takenTV Sports Markets “European TV and Sports Rights 2006”, Press reports; Spectrum Value Partners analysis
566(2)
189(2)
443
135
394
120
350
72
248
22 630
95
7 20 26
1984 1984 1988 1988 1992 1992 1994 1996 1998 2000 2002 2004 2006 2008 2010 2012
Value paid by EBU for European rights to Olympic events ($m)(1)
Chapter 2 – Olympic Games
67%
Winter gamesSummer games
% CAGR
77%
Since 2000, the BBC has not released figures for how much it has paid for the Olympics. To enable comparisons with other sports rights costs, we have assumed it pays 25% of the EBU figure – slightly higher than the 23% that it is known to have paid in 2000
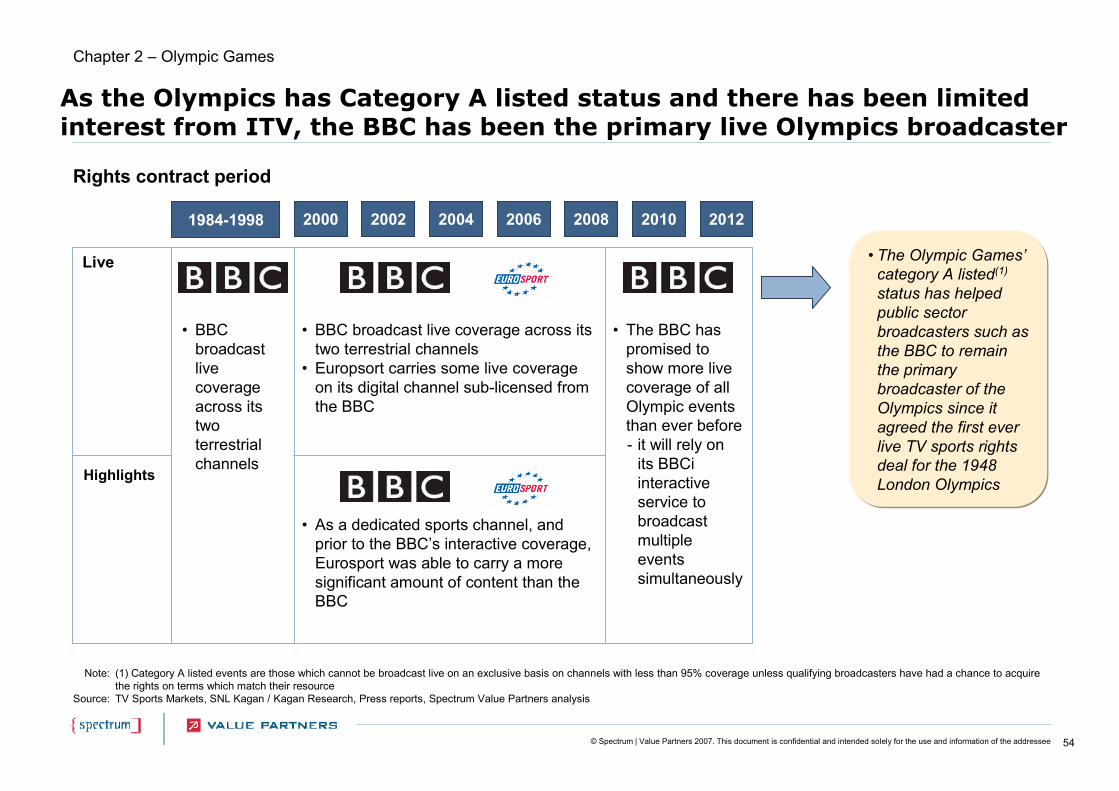
54© Spectrum | Value Partners 2007. This document is confidential and intended solely for the use and information of the addressee
As the Olympics has Category A listed status and there has been limited interest from ITV, the BBC has been the primary live Olympics broadcaster
Note:
Source:
(1) Category A listed events are those which cannot be broadcast live on an exclusive basis on channels with less than 95% coverage unless qualifying broadcasters have had a chance to acquire the rights on terms which match their resourceTV Sports Markets, SNL Kagan / Kagan Research, Press reports, Spectrum Value Partners analysis
Live
2000
Highlights
• As a dedicated sports channel, and prior to the BBC’s interactive coverage, Eurosport was able to carry a more significant amount of content than the BBC
2002 2004 2006 2008 2010 20121984-1998
• The Olympic Games’category A listed(1)
status has helped public sector broadcasters such as the BBC to remain the primary broadcaster of the Olympics since it agreed the first ever live TV sports rights deal for the 1948 London Olympics
• The BBC has promised to show more live coverage of all Olympic events than ever before- it will rely on
its BBCi interactive service to broadcast multiple events simultaneously
• BBC broadcast live coverage across its two terrestrial channels
• BBC broadcast live coverage across its two terrestrial channels
• Europsort carries some live coverage on its digital channel sub-licensed from the BBC
Chapter 2 – Olympic Games
Rights contract period

55© Spectrum | Value Partners 2007. This document is confidential and intended solely for the use and information of the addressee
The BBC’s interactive channel, BBCi, allows it to compete with its multichannel pay TV rivals in bringing comprehensive live Olympics coverage
Chapter 2 – Olympic Games
• BBCi – the BBC’s “red button” interactive functionality offers a range of additional services
Results, stats and previews• Results pages, tournament statistics, such as
medal tables and previews of upcoming events available through interactive menus
Multichannel coverage• Several feeds of content allowing
viewers to choose from multiple events
Highlights round-up• Round up of the day’s action on a
short (5-10 minute) loop• Key news items and events from the
day’s action
Note:Source:
The above example is not of Olympics red button coveragebbc.co.uk
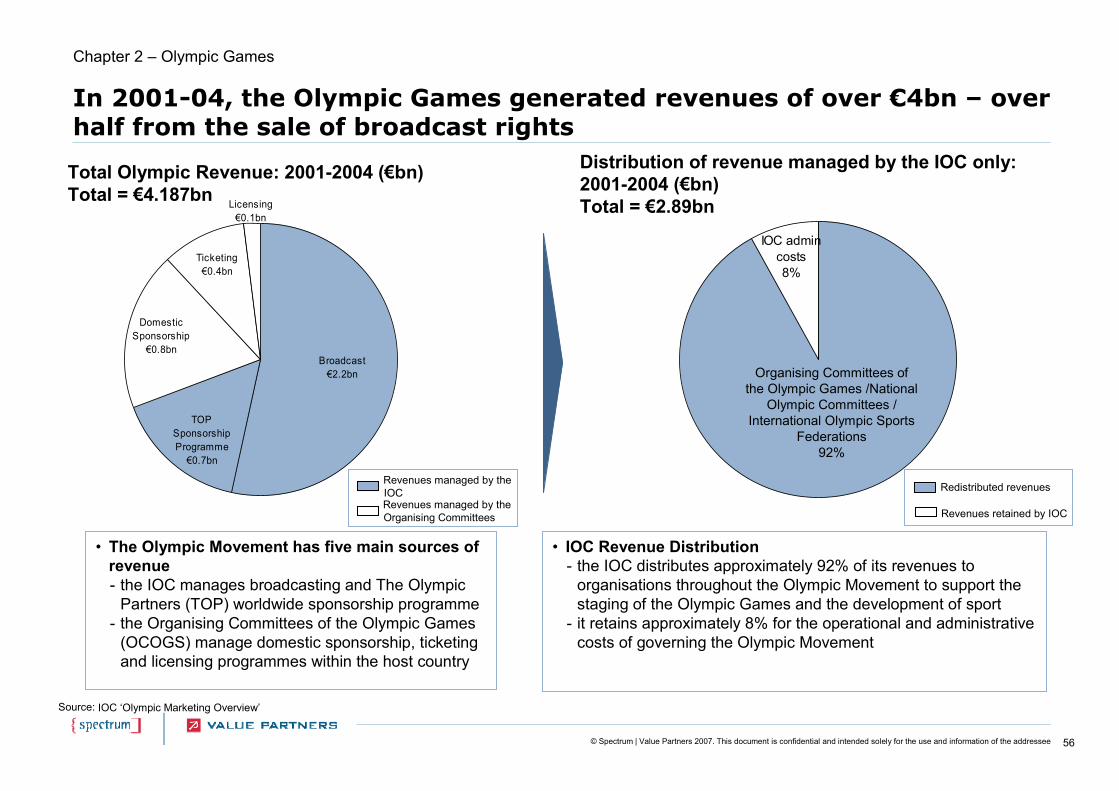
56© Spectrum | Value Partners 2007. This document is confidential and intended solely for the use and information of the addressee
In 2001-04, the Olympic Games generated revenues of over €4bn – over half from the sale of broadcast rights
• The Olympic Movement has five main sources of revenue - the IOC manages broadcasting and The Olympic
Partners (TOP) worldwide sponsorship programme- the Organising Committees of the Olympic Games
(OCOGS) manage domestic sponsorship, ticketing and licensing programmes within the host country
IOC admincosts 8%
Distribution of revenue managed by the IOC only: 2001-2004 (€bn) Total = €2.89bn
• IOC Revenue Distribution - the IOC distributes approximately 92% of its revenues to
organisations throughout the Olympic Movement to support the staging of the Olympic Games and the development of sport
- it retains approximately 8% for the operational and administrative costs of governing the Olympic Movement
Broadcast€2.2bn
TOP Sponsorship Programme
€0.7bn
Domestic Sponsorship
€0.8bn
Ticketing€0.4bn
Licensing€0.1bn
Total Olympic Revenue: 2001-2004 (€bn)Total = €4.187bn
Source: IOC ‘Olympic Marketing Overview’
Revenues managed by the IOCRevenues managed by the Organising Committees
Redistributed revenues
Revenues retained by IOC
Chapter 2 – Olympic Games
Organising Committees of the Olympic Games /National
Olympic Committees / International Olympic Sports
Federations92%
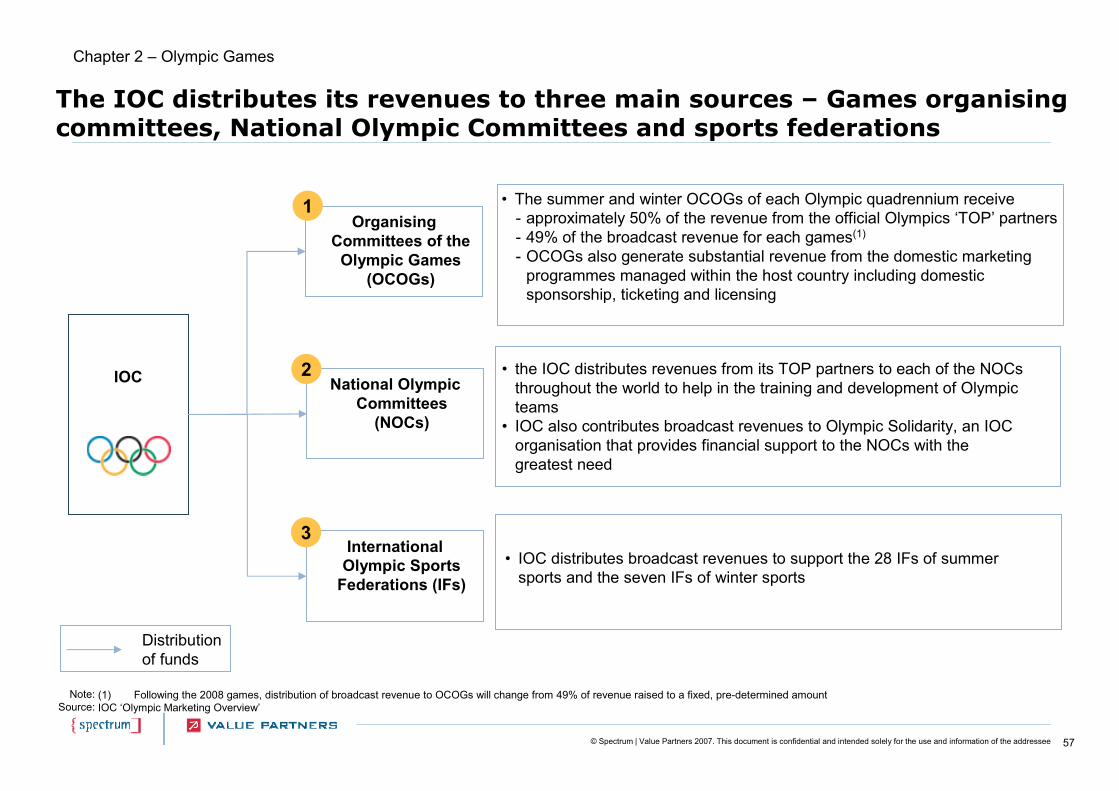
57© Spectrum | Value Partners 2007. This document is confidential and intended solely for the use and information of the addressee
The IOC distributes its revenues to three main sources – Games organising committees, National Olympic Committees and sports federations
IOC
Organising Committees of the
Olympic Games (OCOGs)
• The summer and winter OCOGs of each Olympic quadrennium receive - approximately 50% of the revenue from the official Olympics ‘TOP’ partners - 49% of the broadcast revenue for each games(1)
- OCOGs also generate substantial revenue from the domestic marketing programmes managed within the host country including domestic sponsorship, ticketing and licensing
• the IOC distributes revenues from its TOP partners to each of the NOCsthroughout the world to help in the training and development of Olympic teams
• IOC also contributes broadcast revenues to Olympic Solidarity, an IOC organisation that provides financial support to the NOCs with the greatest need
National Olympic Committees
(NOCs)
• IOC distributes broadcast revenues to support the 28 IFs of summer sports and the seven IFs of winter sports
International Olympic Sports
Federations (IFs)
Distribution of funds
Chapter 2 – Olympic Games
1
2
3
Note:Source:
(1) Following the 2008 games, distribution of broadcast revenue to OCOGs will change from 49% of revenue raised to a fixed, pre-determined amountIOC ‘Olympic Marketing Overview’
58© Spectrum | Value Partners 2007. This document is confidential and intended solely for the use and information of the addressee
Chapter 3 – Cricket
Executive summary
Chapter 1 - Football
Chapter 2 – Olympic Games
Chapter 3 – Cricket
Chapter 4 – Rugby Union
Chapter 5 – Rugby League
Chapter 6 – Formula One
Appendix
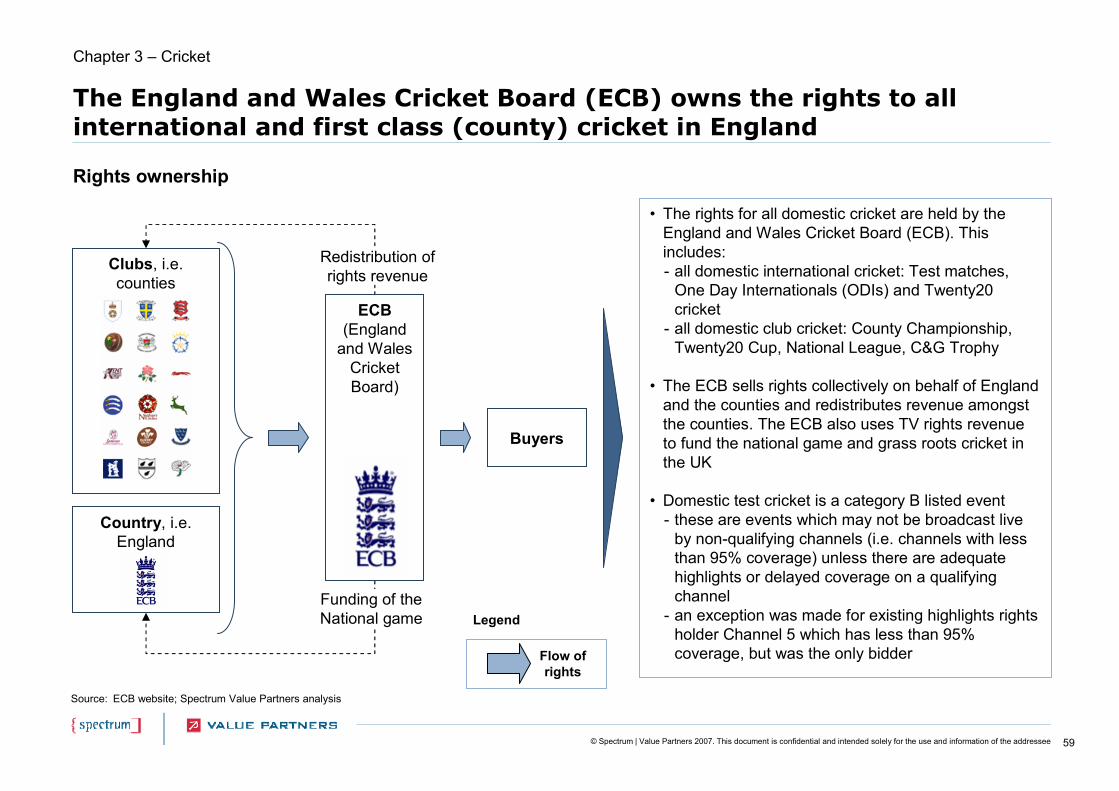
59© Spectrum | Value Partners 2007. This document is confidential and intended solely for the use and information of the addressee
The England and Wales Cricket Board (ECB) owns the rights to allinternational and first class (county) cricket in England
• The rights for all domestic cricket are held by the England and Wales Cricket Board (ECB). This includes:- all domestic international cricket: Test matches,
One Day Internationals (ODIs) and Twenty20 cricket
- all domestic club cricket: County Championship, Twenty20 Cup, National League, C&G Trophy
• The ECB sells rights collectively on behalf of England and the counties and redistributes revenue amongst the counties. The ECB also uses TV rights revenue to fund the national game and grass roots cricket in the UK
• Domestic test cricket is a category B listed event- these are events which may not be broadcast live
by non-qualifying channels (i.e. channels with less than 95% coverage) unless there are adequate highlights or delayed coverage on a qualifying channel
- an exception was made for existing highlights rights holder Channel 5 which has less than 95% coverage, but was the only bidder
Rights ownership
Chapter 3 – Cricket
Source: ECB website; Spectrum Value Partners analysis
Buyers
Clubs, i.e. counties
Redistribution of rights revenue
Funding of the National game
Country, i.e. England
ECB (England
and Wales Cricket Board)
Flow of rights
Legend
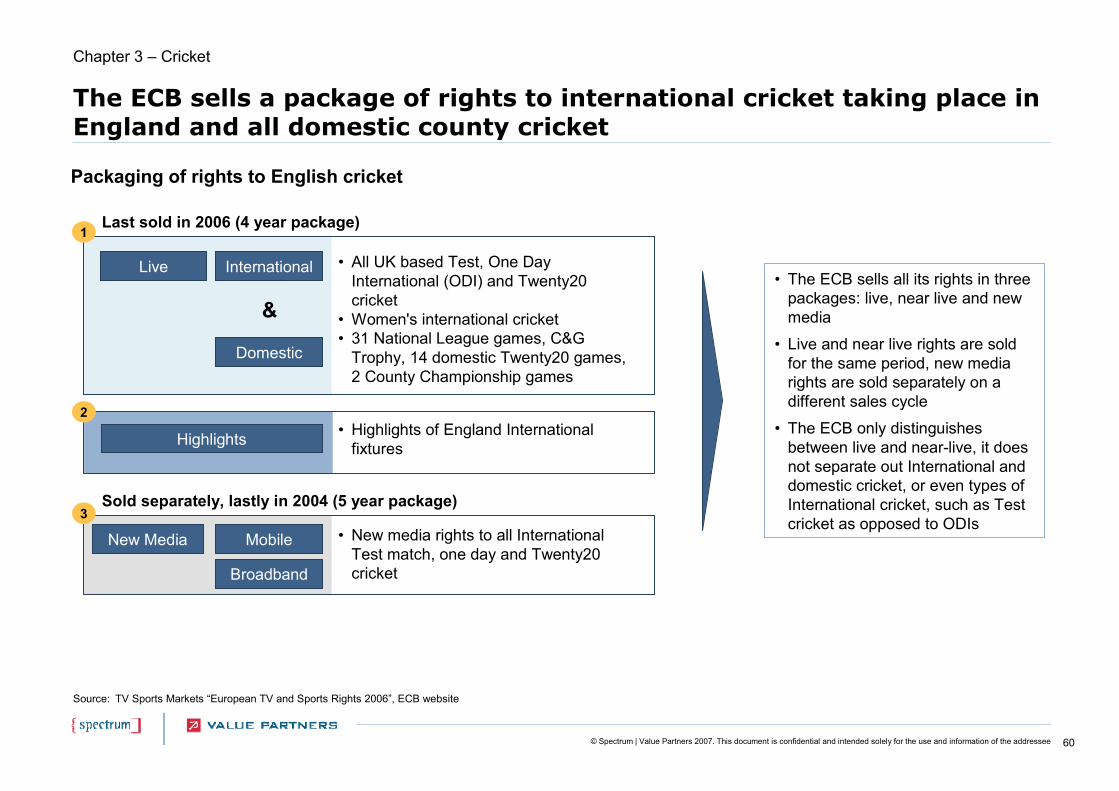
60© Spectrum | Value Partners 2007. This document is confidential and intended solely for the use and information of the addressee
The ECB sells a package of rights to international cricket taking place in England and all domestic county cricket
Source: TV Sports Markets “European TV and Sports Rights 2006”, ECB website
Packaging of rights to English cricket
• The ECB sells all its rights in three packages: live, near live and new media
• Live and near live rights are sold for the same period, new media rights are sold separately on a different sales cycle
• The ECB only distinguishes between live and near-live, it does not separate out International and domestic cricket, or even types of International cricket, such as Test cricket as opposed to ODIs
Mobile
Broadband
Live
Highlights
Sold separately, lastly in 2004 (5 year package)
• All UK based Test, One Day International (ODI) and Twenty20 cricket
• Women's international cricket• 31 National League games, C&G
Trophy, 14 domestic Twenty20 games, 2 County Championship games
• Highlights of England International fixtures
New Media
Last sold in 2006 (4 year package)
International
Domestic
• New media rights to all International Test match, one day and Twenty20 cricket
1
2
3
&
Chapter 3 – Cricket

61© Spectrum | Value Partners 2007. This document is confidential and intended solely for the use and information of the addressee
Since 1995, the value of the rights to English cricket has more than tripled
• The value of the rights to show English international and domestic cricket has increased significantly over the last 15 years
• In the rights period 2003-5, as part of Sky and Channel 4’s joint bid, Channel 4 committed to spend £13m over the three years, on on-air and off-air marketing
• The value of highlights is not disclosed, although, current rights holder (and only bidder) Five is reported to have paid a “nominal fee” for the rights to show highlights
Note:
Source:
(1) Five year New Media package (’04-’09) was sold to Vodafone and Hutchinson 3G in 2004. The package which included mobile and fixed line Internet rights was worth an undisclosed fee, estimated at ~£10m
(2) Value of the rights that the ECB holds to all domestic and international cricket. The bulk of the value lies in the rights to live test match cricket, however the split in terms of value is not known
SNL Kagan / Kagan Research, TV Sports Markets “European TV and Sports Rights 2006”, Press reports; Spectrum Value Partners analysis
15
26
4552
4
15
26
4952
95-98 99-02 03-05 06-09
LiveCommitted marketing spend
English cricket rights value per annum (£m)(1)(2)
Chapter 3 – Cricket

62© Spectrum | Value Partners 2007. This document is confidential and intended solely for the use and information of the addressee
Since 1995, the BBC, Channel 4 and, most recently, Sky have all held the rights to broadcast live Test match cricket in England
Source: TV Sports Markets, SNL Kagan / Kagan Research, Press reports, Spectrum Value Partners analysis
Live test matches
Highlights to test matches
New media (mobile and fixed line Internet
• £8.75m p.a. • All seven domestic test
matches per year
• Sky paid £52m p.a. for exclusive live coverage of all seven domestic summer tests (and other games listed below)
95-98 99-03 03-05 06-09
• £6.25m p.a.• Sky had highlight of all
seven tests
• Channel 4 shows highlights of all seven Tests• Sky shows extended highlights of the six it does not broadcast live
• As the only bidder, Five paid a “nominal” fee for daily highlights, committing to a 7.15pm-8pm timeslot
• Shared by Vodafone and Hutchinson 3G
• Channel 4 paid £13.25m p.a. for six of seven summer tests (and games listed below)
• Sky paid £12.5m p.a. for one of seven summer tests (and games listed below)
’04-’08
Chapter 3 – Cricket
Rights contract period
Other international cricket
• Sky shows exclusive live coverage of the three match early-season series (Natwest Challenge) and the 10-match triangular tournament
• Channel 4 shows highlights • Sky’s £52m p.a. exclusive deal includes all One Day and Twenty20 international games, at least 31 National League and C&G Trophy games, 14 domestic Twenty20 matches, two county championship games and women’s international cricket
Domestic cricket
• Channel 4 paid £19.7m p.a. (plus £4.3m p.a. on marketing) for six of seven summer tests (and games listed below)
• Sky paid £25m p.a. for one of seven summer tests (and games listed below)
• N/A
• N/A
• Channel 4 shows live coverage of the C&G Trophy final, semi-finals and one quarter-final, plus evening highlights. Channel 4 also shows highlights of the Twenty20 Cup finals day
• Sky shows one C&G trophy match from the third and fourth rounds and the quarter finals. It also shows live coverage of the Twenty20 Cup, the National League (30 matches per season), England Women’s and England U-19 internationals
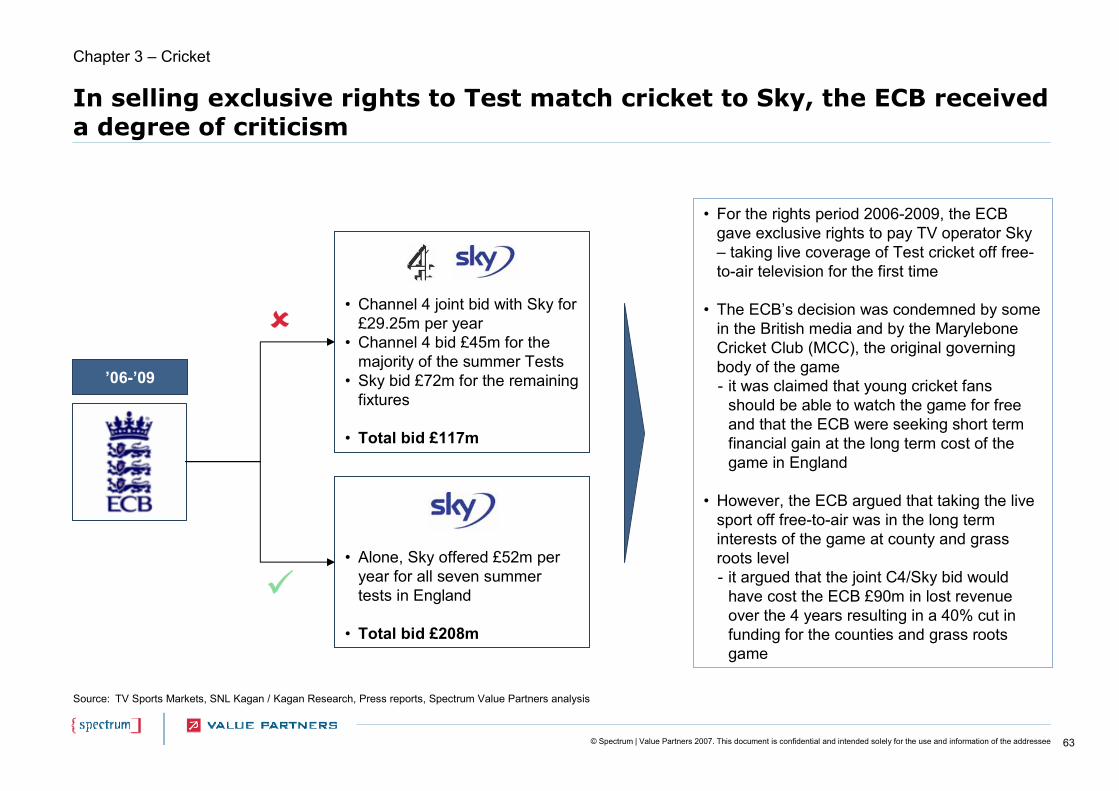
63© Spectrum | Value Partners 2007. This document is confidential and intended solely for the use and information of the addressee
In selling exclusive rights to Test match cricket to Sky, the ECB received a degree of criticism
Source: TV Sports Markets, SNL Kagan / Kagan Research, Press reports, Spectrum Value Partners analysis
’06-’09
• For the rights period 2006-2009, the ECB gave exclusive rights to pay TV operator Sky – taking live coverage of Test cricket off free-to-air television for the first time
• The ECB’s decision was condemned by some in the British media and by the Marylebone Cricket Club (MCC), the original governing body of the game- it was claimed that young cricket fans
should be able to watch the game for free and that the ECB were seeking short term financial gain at the long term cost of the game in England
• However, the ECB argued that taking the live sport off free-to-air was in the long term interests of the game at county and grass roots level- it argued that the joint C4/Sky bid would
have cost the ECB £90m in lost revenue over the 4 years resulting in a 40% cut in funding for the counties and grass roots game
• Channel 4 joint bid with Sky for £29.25m per year
• Channel 4 bid £45m for the majority of the summer Tests
• Sky bid £72m for the remaining fixtures
• Total bid £117m
• Alone, Sky offered £52m per year for all seven summer tests in England
• Total bid £208m
Chapter 3 – Cricket
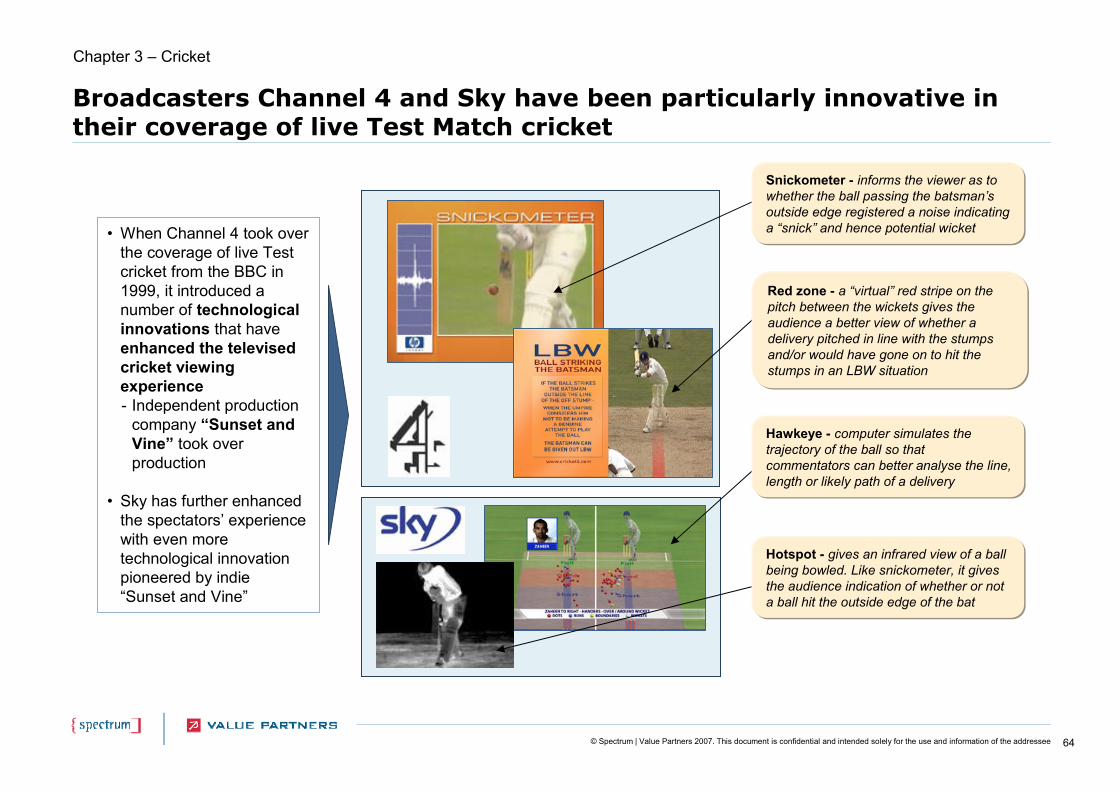
64© Spectrum | Value Partners 2007. This document is confidential and intended solely for the use and information of the addressee
Broadcasters Channel 4 and Sky have been particularly innovative in their coverage of live Test Match cricket
Chapter 3 – Cricket
• When Channel 4 took over the coverage of live Test cricket from the BBC in 1999, it introduced a number of technological innovations that have enhanced the televised cricket viewing experience- Independent production
company “Sunset and Vine” took over production
• Sky has further enhanced the spectators’ experience with even more technological innovation pioneered by indie “Sunset and Vine”
Snickometer - informs the viewer as to whether the ball passing the batsman’s outside edge registered a noise indicating a “snick” and hence potential wicket
Red zone - a “virtual” red stripe on the pitch between the wickets gives the audience a better view of whether a delivery pitched in line with the stumps and/or would have gone on to hit the stumps in an LBW situation
Hawkeye - computer simulates the trajectory of the ball so that commentators can better analyse the line, length or likely path of a delivery
Hotspot - gives an infrared view of a ball being bowled. Like snickometer, it gives the audience indication of whether or not a ball hit the outside edge of the bat
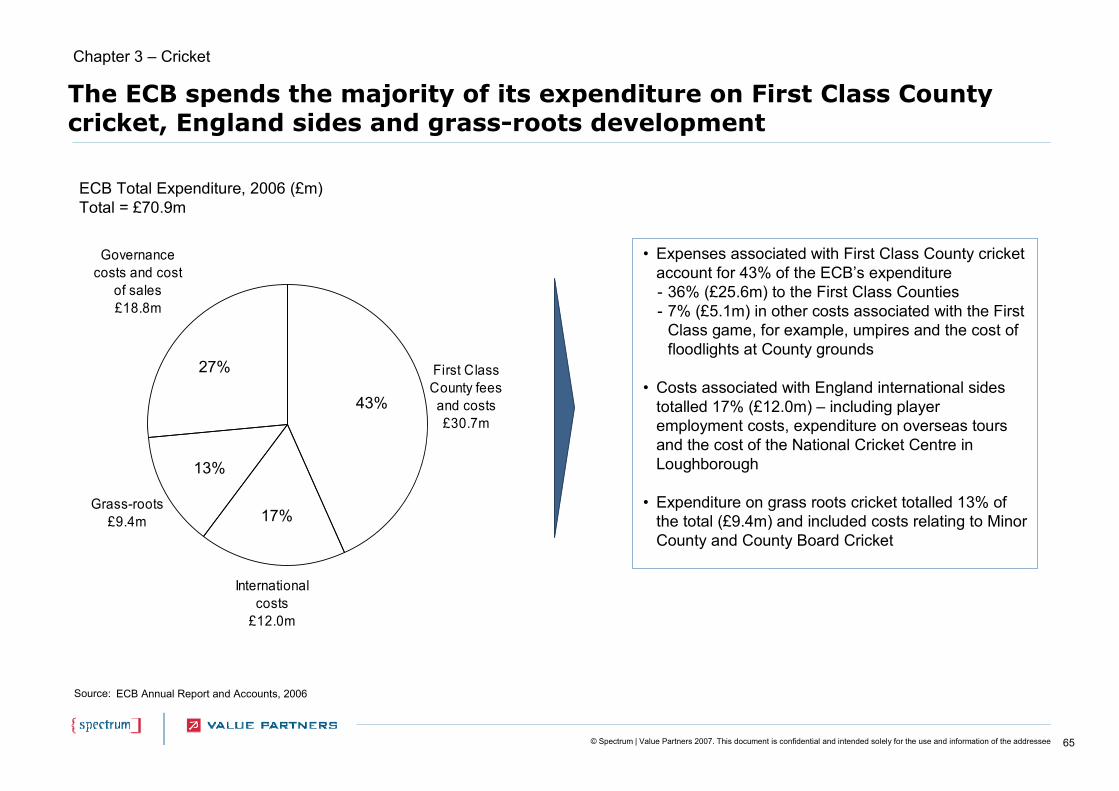
65© Spectrum | Value Partners 2007. This document is confidential and intended solely for the use and information of the addressee
Source: ECB Annual Report and Accounts, 2006
The ECB spends the majority of its expenditure on First Class County cricket, England sides and grass-roots development
• Expenses associated with First Class County cricket account for 43% of the ECB’s expenditure - 36% (£25.6m) to the First Class Counties - 7% (£5.1m) in other costs associated with the First
Class game, for example, umpires and the cost of floodlights at County grounds
• Costs associated with England international sides totalled 17% (£12.0m) – including player employment costs, expenditure on overseas tours and the cost of the National Cricket Centre in Loughborough
• Expenditure on grass roots cricket totalled 13% of the total (£9.4m) and included costs relating to Minor County and County Board Cricket
ECB Total Expenditure, 2006 (£m)Total = £70.9m
Governance costs and cost
of sales£18.8m
Grass-roots£9.4m
International costs
£12.0m
First Class County fees and costs£30.7m
27%
13%
17%
43%
Chapter 3 – Cricket
66© Spectrum | Value Partners 2007. This document is confidential and intended solely for the use and information of the addressee
Chapter 4 – Rugby Union
Executive summary
Chapter 1 - Football
Chapter 2 – Olympic Games
Chapter 3 – Cricket
Chapter 4 – Rugby Union
Chapter 5 – Rugby League
Chapter 6 – Formula One
Appendix

67© Spectrum | Value Partners 2007. This document is confidential and intended solely for the use and information of the addressee
The rights for the Six Nations are sold by the Six Nations Committee on behalf of the six member nations
• The Six Nations Committee sells rights on behalf of its six member nations
• However, in 1999, Sky did a deal directly with the English Rugby Union (RFU), so that England home games were shown exclusively on Sky- this deal caused controversy and England
were threatened with being expelled from the competition
- this threat was never carried out on the understanding that all future television deals would be negotiated collectively
• Matches involving home nations are Category B listed events- this means highlights of the fixture must be
carried by a free-to-air broadcaster who has greater than 95% coverage
Rights ownership
Chapter 4 – Rugby, Six Nations
Source: TV Sports Markets 2006; Spectrum Value Partners analysis
BuyersSix Nations Committee
WRU
FIR
SRU
IRFU
FFR
RFU
Sky
• In 1999, RFU broke away from the collective sale of rights and brokered a deal for England home games directly with Sky
• Pressure from the other nations made this sale a “one off”
National rugby unions
Flow of rights
Legend
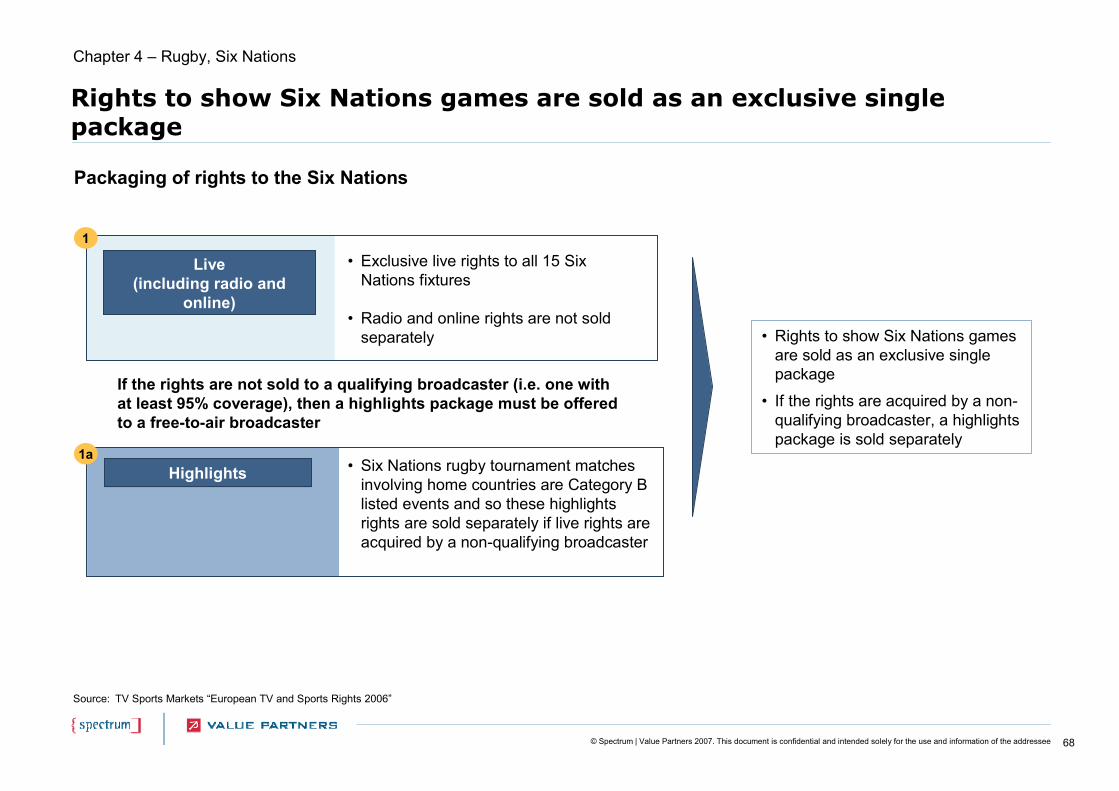
68© Spectrum | Value Partners 2007. This document is confidential and intended solely for the use and information of the addressee
Rights to show Six Nations games are sold as an exclusive singlepackage
Source: TV Sports Markets “European TV and Sports Rights 2006”
Packaging of rights to the Six Nations
Live(including radio and
online)
Highlights
• Rights to show Six Nations games are sold as an exclusive single package
• If the rights are acquired by a non-qualifying broadcaster, a highlights package is sold separately
• Exclusive live rights to all 15 Six Nations fixtures
• Radio and online rights are not sold separately
• Six Nations rugby tournament matches involving home countries are Category B listed events and so these highlights rights are sold separately if live rights are acquired by a non-qualifying broadcaster
1
1a
If the rights are not sold to a qualifying broadcaster (i.e. one with at least 95% coverage), then a highlights package must be offered to a free-to-air broadcaster
Chapter 4 – Rugby, Six Nations
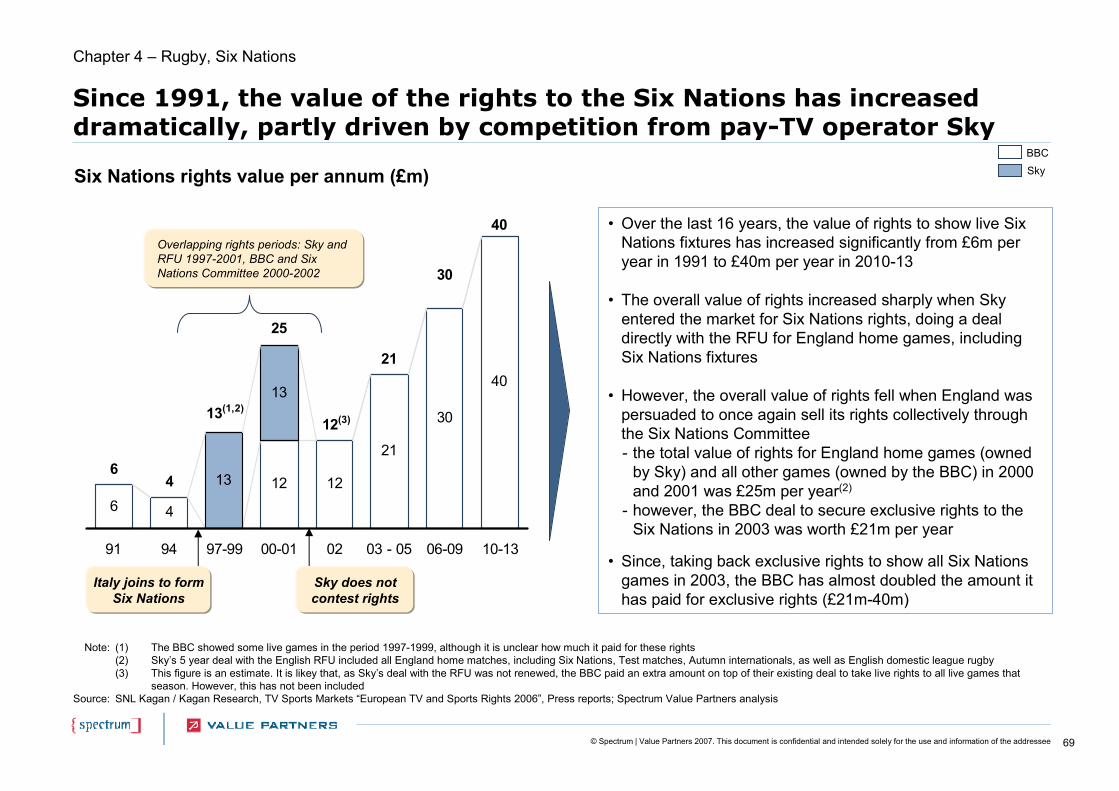
69© Spectrum | Value Partners 2007. This document is confidential and intended solely for the use and information of the addressee
Since 1991, the value of the rights to the Six Nations has increased dramatically, partly driven by competition from pay-TV operator Sky
• Over the last 16 years, the value of rights to show live Six Nations fixtures has increased significantly from £6m per year in 1991 to £40m per year in 2010-13
• The overall value of rights increased sharply when Sky entered the market for Six Nations rights, doing a deal directly with the RFU for England home games, including Six Nations fixtures
• However, the overall value of rights fell when England was persuaded to once again sell its rights collectively through the Six Nations Committee- the total value of rights for England home games (owned
by Sky) and all other games (owned by the BBC) in 2000 and 2001 was £25m per year(2)
- however, the BBC deal to secure exclusive rights to the Six Nations in 2003 was worth £21m per year
• Since, taking back exclusive rights to show all Six Nations games in 2003, the BBC has almost doubled the amount it has paid for exclusive rights (£21m-40m)
Note:
Source:
(1) The BBC showed some live games in the period 1997-1999, although it is unclear how much it paid for these rights(2) Sky’s 5 year deal with the English RFU included all England home matches, including Six Nations, Test matches, Autumn internationals, as well as English domestic league rugby(3) This figure is an estimate. It is likey that, as Sky’s deal with the RFU was not renewed, the BBC paid an extra amount on top of their existing deal to take live rights to all live games that
season. However, this has not been includedSNL Kagan / Kagan Research, TV Sports Markets “European TV and Sports Rights 2006”, Press reports; Spectrum Value Partners analysis
6 4
12 12
21
30
13
13
64
2140
30
13(1,2)
40
25
12(3)
91 94 97-99 00-01 02 03 - 05 06-09 10-13
Six Nations rights value per annum (£m)BBCSky
Italy joins to form Six Nations
Sky does not contest rights
Chapter 4 – Rugby, Six Nations
Overlapping rights periods: Sky and RFU 1997-2001, BBC and Six Nations Committee 2000-2002

70© Spectrum | Value Partners 2007. This document is confidential and intended solely for the use and information of the addressee
With the exception of the period from 1997-2001, the BBC has been the primary owner of rights to live Six Nations rugby
Source: TV Sports Markets, SNL Kagan / Kagan Research, Press reports, Spectrum Value Partners analysis
Live
Highlights
All 5/6 Nations games
-’96 ’97
BBC carried highlights of all England games that were live on Sky in this period
Rights contract period
Scotland, Wales, Ireland home games
All England home games, including 6 Nations fixtures
’98 ’99 ’00 ’01 ’02 ’03 ’04 ’05 ’06 ’07 ’08 ’09 ’10 ’11 ’12 ’13
All 6 Nations games
Chapter 4 – Rugby, Six Nations
• Sky does a deal directly with the English Rugby Union (RFU), so that England home games were exclusively shown on Sky
• This deal caused great controversy and England were threatened with being expelled from the competition
• This threat was never carried out on the understanding that all future television deals would be negotiated collectively

71© Spectrum | Value Partners 2007. This document is confidential and intended solely for the use and information of the addressee
Since regaining exclusive rights to the Six Nations in 2003, the BBC has been innovative in its presentation of the games
• The BBC has not been afraid to experiment with match schedules in order to better suit audiences
• Historically, all fixtures were played simultaneously, latterly one game was moved to Sunday to allow two games to be broadcast in a weekend
• However, since regaining exclusive rights, the BBC has been keen to experiment with kick off times to find the optimal schedule for rugby fans- “Super Saturdays” – all three teams in action on the same day at
3pm, 5pm and 8pm. The Saturday 8pm slot in particular has provedsuccessful in bringing the game to a larger prime time audience
- Sunday games – a fixture played on Sunday alleviates some of the pressure on the Saturday schedule
Chapter 4 – Rugby, Six Nations
• BBC R&D and Red Bee developed “Piero”to create a virtual stadium in which virtual players can be tracked from almost any angle
• First used in 2005, the BBC claims “Piero”gives a “greater depth to the growing wealth of analysis during broadcasts”
Experimentation with match schedules
Innovation in 3D graphical analysis

72© Spectrum | Value Partners 2007. This document is confidential and intended solely for the use and information of the addressee
Chapter 5 – Rugby League
Executive summary
Chapter 1 - Football
Chapter 2 – Olympic Games
Chapter 3 – Cricket
Chapter 4 – Rugby Union
Chapter 5 – Rugby League
Chapter 6 – Formula One
Appendix
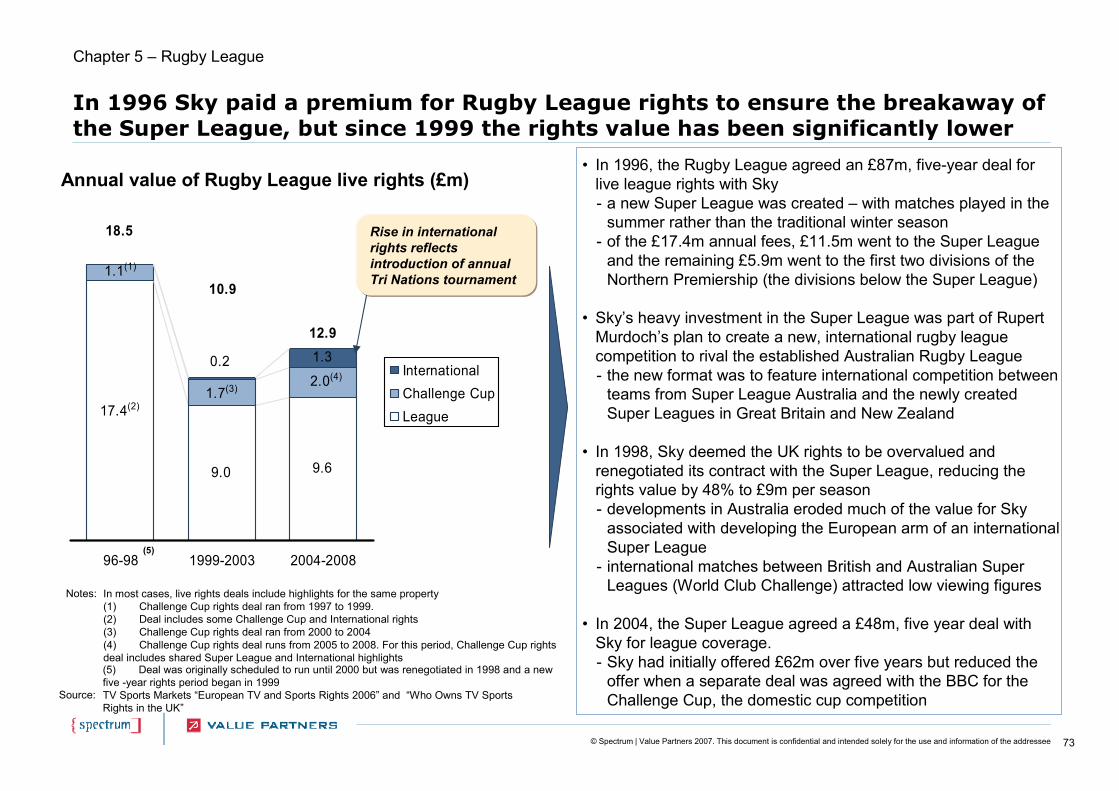
73© Spectrum | Value Partners 2007. This document is confidential and intended solely for the use and information of the addressee
In 1996 Sky paid a premium for Rugby League rights to ensure the breakaway of the Super League, but since 1999 the rights value has been significantly lower
Chapter 5 – Rugby League
• In 1996, the Rugby League agreed an £87m, five-year deal for live league rights with Sky - a new Super League was created – with matches played in the
summer rather than the traditional winter season- of the £17.4m annual fees, £11.5m went to the Super League
and the remaining £5.9m went to the first two divisions of the Northern Premiership (the divisions below the Super League)
• Sky’s heavy investment in the Super League was part of Rupert Murdoch’s plan to create a new, international rugby league competition to rival the established Australian Rugby League- the new format was to feature international competition between
teams from Super League Australia and the newly created Super Leagues in Great Britain and New Zealand
• In 1998, Sky deemed the UK rights to be overvalued and renegotiated its contract with the Super League, reducing the rights value by 48% to £9m per season- developments in Australia eroded much of the value for Sky
associated with developing the European arm of an international Super League
- international matches between British and Australian Super Leagues (World Club Challenge) attracted low viewing figures
• In 2004, the Super League agreed a £48m, five year deal with Sky for league coverage. - Sky had initially offered £62m over five years but reduced the
offer when a separate deal was agreed with the BBC for the Challenge Cup, the domestic cup competition
Annual value of Rugby League live rights (£m)
(2)
1.3
9.6
17.4(2)
9.0
1.7(3)
1.1(1)
2.0(4)0.2
18.5
10.9
12.9
96-98 1999-2003 2004-2008
InternationalChallenge CupLeague
(5)
Rise in international rights reflects introduction of annual Tri Nations tournament
Notes: In most cases, live rights deals include highlights for the same property(1) Challenge Cup rights deal ran from 1997 to 1999.(2) Deal includes some Challenge Cup and International rights (3) Challenge Cup rights deal ran from 2000 to 2004(4) Challenge Cup rights deal runs from 2005 to 2008. For this period, Challenge Cup rights deal includes shared Super League and International highlights
Source:
(5) Deal was originally scheduled to run until 2000 but was renegotiated in 1998 and a new five -year rights period began in 1999TV Sports Markets “European TV and Sports Rights 2006” and “Who Owns TV Sports Rights in the UK”
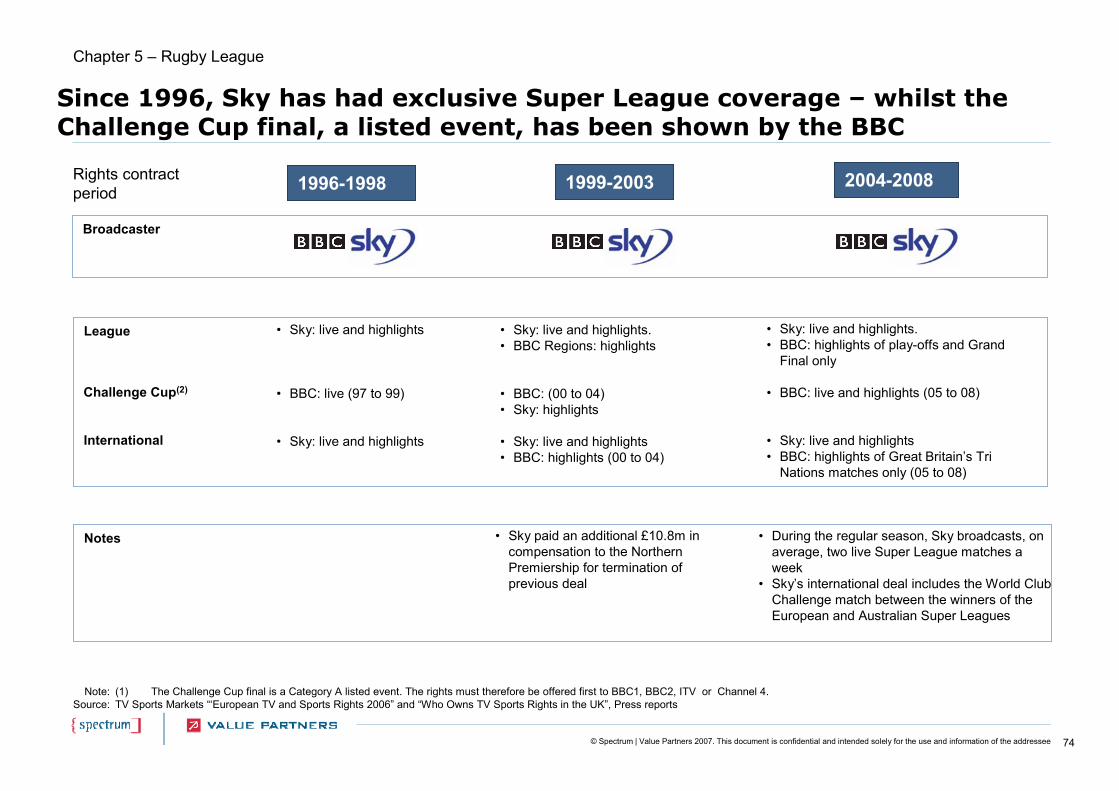
74© Spectrum | Value Partners 2007. This document is confidential and intended solely for the use and information of the addressee
Since 1996, Sky has had exclusive Super League coverage – whilst the Challenge Cup final, a listed event, has been shown by the BBC
Note:Source:
(1) The Challenge Cup final is a Category A listed event. The rights must therefore be offered first to BBC1, BBC2, ITV or Channel 4.TV Sports Markets “‘European TV and Sports Rights 2006” and “Who Owns TV Sports Rights in the UK”, Press reports
Rights contract period
2004-20081996-1998 1999-2003
Broadcaster
• Sky paid an additional £10.8m in compensation to the Northern Premiership for termination of previous deal
Notes
Chapter 5 – Rugby League
• During the regular season, Sky broadcasts, on average, two live Super League matches a week
• Sky’s international deal includes the World Club Challenge match between the winners of the European and Australian Super Leagues
• Sky: live and highlights.• BBC: highlights of play-offs and Grand
Final only
• BBC: live and highlights (05 to 08)
• Sky: live and highlights• BBC: highlights of Great Britain’s Tri
Nations matches only (05 to 08)
• Sky: live and highlights
• BBC: live (97 to 99)
• Sky: live and highlights
League • Sky: live and highlights.• BBC Regions: highlights
• BBC: (00 to 04)• Sky: highlights
• Sky: live and highlights• BBC: highlights (00 to 04)
Challenge Cup(2)
International
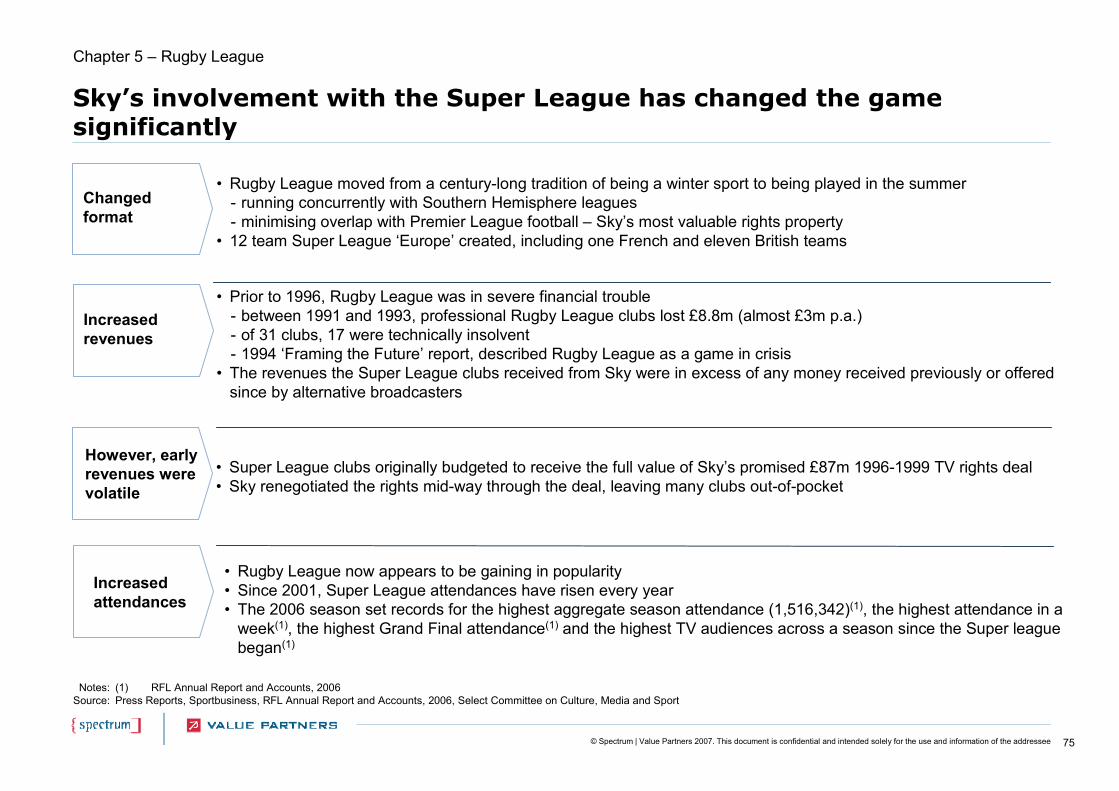
75© Spectrum | Value Partners 2007. This document is confidential and intended solely for the use and information of the addressee
Notes:Source:
(1) RFL Annual Report and Accounts, 2006Press Reports, Sportbusiness, RFL Annual Report and Accounts, 2006, Select Committee on Culture, Media and Sport
Sky’s involvement with the Super League has changed the game significantly
Chapter 5 – Rugby League
Changed format
• Rugby League moved from a century-long tradition of being a winter sport to being played in the summer- running concurrently with Southern Hemisphere leagues- minimising overlap with Premier League football – Sky’s most valuable rights property
• 12 team Super League ‘Europe’ created, including one French and eleven British teams
• Prior to 1996, Rugby League was in severe financial trouble- between 1991 and 1993, professional Rugby League clubs lost £8.8m (almost £3m p.a.)- of 31 clubs, 17 were technically insolvent- 1994 ‘Framing the Future’ report, described Rugby League as a game in crisis
• The revenues the Super League clubs received from Sky were in excess of any money received previously or offered since by alternative broadcasters
Increased revenues
• Super League clubs originally budgeted to receive the full value of Sky’s promised £87m 1996-1999 TV rights deal• Sky renegotiated the rights mid-way through the deal, leaving many clubs out-of-pocket
However, early revenues were volatile
• Rugby League now appears to be gaining in popularity• Since 2001, Super League attendances have risen every year• The 2006 season set records for the highest aggregate season attendance (1,516,342)(1), the highest attendance in a
week(1), the highest Grand Final attendance(1) and the highest TV audiences across a season since the Super league began(1)
Increased attendances
76© Spectrum | Value Partners 2007. This document is confidential and intended solely for the use and information of the addressee
Chapter 6 – Formula One
Executive summary
Chapter 1 - Football
Chapter 2 – Olympic Games
Chapter 3 – Cricket
Chapter 4 – Rugby Union
Chapter 5 – Rugby League
Chapter 6 – Formula One
Appendix
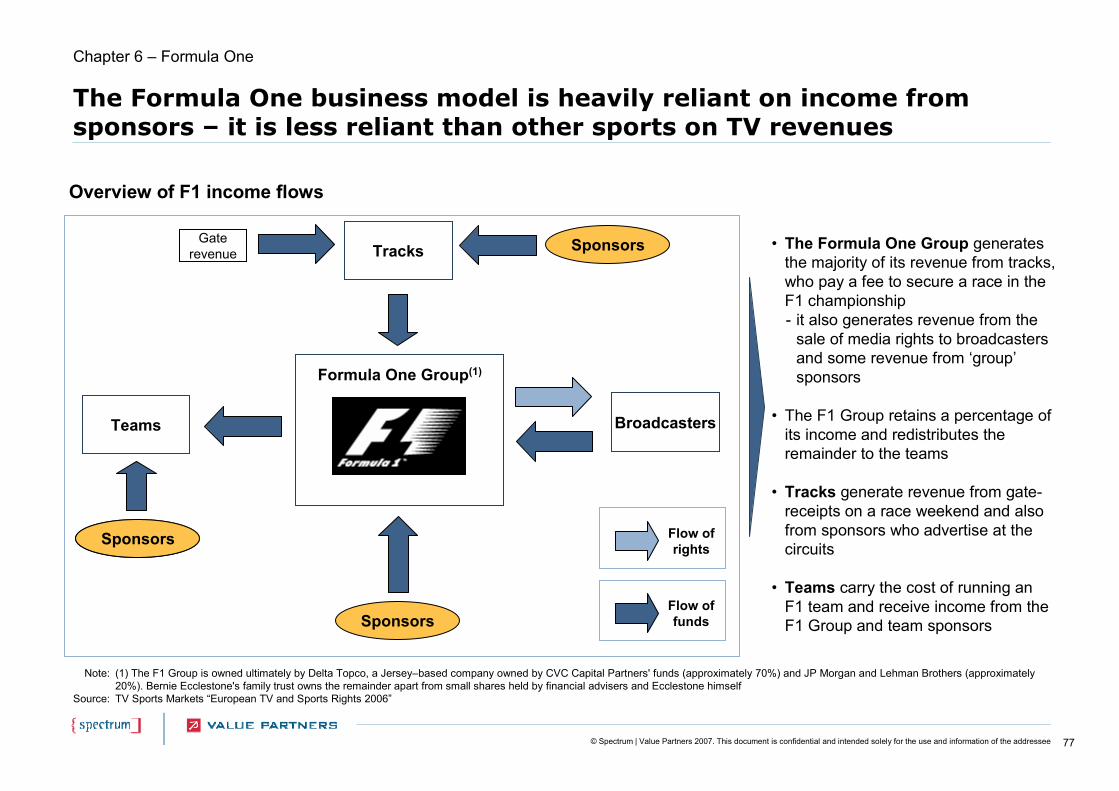
77© Spectrum | Value Partners 2007. This document is confidential and intended solely for the use and information of the addressee
The Formula One business model is heavily reliant on income fromsponsors – it is less reliant than other sports on TV revenues
• The Formula One Group generates the majority of its revenue from tracks, who pay a fee to secure a race in the F1 championship- it also generates revenue from the
sale of media rights to broadcasters and some revenue from ‘group’sponsors
• The F1 Group retains a percentage of its income and redistributes the remainder to the teams
• Tracks generate revenue from gate-receipts on a race weekend and also from sponsors who advertise at the circuits
• Teams carry the cost of running an F1 team and receive income from the F1 Group and team sponsors
Chapter 6 – Formula One
Note:
Source:
(1) The F1 Group is owned ultimately by Delta Topco, a Jersey–based company owned by CVC Capital Partners' funds (approximately 70%) and JP Morgan and Lehman Brothers (approximately 20%). Bernie Ecclestone's family trust owns the remainder apart from small shares held by financial advisers and Ecclestone himselfTV Sports Markets “European TV and Sports Rights 2006”
Broadcasters
Formula One Group(1)
Tracks
Teams
Sponsors
Sponsors
SponsorsGate revenue
Sponsors
Overview of F1 income flows
Flow of rights
Flow of funds

78© Spectrum | Value Partners 2007. This document is confidential and intended solely for the use and information of the addressee
Over the last ten years, the annual value of F1 rights in the UK has more than doubled
Annual value of F1 rights in the UK (£m)
14
19
29
1997-2001 2002-2005 2006-2010
Chapter 6 – Formula One
Source: TV Sports Markets “European TV and Sports Rights 2006”
• Over the last ten years, the annual value of the live rights to F1 in the UK has more than doubled from £14m in 1997 to £29m per year in 2006
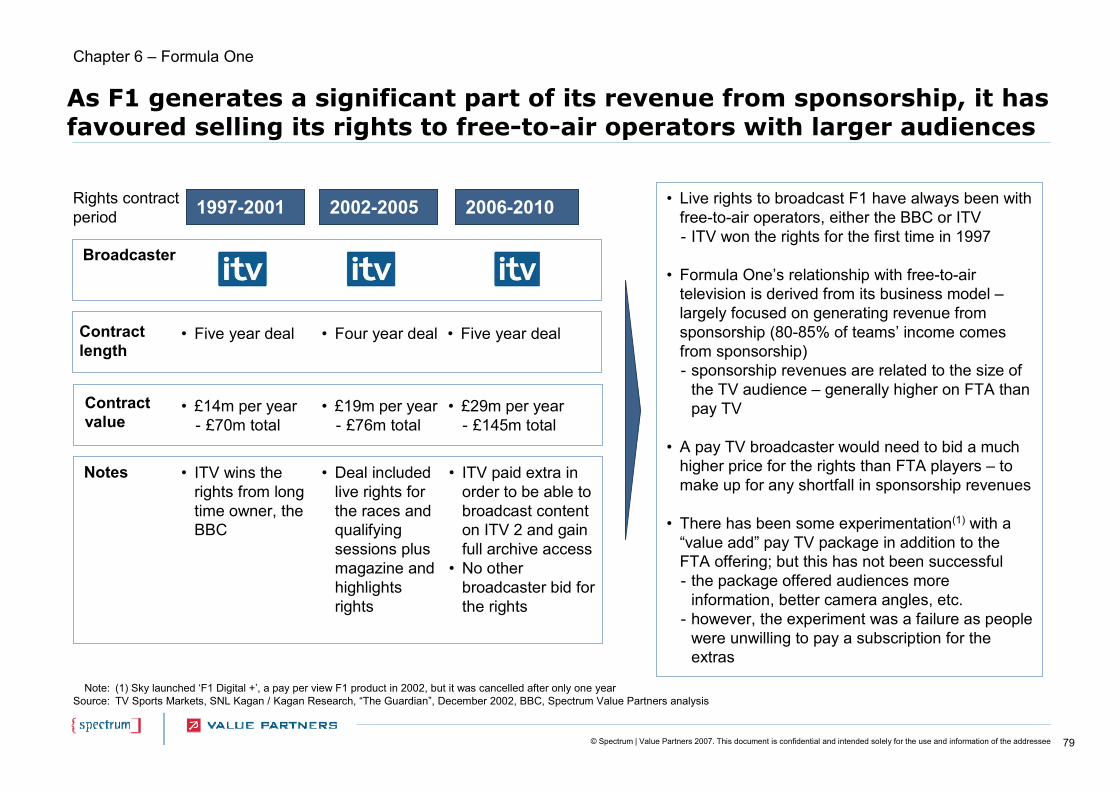
79© Spectrum | Value Partners 2007. This document is confidential and intended solely for the use and information of the addressee
As F1 generates a significant part of its revenue from sponsorship, it has favoured selling its rights to free-to-air operators with larger audiences
Note:Source:
(1) Sky launched ‘F1 Digital +’, a pay per view F1 product in 2002, but it was cancelled after only one yearTV Sports Markets, SNL Kagan / Kagan Research, “The Guardian”, December 2002, BBC, Spectrum Value Partners analysis
Rights contract period 2006-20101997-2001 2002-2005
• Five year deal• Five year deal • Four year deal
Broadcaster
Chapter 6 – Formula One
• £29m per year- £145m total
• £14m per year - £70m total
• £19m per year- £76m total
• ITV paid extra in order to be able to broadcast content on ITV 2 and gain full archive access
• No other broadcaster bid for the rights
• ITV wins the rights from long time owner, the BBC
• Deal included live rights for the races and qualifying sessions plus magazine and highlights rights
Notes
• Live rights to broadcast F1 have always been with free-to-air operators, either the BBC or ITV- ITV won the rights for the first time in 1997
• Formula One’s relationship with free-to-air television is derived from its business model –largely focused on generating revenue from sponsorship (80-85% of teams’ income comes from sponsorship)- sponsorship revenues are related to the size of
the TV audience – generally higher on FTA than pay TV
• A pay TV broadcaster would need to bid a much higher price for the rights than FTA players – to make up for any shortfall in sponsorship revenues
• There has been some experimentation(1) with a “value add” pay TV package in addition to the FTA offering; but this has not been successful- the package offered audiences more
information, better camera angles, etc.- however, the experiment was a failure as people
were unwilling to pay a subscription for the extras
Contract length
Contract value

80© Spectrum | Value Partners 2007. This document is confidential and intended solely for the use and information of the addressee
Appendix
Executive summary
Chapter 1 - Football
Chapter 2 – Olympic Games
Chapter 3 – Cricket
Chapter 4 – Rugby Union
Chapter 5 – Rugby League
Chapter 6 – Formula One
Appendix
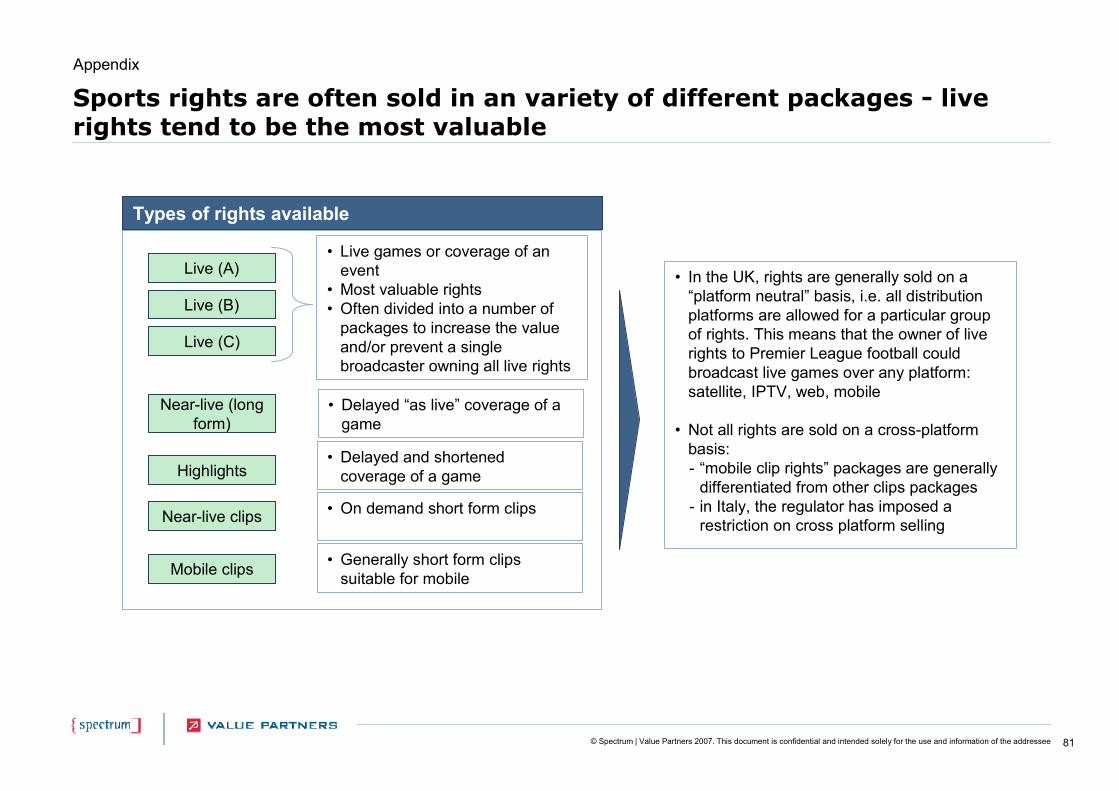
81© Spectrum | Value Partners 2007. This document is confidential and intended solely for the use and information of the addressee
Sports rights are often sold in an variety of different packages - live rights tend to be the most valuable
Live (B)
Live (C)
Live (A)
Near-live (long form)
Highlights
Mobile clips
Near-live clips
• In the UK, rights are generally sold on a “platform neutral” basis, i.e. all distribution platforms are allowed for a particular group of rights. This means that the owner of live rights to Premier League football could broadcast live games over any platform: satellite, IPTV, web, mobile
• Not all rights are sold on a cross-platform basis:- “mobile clip rights” packages are generally
differentiated from other clips packages- in Italy, the regulator has imposed a
restriction on cross platform selling
• Live games or coverage of an event
• Most valuable rights• Often divided into a number of
packages to increase the value and/or prevent a single broadcaster owning all live rights
• Delayed “as live” coverage of a game
• Delayed and shortened coverage of a game
• On demand short form clips
Appendix
Types of rights available
• Generally short form clips suitable for mobile

82© Spectrum | Value Partners 2007. This document is confidential and intended solely for the use and information of the addressee
Since 1990, the values of key properties have grown significantly, though growth since 2000 has been slower than in the 1990s
Note:
Source:
(1) CAGR = compund annual growth rate(2) Annual CAGR’s given despite events occuring on a four-yearly basis(3) BBC/ITV paid £160m for 2002/6 World Cups. Given the unattractive kick off times of fixtures for the 2002 Finals in Japan/South Korea, the value was significantly lower at £55m relative to
the following tournament in Germany which was valued at £105m(4) 25% of total EBU figure used as an estimate of UK value(5) Converted from US$ using 1:1.5 exchange rate(6) Converted from US$ using 1:2 exchange rateSpectrum / Value Partners analysis
10%40(2008)
13%25(2000)
6(1991)
Six Nations
16%669(2008/9)
31%186(1999/0)
15(1990/91)
Premier League
4%110(2010)
30%55(3)
(2002)3(1990)
World Cup(2)
3%85(2008/9)
79%65(1999/0)
2(1993/4)
Champions League
17%106(2008/9)
26%31(2000/01)
3(1990/91)
FA Cup
26(2000)
59(5)
(2000)
c.2000 value (£m)
15(1995)
5(5)
(1992)
Early 1990s value (£m)
17%
36%
CAGR(1)
9%
2%
CAGR
52(2008)
71(6)
(2012)
Current value (£m)
Cricket
Summer Olympics(2)(4)
Sport
Appendix
83© Spectrum | Value Partners 2007. This document is confidential and intended solely for the use and information of the addressee
The EBU is a broadcasting union that represents the collective interest of broadcasters in Europe
• The European Broadcasting Union is the largest association of national broadcasters in the world
• The EBU “works to ensure that the crucial role of public service broadcasters is recognised and taken into consideration by decision-makers”(1)
- it promotes cooperation between broadcasters and facilitates the exchange of audiovisual content
• As of July 6, 2007, the EBU had 75 active members from 56 countries, and 43 associate members from a further 25. Members are radio and television companies, most of which are government-owned public service broadcasters or privately owned stations with public missions - the UK has two members: the BBC (founder member, member since 1950) and UK Independent Broadcasting (UKIB)
(member since 1959). the UKIB is an affiliation of British independent television production companies and broadcasters, whose primary function is to
represent non-BBC broadcasters’ interests at the EBU. Its members include ITV and Channel 4
• The EBU acquires rights to major sporting events, such as the Olympics and the Tour de France and makes events available to its members, in return receiving a contribution from broadcasters- the EBU also assists its members on technical issues and runs the “Eurovision” network, responsible for, amongst other things,
the pan-European Eurovision Song Contest
• In the UK, the BBC is the primary licensee for sports rights acquired by the EBU as a result of its public service broadcaster (PSB) status and long-term relationship with the Union
• Members are allowed to sub-license rights to other broadcasters based on a series of guidelines set by the EBU, as is the case with Eurosport and the BBC in the UK
Note:Source:
(1) EBU websiteEBU website, bbc.co.uk
Appendix

84© Spectrum | Value Partners 2007. This document is confidential and intended solely for the use and information of the addressee
Contact information
SydneyKing Street Wharf, Suite 30245 Lime StreetSydney NSW 2000AustraliaTel. +61 2 9279 0072Fax +61 2 9279 0551
Mumbai8° floor, C blockDevchand House, Shiv Sagar EstateDr. Annie Besant RoadWorli, 400 018Tel. +91 22 6611 9700 Fax +91 22 6611 9988
[email protected]@spectrumstrategy.com
[email protected]@spectrumstrategy.com
Singapore7 Temasek BoulevardSuntec Tower One #26-04038987Tel. +65 6820 3388Fax +65 6820 3389
ShanghaiFortune Gate office building, Unit 02, 25/F1701 Beijing Rd (W)200040 Tel. +86 21 6132 4230Fax +86 21 6132 4238
San PaoloRua Padre João Manuel 7551° e 2° andares - cj. 11, 12 e 21Cerqueria CesarSan Paolo - BrasileCEP 01411 - 001Tel. +55 11 306 809 99Fax +55 11 308 141 38
New DelhiLevel 4, Augusta PointGurgaon, 122002Haryana, India Tel. +91 124 435 4236Fax +91 124 435 4001
IstanbulSunplazaDereboyu Sk. No:24 Maslak34398 Istanbul – Turchia Tel. +90 212 276 98 86
Hong KongRoom 2602, 26/F, Vicwood Plaza,199 Des Voeux Road. Central Hong KongTel. + 852 2103 1000Fax + 852 2805 1310
Buenos AiresAlicia Moreau de Justo 550 - 4 PisoC1107AAL Buenos Aires - ArgentinaTel. +54 11 4314 4222Fax +54 11 4314 6111
BarcelonaPasseig de Gracia 12, 1er pis08007 BarcelonaSpain Tel. +34 93 492 0370Fax +34 93 492 0351
RomeVia di Porta Pinciana 100187 RomeTel. +39 06 697 6481Fax +39 06 697 648 51
LondonGreencoat HouseFrancis StreetLondonSW1P 1DHTel. +44 (0) 20 7630 1400Fax +44 (0) 20 7630 7011
MilanVia G. Leopardi 3220123 MilanTel. +39 02 485 481Fax +39 02 480 090 10
www.spectrumstrategy.comwww.valuepartners.com