summary of total expenditures by function (all funds) · summary of total expenditures by function...
TRANSCRIPT
USD# 247
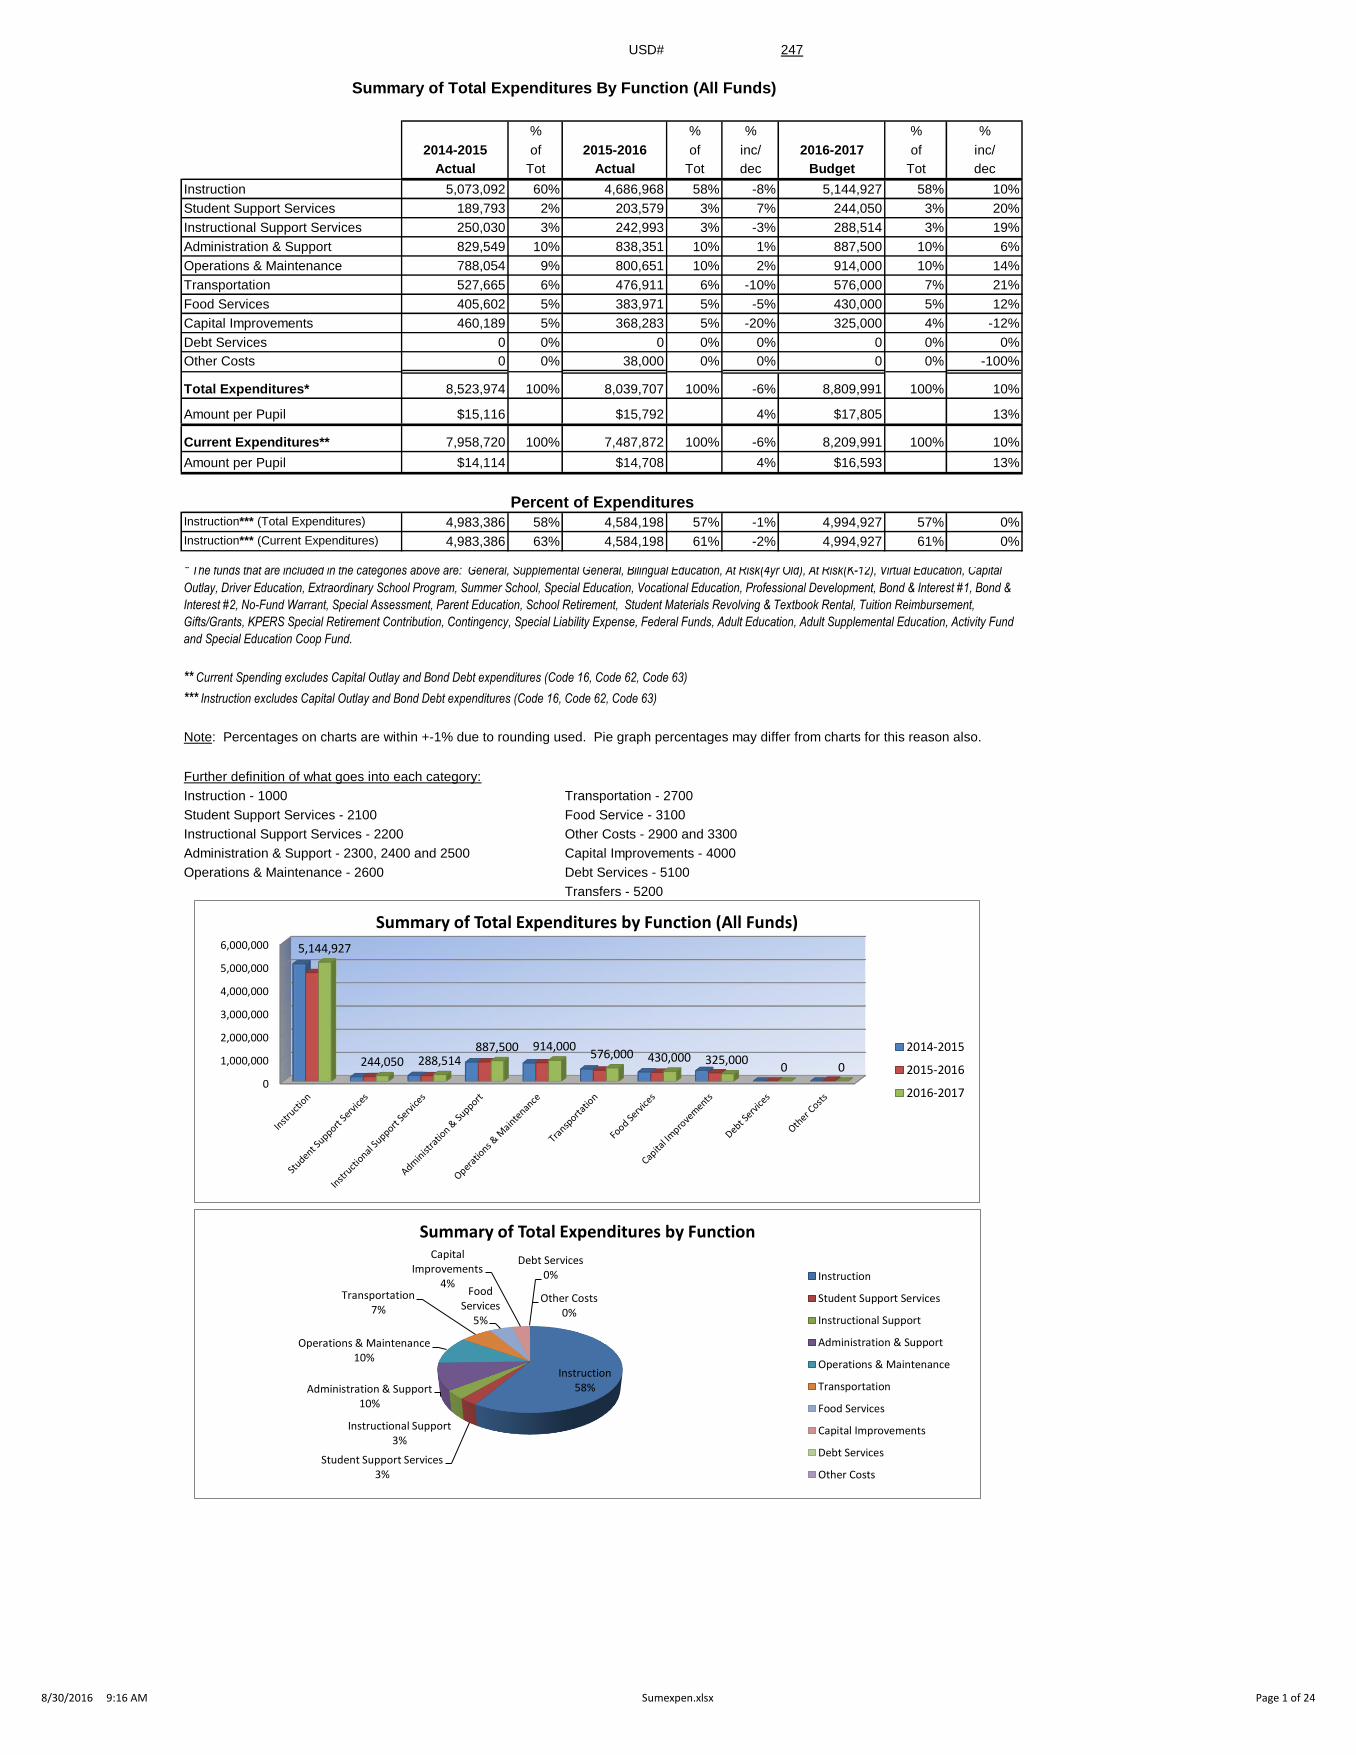
Summary of Total Expenditures By Function (All Funds)
% % % % %
2014-2015 of 2015-2016 of inc/ 2016-2017 of inc/
Actual Tot Actual Tot dec Budget Tot dec
Instruction 5,073,092 60% 4,686,968 58% -8% 5,144,927 58% 10%
Student Support Services 189,793 2% 203,579 3% 7% 244,050 3% 20%
Instructional Support Services 250,030 3% 242,993 3% -3% 288,514 3% 19%
Administration & Support 829,549 10% 838,351 10% 1% 887,500 10% 6%
Operations & Maintenance 788,054 9% 800,651 10% 2% 914,000 10% 14%
Transportation 527,665 6% 476,911 6% -10% 576,000 7% 21%
Food Services 405,602 5% 383,971 5% -5% 430,000 5% 12%
Capital Improvements 460,189 5% 368,283 5% -20% 325,000 4% -12%
Debt Services 0 0% 0 0% 0% 0 0% 0%
Other Costs 0 0% 38,000 0% 0% 0 0% -100%
Total Expenditures* 8,523,974 100% 8,039,707 100% -6% 8,809,991 100% 10%
Amount per Pupil $15,116 $15,792 4% $17,805 13%
Current Expenditures** 7,958,720 100% 7,487,872 100% -6% 8,209,991 100% 10%
Amount per Pupil $14,114 $14,708 4% $16,593 13%
Instruction*** (Total Expenditures) 4,983,386 58% 4,584,198 57% -1% 4,994,927 57% 0%
Instruction*** (Current Expenditures) 4,983,386 63% 4,584,198 61% -2% 4,994,927 61% 0%
Note: Percentages on charts are within +-1% due to rounding used. Pie graph percentages may differ from charts for this reason also.
Further definition of what goes into each category:
Instruction - 1000 Transportation - 2700
Student Support Services - 2100 Food Service - 3100
Instructional Support Services - 2200 Other Costs - 2900 and 3300
Administration & Support - 2300, 2400 and 2500 Capital Improvements - 4000
Operations & Maintenance - 2600 Debt Services - 5100
Transfers - 5200
Percent of Expenditures
* The funds that are included in the categories above are: General, Supplemental General, Bilingual Education, At Risk(4yr Old), At Risk(K-12), Virtual Education, Capital
Outlay, Driver Education, Extraordinary School Program, Summer School, Special Education, Vocational Education, Professional Development, Bond & Interest #1, Bond &
Interest #2, No-Fund Warrant, Special Assessment, Parent Education, School Retirement, Student Materials Revolving & Textbook Rental, Tuition Reimbursement,
Gifts/Grants, KPERS Special Retirement Contribution, Contingency, Special Liability Expense, Federal Funds, Adult Education, Adult Supplemental Education, Activity Fund
and Special Education Coop Fund.
*** Instruction excludes Capital Outlay and Bond Debt expenditures (Code 16, Code 62, Code 63)
** Current Spending excludes Capital Outlay and Bond Debt expenditures (Code 16, Code 62, Code 63)
0
1,000,000
2,000,000
3,000,000
4,000,000
5,000,000
6,000,000 5,144,927
244,050 288,514 887,500 914,000
576,000 430,000 325,000 0 0
Summary of Total Expenditures by Function (All Funds)
2014-2015
2015-2016
2016-2017
Instruction 58%
Student Support Services 3%
Instructional Support 3%
Administration & Support 10%
Operations & Maintenance 10%
Transportation 7%
Food Services
5%
Capital Improvements
4%
Debt Services 0%
Other Costs 0%
Summary of Total Expenditures by Function
Instruction
Student Support Services
Instructional Support
Administration & Support
Operations & Maintenance
Transportation
Food Services
Capital Improvements
Debt Services
Other Costs
8/30/2016 9:16 AM Sumexpen.xlsx Page 1 of 24

USD# 247
Summary of General Fund Expenditures
by Function
% % % % %
2014-2015 of 2015-2016 of inc/ 2016-2017 of inc/
Actual Tot Actual Tot dec Budget Tot dec
Instruction 1,482,601 39% 1,435,860 39% -3% 1,602,109 40% 12%
Student Support 155,635 4% 164,815 4% 6% 181,500 4% 10%
Instructional Support 230,809 6% 221,777 6% -4% 242,500 6% 9%
Administration & Support 777,056 20% 785,526 21% 1% 810,100 20% 3%
Operations & Maintenance 745,204 20% 709,665 19% -5% 791,500 20% 12%
Transportation 418,077 11% 372,619 10% -11% 415,750 10% 12%
Capital Improvements 0 0% 0 0% 0% 0 0% 0%
Other Costs 0 0% 0 0% 0% 0 0% 0%
Total Expenditures 3,809,382 100% 3,690,262 100% -3% 4,043,459 100% 10%
Amount per Pupil $6,755 $7,249 7% $8,172 13%
The Summary of General Fund Expenditures chart information comes from pages 6-13 and only uses the 'General Fund' line items.
0
200,000
400,000
600,000
800,000
1,000,000
1,200,000
1,400,000
1,600,000
1,800,000
Instruction StudentSupport
InstructionalSupport
Administration& Support
Operations &Maintenance
Transportation CapitalImprovements
Other Costs
1,602,109
181,500 242,500
810,100 791,500
415,750
0 0
Summary of General Fund Expenditures
2014-2015
2015-2016
2016-2017
Instruction 40%
Student Support 4% Instructional Support
6%
Administration & Support 20%
Operations & Maintenance 20%
Transportation 10%
Capital Improvements 0%
Other Costs 0%
Summary of General Fund Expenditures by Function
Instruction
Student Support
Instructional Support
Administration & Support
Operations & Maintenance
Transportation
Capital Improvements
Other Costs
8/30/2016 9:16 AM Sumexpen.xlsx Page 2 of 24

USD# 247
Summary of Supplemental General Fund Expenditures
by Function
% % % % %
2014-2015 of 2015-2016 of inc/ 2016-2017 of inc/
Actual Tot Actual Tot dec Budget Tot dec
Instruction 1,343,889 100% 1,158,535 100% -14% 1,174,619 100% 1%
Student Support 0 0% 0 0% 0% 0 0% 0%
Instructional Support 0 0% 0 0% 0% 0 0% 0%
Administration & Support 0 0% 0 0% 0% 0 0% 0%
Operations & Maintenance 3,230 0% 0 0% -100% 0 0% 0%
Transportation 0 0% 0 0% 0% 0 0% 0%
Capital Improvements 0 0% 0 0% 0% 0 0% 0%
Other Costs 0 0% 0 0% 0% 0 0% 0%
Total Expenditures 1,347,119 100% 1,158,535 100% -14% 1,174,619 100% 1%
Amount per Pupil $2,389 $2,276 -5% $2,374 4%
The Summary of Supplemental General Fund Expenditures chart information comes from pages 6-13 and only uses the 'Supplemental
General Fund' line items.
0
200,000
400,000
600,000
800,000
1,000,000
1,200,000
1,400,000
Instruction StudentSupport
InstructionalSupport
Administration& Support
Operations &Maintenance
Transportation CapitalImprovements
Other Costs
1,174,619
0 0 0 0 0 0 0
Summary of Supplemental General Expenditures by Function
2014-2015
2015-2016
2016-2017
Instruction 100%
Student Support
0% Instructional Support
0% Administration & Support
0%
Operations & Maintenance
0%
Transportation 0%
Capital Improvements 0%
Other Costs 0%
Summary of Supplemental General Fund Expenditures by Function
Instruction
Student Support
Instructional Support
Administration & Support
Operations & Maintenance
Transportation
Capital Improvements
Other Costs
8/30/2016 9:16 AM Sumexpen.xlsx Page 3 of 24

USD# 247
Summary of General and Supplemental General Fund
Expenditures by Function
% % % % %
2014-2015 of 2015-2016 of inc/ 2016-2017 of inc/
Actual Tot Actual Tot dec Budget Tot dec
Instruction 2,826,490 55% 2,594,395 54% -8% 2,776,728 53% 7%
Student Support 155,635 3% 164,815 3% 6% 181,500 3% 10%
Instructional Support 230,809 4% 221,777 5% -4% 242,500 5% 9%
Administration & Support 777,056 15% 785,526 16% 1% 810,100 16% 3%
Operations & Maintenance 748,434 15% 709,665 15% -5% 791,500 15% 12%
Transportation 418,077 8% 372,619 8% -11% 415,750 8% 12%
Capital Improvements 0 0% 0 0% 0% 0 0% 0%
Other Costs 0 0% 0 0% 0% 0 0% 0%
Total Expenditures 5,156,501 100% 4,848,797 100% -6% 5,218,078 100% 8%
Amount per Pupil $9,144 $9,524 4% $10,546 11%
The Summary of General and Supplemental General Fund Expenditures chart information comes from pages 6-13 of the Sumexpen
and adds together the 'General Fund' and 'Supplemental General Fund' line items.
0
500,000
1,000,000
1,500,000
2,000,000
2,500,000
3,000,000
Instruction StudentSupport
InstructionalSupport
Administration& Support
Operations &Maintenance
Transportation CapitalImprovements
Other Costs
2,82
6,49
0
155,
635
230,
809
777,
056
748,
434
418,
077
0 0
2,59
4,39
5
164,
815
221,
777
785,
526
709,
665
372,
619
0 0
2,77
6,72
8
181,
500
242,
500
810,
100
791,
500
415,
750
0 0
Summary of General and Supplemental General Fund Expenditures by Function
2014-2015
2015-2016
2016-2017
Instruction 53%
Student Support 3%
Instructional Support 5%
Administration & Support 16%
Operations & Maintenance 15%
Transportation 8%
Capital Improvements 0%
Other Costs 0%
Summary of General and Supplemental General Fund Expenditures by Function
Instruction
Student Support
Instructional Support
Administration & Support
Operations & Maintenance
Transportation
Capital Improvements
Other Costs
8/30/2016 9:16 AM Sumexpen.xlsx Page 4 of 24

USD# 247
Summary of Special Education Fund
by Function
% % % % %
2014-2015 of 2015-2016 of inc/ 2016-2017 of inc/
Actual Tot Actual Tot dec Budget Tot dec
Instruction 890,981 93% 848,996 94% -5% 923,929 92% 9%
Student Support 0 0% 0 0% 0% 0 0% 0%
Instructional Support 0 0% 0 0% 0% 0 0% 0%
Administraton & Support 0 0% 0 0% 0% 0 0% 0%
Operations & Maintenance 0 0% 0 0% 0% 0 0% 0%
Transportation 67,419 7% 55,973 6% -17% 75,750 8% 35%
Capital Improvements 0 0% 0 0% 0% 0 0% 0%
Other Costs 0 0% 0 0% 0% 0 0% 0%
Total Expenditures 958,400 100% 904,969 100% -6% 999,679 100% 10%
Amount per Pupil $1,700 $1,778 5% $2,020 14%
The Summary of Special Education Fund Expenditures chart information comes from pages 6-13 and only uses the 'Special Education Fund'
line items. (Total expenditures excludes Special Ed Coop Fund because it would include expenditures for all schools participating in the Coop.)
0
100,000
200,000
300,000
400,000
500,000
600,000
700,000
800,000
900,000
1,000,000
Instruction StudentSupport
InstructionalSupport
Administraton& Support
Operations &Maintenance
Transportation CapitalImprovements
Other Costs
890,
981
0 0 0 0
67,4
19
0 0
848,
996
0 0 0 0
55,9
73
0 0
923,
929
0 0 0 0
75,7
50
0 0
Summary of Special Education Fund Expenditures by Function
2014-2015
2015-2016
2016-2017
Instruction 92%
Student Support 0%
Instructional Support
0%
Administraton & Support 0%
Operations & Maintenance 0%
Transportation 8%
Capital Improvements 0%
Other Costs
0%
Summary of Special Education Fund by Function
Instruction
Student Support
Instructional Support
Administraton & Support
Operations & Maintenance
Transportation
Capital Improvements
Other Costs
8/30/2016 9:16 AM Sumexpen.xlsx Page 5 of 24
USD# 247
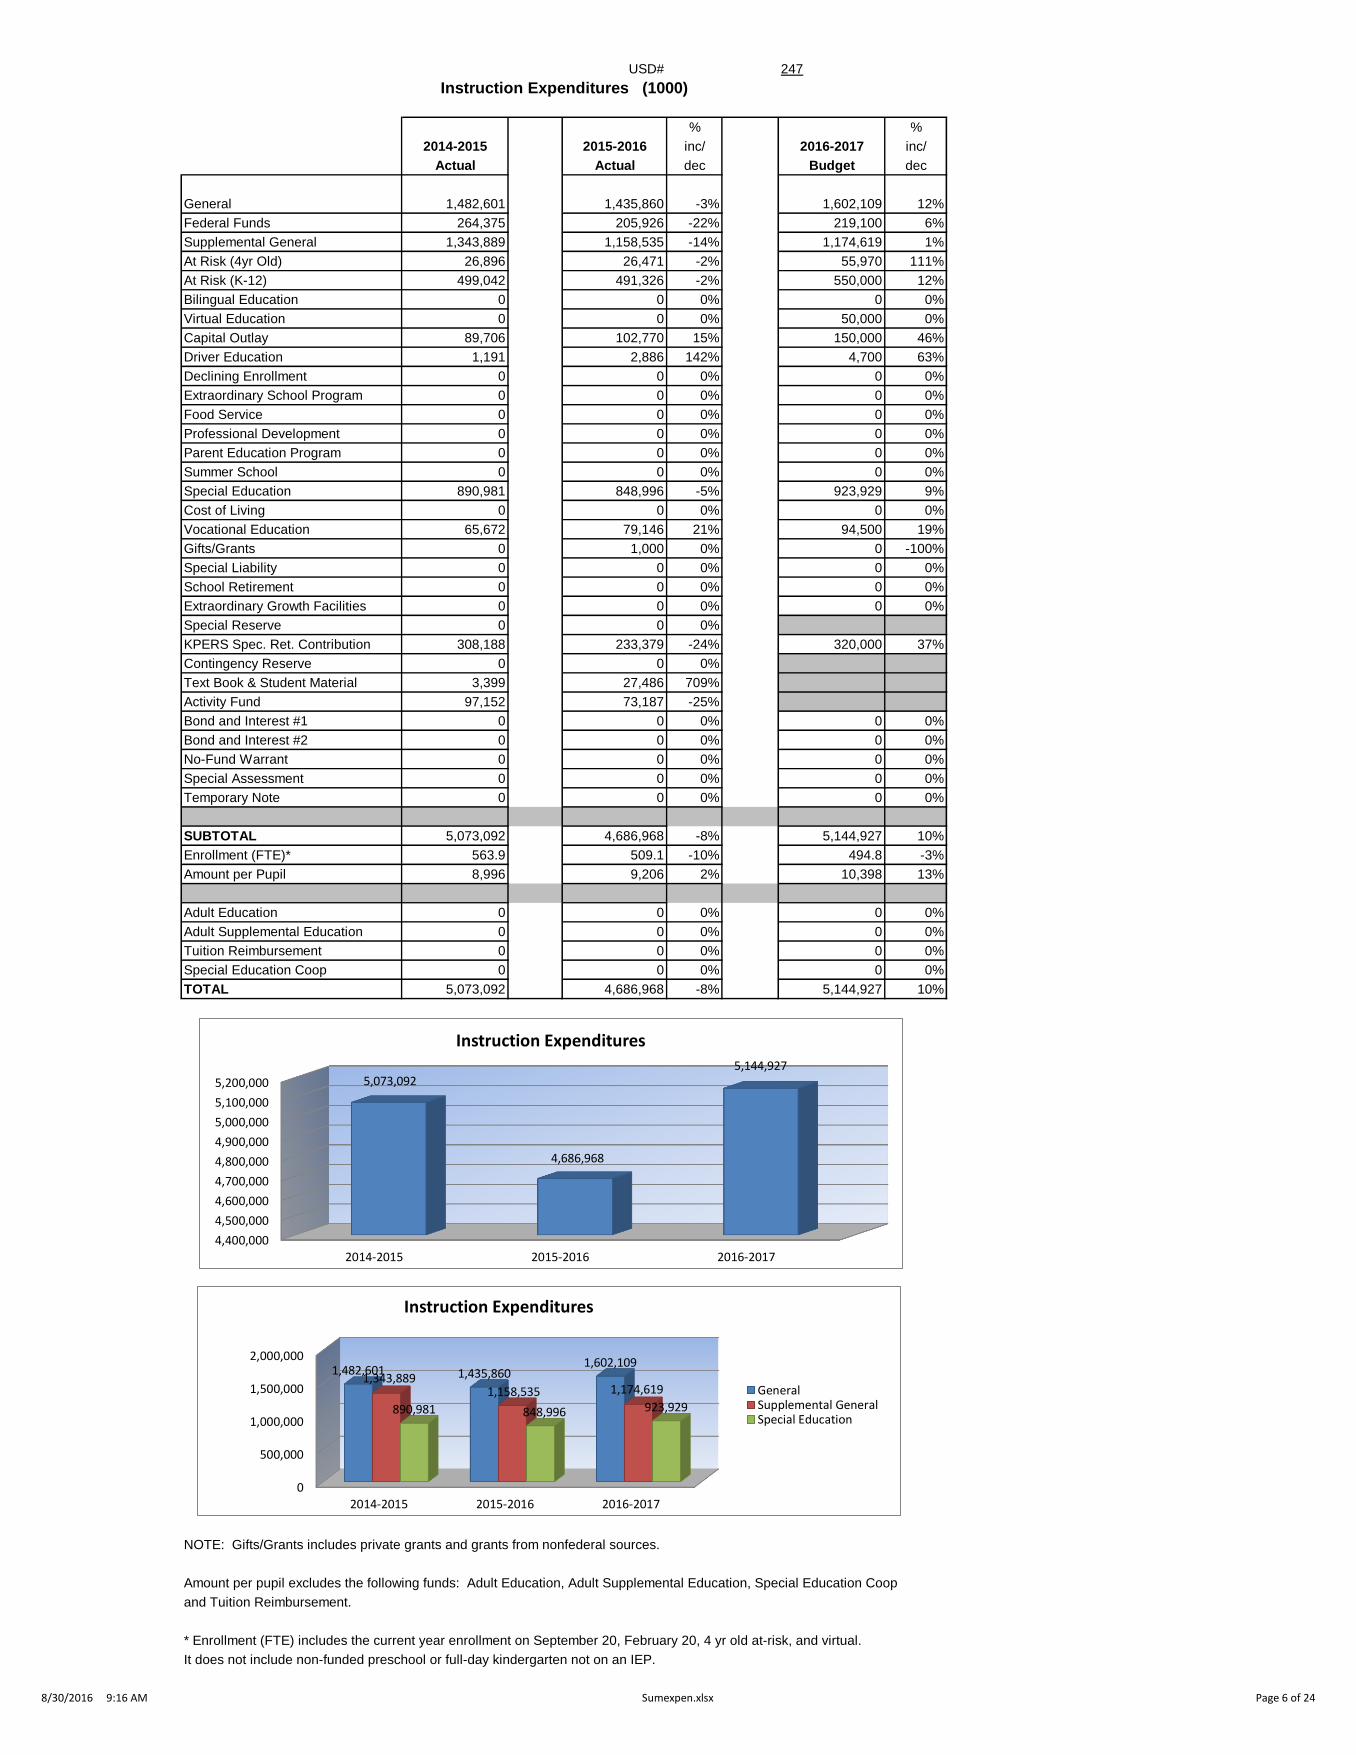
Instruction Expenditures (1000)
% %
2014-2015 2015-2016 inc/ 2016-2017 inc/
Actual Actual dec Budget dec
General 1,482,601 1,435,860 -3% 1,602,109 12%
Federal Funds 264,375 205,926 -22% 219,100 6%
Supplemental General 1,343,889 1,158,535 -14% 1,174,619 1%
At Risk (4yr Old) 26,896 26,471 -2% 55,970 111%
At Risk (K-12) 499,042 491,326 -2% 550,000 12%
Bilingual Education 0 0 0% 0 0%
Virtual Education 0 0 0% 50,000 0%
Capital Outlay 89,706 102,770 15% 150,000 46%
Driver Education 1,191 2,886 142% 4,700 63%
Declining Enrollment 0 0 0% 0 0%
Extraordinary School Program 0 0 0% 0 0%
Food Service 0 0 0% 0 0%
Professional Development 0 0 0% 0 0%
Parent Education Program 0 0 0% 0 0%
Summer School 0 0 0% 0 0%
Special Education 890,981 848,996 -5% 923,929 9%
Cost of Living 0 0 0% 0 0%
Vocational Education 65,672 79,146 21% 94,500 19%
Gifts/Grants 0 1,000 0% 0 -100%
Special Liability 0 0 0% 0 0%
School Retirement 0 0 0% 0 0%
Extraordinary Growth Facilities 0 0 0% 0 0%
Special Reserve 0 0 0%
KPERS Spec. Ret. Contribution 308,188 233,379 -24% 320,000 37%
Contingency Reserve 0 0 0%
Text Book & Student Material 3,399 27,486 709%
Activity Fund 97,152 73,187 -25%
Bond and Interest #1 0 0 0% 0 0%
Bond and Interest #2 0 0 0% 0 0%
No-Fund Warrant 0 0 0% 0 0%
Special Assessment 0 0 0% 0 0%
Temporary Note 0 0 0% 0 0%
SUBTOTAL 5,073,092 4,686,968 -8% 5,144,927 10%
Enrollment (FTE)* 563.9 509.1 -10% 494.8 -3%
Amount per Pupil 8,996 9,206 2% 10,398 13%
Adult Education 0 0 0% 0 0%
Adult Supplemental Education 0 0 0% 0 0%
Tuition Reimbursement 0 0 0% 0 0%
Special Education Coop 0 0 0% 0 0%
TOTAL 5,073,092 4,686,968 -8% 5,144,927 10%
NOTE: Gifts/Grants includes private grants and grants from nonfederal sources.
Amount per pupil excludes the following funds: Adult Education, Adult Supplemental Education, Special Education Coop
and Tuition Reimbursement.
* Enrollment (FTE) includes the current year enrollment on September 20, February 20, 4 yr old at-risk, and virtual.
It does not include non-funded preschool or full-day kindergarten not on an IEP.
0
500,000
1,000,000
1,500,000
2,000,000
2014-2015 2015-2016 2016-2017
1,482,601 1,435,860 1,602,109
1,343,889 1,158,535 1,174,619
890,981 848,996 923,929
Instruction Expenditures
GeneralSupplemental GeneralSpecial Education
4,400,000
4,500,000
4,600,000
4,700,000
4,800,000
4,900,000
5,000,000
5,100,000
5,200,000
2014-2015 2015-2016 2016-2017
5,073,092
4,686,968
5,144,927
Instruction Expenditures
8/30/2016 9:16 AM Sumexpen.xlsx Page 6 of 24

USD# 247
Student Support Expenditures (2100)
% %
2014-2015 2015-2016 inc/ 2016-2017 inc/
Actual Actual dec Budget dec
General 155,635 164,815 6% 181,500 10%
Federal Funds 0 0 0% 0 0%
Supplemental General 0 0 0% 0 0%
At Risk (4yr Old) 0 0 0% 0 0%
At Risk (K-12) 22,981 26,714 16% 41,550 56%
Bilingual Education 0 0 0% 0 0%
Virtual Education 0 0 0% 0 0%
Capital Outlay 0 0 0% 0 0%
Driver Training 0 0 0% 0 0%
Declining Enrollment 0 0 0% 0 0%
Extraordinary School Program 0 0 0% 0 0%
Food Service 0 0 0% 0 0%
Professional Development 0 0 0% 0 0%
Parent Education Program 0 0 0% 0 0%
Summer School 0 0 0% 0 0%
Special Education 0 0 0% 0 0%
Cost of Living 0 0 0% 0 0%
Vocational Education 0 0 0% 0 0%
Gifts/Grants 0 0 0% 0 0%
Special Liability 0 0 0% 0 0%
School Retirement 0 0 0% 0 0%
Extraordinary Growth Facilities 0 0 0% 0 0%
Special Reserve 0 0 0%
KPERS Spec. Ret. Contribution 11,177 12,050 8% 21,000 74%
Contingency Reserve 0 0 0%
Text Book & Student Material 0 0 0%
Activity Fund 0 0 0%
Bond and Interest #1 0 0 0% 0 0%
Bond and Interest #2 0 0 0% 0 0%
No-Fund Warrant 0 0 0% 0 0%
Special Assessment 0 0 0% 0 0%
Temporary Note 0 0 0% 0 0%
SUBTOTAL 189,793 203,579 7% 244,050 20%
Enrollment (FTE)* 563.9 509.1 -10% 494.8 -3%
Amount per Pupil 337 400 19% 493 23%
Adult Education 0 0 0% 0 0%
Adult Supplemental Education 0 0 0% 0 0%
Tuition Reimbursement 0 0 0% 0 0%
Special Education Coop 0 0 0% 0 0%
TOTAL 189,793 203,579 7% 244,050 20%
NOTE: Gifts/Grants includes private grants and grants from nonfederal sources.
Amount per pupil excludes the following funds: Adult Education, Adult Supplemental Education, Special Education Coop
and Tuition Reimbursement.
* Enrollment (FTE) includes the current year enrollment on September 20, February 20, 4 yr old at-risk, and virtual.
It does not include non-funded preschool or full-day kindergarten not on an IEP.
0
50,000
100,000
150,000
200,000
250,000
2014-2015 2015-2016 2016-2017
189,793 203,579
244,050
Student Support Expenditures
8/30/2016 9:16 AM Sumexpen.xlsx Page 7 of 24

USD# 247
Instructional Support Expenditures (2200)
% %
2014-2015 2015-2016 inc/ 2016-2017 inc/
Actual Actual dec Budget dec
General 230,809 221,777 -4% 242,500 9%
Federal Funds 0 0 0% 0 0%
Supplemental General 0 0 0% 0 0%
At Risk (4yr Old) 0 0 0% 0 0%
At Risk (K-12) 0 0 0% 0 0%
Bilingual Education 0 0 0% 0 0%
Virtual Education 0 0 0% 0 0%
Capital Outlay 0 0 0% 0 0%
Driver Training 0 0 0% 0 0%
Declining Enrollment 0 0 0% 0 0%
Extraordinary School Program 0 0 0% 0 0%
Food Service 0 0 0% 0 0%
Professional Development 4,642 8,862 91% 25,000 182%
Parent Education Program 0 0 0% 0 0%
Summer School 0 0 0% 0 0%
Special Education 0 0 0% 0 0%
Cost of Living 0 0 0% 0 0%
Vocational Education 0 0 0% 0 0%
Gifts/Grants 0 0 0% 0 0%
Special Liability 0 0 0% 0 0%
School Retirement 0 0 0% 0 0%
Extraordinary Growth Facilities 0 0 0% 0 0%
Special Reserve 0 0 0%
KPERS Spec. Ret. Contribution 14,579 12,354 -15% 21,014 70%
Contingency Reserve 0 0 0%
Text Book & Student Material 0 0 0%
Activity Fund 0 0 0%
Bond and Interest #1 0 0 0% 0 0%
Bond and Interest #2 0 0 0% 0 0%
No-Fund Warrant 0 0 0% 0 0%
Special Assessment 0 0 0% 0 0%
Temporary Note 0 0 0% 0 0%
SUBTOTAL 250,030 242,993 -3% 288,514 19%
Enrollment (FTE)* 563.9 509.1 -10% 494.8 -3%
Amount per Pupil 443 477 8% 583 22%
Adult Education 0 0 0% 0 0%
Adult Supplemental Education 0 0 0% 0 0%
Tuition Reimbursement 0 0 0% 0 0%
Special Education Coop 0 0 0% 0 0%
TOTAL 250,030 242,993 -3% 288,514 19%
NOTE: Gifts/Grants includes private grants and grants from nonfederal sources.
Amount per pupil excludes the following funds: Adult Education, Adult Supplemental Education, Special Education Coop
and Tuition Reimbursement.
* Enrollment (FTE) includes the current year enrollment on September 20, February 20, 4 yr old at-risk, and virtual.
It does not include non-funded preschool or full-day kindergarten not on an IEP.
220,000
230,000
240,000
250,000
260,000
270,000
280,000
290,000
2014-2015 2015-2016 2016-2017
250,030
242,993
288,514
Instructional Support Expenditures
8/30/2016 9:16 AM Sumexpen.xlsx Page 8 of 24

USD# 247
General Administration Expenditures (2300)
% %
2014-2015 2015-2016 inc/ 2016-2017 inc/
Actual Actual dec Budget dec
General 293,850 282,568 -4% 294,700 4%
Federal Funds 0 0 0% 0 0%
Supplemental General 0 0 0% 0 0%
At Risk (4yr Old) 0 0 0% 0 0%
At Risk (K-12) 0 0 0% 0 0%
Bilingual Education 0 0 0% 0 0%
Virtual Education 0 0 0% 0 0%
Capital Outlay 0 0 0% 0 0%
Driver Training 0 0 0% 0 0%
Declining Enrollment 0 0 0% 0 0%
Extraordinary School Program 0 0 0% 0 0%
Food Service 0 0 0% 0 0%
Professional Development 0 0 0% 0 0%
Parent Education Program 0 0 0% 0 0%
Summer School 0 0 0% 0 0%
Special Education 0 0 0% 0 0%
Cost of Living 0 0 0% 0 0%
Vocational Education 0 0 0% 0 0%
Gifts/Grants 0 0 0% 0 0%
Special Liability Expense 0 0 0% 0 0%
School Retirement 0 0 0% 0 0%
Extraordinary Growth Facilities 0 0 0% 0 0%
Special Reserve 0 0 0%
KPERS Spec. Ret. Contribution 19,004 19,880 5% 32,400 63%
Contingency Reserve 0 0 0%
Text Book & Student Material 0 0 0%
Activity Fund 0 0 0%
Bond and Interest #1 0 0 0% 0 0%
Bond and Interest #2 0 0 0% 0 0%
No-Fund Warrant 0 0 0% 0 0%
Special Assessment 0 0 0% 0 0%
Temporary Note 0 0 0% 0 0%
SUBTOTAL 312,854 302,448 -3% 327,100 8%
Enrollment (FTE)* 563.9 509.1 -10% 494.8 -3%
Amount per Pupil 555 594 7% 661 11%
Adult Education 0 0 0% 0 0%
Adult Supplemental Education 0 0 0% 0 0%
Tuition Reimbursement 0 0 0% 0 0%
Special Education Coop 0 0 0% 0 0%
TOTAL 312,854 302,448 -3% 327,100 8%
NOTE: Gifts/Grants includes private grants and grants from nonfederal sources.
Amount per pupil excludes the following funds: Adult Education, Adult Supplemental Education, Special Education Coop
and Tuition Reimbursement.
* Enrollment (FTE) includes the current year enrollment on September 20, February 20, 4 yr old at-risk, and virtual.
It does not include non-funded preschool or full-day kindergarten not on an IEP.
290,000
295,000
300,000
305,000
310,000
315,000
320,000
325,000
330,000
2014-2015 2015-2016 2016-2017
312,854
302,448
327,100
General Administration Expenditures
8/30/2016 9:16 AM Sumexpen.xlsx Page 9 of 24
USD# 247
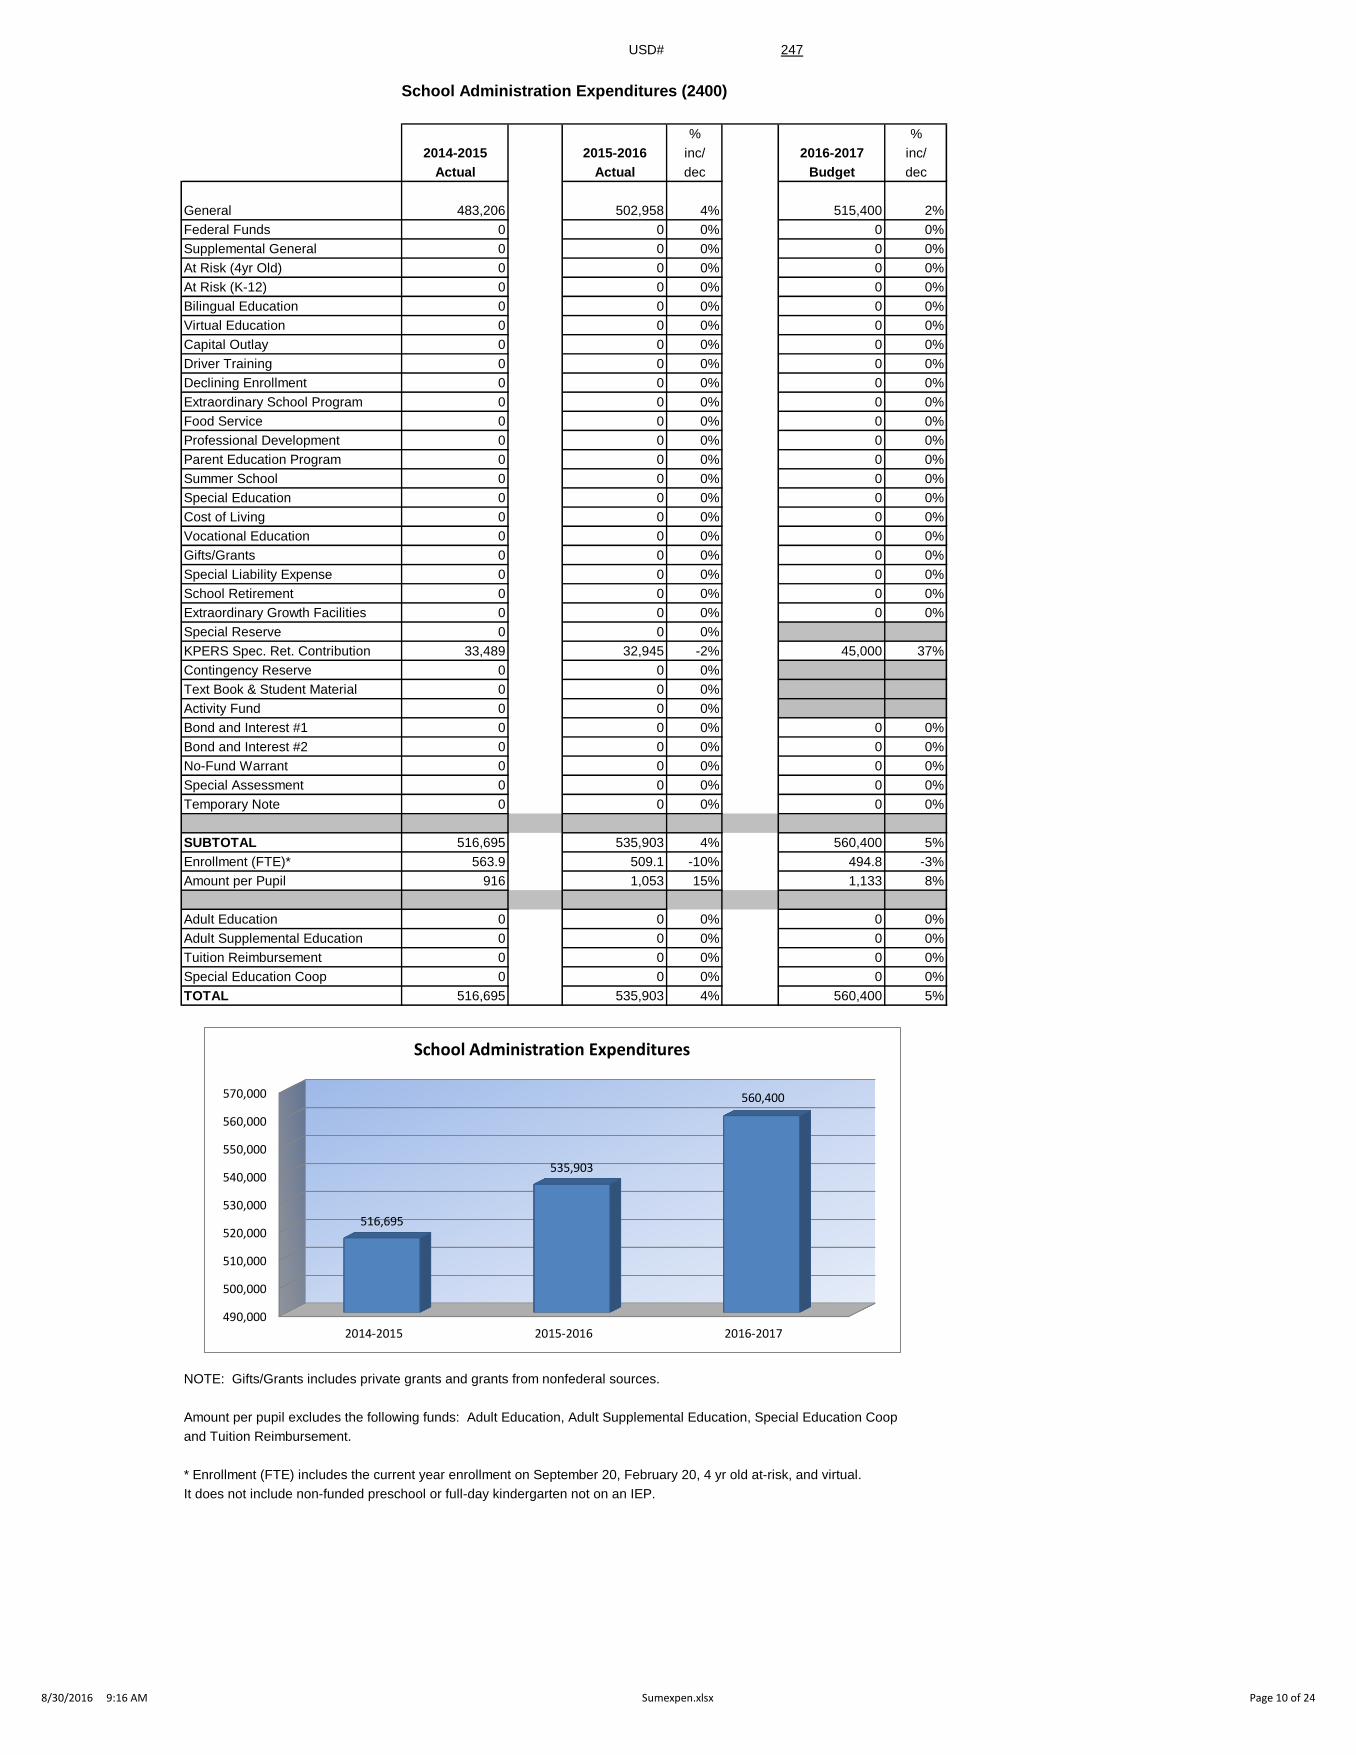
School Administration Expenditures (2400)
% %
2014-2015 2015-2016 inc/ 2016-2017 inc/
Actual Actual dec Budget dec
General 483,206 502,958 4% 515,400 2%
Federal Funds 0 0 0% 0 0%
Supplemental General 0 0 0% 0 0%
At Risk (4yr Old) 0 0 0% 0 0%
At Risk (K-12) 0 0 0% 0 0%
Bilingual Education 0 0 0% 0 0%
Virtual Education 0 0 0% 0 0%
Capital Outlay 0 0 0% 0 0%
Driver Training 0 0 0% 0 0%
Declining Enrollment 0 0 0% 0 0%
Extraordinary School Program 0 0 0% 0 0%
Food Service 0 0 0% 0 0%
Professional Development 0 0 0% 0 0%
Parent Education Program 0 0 0% 0 0%
Summer School 0 0 0% 0 0%
Special Education 0 0 0% 0 0%
Cost of Living 0 0 0% 0 0%
Vocational Education 0 0 0% 0 0%
Gifts/Grants 0 0 0% 0 0%
Special Liability Expense 0 0 0% 0 0%
School Retirement 0 0 0% 0 0%
Extraordinary Growth Facilities 0 0 0% 0 0%
Special Reserve 0 0 0%
KPERS Spec. Ret. Contribution 33,489 32,945 -2% 45,000 37%
Contingency Reserve 0 0 0%
Text Book & Student Material 0 0 0%
Activity Fund 0 0 0%
Bond and Interest #1 0 0 0% 0 0%
Bond and Interest #2 0 0 0% 0 0%
No-Fund Warrant 0 0 0% 0 0%
Special Assessment 0 0 0% 0 0%
Temporary Note 0 0 0% 0 0%
SUBTOTAL 516,695 535,903 4% 560,400 5%
Enrollment (FTE)* 563.9 509.1 -10% 494.8 -3%
Amount per Pupil 916 1,053 15% 1,133 8%
Adult Education 0 0 0% 0 0%
Adult Supplemental Education 0 0 0% 0 0%
Tuition Reimbursement 0 0 0% 0 0%
Special Education Coop 0 0 0% 0 0%
TOTAL 516,695 535,903 4% 560,400 5%
NOTE: Gifts/Grants includes private grants and grants from nonfederal sources.
Amount per pupil excludes the following funds: Adult Education, Adult Supplemental Education, Special Education Coop
and Tuition Reimbursement.
* Enrollment (FTE) includes the current year enrollment on September 20, February 20, 4 yr old at-risk, and virtual.
It does not include non-funded preschool or full-day kindergarten not on an IEP.
490,000
500,000
510,000
520,000
530,000
540,000
550,000
560,000
570,000
2014-2015 2015-2016 2016-2017
516,695
535,903
560,400
School Administration Expenditures
8/30/2016 9:16 AM Sumexpen.xlsx Page 10 of 24

USD# 247
Central Services Expenditures (2500)
% %
2014-2015 2015-2016 inc/ 2016-2017 inc/
Actual Actual dec Budget dec
General 0 0 0% 0 0%
Federal Funds 0 0 0% 0 0%
Supplemental General 0 0 0% 0 0%
At Risk (4yr Old) 0 0 0% 0 0%
At Risk (K-12) 0 0 0% 0 0%
Bilingual Education 0 0 0% 0 0%
Virtual Education 0 0 0% 0 0%
Capital Outlay 0 0 0% 0 0%
Driver Training 0 0 0% 0 0%
Declining Enrollment 0 0 0% 0 0%
Extraordinary School Program 0 0 0% 0 0%
Food Service 0 0 0% 0 0%
Professional Development 0 0 0% 0 0%
Parent Education Program 0 0 0% 0 0%
Summer School 0 0 0% 0 0%
Special Education 0 0 0% 0 0%
Cost of Living 0 0 0% 0 0%
Vocational Education 0 0 0% 0 0%
Gifts/Grants 0 0 0% 0 0%
Special Liability 0 0 0% 0 0%
School Retirement 0 0 0% 0 0%
Extraordinary Growth Facilities 0 0 0% 0 0%
Special Reserve 0 0 0%
KPERS Spec. Ret. Contribution 0 0 0% 0 0%
Contingency Reserve 0 0 0%
Text Book & Student Material 0 0 0%
Activity Fund 0 0 0%
Bond & Interest #1 0 0 0% 0 0%
Bond & Interest #2 0 0 0% 0 0%
No-Fund Warrant 0 0 0% 0 0%
Special Assessment 0 0 0% 0 0%
Temporary Note 0 0 0% 0 0%
SUBTOTAL 0 0 0% 0 0%
Enrollment (FTE)* 563.9 509.1 -10% 494.8 -3%
Amount per Pupil 0 0 0% 0 0%
Adult Education 0 0 0% 0 0%
Adult Supplemental Education 0 0 0% 0 0%
Tuition Reimbursement 0 0 0% 0 0%
Special Education Coop 0 0 0% 0 0%
TOTAL 0 0 0% 0 0%
NOTE: Gifts/Grants includes private grants and grants from nonfederal sources.
Amount per pupil excludes the following funds: Adult Education, Adult Supplemental Education, Special Education Coop
and Tuition Reimbursement.
* Enrollment (FTE) includes the current year enrollment on September 20, February 20, 4 yr old at-risk, and virtual.
It does not include non-funded preschool or full-day kindergarten not on an IEP.
0
0
0
0
0
1
1
1
1
1
1
2014-2015 2015-2016 2016-2017
0 0 0
Central Services Expenditures
8/30/2016 9:16 AM Sumexpen.xlsx Page 11 of 24

USD# 247
Operations and Maintenance Expenditures (2600)
% %
2014-2015 2015-2016 inc/ 2016-2017 inc/
Actual Actual dec Budget dec
General 745,204 709,665 -5% 791,500 12%
Federal Funds 0 0 0% 0 0%
Supplemental General 3,230 0 -100% 0 0%
At Risk (4yr Old) 0 0 0% 0 0%
At Risk (K-12) 0 0 0% 0 0%
Bilingual Education 0 0 0% 0 0%
Virtual Education 0 0 0% 0 0%
Capital Outlay 655 56,654 8549% 75,000 32%
Driver Training 0 0 0% 0 0%
Declining Enrollment 0 0 0% 0 0%
Extraordinary School Program 0 0 0% 0 0%
Food Service 7,320 6,111 -17% 9,500 55%
Professional Development 0 0 0% 0 0%
Parent Education Program 0 0 0% 0 0%
Summer School 0 0 0% 0 0%
Special Education 0 0 0% 0 0%
Cost of Living 0 0 0% 0 0%
Vocational Education 0 0 0% 0 0%
Gifts/Grants 0 0 0% 0 0%
Special Liability 0 0 0% 0 0%
School Retirement 0 0 0% 0 0%
Extraordinary Growth Facilities 0 0 0% 0 0%
Special Reserve 0 0 0%
KPERS Spec. Ret. Contribution 31,645 28,221 -11% 38,000 35%
Contingency Reserve 0 0 0%
Text Book & Student Material 0 0 0%
Activity Fund 0 0 0%
Bond and Interest #1 0 0 0% 0 0%
Bond and Interest #2 0 0 0% 0 0%
No-Fund Warrant 0 0 0% 0 0%
Special Assessment 0 0 0% 0 0%
Temporary Note 0 0 0% 0 0%
SUBTOTAL 788,054 800,651 2% 914,000 14%
Enrollment (FTE)* 563.9 509.1 -10% 494.8 -3%
Amount per Pupil 1,398 1,573 13% 1,847 17%
Adult Education 0 0 0% 0 0%
Adult Supplemental Education 0 0 0% 0 0%
Tuition Reimbursement 0 0 0% 0 0%
Special Education Coop 0 0 0% 0 0%
TOTAL 788,054 800,651 2% 914,000 14%
NOTE: Gifts/Grants includes private grants and grants from nonfederal sources.
Amount per pupil excludes the following funds: Adult Education, Adult Supplemental Education, Special Education Coop
and Tuition Reimbursement.
* Enrollment (FTE) includes the current year enrollment on September 20, February 20, 4 yr old at-risk, and virtual.
It does not include non-funded preschool or full-day kindergarten not on an IEP.
720,000
740,000
760,000
780,000
800,000
820,000
840,000
860,000
880,000
900,000
920,000
2014-2015 2015-2016 2016-2017
788,054
800,651
914,000
Operations and Maintenance Expenditures
8/30/2016 9:16 AM Sumexpen.xlsx Page 12 of 24

USD# 247
Transportation Expenditures (2700)
% %
2014-2015 2015-2016 inc/ 2016-2017 inc/
Actual Actual dec Budget dec
General 418,077 372,619 -11% 415,750 12%
Federal Funds 0 0 0% 0 0%
Supplemental General 0 0 0% 0 0%
At Risk (4yr Old) 0 0 0% 0 0%
At Risk (K-12) 5,741 4,683 -18% 7,500 60%
Bilingual Education 0 0 0% 0 0%
Virtual Education 0 0 0% 0 0%
Capital Outlay 14,704 24,128 64% 50,000 107%
Driver Training 0 0 0% 0 0%
Declining Enrollment 0 0 0% 0 0%
Extraordinary School Program 0 0 0% 0 0%
Food Service 0 0 0% 0 0%
Professional Development 0 0 0% 0 0%
Parent Education Program 0 0 0% 0 0%
Summer School 0 0 0% 0 0%
Special Education 67,419 55,973 -17% 75,750 35%
Cost of Living 0 0 0% 0 0%
Vocational Education 0 0 0% 0 0%
Gifts/Grants 0 0 0% 0 0%
Special Liability 0 0 0% 0 0%
School Retirement 0 0 0% 0 0%
Extraordinary Growth Facilities 0 0 0% 0 0%
Special Reserve 0 0 0%
KPERS Spec. Ret. Contribution 21,724 19,508 -10% 27,000 38%
Contingency Reserve 0 0 0%
Text Book & Student Material 0 0 0%
Activity Fund 0 0 0%
Bond and Interest #1 0 0 0% 0 0%
Bond and Interest #2 0 0 0% 0 0%
No-Fund Warrant 0 0 0% 0 0%
Special Assessment 0 0 0% 0 0%
Temporary Note 0 0 0% 0 0%
SUBTOTAL 527,665 476,911 -10% 576,000 21%
Enrollment (FTE)* 563.9 509.1 -10% 494.8 -3%
Amount per Pupil 936 937 0% 1,164 24%
Adult Education 0 0 0% 0 0%
Adult Supplemental Education 0 0 0% 0 0%
Tuition Reimbursement 0 0 0% 0 0%
Special Education Coop 0 0 0% 0 0%
TOTAL 527,665 476,911 -10% 576,000 21%
NOTE: Gifts/Grants includes private grants and grants from nonfederal sources.
Amount per pupil excludes the following funds: Adult Education, Adult Supplemental Education, Special Education Coop
and Tuition Reimbursement.
* Enrollment (FTE) includes the current year enrollment on September 20, February 20, 4 yr old at-risk, and virtual.
It does not include non-funded preschool or full-day kindergarten not on an IEP.
0
100,000
200,000
300,000
400,000
500,000
600,000
2014-2015 2015-2016 2016-2017
527,665
476,911
576,000
Transportation Expenditures
8/30/2016 9:16 AM Sumexpen.xlsx Page 13 of 24

USD# 247
Other Support Services Expenditures (2900)
% %
2014-2015 2015-2016 inc/ 2016-2017 inc/
Actual Actual dec Budget dec
General 0 38,000 0% 0 -100%
Federal Funds 0 0 0% 0 0%
Supplemental General 0 0 0% 0 0%
At Risk (4yr Old) 0 0 0% 0 0%
At Risk (K-12) 0 0 0% 0 0%
Bilingual Education 0 0 0% 0 0%
Virtual Education 0 0 0% 0 0%
Capital Outlay 0 0 0% 0 0%
Driver Training 0 0 0% 0 0%
Declining Enrollment 0 0 0% 0 0%
Extraordinary School Program 0 0 0% 0 0%
Food Service 0 0 0% 0 0%
Professional Development 0 0 0% 0 0%
Parent Education Program 0 0 0% 0 0%
Summer School 0 0 0% 0 0%
Special Education 0 0 0% 0 0%
Cost of Living 0 0 0% 0 0%
Vocational Education 0 0 0% 0 0%
Gifts/Grants 0 0 0% 0 0%
Special Liability 0 0 0% 0 0%
School Retirement 0 0 0% 0 0%
Extraordinary Growth Facilities 0 0 0% 0 0%
Special Reserve 0 0 0%
KPERS Spec. Ret. Contribution 0 0 0% 0 0%
Contingency Reserve 0 0 0%
Text Book & Student Material 0 0 0%
Activity Fund 0 0 0%
Bond and Interest #1 0 0 0% 0 0%
Bond and Interest #2 0 0 0% 0 0%
No-Fund Warrant 0 0 0% 0 0%
Special Assessment 0 0 0% 0 0%
Temporary Note 0 0 0% 0 0%
SUBTOTAL 0 38,000 0% 0 -100%
Enrollment (FTE)* 563.9 509.1 -10% 494.8 -3%
Amount per Pupil 0 75 0% 0 -100%
Adult Education 0 0 0% 0 0%
Adult Supplemental Education 0 0 0% 0 0%
Tuition Reimbursement 0 0 0% 0 0%
Special Education Coop 0 0 0% 0 0%
TOTAL 0 38,000 0% 0 -100%
NOTE: Gifts/Grants includes private grants and grants from nonfederal sources.
Amount per pupil excludes the following funds: Adult Education, Adult Supplemental Education, Special Education Coop
and Tuition Reimbursement.
* Enrollment (FTE) includes the current year enrollment on September 20, February 20, 4 yr old at-risk, and virtual.
It does not include non-funded preschool or full-day kindergarten not on an IEP.
0
5,000
10,000
15,000
20,000
25,000
30,000
35,000
40,000
2014-2015 2015-2016 2016-2017
0
38,000
0
Other Support Services Expenditures
8/30/2016 9:16 AM Sumexpen.xlsx Page 14 of 24

USD# 247
Food Services Expenditures (3100)
% %
2014-2015 2015-2016 inc/ 2016-2017 inc/
Actual Actual dec Budget dec
General 0 0 0% 0 0%
Federal Funds 0 0 0% 0 0%
Supplemental General 0 0 0% 0 0%
At Risk (4yr Old) 0 0 0% 0 0%
At Risk (K-12) 0 0 0% 0 0%
Bilingual Education 0 0 0% 0 0%
Virtual Education 0 0 0% 0 0%
Capital Outlay 0 0 0% 0 0%
Driver Training 0 0 0% 0 0%
Declining Enrollment 0 0 0% 0 0%
Extraordinary School Program 0 0 0% 0 0%
Food Service 389,581 370,430 -5% 411,000 11%
Professional Development 0 0 0% 0 0%
Parent Education Program 0 0 0% 0 0%
Summer School 0 0 0% 0 0%
Special Education 0 0 0% 0 0%
Cost of Living 0 0 0% 0 0%
Vocational Education 0 0 0% 0 0%
Gifts/Grants 0 0 0% 0 0%
Special Liability 0 0 0% 0 0%
School Retirement 0 0 0% 0 0%
Extraordinary Growth Facilities 0 0 0% 0 0%
Special Reserve 0 0 0%
KPERS Spec. Ret. Contribution 16,021 13,541 -15% 19,000 40%
Contingency Reserve 0 0 0%
Text Book & Student Material 0 0 0%
Activity Fund 0 0 0%
Bond and Interest #1 0 0 0% 0 0%
Bond and Interest #2 0 0 0% 0 0%
No-Fund Warrant 0 0 0% 0 0%
Special Assessment 0 0 0% 0 0%
Temporary Note 0 0 0% 0 0%
SUBTOTAL 405,602 383,971 -5% 430,000 12%
Enrollment (FTE)* 563.9 509.1 -10% 494.8 -3%
Amount per Pupil 719 754 5% 869 15%
Adult Education 0 0 0% 0 0%
Adult Supplemental Education 0 0 0% 0 0%
Tuition Reimbursement 0 0 0% 0 0%
Special Education Coop 0 0 0% 0 0%
TOTAL 405,602 383,971 -5% 430,000 12%
NOTE: Gifts/Grants includes private grants and grants from nonfederal sources.
Amount per pupil excludes the following funds: Adult Education, Adult Supplemental Education, Special Education Coop
and Tuition Reimbursement.
* Enrollment (FTE) includes the current year enrollment on September 20, February 20, 4 yr old at-risk, and virtual.
It does not include non-funded preschool or full-day kindergarten not on an IEP.
360,000
370,000
380,000
390,000
400,000
410,000
420,000
430,000
2014-2015 2015-2016 2016-2017
405,602
383,971
430,000
Food Service Expenditures
8/30/2016 9:16 AM Sumexpen.xlsx Page 15 of 24

USD# 247
Community Services Operations (3300)
% %
2014-2015 2015-2016 inc/ 2016-2017 inc/
Actual Actual dec Budget dec
General 0 0 0% 0 0%
Federal Funds 0 0 0% 0 0%
Supplemental General 0 0 0% 0 0%
At Risk (4yr Old) 0 0 0% 0 0%
At Risk (K-12) 0 0 0% 0 0%
Bilingual Education 0 0 0% 0 0%
Virtual Education 0 0 0% 0 0%
Capital Outlay 0 0 0% 0 0%
Driver Training 0 0 0% 0 0%
Declining Enrollment 0 0 0% 0 0%
Extraordinary School Program 0 0 0% 0 0%
Food Service 0 0 0% 0 0%
Professional Development 0 0 0% 0 0%
Parent Education Program 0 0 0% 0 0%
Summer School 0 0 0% 0 0%
Special Education 0 0 0% 0 0%
Cost of Living 0 0 0% 0 0%
Vocational Education 0 0 0% 0 0%
Gifts/Grants 0 0 0% 0 0%
Special Liability 0 0 0% 0 0%
School Retirement 0 0 0% 0 0%
Extraordinary Growth Facilities 0 0 0% 0 0%
Special Reserve 0 0 0%
KPERS Spec. Ret. Contribution 0 0 0% 0 0%
Contingency Reserve 0 0 0%
Text Book & Student Material 0 0 0%
Activity Fund 0 0 0%
Bond and Interest #1 0 0 0% 0 0%
Bond and Interest #2 0 0 0% 0 0%
No-Fund Warrant 0 0 0% 0 0%
Special Assessment 0 0 0% 0 0%
Temporary Note 0 0 0% 0 0%
SUBTOTAL 0 0 0% 0 0%
Enrollment (FTE)* 563.9 509.1 -10% 494.8 -3%
Amount per Pupil 0 0 0% 0 0%
Adult Education 0 0 0% 0 0%
Adult Supplemental Education 0 0 0% 0 0%
Tuition Reimbursement 0 0 0% 0 0%
Special Education Coop 0 0 0% 0 0%
TOTAL 0 0 0% 0 0%
NOTE: Gifts/Grants includes private grants and grants from nonfederal sources.
Amount per pupil excludes the following funds: Adult Education, Adult Supplemental Education, Special Education Coop
and Tuition Reimbursement.
* Enrollment (FTE) includes the current year enrollment on September 20, February 20, 4 yr old at-risk, and virtual.
It does not include non-funded preschool or full-day kindergarten not on an IEP.
0
0
0
0
0
1
1
1
1
1
1
2014-2015 2015-2016 2016-2017
0 0 0
Community Services Operations (3300)
8/30/2016 9:16 AM Sumexpen.xlsx Page 16 of 24

USD# 247
Capital Improvements Expenditures (4000)
% %
2014-2015 2015-2016 inc/ 2016-2017 inc/
Actual Actual dec Budget dec
General 0 0 0% 0 0%
Federal Funds 0 0 0% 0 0%
Supplemental General 0 0 0% 0 0%
At Risk (4yr Old) 0 0 0% 0 0%
At Risk (K-12) 0 0 0% 0 0%
Bilingual Education 0 0 0% 0 0%
Virtual Education 0 0 0% 0 0%
Capital Outlay 460,189 368,283 -20% 325,000 -12%
Driver Training 0 0 0% 0 0%
Declining Enrollment 0 0 0% 0 0%
Extraordinary School Program 0 0 0% 0 0%
Food Service 0 0 0% 0 0%
Professional Development 0 0 0% 0 0%
Parent Education Program 0 0 0% 0 0%
Summer School 0 0 0% 0 0%
Special Education 0 0 0% 0 0%
Cost of Living 0 0 0% 0 0%
Vocational Education 0 0 0% 0 0%
Gifts/Grants 0 0 0% 0 0%
Special Liability 0 0 0% 0 0%
School Retirement 0 0 0% 0 0%
Extraordinary Growth Facilities 0 0 0% 0 0%
Special Reserve 0 0 0%
KPERS Spec. Ret. Contribution 0 0 0% 0 0%
Contingency Reserve 0 0 0%
Text Book & Student Material 0 0 0%
Activity Fund 0 0 0%
Bond and Interest #1 0 0 0% 0 0%
Bond and Interest #2 0 0 0% 0 0%
No-Fund Warrant 0 0 0% 0 0%
Special Assessment 0 0 0% 0 0%
Temporary Note 0 0 0% 0 0%
SUBTOTAL 460,189 368,283 -20% 325,000 -12%
Enrollment (FTE)* 563.9 509.1 -10% 494.8 -3%
Amount per Pupil 816 723 -11% 657 -9%
Adult Education 0 0 0% 0 0%
Adult Supplemental Education 0 0 0% 0 0%
Tuition Reimbursement 0 0 0% 0 0%
Special Education Coop 0 0 0% 0 0%
TOTAL 460,189 368,283 -20% 325,000 -12%
NOTE: Gifts/Grants includes private grants and grants from nonfederal sources.
Amount per pupil excludes the following funds: Adult Education, Adult Supplemental Education, Special Education Coop
and Tuition Reimbursement.
* Enrollment (FTE) includes the current year enrollment on September 20, February 20, 4 yr old at-risk, and virtual.
It does not include non-funded preschool or full-day kindergarten not on an IEP.
0
50,000
100,000
150,000
200,000
250,000
300,000
350,000
400,000
450,000
500,000
2014-2015 2015-2016 2016-2017
460,189
368,283
325,000
Capital Improvements (4000)
8/30/2016 9:16 AM Sumexpen.xlsx Page 17 of 24

USD# 247
Debt Services Expenditures (5100)
% %
2014-2015 2015-2016 inc/ 2016-2017 inc/
Actual Actual dec Budget dec
General 0 0 0% 0 0%
Federal Funds 0 0 0% 0 0%
Supplemental General 0 0 0% 0 0%
At Risk (4yr Old) 0 0 0% 0 0%
At Risk (K-12) 0 0 0% 0 0%
Bilingual Education 0 0 0% 0 0%
Virtual Education 0 0 0% 0 0%
Capital Outlay 0 0 0% 0 0%
Driver Training 0 0 0% 0 0%
Declining Enrollment 0 0 0% 0 0%
Extraordinary School Program 0 0 0% 0 0%
Food Service 0 0 0% 0 0%
Professional Development 0 0 0% 0 0%
Parent Education Program 0 0 0% 0 0%
Summer School 0 0 0% 0 0%
Special Education 0 0 0% 0 0%
Cost of Living 0 0 0% 0 0%
Vocational Education 0 0 0% 0 0%
Gifts/Grants 0 0 0% 0 0%
Special Liability 0 0 0% 0 0%
School Retirement 0 0 0% 0 0%
Extraordinary Growth Facilities 0 0 0% 0 0%
Special Reserve 0 0 0%
KPERS Spec. Ret. Contribution 0 0 0% 0 0%
Contingency Reserve 0 0 0%
Text Book & Student Material 0 0 0%
Activity Fund 0 0 0%
Bond and Interest #1 0 0 0% 0 0%
Bond and Interest #2 0 0 0% 0 0%
No-Fund Warrant 0 0 0% 0 0%
Special Assessment 0 0 0% 0 0%
Temporary Note 0 0 0% 0 0%
SUBTOTAL 0 0 0% 0 0%
Enrollment (FTE)* 563.9 509.1 -10% 494.8 -3%
Amount per Pupil 0 0 0% 0 0%
Adult Education 0 0 0% 0 0%
Adult Supplemental Education 0 0 0% 0 0%
Tuition Reimbursement 0 0 0% 0 0%
Special Education Coop 0 0 0% 0 0%
TOTAL 0 0 0% 0 0%
NOTE: Gifts/Grants includes private grants and grants from nonfederal sources.
Amount per pupil excludes the following funds: Adult Education, Adult Supplemental Education, Special Education Coop
and Tuition Reimbursement.
* Enrollment (FTE) includes the current year enrollment on September 20, February 20, 4 yr old at-risk, and virtual.
It does not include non-funded preschool or full-day kindergarten not on an IEP.
0
0
0
0
0
1
1
1
1
1
1
2014-2015 2015-2016 2016-2017
0 0 0
Debt Services (5100)
8/30/2016 9:16 AM Sumexpen.xlsx Page 18 of 24

USD# 247
Transfers (5200)
% %
2014-2015 2015-2016 inc/ 2016-2017 inc/
Actual Actual dec Budget dec
General 1,221,654 2,644,315 116% 1,498,414 -43%
Federal Funds 0 0 0% 0 0%
Supplemental General 326,787 526,084 61% 510,000 -3%
At Risk (4yr Old) 0 0 0% 0 0%
At Risk (K-12) 0 0 0% 0 0%
Bilingual Education 0 0 0% 0 0%
Virtual Education 0 0 0% 0 0%
Capital Outlay
Driver Training 0 0 0% 0 0%
Declining Enrollment 0 0 0% 0 0%
Extraordinary School Program 0 0 0% 0 0%
Food Service 0 0 0% 0 0%
Professional Development 0 0 0% 0 0%
Parent Education Program 0 0 0% 0 0%
Summer School 0 0 0% 0 0%
Special Education 0 0 0% 0 0%
Cost of Living 0 0 0% 0 0%
Vocational Education 0 0 0% 0 0%
Gifts/Grants 0 0 0% 0 0%
Special Liability 0 0 0% 0 0%
School Retirement 0 0 0% 0 0%
Extraordinary Growth Facilities 0 0 0% 0 0%
Special Reserve 0 0 0% 0 0%
KPERS Spec. Ret. Contribution 0 0 0% 0 0%
Contingency Reserve 0 0 0% 0 0%
Text Book & Student Material 0 0 0% 0 0%
Activity Fund 0 0 0% 0 0%
Bond and Interest #1 0 0 0% 0 0%
Bond and Interest #2 0 0 0% 0 0%
No-Fund Warrant 0 0 0% 0 0%
Special Assessment 0 0 0% 0 0%
Temporary Note 0 0 0% 0 0%
SUBTOTAL 1,548,441 3,170,399 105% 2,008,414 -37%
Enrollment (FTE)* 563.9 509.1 -10% 494.8 -3%
Amount per Pupil 2,746 6,227 127% 4,059 -35%
Adult Education 0 0 0% 0 0%
Adult Supplemental Education 0 0 0% 0 0%
Tuition Reimbursement 0 0 0% 0 0%
Special Education Coop 0 0 0% 0 0%
TOTAL 1,548,441 3,170,399 105% 2,008,414 -37%
NOTE: Gifts/Grants includes private grants and grants from nonfederal sources.
Amount per pupil excludes the following funds: Adult Education, Adult Supplemental Education, Special Education Coop
and Tuition Reimbursement.
* Enrollment (FTE) includes the current year enrollment on September 20, February 20, 4 yr old at-risk, and virtual.
It does not include non-funded preschool or full-day kindergarten not on an IEP.
0
500,000
1,000,000
1,500,000
2,000,000
2,500,000
3,000,000
3,500,000
2014-2015 2015-2016 2016-2017
1,548,441
3,170,399
2,008,414
Transfers (5200)
8/30/2016 9:16 AM Sumexpen.xlsx Page 19 of 24
USD# 247
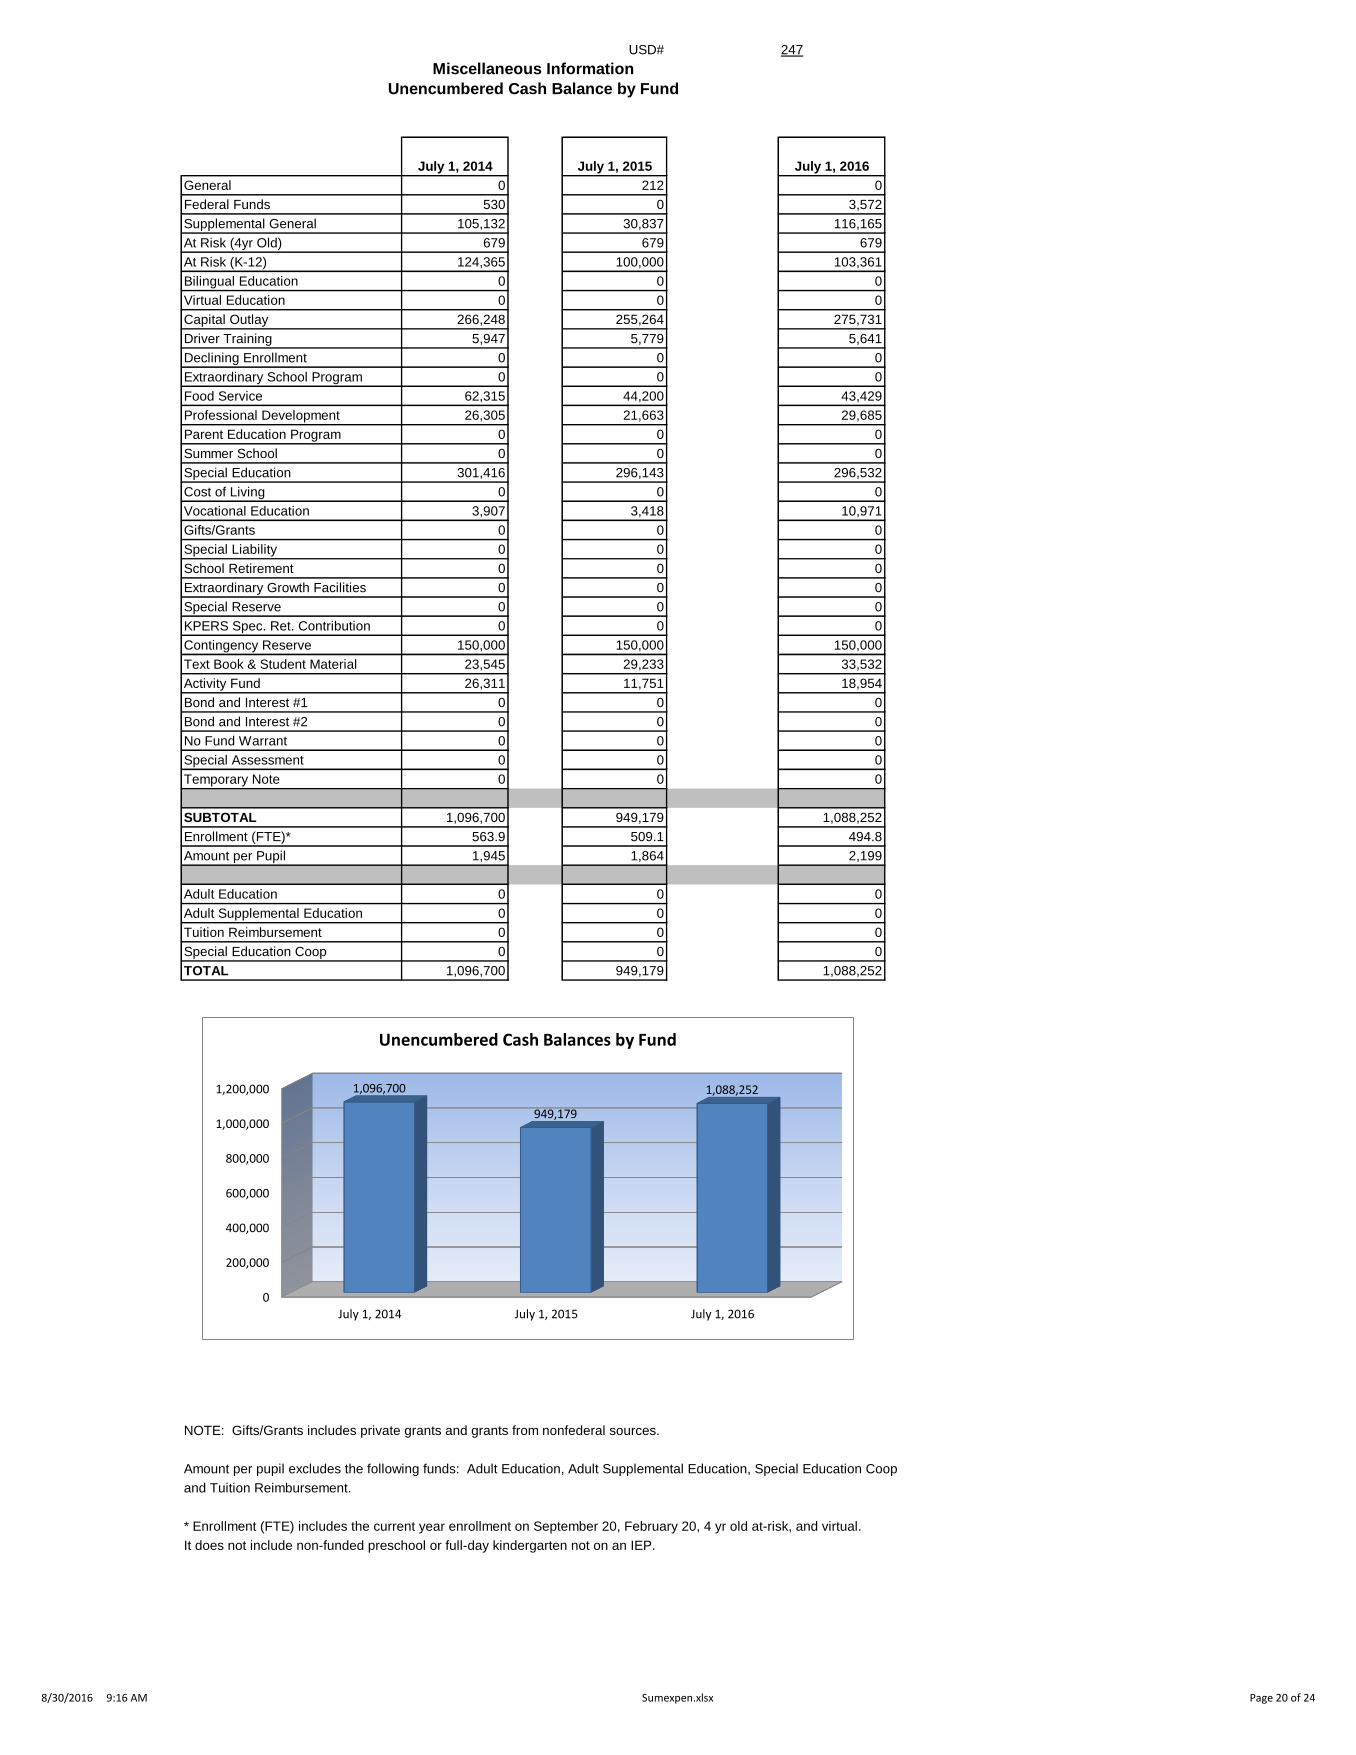
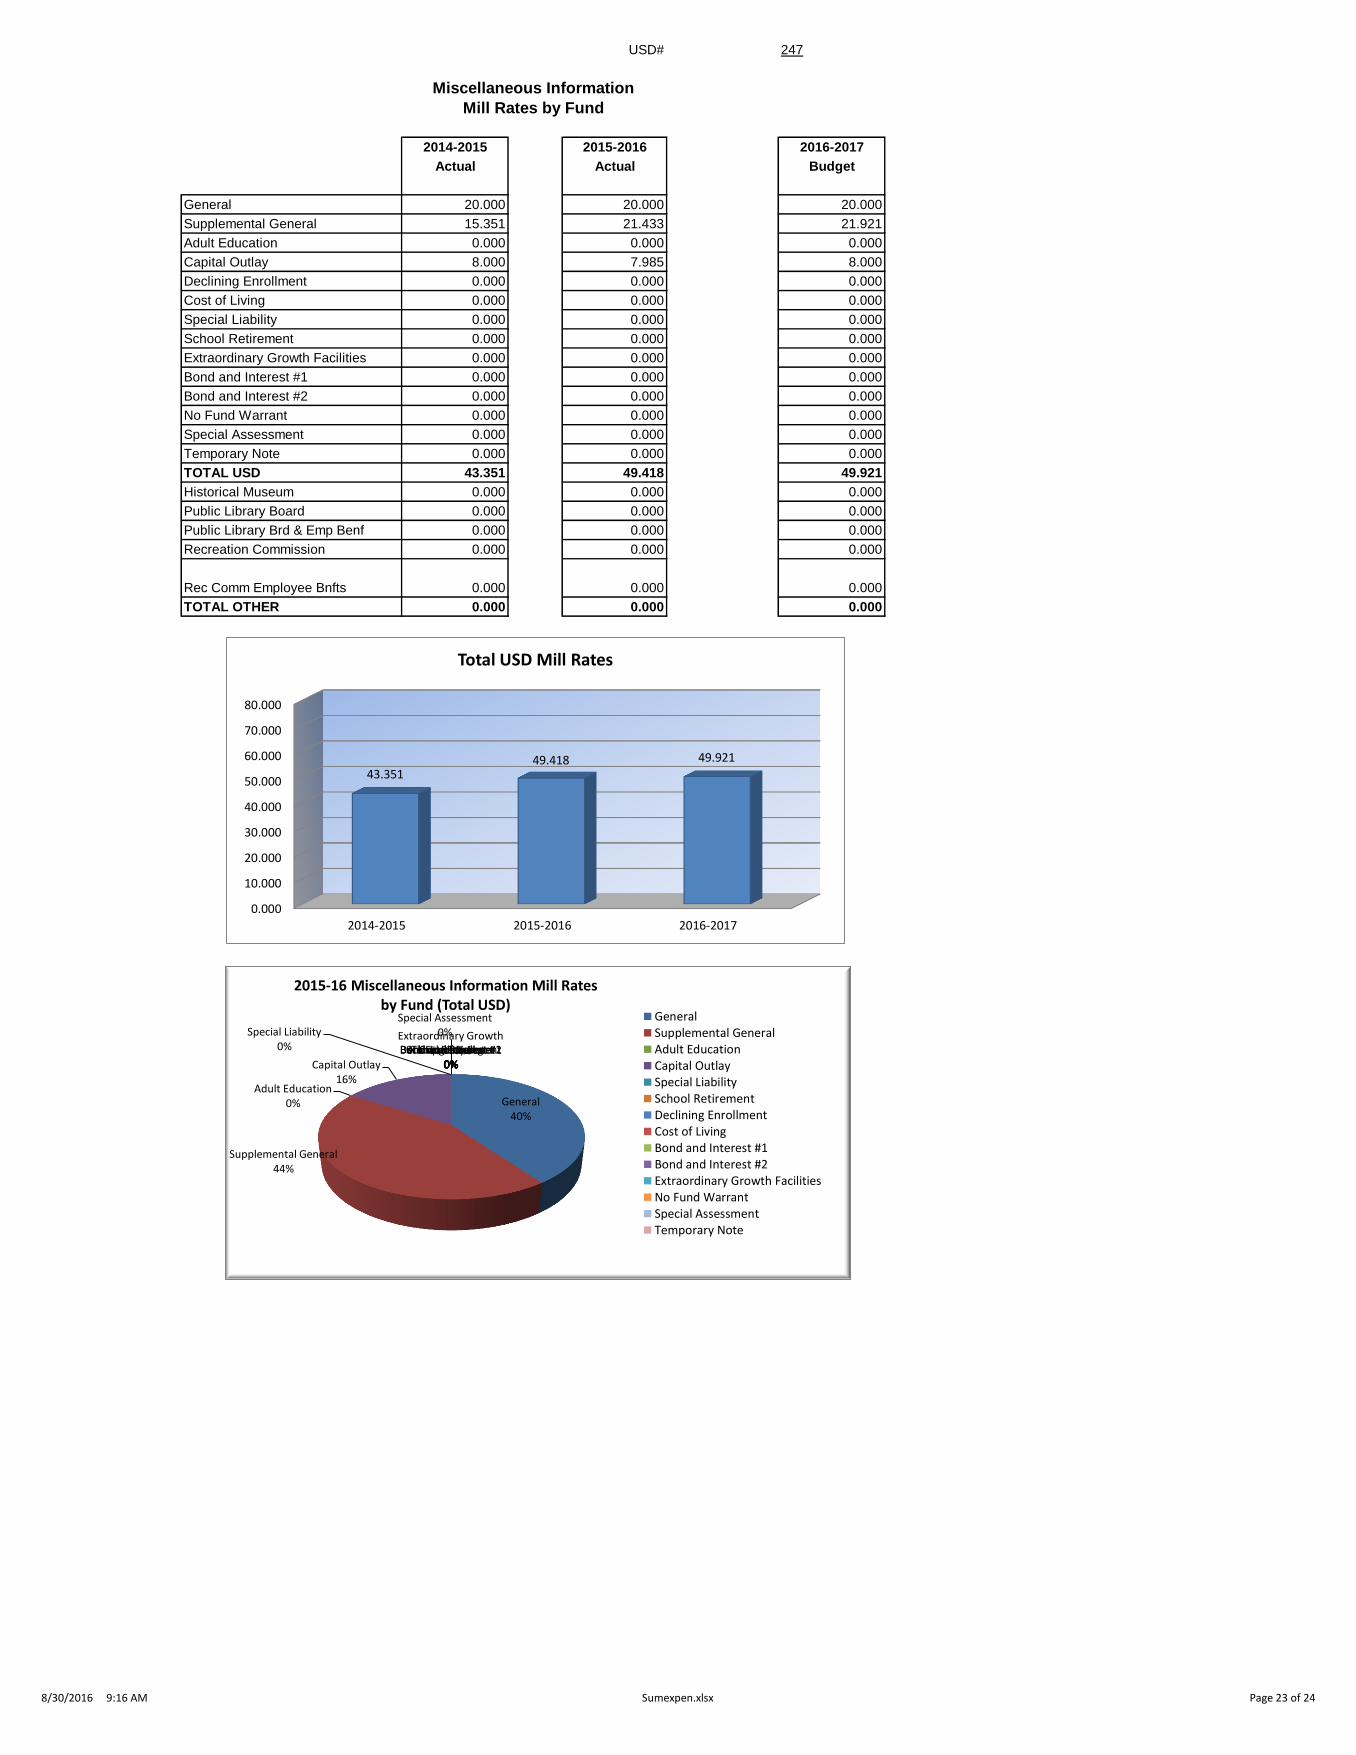
Miscellaneous Information
Unencumbered Cash Balance by Fund
July 1, 2014 July 1, 2015 July 1, 2016
General 0 212 0
Federal Funds 530 0 3,572
Supplemental General 105,132 30,837 116,165
At Risk (4yr Old) 679 679 679
At Risk (K-12) 124,365 100,000 103,361
Bilingual Education 0 0 0
Virtual Education 0 0 0
Capital Outlay 266,248 255,264 275,731
Driver Training 5,947 5,779 5,641
Declining Enrollment 0 0 0
Extraordinary School Program 0 0 0
Food Service 62,315 44,200 43,429
Professional Development 26,305 21,663 29,685
Parent Education Program 0 0 0
Summer School 0 0 0
Special Education 301,416 296,143 296,532
Cost of Living 0 0 0
Vocational Education 3,907 3,418 10,971
Gifts/Grants 0 0 0
Special Liability 0 0 0
School Retirement 0 0 0
Extraordinary Growth Facilities 0 0 0
Special Reserve 0 0 0
KPERS Spec. Ret. Contribution 0 0 0
Contingency Reserve 150,000 150,000 150,000
Text Book & Student Material 23,545 29,233 33,532
Activity Fund 26,311 11,751 18,954
Bond and Interest #1 0 0 0
Bond and Interest #2 0 0 0
No Fund Warrant 0 0 0
Special Assessment 0 0 0
Temporary Note 0 0 0
SUBTOTAL 1,096,700 949,179 1,088,252
Enrollment (FTE)* 563.9 509.1 494.8
Amount per Pupil 1,945 1,864 2,199
Adult Education 0 0 0
Adult Supplemental Education 0 0 0
Tuition Reimbursement 0 0 0
Special Education Coop 0 0 0
TOTAL 1,096,700 949,179 1,088,252
NOTE: Gifts/Grants includes private grants and grants from nonfederal sources.
Amount per pupil excludes the following funds: Adult Education, Adult Supplemental Education, Special Education Coop
and Tuition Reimbursement.
* Enrollment (FTE) includes the current year enrollment on September 20, February 20, 4 yr old at-risk, and virtual.
It does not include non-funded preschool or full-day kindergarten not on an IEP.
0
200,000
400,000
600,000
800,000
1,000,000
1,200,000
July 1, 2014 July 1, 2015 July 1, 2016
1,096,700
949,179
1,088,252
Unencumbered Cash Balances by Fund
8/30/2016 9:16 AM Sumexpen.xlsx Page 20 of 24

USD# 247
Reserve Funds
Unencumbered Cash Balance
July 1, 2014 July 1, 2015 July 1, 2016
Special Reserve 0 0 0
TOTAL OTHER 0 0 0
Amount per Pupil $0 $0 $0
*School districts are authorized by law to self insure rather than purchase insurance for the following categories: Worker's Comp,
Health Insurance, Life Insurance, Property and Casualty (Risk Management) and Disability Income Insurance. Monies are placed
in the Self Insured Fund to pay for claims which may arise from the categories listed above.
0
0
0
0
0
1
1
1
1
1
1
July 1, 2014 July 1, 2015 July 1, 2016
0 0 0
Unencumbered Cash Balances by Fund (Reserve Funds Only)
8/30/2016 9:16 AM Sumexpen.xlsx Page 21 of 24

USD# 247
2012-2013 2013-2014 % 2014-2015 % 2015-2016 % 2016-2017 %
Actual Actual inc/ Actual inc/ Actual inc/ Budget inc/
dec dec dec dec
Enrollment (FTE)* 652.6 615.5 -6% 559.4 -9% 503.1 -10% 480.0 -5%
Enrollment (FTE)** 658.6 621.0 -6% 563.9 -9% 509.1 -10% 494.8 -3%
Number of Students -
Free Meals 316 284 -10% 268 -6% 267 0% 267 0%
Number of Students -
Reduced Meals 102 109 7% 74 -32% 66 -11% 76 15%
*FTE for state aid and budget authority purposes for general fund (excludes 4 yr old at-risk).
** Enrollment (FTE) includes the current year enrollment on September 20, February 20, 4 yr old at-risk, and virtual.
It does not include non-funded preschool or full-day kindergarten not on an IEP.
Enrollment Information
0.0
100.0
200.0
300.0
400.0
500.0
600.0
700.0
2012-2013 2013-2014 2014-2015 2015-2016 2016-2017
658.6 621.0
563.9 509.1 494.8
Enrollment (FTE)** Used for Calculating "Amount per Pupil"
0
50
100
150
200
250
300
350
2012-2013 2013-2014 2014-2015 2015-2016 2016-2017
316
284 268 267 267
102 109
74 66 76
Low Income Students
Free Meals
Reduced Meals
0.0
100.0
200.0
300.0
400.0
500.0
600.0
700.0
2012-2013 2013-2014 2014-2015 2015-2016 2016-2017
652.6 615.5
559.4 503.1 480.0
FTE Enrollment for Budget Authority
8/30/2016 9:16 AM Sumexpen.xlsx Page 22 of 24
USD# 247
Miscellaneous Information
Mill Rates by Fund
2014-2015 2015-2016 2016-2017
Actual Actual Budget
General 20.000 20.000 20.000
Supplemental General 15.351 21.433 21.921
Adult Education 0.000 0.000 0.000
Capital Outlay 8.000 7.985 8.000
Declining Enrollment 0.000 0.000 0.000
Cost of Living 0.000 0.000 0.000
Special Liability 0.000 0.000 0.000
School Retirement 0.000 0.000 0.000
Extraordinary Growth Facilities 0.000 0.000 0.000
Bond and Interest #1 0.000 0.000 0.000
Bond and Interest #2 0.000 0.000 0.000
No Fund Warrant 0.000 0.000 0.000
Special Assessment 0.000 0.000 0.000
Temporary Note 0.000 0.000 0.000
TOTAL USD 43.351 49.418 49.921
Historical Museum 0.000 0.000 0.000
Public Library Board 0.000 0.000 0.000
Public Library Brd & Emp Benf 0.000 0.000 0.000
Recreation Commission 0.000 0.000 0.000
Rec Comm Employee Bnfts 0.000 0.000 0.000
TOTAL OTHER 0.000 0.000 0.000
0.000
10.000
20.000
30.000
40.000
50.000
60.000
70.000
80.000
2014-2015 2015-2016 2016-2017
43.351 49.418 49.921
Total USD Mill Rates
General 40%
Supplemental General 44%
Adult Education 0%
Capital Outlay 16%
Special Liability 0% School Retirement
0% Declining Enrollment
0% Cost of Living
0% Bond and Interest #1
0% Bond and Interest #2
0%
Extraordinary Growth Facilities
0%
No Fund Warrant 0%
Special Assessment 0%
Temporary Note 0%
2015-16 Miscellaneous Information Mill Rates by Fund (Total USD)
GeneralSupplemental GeneralAdult EducationCapital OutlaySpecial LiabilitySchool RetirementDeclining EnrollmentCost of LivingBond and Interest #1Bond and Interest #2Extraordinary Growth FacilitiesNo Fund WarrantSpecial AssessmentTemporary Note
8/30/2016 9:16 AM Sumexpen.xlsx Page 23 of 24

USD# 247
Other Information
2014-2015 2015-2016 2016-2017
Actual Actual Budget
Assessed Valuation $30,186,314 $31,757,990 $33,403,039
Total USD Debt $1,148,015 $1,011,853 $868,596
$28,500,000
$29,000,000
$29,500,000
$30,000,000
$30,500,000
$31,000,000
$31,500,000
$32,000,000
$32,500,000
$33,000,000
$33,500,000
2014-2015 2015-2016 2016-2017
$30,186,314
$31,757,990
$33,403,039
Assessed Valuation
$0
$200,000
$400,000
$600,000
$800,000
$1,000,000
$1,200,000
2014-2015 2015-2016 2016-2017
$1,148,015
$1,011,853
$868,596
Total USD Debt
8/30/2016 9:16 AM Sumexpen.xlsx Page 24 of 24