summary of research designs for quantitative studies
TRANSCRIPT

Summary of Research Designs for Quantitative
Studies

Types of Designs
• Pre-experimental: Little or no control • Experimental: High degree of control • Quasi-experimental: Minor level of control because
random selection or assignment is not possible. Statistics is used to improve the control of variables

Pre-Experimental Designs
• Case study • One group pretest – posttest • Static group comparison or
cross-sectional

• Diagram: X O2 • Description: One group is studied after applying a
treatment or intervention • Threats to validity: Little or no control of the effect of
variables, history, maturation, selection, mortality, and interaction effects of selection biases and the experimental treatment
X = Treatment O2 = Posttest
Case Study Design

• Diagram: O1 X O2
• Description: The dependent variable is measured, the treatment or intervention is applied, and the dependent variable is measured again
• Threats to validity: History, maturation, instrumentation, mortality, selection- maturation interaction, reactive effect of testing, and interaction effects of selection biases and the experimental treatment
One Group Pretest- Posttest Design
O1 = Pretest X = Treatment O2 = Posttest

• Diagram: X O2
- O2 • Description: A group to which a treatment has been
applied is compared to another group that has not experienced it
• Threats to validity: Selection, mortality, reactive effect of testing, and interaction effects of selection biases and the experimental treatment
X = Treatment O2 = Posttest
Static Group Comparison or Cross- Sectional Design

Experimental Designs
• Randomized posttest groups • Pretest- posttest control group • Solomon four groups • Factorial
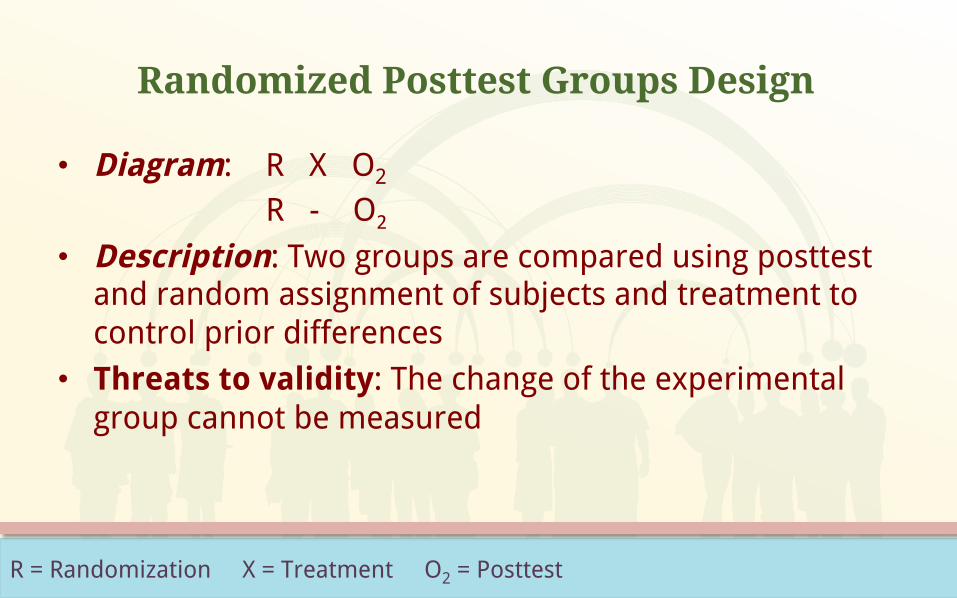
• Diagram: R X O2
R - O2 • Description: Two groups are compared using posttest
and random assignment of subjects and treatment to control prior differences
• Threats to validity: The change of the experimental group cannot be measured
R = Randomization X = Treatment O2 = Posttest
Randomized Posttest Groups Design
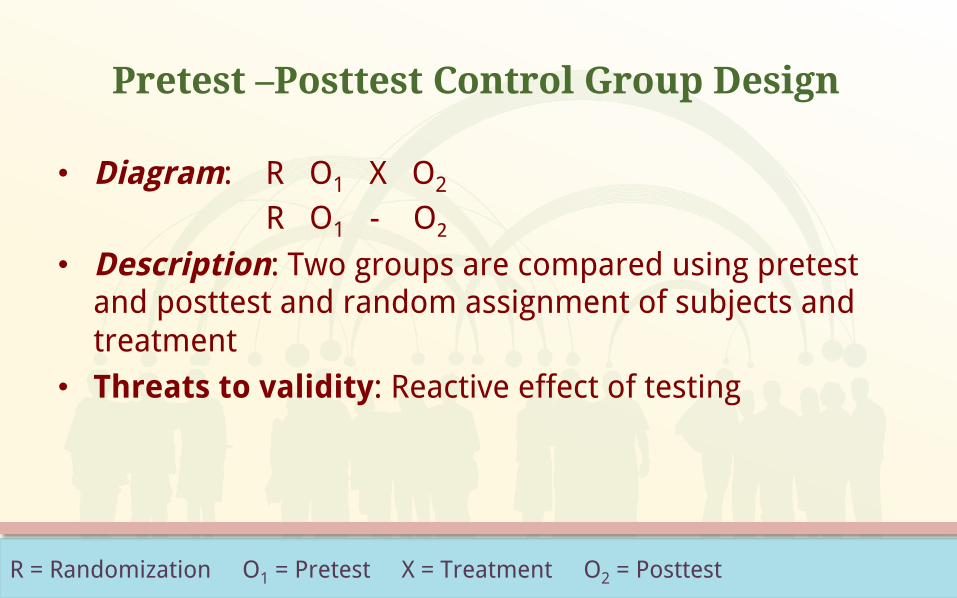
• Diagram: R O1 X O2
R O1 - O2 • Description: Two groups are compared using pretest
and posttest and random assignment of subjects and treatment
• Threats to validity: Reactive effect of testing
R = Randomization O1 = Pretest X = Treatment O2 = Posttest
Pretest –Posttest Control Group Design

• Diagram: R O1 X O2
R O1 - O2
R - X O2
R - - O2 • Description: To address the reactive effect of testing,
two control groups are added to the pretest-posttest control group design; one without taking pretest and another one without pretest and treatment
• Threats to validity: None by itself
R = Randomization O1 = Pretest X = Treatment O2 = Posttest
Solomon Four Groups Design

• Diagram: R X11 O (Notation of a 2 X 2 factorial design) R X12 O
R X21 O
R X22 O • Description: The different levels of two or more independent
variables (factors) are considered to establish not only their effects on the dependent variable but also the ones caused by the interaction among them
• Threats to validity: None by itself
R = Randomization X11 = Factor 1, level 1 X12 = Factor 1, level 2 X21 = Factor 2, level 1 X22 = Factor 2, level 2 O = Measurement
Factorial Design

Quasi-Experimental Designs
• Nonrandomized pretest-posttest control group • Counterbalanced • Time series
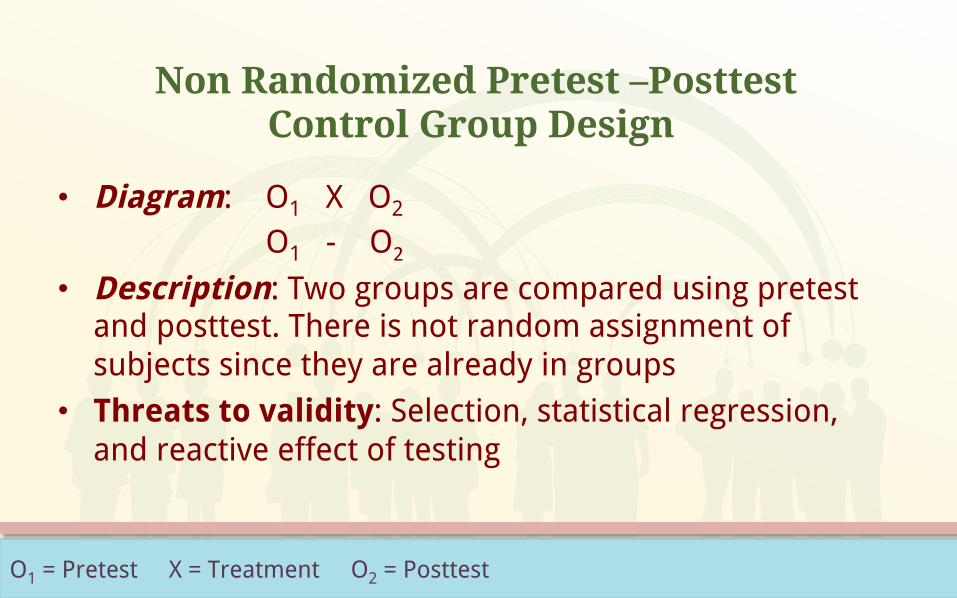
• Diagram: O1 X O2
O1 - O2 • Description: Two groups are compared using pretest
and posttest. There is not random assignment of subjects since they are already in groups
• Threats to validity: Selection, statistical regression, and reactive effect of testing
O1 = Pretest X = Treatment O2 = Posttest
Non Randomized Pretest –Posttest Control Group Design

• Basic Diagram : Treatments XA XB G1 XA XB O
G2 XB XA O
• Description: The order in which treatments are administrated is
changed during the study so as to test every subject for all the considered conditions
• Threats to validity: Multiple treatment interference
X = Treatment G = Group O = Measurement
Counterbalanced Design

• Diagram : O1 O2 … X Oi… On
• Description: The dependent variable is measured several times
before applying a treatment and then a new series of
measurement is performed
• Threats to validity: History and reactive effect of testing
X = Treatment O = Measurement
Time Series Design