summary of pm report
TRANSCRIPT
Summary of Pm rePort
The Bay Area Air Quality Management District (Air District) has prepared a particulate matter (PM) report entitled Understanding Particulate Matter: Protecting Public Health in the San Francisco Bay Area. This document summarizes key information presented in the report. The full PM report:
• describes PM and its impacts on public health, climate change, and ecosystems; • provides technical information about how PM is emitted and formed in the Bay Area; • describes progress in reducing PM levels in the San Francisco Bay Area in recent years; • describes current regulations and programs to reduce PM emissions and concentrations; • identifies future technical work needed to improve the Air District’s understanding of PM; and • explains the importance of continuing the Air District’s efforts to reduce PM in order to
protect public health and the environment.
IntroductIon
In urban environments the air is saturated with tiny particles. Even on clear days when PM levels are well within air quality standards, every breath that we take contains from 1 million to 10 million tiny particles. And that figure can jump to even higher levels near busy roadways or other major outdoor emission sources, or indoors near sources such as stoves and ovens. PM has been regulated as an air pollutant since the early 1970’s. But PM has become a much greater concern in recent years, beginning in the mid-1990’s, when a series of health studies linked exposure to PM with a wide range of respiratory and cardiovascular health effects, including premature death.
The mission of the Bay Area Air Quality Management District (Air District) is to protect and improve air quality, public health, and the global climate. To fulfill its mission, the Air District recognizes that it must treat PM as an air pollutant of the highest priority. A major objective of the PM report is to describe how Bay Area residents are exposed to PM, which sources and types of PM are most harmful, and where we should focus efforts to reduce PM in order to better protect public health.
every breath we take
contains millions of tiny airborne particles.
1Summary of Pm rePort | 2012 | Bay area air Quality management District

What IS Pm?
The term particulate matter describes a diverse assortment of extremely small airborne particles, including a mixture of solid particles and liquid droplets. Whereas most air pollutants (such as ozone or carbon monoxide) consist of a single molecule or compound, PM includes a wide range of disparate particles that vary greatly in terms of their size and mass, physical state (solid or liquid), chemical composition, and toxicity.
PM originates from a variety of man-made processes and sources such as fossil fuel combustion, residential wood burning, and cooking, as well as from natural sources such as wildfires, volcanoes, sea salt, and geological dust. PM is generated indoors as well as outdoors. Indoor sources can include stoves, heaters, fireplaces, consumer products, and cigarettes.
Particle Size
PM is commonly characterized by particle size. • Ultrafine PM, or PM0.1, includes the very smallest particles. These are particles less than
0.1 micron in diameter (one micron equals one-millionth of a meter). • Fine PM or PM2.5 consists of particles 2.5 microns or smaller in diameter (including
ultrafine PM). • Coarse PM refers to particles between 2.5 microns and 10 microns in diameter. (But even
these “coarse” particles are still very tiny, many times smaller than the diameter of a human hair.)
• PM10 consists of particles 10 microns or smaller in diameter (including ultrafine, fine, and coarse PM).
There are important differences among the ultrafine, fine, and coarse particles in terms of how they are formed and emitted; how long they remain suspended in the atmosphere and how far they travel; how easily they can evade the body’s defenses; and how deeply they can penetrate into the lungs, bloodstream, and key organs.
figure 1 shows the various particle sizes in comparison to the diameter of a human hair.
2 summary of pm report | 2012 | Bay area air Quality management District

Primary Pm versus Secondary Pm
PM also can be categorized according to how the particles are formed and emitted. Primary PM refers to particles that are directly emitted from tailpipes and smokestacks, as well as from commercial and domestic cooking, construction activity, tilled fields, paved and unpaved roads, rock quarries, and wood-burning. Secondary PM describes particles that are not directly emitted, but are formed in the atmosphere when gaseous “PM precursor” pollutants, such as sulfur oxides (SOx), nitrogen oxides (NOx), reactive organic compounds (ROG), and ammonia (NH3), react with each other in the presence of sunlight and water vapor to form ammonium nitrate and ammonium sulfate. The precursor pollutants are emitted from fuel combustion, industrial processes, household activities, agriculture, natural vegetation, and other sources. Secondary PM accounts for roughly one-third of Bay Area PM2.5 on an annual basis and approximately 40-45% during winter peak periods.
Pm health ImPactS
An extensive body of research provides compelling evidence that PM is harmful to public health. Researchers established long ago that exposure to PM has negative effects on the respiratory system, such as triggering asthma attacks, aggravating bronchitis, and diminishing lung function. But studies in recent years have found that PM can also harm the cardiovascular system (the heart and blood system which takes oxygen from the lungs and distributes it throughout the body). The negative cardiovascular effects include atherosclerosis (hardening of the arteries), ischemic strokes (caused by an obstruction of the blood supply to the brain), and heart attacks. Because of the serous cardiovascular effects of PM, studies have found a clear correlation between PM levels and mortality (death) rates. Studies also indicate
that exposure to PM may be related to other health effects, including impacts on the brain such as reduction in cognitive function, as well as increased risk of diabetes.
Although researchers are still trying to pinpoint which types of particles are most detrimental to public health, the available evidence indicates that smaller particles in the fine and ultrafine size ranges are generally more harmful than coarse particles. Smaller particles typically remain suspended in the air for longer periods. They can evade the body’s defense mechanisms and penetrate deeply into the lungs, bloodstream and organs. And they present a large amount of reactive surface area relative to their mass, which can induce harmful responses in the body such as inflammation and oxidation.
Using the best available health information, the Air District analyzed the public health impacts of PM and other air pollutants in the Bay Area for the Bay Area 2010 Clean Air Plan. Key findings from this analysis include the following:
Pm can penetrate deep into the body to damage the lungs, heart, circulatory system, and
even the dna in cells. exposure to Pm can trigger a wide range
of negative health effects, including asthma, bronchitis,
strokes, and heart attacks.
3Summary of Pm rePort | 2012 | Bay area air Quality management District
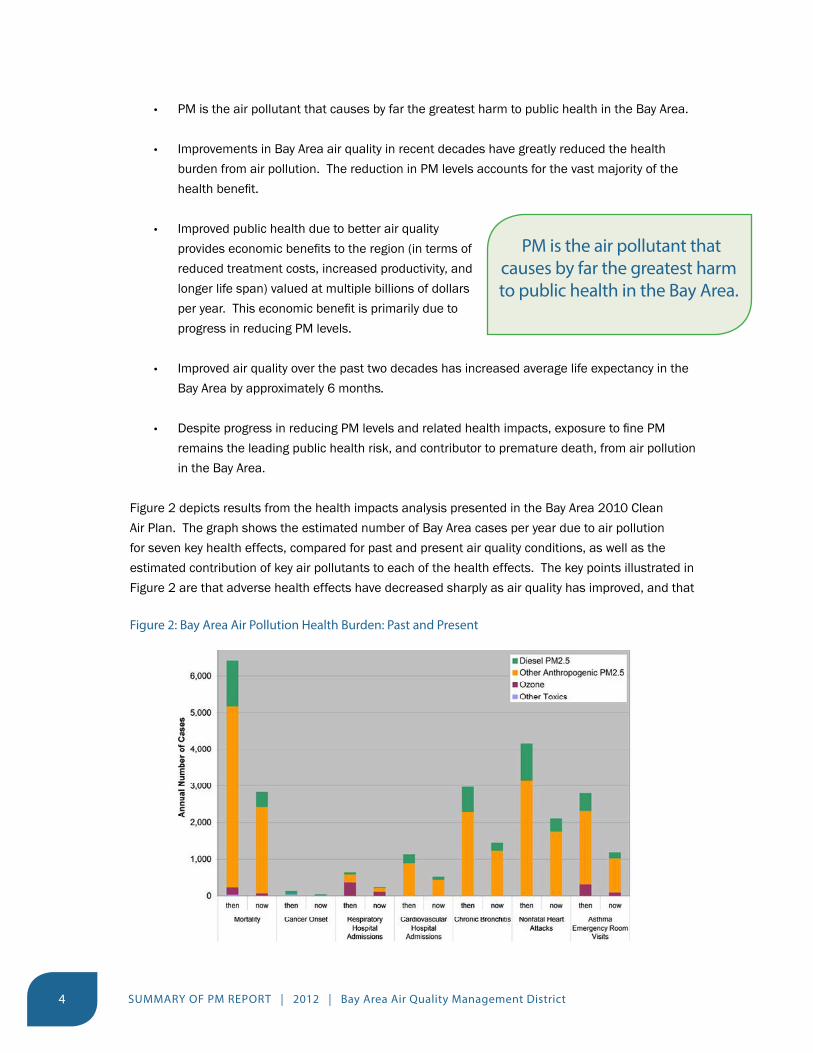
• PM is the air pollutant that causes by far the greatest harm to public health in the Bay Area.
• Improvements in Bay Area air quality in recent decades have greatly reduced the health burden from air pollution. The reduction in PM levels accounts for the vast majority of the health benefit.
• Improved public health due to better air quality provides economic benefits to the region (in terms of reduced treatment costs, increased productivity, and longer life span) valued at multiple billions of dollars per year. This economic benefit is primarily due to progress in reducing PM levels.
• Improved air quality over the past two decades has increased average life expectancy in the Bay Area by approximately 6 months.
• Despite progress in reducing PM levels and related health impacts, exposure to fine PM remains the leading public health risk, and contributor to premature death, from air pollution in the Bay Area.
Figure 2 depicts results from the health impacts analysis presented in the Bay Area 2010 Clean Air Plan. The graph shows the estimated number of Bay Area cases per year due to air pollution for seven key health effects, compared for past and present air quality conditions, as well as the estimated contribution of key air pollutants to each of the health effects. The key points illustrated in Figure 2 are that adverse health effects have decreased sharply as air quality has improved, and that
figure 2: Bay area air Pollution health Burden: Past and Present
Pm is the air pollutant that
causes by far the greatest harm to public health in the Bay area.
4 summary of pm report | 2012 | Bay area air Quality management District

particulate matter (from both diesel engines and other sources) is the air pollutant responsible for the vast majority of the negative health effects.
Although researchers have made great progress in advancing our understanding of the health effects of PM in recent years, important questions remain. For example, more work is needed to identify which specific types of particles are most harmful to public health, to discover the precise biological processes by which PM damages the body, and to determine whether there is a safe PM level below which no negative health effects can be expected.
PoPulatIon exPoSure to Pm
Reducing the exposure of Bay Area residents to PM will help to protect public health and avoid the negative health effects described above. It is especially important to reduce exposure among population groups that are most sensitive to air pollution, such as children, seniors, pregnant women, and people with existing cardiovascular or respiratory conditions.
At the individual level, the amount of PM that we breathe depends on our activity patterns (where we live, work, shop, and play) and the types of PM emissions sources that we are exposed to in the course of our daily activities. Certain settings or environments may expose people to elevated levels of PM. For example, anyone who drives in traffic or walks or cycles on urban streets on a regular basis, or who lives in close proximity to a busy roadway, is likely to incur significant exposure to PM.
Pm emissions from roadways
Numerous studies have found increased rates of respiratory and cardiovascular disease among people who live in close proximity to busy roadways. Exposure to roadway emissions has emerged as an important social equity issue because major roadways, especially those that carry a high volume of heavy-duty diesel-powered trucks, often run through or in close proximity to communities with lower incomes, higher rates of illness, and limited access to health care.
Key findings from studies regarding population exposure to PM emissions from roadways can be summarized as follows:
• PM levels may be greatly elevated near busy roadways. • PM levels tend to decrease sharply as distance from the roadway increases. The
concentration of ultrafine and fine particles drops off rapidly within the first 50 to 100 meters from the source, and generally reverts to background levels within 100-300 meters of the roadway.
numerous studies have found increased rates of respiratory
and cardiovascular disease among people who live in close
proximity to busy roadways.
5Summary of Pm rePort | 2012 | Bay area air Quality management District
• When vehicle emissions are trapped in enclosed areas, such as urban street canyons and tunnels, this can lead to much higher local pollution concentrations and population exposure.
People may be exposed to high PM levels when driving, cycling, or walking on busy roadways. Exposure rates on busy roadways may be 5 to 10 times higher than average, so driving on a freeway or busy arterial road for even a modest time or distance can account for a significant portion of total daily exposure to ultrafine particles.
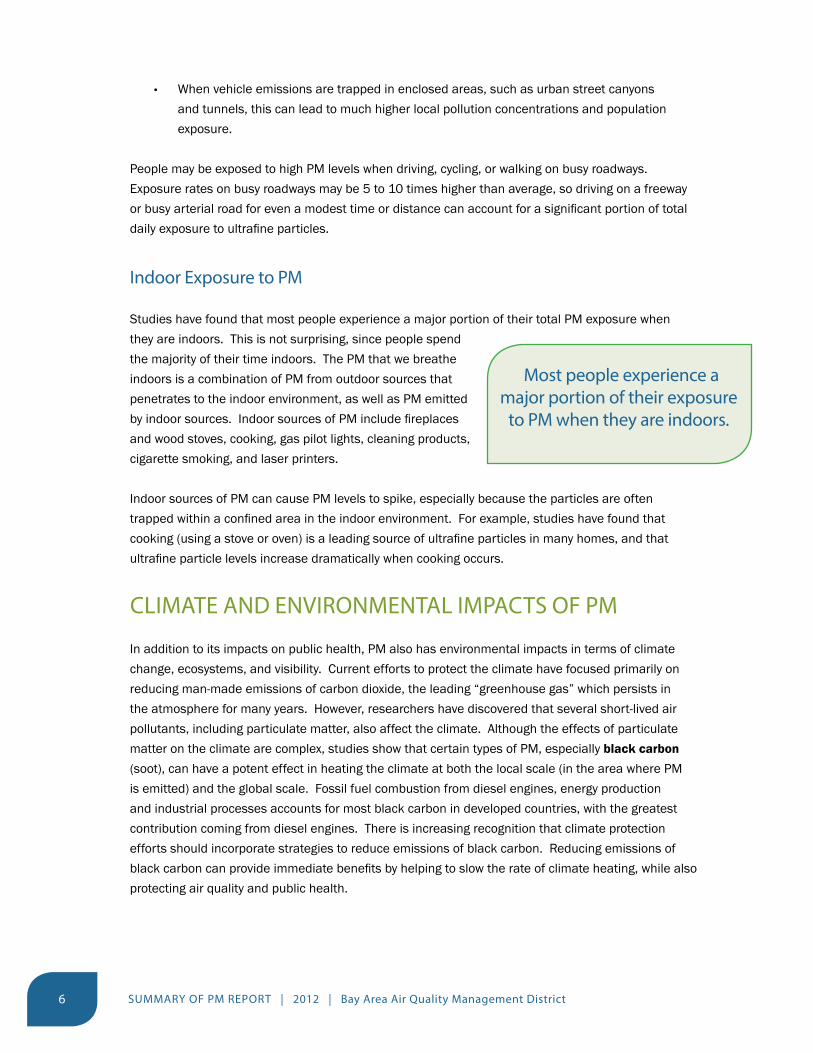
Indoor exposure to Pm
Studies have found that most people experience a major portion of their total PM exposure when they are indoors. This is not surprising, since people spend the majority of their time indoors. The PM that we breathe indoors is a combination of PM from outdoor sources that penetrates to the indoor environment, as well as PM emitted by indoor sources. Indoor sources of PM include fireplaces and wood stoves, cooking, gas pilot lights, cleaning products, cigarette smoking, and laser printers.
Indoor sources of PM can cause PM levels to spike, especially because the particles are often trapped within a confined area in the indoor environment. For example, studies have found that cooking (using a stove or oven) is a leading source of ultrafine particles in many homes, and that ultrafine particle levels increase dramatically when cooking occurs.
clImate and envIronmental ImPactS of Pm
In addition to its impacts on public health, PM also has environmental impacts in terms of climate change, ecosystems, and visibility. Current efforts to protect the climate have focused primarily on reducing man-made emissions of carbon dioxide, the leading “greenhouse gas” which persists in the atmosphere for many years. However, researchers have discovered that several short-lived air pollutants, including particulate matter, also affect the climate. Although the effects of particulate matter on the climate are complex, studies show that certain types of PM, especially black carbon (soot), can have a potent effect in heating the climate at both the local scale (in the area where PM is emitted) and the global scale. Fossil fuel combustion from diesel engines, energy production and industrial processes accounts for most black carbon in developed countries, with the greatest contribution coming from diesel engines. There is increasing recognition that climate protection efforts should incorporate strategies to reduce emissions of black carbon. Reducing emissions of black carbon can provide immediate benefits by helping to slow the rate of climate heating, while also protecting air quality and public health.
most people experience a
major portion of their exposure to Pm when they are indoors.
6 summary of pm report | 2012 | Bay area air Quality management District

Particulate matter also can have negative effects on water quality and on the ecosystems and environment that sustain us. When airborne particles are deposited to land or water, the negative effects may include acid rain, which leads to acidification of lakes and streams; changes in the nutrient balance of coastal waters and river basins; leaching of nutrients from soil, causing reduced nutrient supply to plants; damage to forests and crops; and reduced ecosystem diversity.
In addition, PM causes haze, reducing visibility in both urban and rural areas. Haze is caused when fine particulates in the air scatter and absorb sunlight. Besides detracting from the aesthetic enjoyment of vistas and landscapes, haze also can have negative economic impacts in areas such as the Bay Area that depend on tourism.
Pm In the Bay area
PM levels in the air we breathe vary geographically and over time. Changes in weather conditions are the most important factor in explaining the day-to-day and seasonal variation in PM levels. The Bay Area normally experiences its highest PM levels in the winter months from November through February. During other seasons, by contrast, Bay Area PM2.5 levels tend to be relatively low, due largely to the region’s natural ventilation system. On an annual basis, PM2.5 levels in the Bay Area are among the lowest measured in major U.S. metropolitan areas.
Although weather factors are the main reason that the Bay Area experiences its highest PM levels in winter months, it is important to note that winter is also the season when the most residential wood burning occurs. In some parts of the Bay Area, wood smoke accounts for the majority of airborne PM2.5 during high PM episodes. Secondary PM2.5 levels are also elevated during the winter months because cool weather is conducive to the formation of ammonium nitrate, the most prevalent type of secondary PM in the Bay Area.
Air District analysis shows that transport of PM from the Central Valley can be a significant contributor to Bay Area PM levels during the winter. A single winter weather pattern accounted for approximately 80% of all days when Bay Area PM2.5 levels exceeded the national 24-hour PM2.5 standard during the periods analyzed. This pattern is characterized by a ridge of high pressure settling over the Bay Area for a period of multiple days, leading to calm conditions within the Central Valley, coupled with persistent easterly winds from the Central Valley into the Bay Area. Figure 3 shows the estimated contribution to Bay Area peak (winter season) PM2.5 levels (for primary and secondary PM combined) by emissions source category. Wood burning is a major contributor to peak PM2.5 levels, contributing about 28% of the total. This is mainly from residential wood burning, but also includes wood smoke from controlled burns and wildfires. Approximately 30% of winter PM comes from on-road motor vehicles, including 17% from gasoline vehicles and 13% from diesel vehicles.
air district analysis shows
that transport of Pm from the central valley can be a significant
contributor to Bay area Pm levels during the winter.
7Summary of Pm rePort | 2012 | Bay area air Quality management District

figure 3: estimated Source contributions to Winter Pm2.5 concentrations
A detailed inventory of PM emissions (both primary PM and precursors to secondary PM) in the Bay Area, including estimated emissions by source category from 2010 through 2030, is provided in the full PM report.
Pm StandardS and Bay area Pm trendS
To protect public health and welfare, US EPA and the California Air Resources Board (ARB) have both adopted air quality standards for particulate matter. These standards have been strengthened over time in response to new information about the health effects of PM. Based on data from the regional PM monitoring network, the Bay Area either meets, or is close to meeting, the current national and state PM standards. A detailed discussion regarding the Bay Area’s status relative to the PM air quality standards is provided in Section 3-B of the full PM report.
Figure 4 shows the Bay Area status relative to the national 24-hour PM2.5 standard, expressed in terms of the region’s design value.1 The Bay Area design value decreased by approximately 46% forthe three-year period for 2009-2011 compared to 1999-2001 (the first period for which PM2.5 data was available).
1 Determining whether an air basin attains a given air quality standard requires comparing ambient pollutant levels
with the standard to calculate the region’s design value. A detailed explanation of how design values are calculated is
provided in Section 3-B of the full PM report.
8 summary of pm report | 2012 | Bay area air Quality management District
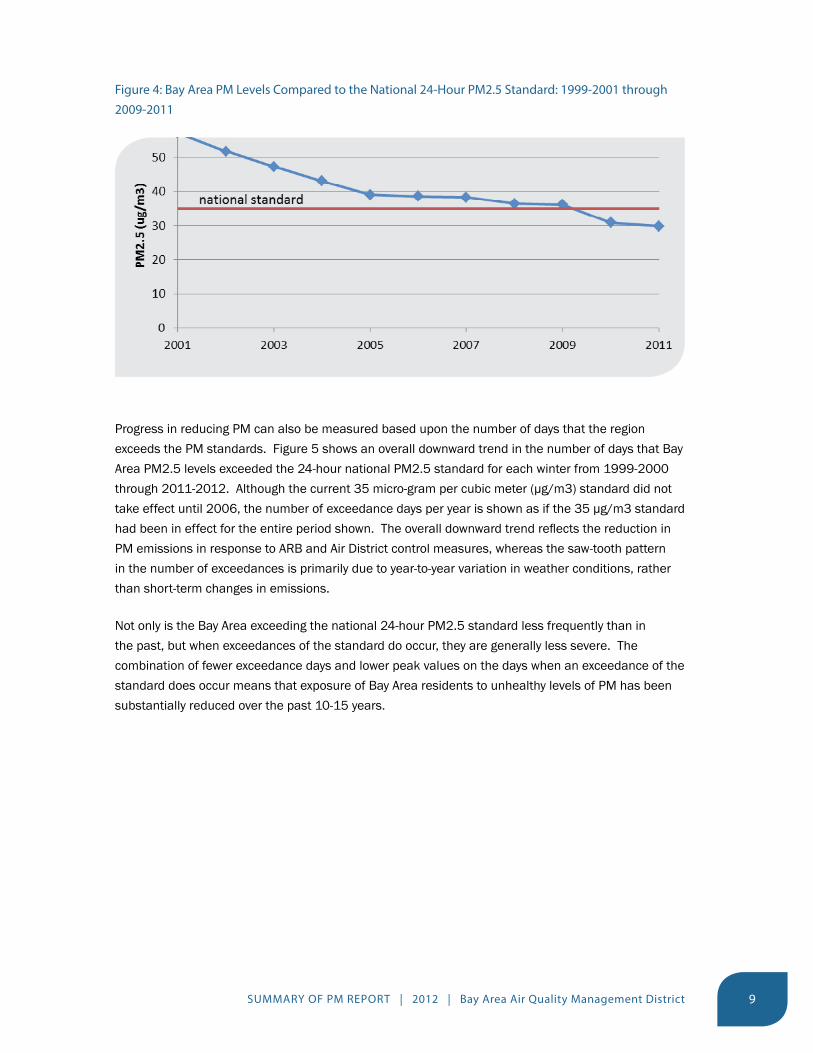
figure 4: Bay area Pm levels compared to the national 24-hour Pm2.5 Standard: 1999-2001 through 2009-2011
Progress in reducing PM can also be measured based upon the number of days that the region exceeds the PM standards. Figure 5 shows an overall downward trend in the number of days that Bay Area PM2.5 levels exceeded the 24-hour national PM2.5 standard for each winter from 1999-2000 through 2011-2012. Although the current 35 micro-gram per cubic meter (µg/m3) standard did not take effect until 2006, the number of exceedance days per year is shown as if the 35 µg/m3 standard had been in effect for the entire period shown. The overall downward trend reflects the reduction in PM emissions in response to ARB and Air District control measures, whereas the saw-tooth pattern in the number of exceedances is primarily due to year-to-year variation in weather conditions, rather than short-term changes in emissions.
Not only is the Bay Area exceeding the national 24-hour PM2.5 standard less frequently than in the past, but when exceedances of the standard do occur, they are generally less severe. The combination of fewer exceedance days and lower peak values on the days when an exceedance of the standard does occur means that exposure of Bay Area residents to unhealthy levels of PM has been substantially reduced over the past 10-15 years.
9Summary of Pm rePort | 2012 | Bay area air Quality management District

figure 5: Bay area Pm2.5 exceedances by Winter: number of days exceeding the 24-hour naaQS, nov. 15 thru feb. 15
effortS to reduce Pm
As noted above, there has been significant progress in reducing PM levels in the Bay Area in recent years. This progress can be attributed to the combined efforts of the Air District and the California Air Resources Board, which are described in detail in Section 4 of the full PM Report. ARB has adopted a comprehensive regulatory program to reduce emissions of primary PM and PM precursors from on-road motor vehicles (cars, trucks, buses, etc.) as well as off-road mobile sources (construction and farm equipment, cargo-handling equipment, etc.).
The Air District has developed a multi-faceted program to reduce PM emissions and population exposure to PM in the Bay Area. The Air District controls PM emissions from sources under its jurisdiction by means of regulations that apply to various types of emissions sources, as well as permit conditions to limit emissions from specific facilities. The Air District implements regulations and programs to reduce PM emissions from open burning of agricultural and non-agricultural waste; combustion sources such as boilers; cement kilns and furnaces; dust produced by earth-moving and construction/demolition operations; residential wood burning during the winter season; and other activities that generate dust or smoke.
To help reduce emissions from motor vehicles and other mobile sources under ARB jurisdiction, the Air District administers grant and incentive programs to encourage early or enhanced compliance with ARB regulations. The Air District has also entered into an agreement with ARB to enforce ARB regulations in the Bay Area, with a special emphasis on ensuring compliance in areas that are highly
10 summary of pm report | 2012 | Bay area air Quality management District

impacted by emissions, such as the West Oakland community in proximity to the Port of Oakland.
reducing Wood Smoke
Wood smoke from residential wood-burning is a major source of emissions during the winter season when the Bay Area experiences its highest PM levels, as well as a major cause of population exposure to PM in residential areas. The Air District has been working to reduce residential wood-burning by means of public outreach and education, as well as regulation and enforcement. In 2008 the Air District adopted a stringent wood-burning rule (Regulation 6-3). This rule prohibits wood burning (with certain defined exceptions) in any indoor fireplace, fire pit, wood or pellet stove or fireplace insert on specific winter days when the Air District forecasts that PM2.5 levels may exceed the national 24-hour PM2.5 standard. Analysis of filters from PM monitoring sites, as well as results from surveys of Bay Area residents, indicates that PM from wood smoke has been reduced by approximately 40% since the wood-burning rule was adopted.
Pm reductions from control Strategy in the Bay area 2010 clean air Plan
In fall 2010, the Air District adopted the Bay Area 2010 Clean Air Plan (2010 CAP), a multi-pollutant plan which laid out an integrated control strategy to reduce four types of air pollutants: ground-level ozone, primary PM as well as PM precursors, toxic air contaminants, and greenhouse gases that contribute to climate change. The plan’s control strategy included a total of 55 measures to reduce emissions from a wide range of stationary and mobile sources. Air District staff sought to maximize reductions of PM in developing this control strategy, and to prioritize PM-reduction measures in outlining its implementation schedule. The 2010 CAP control strategy forms the backbone of the Air District’s current PM control program: as its measures are implemented, emissions of primary PM and PM precursors will be reduced throughout the Bay Area.
reducing Population exposure to Pm
The Air District has been working to analyze and reduce population exposure to toxic air contaminants and PM and to protect impacted communities through its multi-faceted Clean Air Communities Initiative (CACI). Key elements of the CACI include the following:
• Implementation of the Community Air Risk Evaluation (CARE) program to identify Bay Area communities that are disproportionately impacted by emissions from transportation and stationary sources, and to reduce emissions in these communities. 2
2 The CARE program has identified six disproportionately impacted communities: Concord; Richmond/San Pablo;
western Alameda County; San Jose; Redwood City/East Palo Alto; and eastern San Francisco.
We have made significant progress in reducing Pm levels in the Bay area in recent years.
11Summary of Pm rePort | 2012 | Bay area air Quality management District

• Implementation of the control strategy in the Bay Area 2010 Clean Air Plan, which includes measures to reduce emissions of PM from a wide range of sources and to reduce population exposure in impacted communities.
• New or amended regulations to control emissions from stationary sources that impose disproportionate impacts in CARE communities.
• Special monitoring studies to measure concentrations of PM and toxic air contaminants, and their related health risks. 3
• Providing grants and incentives for projects to reduce emissions within CARE communities.• Public education and outreach to promote compliance with the Air District’s wood smoke
rule.• Collaboration with local governments to develop Community Risk Reduction Plans (with
initial pilot efforts in San Francisco and San Jose).• Collaboration with regional and local agency partners to promote focused development that
considers air quality issues and protects public health.• Providing guidance documents and analytical tools to help local government agencies identify
and mitigate air quality issues and impacts in their communities.
lookIng forWard
future trends in Pm emissions
To maintain progress in reducing PM health impacts in the Bay Area, we need to continue reducing emissions of primary PM and PM precursors. Projected trends in emissions of PM and precursor pollutants that form secondary PM are provided in the full PM report through year 2030 (see Section 2 and Appendix A). The projected emissions take into account anticipated changes in population and economic activity, emission reductions from ARB and Air District regulations that have already been adopted, and turnover in the motor vehicle fleet (replacement of older, dirtier vehicles by newer, cleaner ones). Emissions of primary PM2.5 are projected to decrease through 2020, then to begin to rise slowly through 2030 in tandem with population and economic growth. Emission projections for PM precursors are mixed: emissions of ROG and NOx are both expected to decrease significantly, whereas SOx emissions are projected to increase slowly in tandem with economic growth. These projections are based on a conservative assumption that no additional regulation or polices will be adopted to reduce emissions in the future. However, if additional measures are adopted in the future, the PM emissions should be less than currently projected.
Improvements to Pm monitoring Program
The Air District’s current PM monitoring program, as described in Section 3-A of the full PM report, is primarily designed to measure ambient PM levels at the regional scale in comparison to State
3 Special studies include the West Oakland Monitoring Study, the Custom Alloy Scrap Sales (CASS) metals study in
West Oakland, and the UC Berkeley study of truck emissions in West Oakland.
12 summary of pm report | 2012 | Bay area air Quality management District
and federal PM standards. To enhance its PM monitoring program, the Air District will pursue the following initiatives:
• Increase the density of PM2.5 measurements in the region, especially in most impacted communities, and near freeways and other major emission sources where PM “hot spots” are most likely to occur.
• Investigate and consider deploying technology to measure PM accurately and in real-time in response to short-term PM episodes.
• Consider expanding its ultrafine PM monitoring network, subject to the availability of resources to purchase and operate the monitors.
future efforts to Improve the air district’s understanding of Pm
The Air District has been building a solid technical foundation for its efforts to control PM, performing cutting-edge work to analyze PM emissions, concentrations, population exposure, and health effects. However, because PM is such a complex pollutant, there are a number of gaps to be filled, and opportunities to enhance our technical capabilities to measure and analyze PM. This is especially true in the case of ultrafine PM, which has been linked to serious health effects, but is not yet regulated as a distinct pollutant. To further enhance its technical foundation, the Air District will work to:
• Improve its ability to measure and/or estimate PM levels at the local scale;• Develop better information as to population exposure to PM; and• Continue its efforts to analyze ultrafine PM in the Bay Area, including monitoring of ultrafine
levels on a region-wide basis, refining its new (August 2012) ultrafine PM emissions inventory, performing photochemical modeling for ultrafine PM, and estimating population exposure to ultrafine PM in the Bay Area.
Importance of continuing the air district’s efforts to reduce Pm
As discussed above, there has been substantial progress in reducing PM levels in the Bay Area over the past 10-15 years. This does not mean that we can rest easy, however. There are compelling reasons why it is important to continue and build upon our efforts to reduce PM.
• Researchers have not been able to establish a safe threshold for exposure to PM. Studies have shown that there are adverse health effects from PM2.5 exposure even at concentrations below current standards.
• As new information about the health effects of PM becomes available, the U.S. EPA and/or the ARB may issue more stringent standards in the future.
13Summary of Pm rePort | 2012 | Bay area air Quality management District

• Even at the relatively low PM levels that currently prevail in the Bay Area, PM is the air pollutant most harmful to public health, including premature mortality, heart attacks, chronic bronchitis and other key health effects.
• PM levels – and population exposure to PM – can vary significantly at the local scale. Even though the Bay Area currently meets national PM standards (based on the measurements from the regional PM monitoring network), some communities and individuals are exposed to higher concentrations of PM.
• In addition to its detrimental impacts on public health, PM also plays a role in climate change and has negative impacts ecosystems and visibility.
The reductions in PM levels in recent years provide significant social and economic benefits to the Bay Area in terms of improved public health, greater productivity, and longer life expectancy. This progress in reducing PM provides evidence that the current PM control efforts implemented by the Air District, the California Air Resources Board, and other partners, are working.
To maintain progress in reducing Bay Area PM levels, the Air District will continue to monitor the latest research on PM impacts to public health and the environment and to enhance its technical
capabilities in regard to PM. In addition, the Air District will maintain its efforts to reduce PM by implementing the control measures described in the Bay Area 2010 Clean Air Plan and by considering potential additional measures (to be determined at a future date) in the course of developing future air quality plans.
how Bay area residents can reduce their exposure to Pm
Despite progress in reducing PM levels in recent years, Bay Area residents continue to be exposed to PM in a wide variety of settings and environments. While the Air District and its partners continue their efforts to reduce PM in the air we breathe, there are simple steps that Bay Area residents can take to reduce their personal exposure to PM here and now.
• Minimize time spent driving on, or in close proximity to, busy roadways, especially those that carry a high volume of heavy-duty diesel vehicles.
• Avoid opening vents and windows while driving on busy roadways.
• Avoid smoke from tobacco products, incense, and candles.
• Avoid exposure to wood smoke. Don’t burn wood in a fireplace or stove. Avoid campfires, bonfires, and charcoal fires. Replace your wood-burning fireplace with a natural gas insert.
We need to continue to reduce Pm in order to protect public health.
14 summary of pm report | 2012 | Bay area air Quality management District

• Reduce exposure to PM from cooking by ventilating the kitchen when cooking and switching to electric pilot lights.
• Change filters in furnaces and range hoods on a regular basis.
• To reduce exposure to PM and other air pollutants from cleaning products, ventilate work areas while cleaning and dispose of used rags promptly.
there are simple steps that Bay area residents can take to reduce their exposure to Pm.
15Summary of Pm rePort | 2012 | Bay area air Quality management District