summary of inorganic compositional data for … median absolute deviations (mad), and number of...
TRANSCRIPT

U.S. Department of the InteriorU.S. Geological Survey
Data Series 619
Summary of Inorganic Compositional Data for Groundwater, Soil-Water, and Surface-Water Samples at the Headgate Draw Subsurface Drip Irrigation Site, Johnson County, Wyoming

Front cover. Aerial photograph of the Headgate Draw site showing extent of agricultural fields, blocks of land augmented by subsurface drip irrigation (SDI), and locations of monitoring wells and surface-water sampling points. Photograph taken on July 10, 2006, by the U.S. Department of Agriculture, copyrighted 2007.

Summary of Inorganic Compositional Data for Groundwater, Soil-Water, and Surface-Water Samples at the Headgate Draw Subsurface Drip Irrigation Site, Johnson County, Wyoming By Nicholas J. Geboy, Mark A. Engle, Karl T. Schroeder, and John W. Zupancic
Data Series 619
U.S. Department of the InteriorU.S. Geological Survey

U.S. Department of the InteriorKEN SALAZAR, Secretary
U.S. Geological SurveyMarcia K. McNutt, Director
U.S. Geological Survey, Reston, Virginia: 2011
For more information on the USGS—the Federal source for science about the Earth, its natural and living resources, natural hazards, and the environment, visit http://www.usgs.gov or call 1–888–ASK–USGS.
For an overview of USGS information products, including maps, imagery, and publications, visit http://www.usgs.gov/pubprod
To order this and other USGS information products, visit http://store.usgs.gov
Any use of trade, product, or firm names is for descriptive purposes only and does not imply endorsement by the U.S. Government.
Although this report is in the public domain, permission must be secured from the individual copyright owners to reproduce any copyrighted materials contained within this report.
Suggested citation:Geboy, N.J., Engle, M.A., Schroeder, K.T., and Zupancic, J.W., 2011, Summary of inorganic compositional data for groundwater, soil-water, and surface-water samples collected at the Headgate Draw subsurface drip irrigation site, Johnson County, Wyoming: U.S. Geological Survey Data Series 619, 6 p.

iii
Contents
Abstract ...........................................................................................................................................................1Introduction.....................................................................................................................................................1Site Description ..............................................................................................................................................1Methods...........................................................................................................................................................3
Field Methods ........................................................................................................................................3Laboratory Methods .............................................................................................................................3Calculated Parameters ........................................................................................................................3
Quality Assurance and Quality Control ......................................................................................................3Description of Results ...................................................................................................................................5References Cited............................................................................................................................................5Acknowledgments .........................................................................................................................................6
Figure 1. Aerial photograph of the Headgate Draw site showing extent of agricultural
fields, blocks of land augmented by subsurface drip irrigation (SDI), and locations of monitoring wells and surface-water sampling points ......................................2
Tables 1. Analyzed elements and ions with reporting units and method of analysis ........................4 2. Medians, median absolute deviations (MAD), and number of analyses (n) over
the sampling period for percent recovery of matrix spiked sample ....................................4 3. Medians, median absolute deviations (MAD), and number of analyses (n) over
the sampling period for percent recovery of commercially available reference materials (RM) ES–H–1 and ES–L–1 ..........................................................................................5

iv
DatabaseDuplicate samples are denoted with “-dup” in the Sample ID column. Not all samples were analyzed for all components. If an analysis was not performed, the cell is left blank. This notation differs from cells denoted “NA,” in which the analysis or calculated parameters are not applicable to that sample. Located at http://pubs.usgs.gov/ds/619/DS619_Data.xls.

Summary of Inorganic Compositional Data for Groundwater, Soil-Water, and Surface-Water Samples at the Headgate Draw Subsurface Drip Irrigation Site, Johnson County, Wyoming
By Nicholas J. Geboy, Mark A. Engle, Karl T. Schroeder, and John W. Zupancic
Abstract
As part of a 5-year project on the impact of subsurface drip irrigation (SDI) application of coalbed-methane (CBM) produced waters, water samples were collected from the Head-gate Draw SDI site in the Powder River Basin, Wyoming, USA. This research is part of a larger study to understand short- and long-term impacts on both soil and water quality from the beneficial use of CBM waters to grow forage crops through use of SDI. This document provides a summary of the context, sampling methodology, and quality assurance and quality control documentation of samples collected prior to and over the first year of SDI operation at the site (May 2008–October 2009). This report contains an associated data-base containing inorganic compositional data, water-quality criteria parameters, and calculated geochemical parameters for samples of groundwater, soil water, surface water, treated CBM waters, and as-received CBM waters collected at the Headgate Draw SDI site.
Introduction
This data series report describes compositional geochemi-cal data for samples of groundwater, soil water, and surface water from the Headgate Draw site in Johnson County, Wyo., collected over the period of May 2008 to October 2009. The data are included in the associated database. Groundwater and surface-water samples have been collected quarterly since May 2008, while soil-water samples were collected biannu-ally starting in May 2009. In an attempt to beneficially utilize water coproduced with coalbed methane (CBM) develop-ment in the Powder River Basin (PRB), treated CBM waters (injectate) have been applied to the site using subsurface drip irrigation (SDI) technology since October 2008. SDI is a method of dispersing water directly into the root zone of plants in an agricultural field through a system of buried tubes. This
technology has previously been applied in desert environments where rapid evaporation rates limit the usefulness of tradi-tional surficial irrigation techniques (Ayars and others, 2001). In the Headgate Draw study area, SDI is utilized to avoid the damaging sodic effects associated with direct application of CBM-produced water to soils and native groundwater (see Engle and others, in press, for discussion, including installa-tion details for the Headgate Draw SDI site). The data aspect of this report will be updated as new data from the site are released.
Site DescriptionThe Headgate Draw site is located in Johnson County,
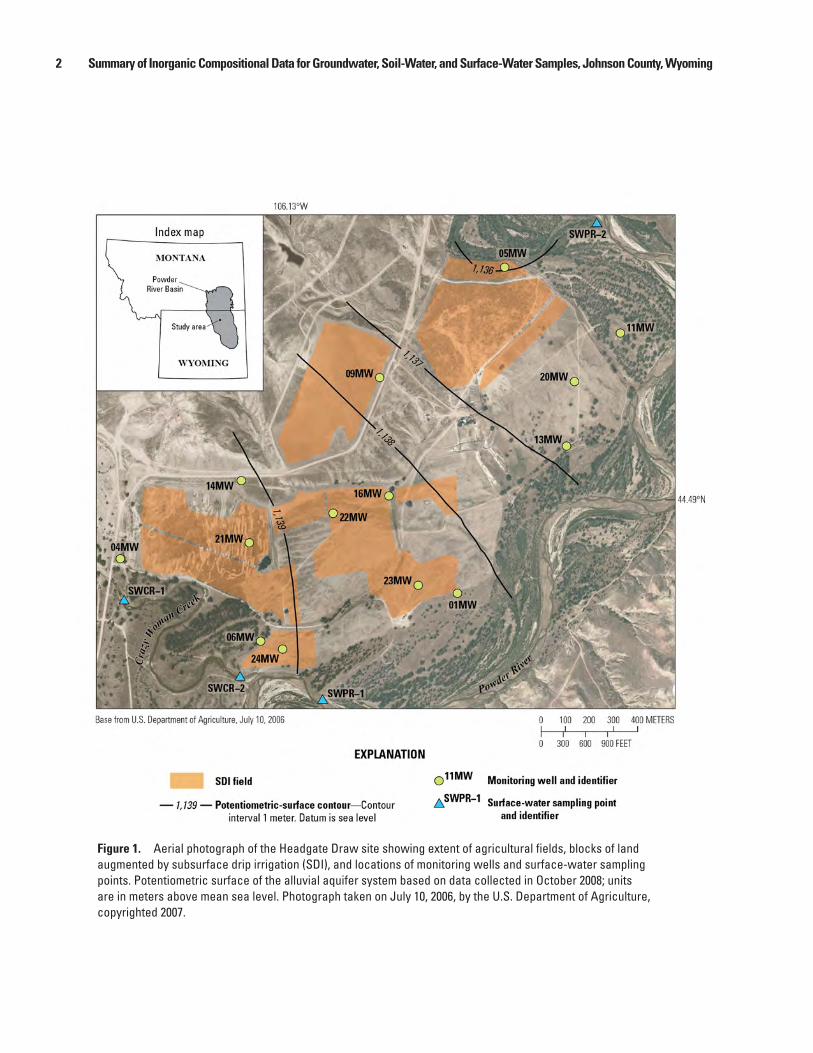
Wyo., proximal to the confluence of the Powder River and its tributary, Crazy Woman Creek (fig. 1). This region is semi-arid, with a mean annual precipitation of 13.6 inches (34.5 centimeters) and characterized by below-freezing daytime temperatures in the winter and short, hot summers; maximum average monthly precipitation falls in May and June (Western Regional Climate Center, 2010). There are 14 moni-toring wells (MWs) about the site: 9 situated along the edge of the SDI fields (01MW to 16MW) and 5 located within the agricultural fields (20MW to 24MW).
Surface-water samples were collected from four sites along the span of the study area, two located on the Powder River (SWPR–1 and –2) and two on Crazy Woman Creek (SWCR–1 and –2). In addition to the groundwater and surface-water sampling sites, soil water was collected from the five lysimeter nests installed across the Headgate Draw site. Three of the lysimeter nests were installed adjacent to monitoring wells 21MW, 23MW, and 24MW within the SDI field, one adjacent to well 20MW in an agricultural field distal to SDI activity, and one adjacent to 11MW in non-agricultural rangeland. The lysimeter nest names correspond to the adjacent monitoring well (for example, the lysimeter nest adjacent to 11MW is named L11). Within each nest, lysimeters
2 Summary of Inorganic Compositional Data for Groundwater, Soil-Water, and Surface-Water Samples, Johnson County, Wyoming
Figure 1. Aerial photograph of the Headgate Draw site showing extent of agricultural fields, blocks of land augmented by subsurface drip irrigation (SDI), and locations of monitoring wells and surface-water sampling points. Potentiometric surface of the alluvial aquifer system based on data collected in October 2008; units are in meters above mean sea level. Photograph taken on July 10, 2006, by the U.S. Department of Agriculture, copyrighted 2007.

Quality Assurance and Quality Control 3
were installed at three depths: 0.5, 1.0, and 2.0 meters (m) below ground surface, denoted as shallow (S), intermedi-ate (I), and deep (D), respectively. Individual lysimeters are then referred to based on their location and depth: L20S is the lysimeter adjacent to well 20MW, installed at a depth of 0.5 m (shallow = S). Figure 1 shows the specific locations of each sampling site. Additional site detail (including a description of local geology) can be found in Engle and oth-ers (in press).
Methods
Field Methods
Surface and groundwater samples were collected accord-ing to protocols established by the U.S. Geological Survey (2006). For groundwater sampling, wells were purged until water-quality parameters stabilized before samples were col-lected; a minimum of three well volumes was purged from each well. Surface-water samples were collected as grab sam-ples in laminar reaches. Both groundwater and surface-water samples were collected in high-density polyethylene bottles or, in the case of samples designated for rare earth element (REE) analysis, polypropylene bottles. Several water-quality parameters were measured in the field using a flow-through cell in conjunction with a YSI MPS 556 multiparameter meter. These measured parameters include specific conductance, pH, temperature, oxidation-reduction potential (ORP), and dis-solved oxygen (DO). In addition, turbidity was qualitatively determined by visual estimation.
For groundwater and surface-water samples collected through February 2009 and all of the soil-water samples, on-site filtration to <0.45 micron (μm) was completed, and sam-ples designated for metals analysis were immediately acidified to a pH <2 with double-distilled HNO3. After February 2009, groundwater and surface-water samples were collected and immediately placed on ice, without being filtered or preserved. Rather, the samples were filtered and preserved upon arrival to the analytical laboratory (described in Laboratory Methods). Soil-water samples were pulled from acid-cleaned, ceramic-tipped Irrometer™ lysimeters using clean syringes. At least 24 hours prior to sampling, the lysimeters were emptied using a syringe and put under a vacuum. Due to competition of the lysimeter against the intrinsic suction of the soil matrix, water samples were not successfully collected from each lysimeter on every event. The samples were filtered in the field using 0.45-μm polypropylene filters and collected in polypropylene vials.
Laboratory Methods
All samples were sent to the National Energy Technol-ogy Laboratory’s (NETL) analytical facility in Pittsburgh, Penn., for chemical analysis. Water samples were analyzed for
major and minor elements using ion chromatography (IC), a Perkin-Elmer Optima 3000 inductively coupled plasma-optical emission spectrometer (ICP–OES) and a Perkin-Elmer Elan 6100 inductively coupled plasma-mass spectrometer (ICP–MS). The choice of instrumentation was dependent on the component of interest. A detailed list of analyzed components and instrumentation can be found in table 1. Other analyses conducted include alkalinity, as determined by titration, and total dissolved solids (TDS), determined via mass of residue on evaporation at 356 °F (180 °C).
Calculated Parameters
The data collected from both the field and laboratory analyses outlined above were entered into AquaChem™ ver-sion 2010.1. AquaChem™ has a built-in link to PHREEQC, a computer modeling program which performs various low-temperature geochemical calculations (Parkhurst and Appelo, 1999). This application was used in this report to determine the saturation indices (SI) with respect to calcite and gypsum, the ionic strength, sodium adsorption ratio (SAR), and water type. Results from PHREEQC were also used to determine the charge balance (electroneutrality) of each sample. Charge balances (the sum of negatively and positively charged ions) ideally should equal zero. Samples with large imbalances (> ±10%) are not included in the database and have not been used for interpretation in any related products.
Quality Assurance and Quality Control
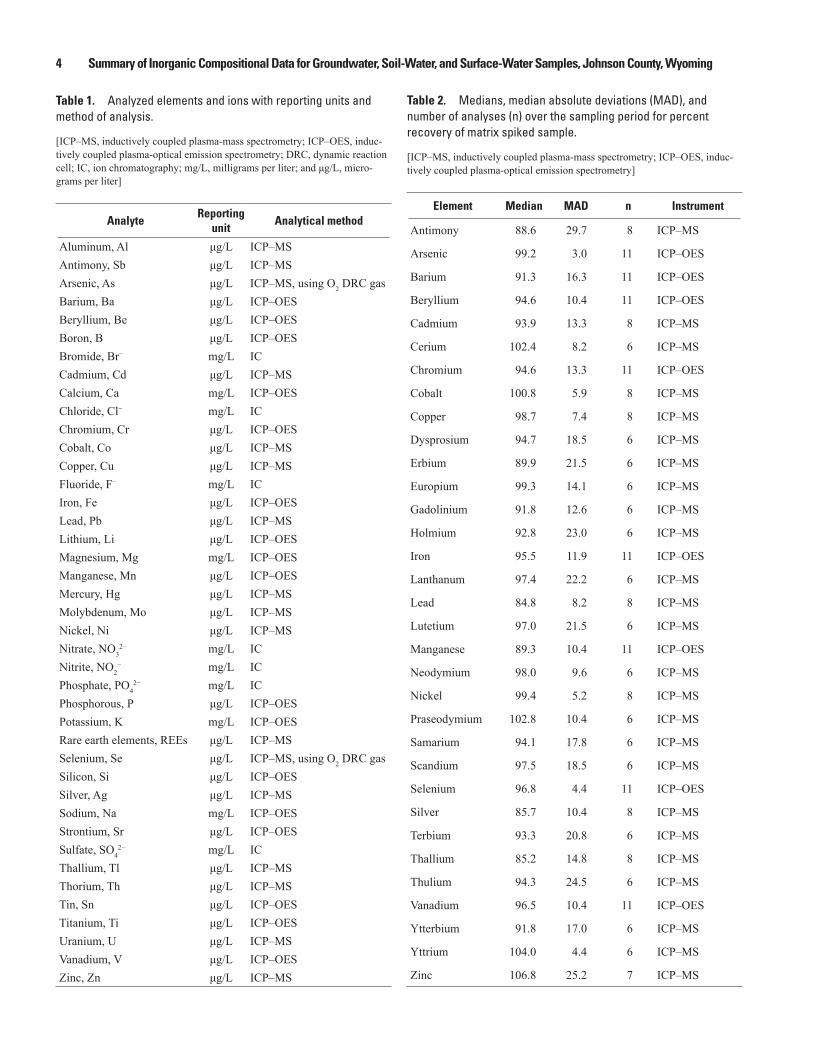
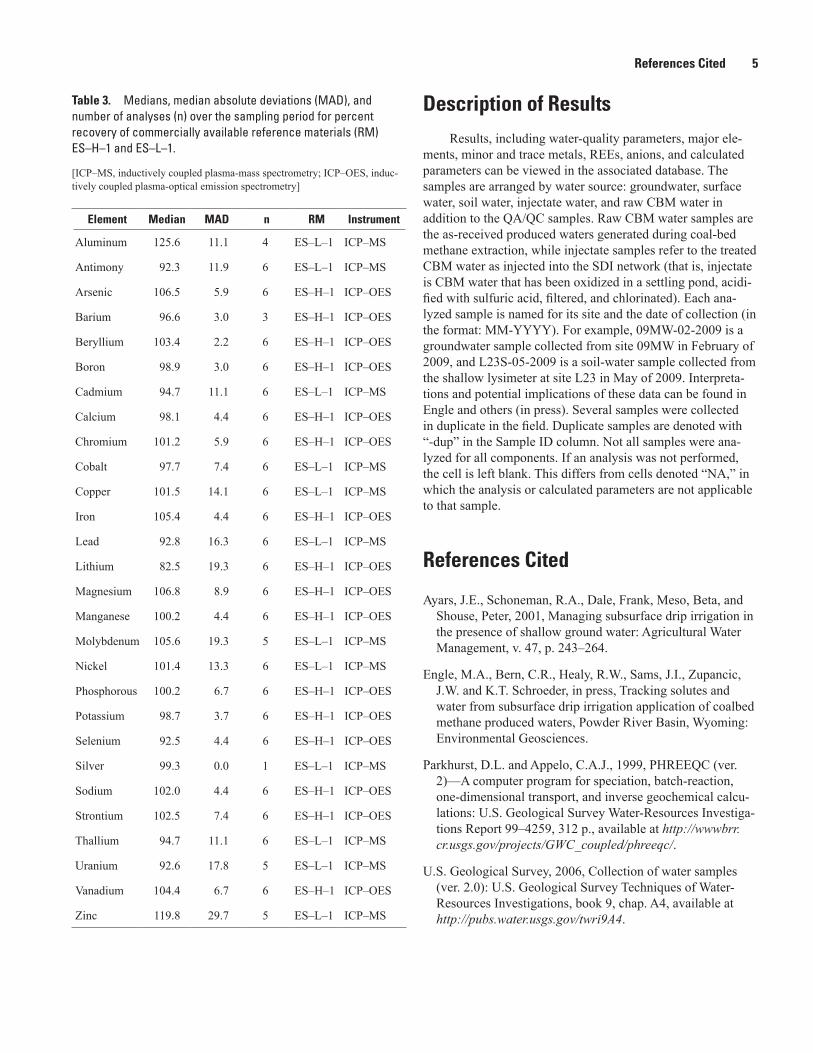
As a means of determining quality assurance and quality control (QA/QC), field blanks, equipment blanks (including those testing filters, tubing, and pumps), duplicate samples, matrix spikes, and reference materials were submitted and (or) run with sample sets. The blank results were all suffi-ciently low relative to the magnitude of the samples and the elements of primary interest, suggesting filtering and field contamination have not significantly affected the results of the study. Median and median absolute deviation (MAD) results for matrix spikes and reference materials are pro-vided in tables 2 and 3, where ES–H–1 (run on ICP–OES) and ES–L–1 (run on ICP–MS) are commercial groundwater certified reference materials. With respect to the matrix spike results, medians for all elements were within 90 to 110-per-cent recovery, save manganese (median = 89), silver (median = 86), antimony (median = 89), thallium (median = 85), and lead (median = 85). Medians for all elements were also within 90 to 110-percent recovery for the reference materials except for lithium (median = 83), aluminum (median = 126), and zinc (median = 120). Results in tables 2 and 3 indicate that analyti-cal accuracy and precision of the data are adequate for most elements and that matrix interferences appear to be relatively minor for these samples.
4 Summary of Inorganic Compositional Data for Groundwater, Soil-Water, and Surface-Water Samples, Johnson County, Wyoming
Table 1. Analyzed elements and ions with reporting units and method of analysis.
[ICP–MS, inductively coupled plasma-mass spectrometry; ICP–OES, induc-tively coupled plasma-optical emission spectrometry; DRC, dynamic reaction cell; IC, ion chromatography; mg/L, milligrams per liter; and μg/L, micro-grams per liter]
AnalyteReporting
unitAnalytical method
Aluminum, Al μg/L ICP–MSAntimony, Sb μg/L ICP–MSArsenic, As μg/L ICP–MS, using O2 DRC gasBarium, Ba μg/L ICP–OESBeryllium, Be μg/L ICP–OESBoron, B μg/L ICP–OESBromide, Br− mg/L ICCadmium, Cd μg/L ICP–MSCalcium, Ca mg/L ICP–OESChloride, Cl− mg/L ICChromium, Cr μg/L ICP–OESCobalt, Co μg/L ICP–MSCopper, Cu μg/L ICP–MSFluoride, F− mg/L ICIron, Fe μg/L ICP–OESLead, Pb μg/L ICP–MSLithium, Li μg/L ICP–OESMagnesium, Mg mg/L ICP–OESManganese, Mn μg/L ICP–OESMercury, Hg μg/L ICP–MSMolybdenum, Mo μg/L ICP–MSNickel, Ni μg/L ICP–MSNitrate, NO3
2− mg/L ICNitrite, NO2
− mg/L ICPhosphate, PO4
2− mg/L ICPhosphorous, P μg/L ICP–OESPotassium, K mg/L ICP–OESRare earth elements, REEs μg/L ICP–MSSelenium, Se μg/L ICP–MS, using O2 DRC gasSilicon, Si μg/L ICP–OESSilver, Ag μg/L ICP–MSSodium, Na mg/L ICP–OESStrontium, Sr μg/L ICP–OESSulfate, SO4
2− mg/L ICThallium, Tl μg/L ICP–MSThorium, Th μg/L ICP–MSTin, Sn μg/L ICP–OESTitanium, Ti μg/L ICP–OESUranium, U μg/L ICP–MSVanadium, V μg/L ICP–OESZinc, Zn μg/L ICP–MS
Table 2. Medians, median absolute deviations (MAD), and number of analyses (n) over the sampling period for percent recovery of matrix spiked sample.
[ICP–MS, inductively coupled plasma-mass spectrometry; ICP–OES, induc-tively coupled plasma-optical emission spectrometry]
Element Median MAD n Instrument
Antimony 88.6 29.7 8 ICP–MS
Arsenic 99.2 3.0 11 ICP–OES
Barium 91.3 16.3 11 ICP–OES
Beryllium 94.6 10.4 11 ICP–OES
Cadmium 93.9 13.3 8 ICP–MS
Cerium 102.4 8.2 6 ICP–MS
Chromium 94.6 13.3 11 ICP–OES
Cobalt 100.8 5.9 8 ICP–MS
Copper 98.7 7.4 8 ICP–MS
Dysprosium 94.7 18.5 6 ICP–MS
Erbium 89.9 21.5 6 ICP–MS
Europium 99.3 14.1 6 ICP–MS
Gadolinium 91.8 12.6 6 ICP–MS
Holmium 92.8 23.0 6 ICP–MS
Iron 95.5 11.9 11 ICP–OES
Lanthanum 97.4 22.2 6 ICP–MS
Lead 84.8 8.2 8 ICP–MS
Lutetium 97.0 21.5 6 ICP–MS
Manganese 89.3 10.4 11 ICP–OES
Neodymium 98.0 9.6 6 ICP–MS
Nickel 99.4 5.2 8 ICP–MS
Praseodymium 102.8 10.4 6 ICP–MS
Samarium 94.1 17.8 6 ICP–MS
Scandium 97.5 18.5 6 ICP–MS
Selenium 96.8 4.4 11 ICP–OES
Silver 85.7 10.4 8 ICP–MS
Terbium 93.3 20.8 6 ICP–MS
Thallium 85.2 14.8 8 ICP–MS
Thulium 94.3 24.5 6 ICP–MS
Vanadium 96.5 10.4 11 ICP–OES
Ytterbium 91.8 17.0 6 ICP–MS
Yttrium 104.0 4.4 6 ICP–MS
Zinc 106.8 25.2 7 ICP–MS
References Cited 5
Table 3. Medians, median absolute deviations (MAD), and number of analyses (n) over the sampling period for percent recovery of commercially available reference materials (RM) ES–H–1 and ES–L–1.
[ICP–MS, inductively coupled plasma-mass spectrometry; ICP–OES, induc-tively coupled plasma-optical emission spectrometry]
Element Median MAD n RM Instrument
Aluminum 125.6 11.1 4 ES–L–1 ICP–MS
Antimony 92.3 11.9 6 ES–L–1 ICP–MS
Arsenic 106.5 5.9 6 ES–H–1 ICP–OES
Barium 96.6 3.0 3 ES–H–1 ICP–OES
Beryllium 103.4 2.2 6 ES–H–1 ICP–OES
Boron 98.9 3.0 6 ES–H–1 ICP–OES
Cadmium 94.7 11.1 6 ES–L–1 ICP–MS
Calcium 98.1 4.4 6 ES–H–1 ICP–OES
Chromium 101.2 5.9 6 ES–H–1 ICP–OES
Cobalt 97.7 7.4 6 ES–L–1 ICP–MS
Copper 101.5 14.1 6 ES–L–1 ICP–MS
Iron 105.4 4.4 6 ES–H–1 ICP–OES
Lead 92.8 16.3 6 ES–L–1 ICP–MS
Lithium 82.5 19.3 6 ES–H–1 ICP–OES
Magnesium 106.8 8.9 6 ES–H–1 ICP–OES
Manganese 100.2 4.4 6 ES–H–1 ICP–OES
Molybdenum 105.6 19.3 5 ES–L–1 ICP–MS
Nickel 101.4 13.3 6 ES–L–1 ICP–MS
Phosphorous 100.2 6.7 6 ES–H–1 ICP–OES
Potassium 98.7 3.7 6 ES–H–1 ICP–OES
Selenium 92.5 4.4 6 ES–H–1 ICP–OES
Silver 99.3 0.0 1 ES–L–1 ICP–MS
Sodium 102.0 4.4 6 ES–H–1 ICP–OES
Strontium 102.5 7.4 6 ES–H–1 ICP–OES
Thallium 94.7 11.1 6 ES–L–1 ICP–MS
Uranium 92.6 17.8 5 ES–L–1 ICP–MS
Vanadium 104.4 6.7 6 ES–H–1 ICP–OES
Zinc 119.8 29.7 5 ES–L–1 ICP–MS
Description of ResultsResults, including water-quality parameters, major ele-
ments, minor and trace metals, REEs, anions, and calculated parameters can be viewed in the associated database. The samples are arranged by water source: groundwater, surface water, soil water, injectate water, and raw CBM water in addition to the QA/QC samples. Raw CBM water samples are the as-received produced waters generated during coal-bed methane extraction, while injectate samples refer to the treated CBM water as injected into the SDI network (that is, injectate is CBM water that has been oxidized in a settling pond, acidi-fied with sulfuric acid, filtered, and chlorinated). Each ana-lyzed sample is named for its site and the date of collection (in the format: MM-YYYY). For example, 09MW-02-2009 is a groundwater sample collected from site 09MW in February of 2009, and L23S-05-2009 is a soil-water sample collected from the shallow lysimeter at site L23 in May of 2009. Interpreta-tions and potential implications of these data can be found in Engle and others (in press). Several samples were collected in duplicate in the field. Duplicate samples are denoted with “-dup” in the Sample ID column. Not all samples were ana-lyzed for all components. If an analysis was not performed, the cell is left blank. This differs from cells denoted “NA,” in which the analysis or calculated parameters are not applicable to that sample.
References Cited
Ayars, J.E., Schoneman, R.A., Dale, Frank, Meso, Beta, and Shouse, Peter, 2001, Managing subsurface drip irrigation in the presence of shallow ground water: Agricultural Water Management, v. 47, p. 243–264.
Engle, M.A., Bern, C.R., Healy, R.W., Sams, J.I., Zupancic, J.W. and K.T. Schroeder, in press, Tracking solutes and water from subsurface drip irrigation application of coalbed methane produced waters, Powder River Basin, Wyoming: Environmental Geosciences.
Parkhurst, D.L. and Appelo, C.A.J., 1999, PHREEQC (ver. 2)—A computer program for speciation, batch-reaction, one-dimensional transport, and inverse geochemical calcu-lations: U.S. Geological Survey Water-Resources Investiga-tions Report 99–4259, 312 p., available at http://wwwbrr.cr.usgs.gov/projects/GWC_coupled/phreeqc/.
U.S. Geological Survey, 2006, Collection of water samples (ver. 2.0): U.S. Geological Survey Techniques of Water-Resources Investigations, book 9, chap. A4, available at http://pubs.water.usgs.gov/twri9A4.

6 Summary of Inorganic Compositional Data for Groundwater, Soil-Water, and Surface-Water Samples, Johnson County, Wyoming
Western Regional Climate Center, 2010, Monthly climate summary for the Clearmont SW Station, Wyoming: accessed January 19, 2011, at http://www.wrcc.dri.edu/cgi-bin/cliMAIN.pl?wy1816.
AcknowledgmentsFunding for this project was provided by the U.S. Depart-
ment of Energy and U.S. Geological Survey Energy Resources Program. The authors would like to thank Don Fischer and
Ursula Williams from the Wyoming Department of Environ-mental Quality for providing technical support and assistance. Assistance with sampling logistics and analytical results was provided by Carol Cardone (National Energy Technology Laboratory, NETL), Robert Thompson (NETL), and Kristen Carlisle (NETL). Adam Quist (BeneTerra) greatly assisted with fieldwork and sample collection. This document benefited from discussions with members of the USGS Energy Program Laboratories and thoughtful comments from Palma Botterell and Margo Corum.


Geboy and others— Sum
mary of Inorganic Com
positional Data for Groundwater, Soil-W
ater, and Surface-Water Sam
ples, Johnson County, Wyom
ing—Data Series 619