summary of coral cay conservation s … · management of these resources can be assistedby data...
TRANSCRIPT

SUMMARY OF CORAL CAY CONSERVATION’S OCEANOGRAPHIC, CLIMATE AND ANTHROPOGENIC
IMPACT DATA FROM TURNEFFE ATOLL, BELIZE
- by -
Caroline Turnbull, Data Analyst Alastair Harborne , Marine Science Co-ordinator
May 2000
CORAL CAY CONSERVATION LTD 154 CLAPHAM PARK ROAD LONDON, SW4 7DE, UK TEL: +44 (0)20 7498 6248 FAX: +44 (0)20 7498 8447 Email: [email protected] www: http://www.coralcay.org/
This report is part of a series of working documents detailing CCC’s
science programme on Turneffe Atoll (1994-1998). The series is also available on CD-Rom.

Contents Turneffe Atoll oceanography, climate and anthropogenic impact report
i
CONTENTS CONTENTS ..............................................................................................................................................................I
EXECUTIVE SUMMARY ................................................................................................................................. II
ACKNOWLEDGEMENTS ...............................................................................................................................IV
ABBREVIATIONS ...............................................................................................................................................V
FIGURES, TABLES AND APPENDICES ....................................................................................................VI
1. INTRODUCTION .......................................................................................................................................1
1.1 BELIZE.........................................................................................................................................................1 1.2 CORAL CAY CONSERVATION...................................................................................................................1 1.3 TURNEFFE ATOLL PROJECT......................................................................................................................3
2. METHODS ....................................................................................................................................................4
2.1 SURVEYORS................................................................................................................................................4 2.2 STUDY SITES...............................................................................................................................................4 2.3 TEMPERATURE ...........................................................................................................................................4 2.4 VISIBILITY..................................................................................................................................................4 2.5 CURRENTS..................................................................................................................................................4 2.6 WIND...........................................................................................................................................................6 2.7 NATURAL AND ANTHROPOGENIC IMPACTS............................................................................................6 2.8 BOATS.........................................................................................................................................................6 2.9 OVERALL IMPRESSION OF THE SITE.........................................................................................................6
3. RESULTS .......................................................................................................................................................7
3.1 TEMPERATURE ...........................................................................................................................................7 3.2 VISIBILITY..................................................................................................................................................7 3.3 CURRENTS..................................................................................................................................................9 3.4 WIND.........................................................................................................................................................11 3.5 NATURAL AND ANTHROPOGENIC IMPACTS..........................................................................................11
3.5.1 Surface impacts ........................................................................................................................... 11 3.5.2 Underwater impacts.................................................................................................................... 12
3.6 BOATS.......................................................................................................................................................13 3.7 OVERALL IMPRESSION OF SURVEY SITES.............................................................................................15
3.7.1 Biological values......................................................................................................................... 15 3.7.2 Aesthetic values........................................................................................................................... 15
4. DISCUSSION............................................................................................................................................. 18
4.1 OCEANOGRAPHY AND CLIMATE............................................................................................................18 4.2 NATURAL AND ANTHROPOGENIC IMPACTS..........................................................................................19 4.3 AESTHETIC AND BIOLOGICAL IMPRESSIONS ........................................................................................20
5. RECOMMENDATIONS ........................................................................................................................ 21
6. REFERENCES .......................................................................................................................................... 22

Executive Summary Turneffe Atoll oceanography, climate and anthropogenic impact report
ii
EXECUTIVE SUMMARY The coastal waters of Belize consist of a complex set of reefal resources which are economically important for industries such as tourism and fishing. Effective management of these resources can be assisted by data collected by self-financing volunteer divers. This technique has been used in Belize by Coral Cay Conservation (CCC) to provide data to the Department of Fisheries and Coastal Zone Management Project. Between 1994 and 1997 CCC volunteers collected baseline biological data to facilitate the production of a habitat resource map. During these surveys, additional oceanographic, climatic and natural and anthropogenic impact data were also collected. These data consisted of surface temperature readings, vertical and horizontal water visibility, the strength and direction of the current and wind, presence or absence of five categories of surface and underwater impacts, details of any boats seen and a general impression of biological and aesthetic impressions at each site. Although these data are qualitative and non-systematic, they provide an opportunity to document gross patterns and anomalous results and serve as a baseline for future studies. Data for many parameters within this study were consistent with known patterns. For example, sea surface temperatures had a mean of 28.4°C with variation between the seasons. CCC’s data also clearly documented the maxima in the middle of 1995 that resulting in a significant coral bleaching event. Similarly, prevailing winds were from the north-east with occasional cold and wet northerlies and current patterns along the north-south axis on the east and west side and around the north and south tips of the atoll. Horizontal and vertical visibility, which were collected as gross surrogates of turbidity, were generally high (approximately 20 m), as expected on an oceanic atoll. There was lower horizontal visibility on the leeward, western side compared to the eastern side and the lagoon was more turbid compared to reefal sites. Generally, pollution and solid debris were not present in high quantities around the atoll, but surface ‘Litter’ was present during 6.5% of surveys and reached a maximum of 12% in areas such as Turneffe Flats. There was some evidence that much of this litter, and occasional incidents of ‘sewage’ originated from the resorts and fishing communities. Underwater impacts were uncommon (<3% for each category) but there was some ‘Coral damage’, again possibly linked to anthropogenic activities such as diving. Boats around Turneffe Atoll were not numerous and generally small with a maximum density of approximately 0.8 boats per survey at Caye Bokel. Popular dive sites and areas close to resorts had the most boats. The reef around Turneffe Atoll was generally perceived by CCC volunteers to be aesthetically and biologically ‘good’ with the lagoon perceived as less interesting, little variation around the atoll and patch reefs equivalent to true reef zones. This study leads to the following recommendations: ?? UCB, the Coastal Zone Management Project or the Fisheries Department continue
to collect basic oceanographic, climatic and impacts data to monitor temporal

Executive Summary Turneffe Atoll oceanography, climate and anthropogenic impact report
iii
changes. These data will also provide important information on anomalous events, such as the increased water temperatures that led to a bleaching event in 1995.
?? Oceanographic data, particularly for currents, should be extended to allow
analysis of how coral and fish larvae are entrained and circulated around the atoll. Such information is vital for ensuring that the main sources of larvae are conserved.
?? Establish a code of practise for people living an working on the atoll regarding
sewage and waste disposal and boat anchoring. Provide a standard environmental awareness briefing for all visitors to the dive resorts.
?? If any sites show evidence of diver impacts, visitors should be encouraged to
utilise other areas of the atoll. The relatively sheltered, northern patch reefs could be developed to attract snorkelers.
?? Continue to aim to establish a multiple use marine protected area at Turneffe
Atoll, with an integrated monitoring programme to measure its efficacy.

Acknowledgements Turneffe Atoll oceanography, climate and anthropogenic impact report
iv
ACKNOWLEDGEMENTS CCC would like to thank the Department of Fisheries (Ministry of Agriculture and Fisheries), UNDP-GEF Coastal Zone Management Project and University College of Belize for their support at the Calabash Cay Marine Research Centre. CCC are also very grateful to all the field staff and volunteers who have participated on the Turneffe Atoll project. CCC would also like to thank the following: Belize Defence Force British Forces Belize British High Commission, Belize Darwin Initiative for the Survival of Species Department of Forestry (Ministry of Natural Resources) Environmental Systems Research Institute (ESRI) Lands Information Centre (Ministry of Natural Resources) Ministry of Tourism and the Environment Trimble Navigation Unistat Ltd

Abbreviations Turneffe Atoll oceanography, climate and anthropogenic impact report
v
ABBREVIATIONS CCC Coral Cay Conservation CZMP Coastal Zone Management Project CZMU Coastal Zone Management Unit GEF Global Environment Facility GOB Government of Belize IUCN World Conservation Union MOU Memorandum of Understanding MRC Marine Research Centre NGO Non Government Organisation PS Project Scientist SD Standard deviation SO Science Officer SST Sea surface temperature UCB University Collage Belize UNEP United Nations Environment Programme UNDP United Nations Development Programme

Figures, tables and appendices Turneffe Atoll oceanography, climate and anthropogenic impact report
vi
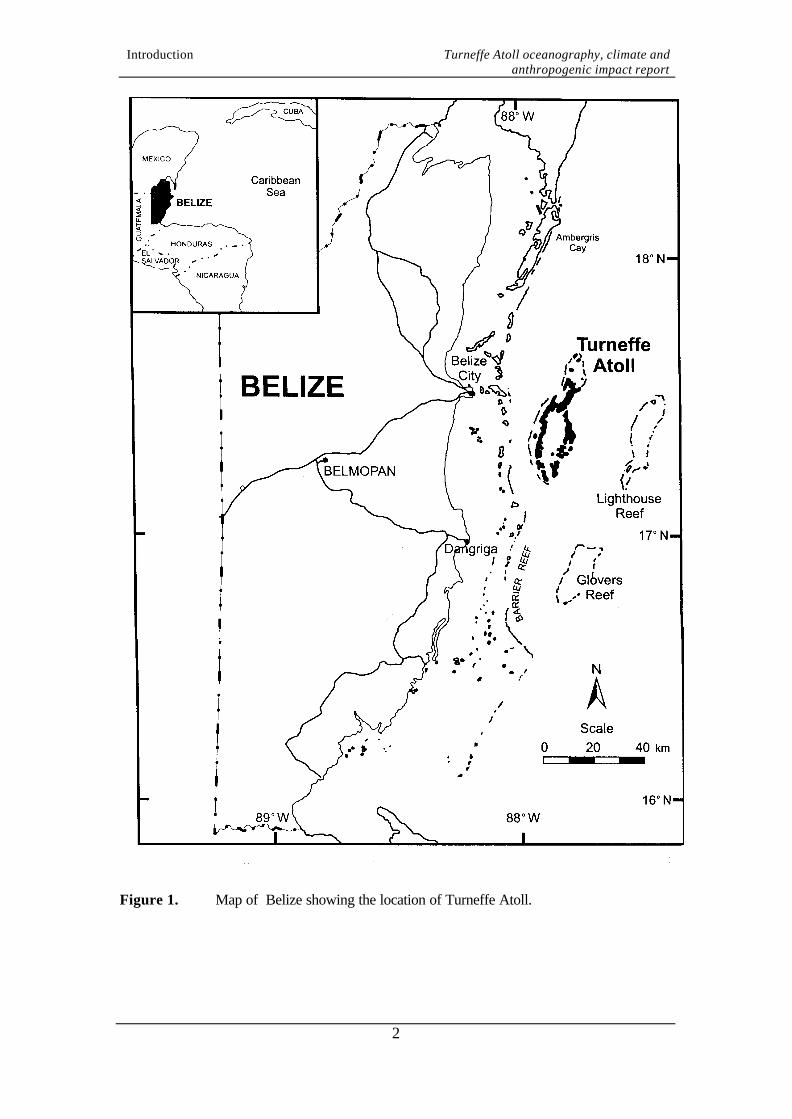
FIGURES, TABLES AND APPENDICES Figure 1. Map of Belize showing the location of Turneffe Atoll. Figure 2. Map of Turneffe Atoll, showing the location of the study areas. Figure 3. Sea surface temperature at Turneffe Atoll during the survey period. Figure 4. Vertical and Secchi disc (horizontal) readings of water column
visibility throughout the survey period on Turneffe Atoll. Figure 5. The currents at each survey site around the atoll. Figure 6. Wind rose for Turneffe Atoll for the duration of the study. Figure 7. Proportion of surveys within each study area affected by each surface
impact category. Figure 8. Proportion of surveys within each study area affected by each
underwater impact category. Figure 9. Comparative density of boats in each study area. Figure 10. Summary of boat activities observed in study area. Figure 11. Summary of the ratings for biological values of survey sites in each
study area and zone. Figure 12. Summary of the ratings for aesthetic values of survey sites in each
study area and zone. Table 1. Vertical and horizontal readings of water column visibility at different
survey areas around Turneffe Atoll. Table 2. Percentage of sites, around whole atoll, affected by each category of
surface impact. Table 3. Percentage of sites, around whole atoll, affected by each category of
underwater impact.

Introduction Turneffe Atoll oceanography, climate and anthropogenic impact report
1
1. INTRODUCTION 1.1 Belize The coastal waters of Belize (Central America) consist of a complex set of reefal resources, including the largest barrier reef in the western hemisphere (Figure 1). Belize also has three major atolls of the Caribbean, numerous patch reefs, lagoons, sand and mangrove cays and forests. The coastal waters of Belize are economically important for industries such as tourism and fishing. In 1990, aware of a growing conflict between the preservation and human exploitation of the reef environment, Government of Belize (GOB) established a Coastal Zone Management Unit (CZMU) under the Ministry of Agriculture and Fisheries. The CZMU was then superseded by a Coastal Zone Management Project (CZMP), funded by the UNDP Global Environment Facility (GEF). In 1998, a Coastal Zone Management Bill established a Coastal Zone Management Authority and Institute to provide overall management of the coastal zone. 1.2 Coral Cay Conservation Effective management, including conservation of coral reefs and tropical forests, requires a holistic and multi-disciplinary approach. This is often a highly technical and costly process which many developing countries cannot adequately afford. With appropriate training, non-scientific, self-financing volunteer divers have been shown to be able to provide useful data for coastal zone management at little or no cost to the host country. This technique has been pioneered and successfully applied by Coral Cay Conservation (CCC), a British non-profit organisation. CCC is an international NGO committed to providing resources for the protection and sustainable use of tropical coastal environments. CCC does not charge the host country for the service it provides and is primarily self-financed through a pioneering volunteer participatory scheme. Within the scheme, members of the public are given the opportunity to join a phase of each project in return for a financial contribution to the CCC programme. At the expedition site, volunteers are provided with suitable training and collect data under the guidance of project scientists. Finances generated from the volunteer programme allow CCC to provide conservation education, technical skills training and capacity building, contributing to a strong policy of collaboration with government and non-government organisations within the host country. Data and technical assistance have been provided to both the Department of Fisheries and CZMP under the remit of a Memorandum of Understanding (MOU). The MOU was signed in 1990 and updated and extended in both 1994 and 1998. Since 1990, CCC has provided data for six proposed or established marine protected areas at South Water Cay, Bacalar Chico, Sapodilla Cays, Snake Cays, Laughing Bird Cay and Caye Caulker. These projects have generally provided habitat maps, the associated databases and management recommendations to assist reserve planning (for example, McCorry et al., 1993; Gill et al., 1995; Gill et al., 1996).
Introduction Turneffe Atoll oceanography, climate and anthropogenic impact report
2
Figure 1. Map of Belize showing the location of Turneffe Atoll.
Introduction Turneffe Atoll oceanography, climate and anthropogenic impact report
3
1.3 Turneffe Atoll Project In 1993 the University College of Belize (UCB) entered into a working agreement with CCC to collaborate towards the establishment of a permanent, self-financing Marine Research Centre (MRC) of both regional and international standing. The field site was selected as Calabash Cay on Turneffe Atoll (Figure 1), the largest atoll in the Caribbean at approximately 330 km2 (UNEP/IUCN, 1988). Turneffe Atoll is completely surrounded by an extensive reef system which encompasses a complex central lagoon and extensive mangrove forested cays. The principle objectives of the MRC project were identified as protection of the terrestrial and marine resources of Turneffe Atoll, strengthening the capacity of UCB to undertake coastal marine research and training and providing technical assistance to the Department of Fisheries. In August 1994, the agreement between CCC and UCB was endorsed by the GOB through the signing of a MOU between the three lead agencies. A core component of this MOU was establishing and monitoring a management plan for Turneffe Atoll. Between January 1994 and early 1997, CCC volunteers carried out surveys around the whole atoll which have resulted in an extensive database of baseline information. Analysis of these data and combination with aerial photographs has led to a Turneffe Atoll Habitat Map, the first draft of which was completed in August 1998. Between March 1997 and December 1998 this baseline database has been complemented by on-going surveys to quantitatively document the abundance of commercially important fish species. CCC’s survey work at Turneffe Atoll was designed to obtain sufficient data from which comprehensive habitat and additional resource maps could be created in order to assist the planning of sustainable management initiatives. However, in addition to this primary aim, CCC has also initiated basic assessments of reef health close to Calabash Cay via Reef Check and Atlantic and Gulf Rapid Reef Assessment surveys. This report details the oceanographic, climatic and anthropogenic impact data which were collected between January 1994 and January 1997 by CCC volunteers. These data, collected during routine baseline surveys to produce the biological resource map, are relatively qualitative and require additional detailed research to fully quantify the patterns and trends. However, this report aims to provide an overview of the conditions which prevailed at Turneffe Atoll during the period of CCC’s fieldwork and provide a context for the biological data detailed in the accompanying reports.
Methods Turneffe Atoll oceanography, climate and anthropogenic impact report
4
2. METHODS 2.1 Surveyors All data presented in this report were collected by CCC volunteers during standard transects to assess reef habitat types (see Raines et al., 1993 and Harborne and Taylor, 2000 for full details of the methodology). Volunteers have a week of intensive science training and testing (see Harborne, 1999) which enables them to implement the survey protocols, including measuring given parameters and identifying species precisely and consistently (Mumby et al., 1995). Volunteer divers in Belize are co-ordinated by a Project Scientist (PS) and Science Officer (SO). The primary responsibilities of the PS and SO are to train CCC volunteers in marine life identification, survey techniques and other supporting skills. The PS and SO also co-ordinate and supervise subsequent surveys and data collection. 2.2 Study sites Data were collected within individual ‘study areas’ (Figure 2) which were defined a priori to assist structuring the survey work. Furthermore, this facilitates data analysis at the scale of both the whole atoll and by individual study areas to examine different spatial patterns. 2.3 Temperature Temperature readings (±0.5°C) were taken from the survey boat using a bulb thermometer at the sea surface. When possible, readings were taken during every survey from March 1995, when temperature first included in the survey protocol. 2.4 Visibility Water visibility, a surrogate of turbidity, was measured both vertically and horizontally. A Secchi disc was used on the survey boat to measure vertical visibility through the water column. Readings were not taken where the water was too shallow to obtain a true reading and were obtained by looking through the air-sea interface. Horizontal visibility through the water column was measured by divers’ estimates while underwater. Horizontal readings were taken during all surveys throughout the sampling period but Secchi discs were only introduced after many sites had been completed and are only available for a few survey sectors. 2.5 Currents The strength and direction of the current at each survey site was qualitatively assessed by the survey divers. Direction was recorded as one of eight compass points (direction current was flowing towards) and strength was assessed as being ‘None’, ‘Weak’, ‘Medium’ or ‘Strong’.

Methods Turneffe Atoll oceanography, climate and anthropogenic impact report
5
Figure 2. Map of Turneffe Atoll, showing the location of the study areas. In addition, a
study site was defined in the lagoon enclosed within Calabash Cay (‘Big Lagoon’), in the main lagoon within the atoll (‘Lagoon’) and behind the reef crest (‘Back Reef’).

Methods Turneffe Atoll oceanography, climate and anthropogenic impact report
6
2.6 Wind The strength and direction of the wind at each survey site was qualitatively assessed by volunteers on the survey boat. Direction was recorded as one of eight compass points (direction wind was blowing from) and strength was assessed using the Beaufort Scale. 2.7 Natural and anthropogenic impacts Natural and anthropogenic impacts were assessed both at the surface from the survey boat and by divers during each survey. Surface impacts were classified as ‘litter’, ‘sewage’, ‘driftwood’, ‘algae’ and ‘fishing nets’. Sub-surface impacts were categorised as ‘litter’, ‘sewage’, ‘coral damage’, ‘lobster potting’ and ‘fish traps’. All information was assessed as presence / absence and hence was then converted to binary data for analysis. 2.8 Boats Any boats seen from the boat during a survey were recorded, along with information on the number of occupants and its activity. The activity of each boat was categorised as ‘diving’, ‘fishing’, ‘pleasure’, ‘commercial’ and ‘unknown’. Effort was made to not record the same boat twice when completing concurrent surveys within an area. 2.9 Overall impression of the site A general impression of the site was recorded by the divers during each survey. These rating were completed for biological (e.g. benthic and fish community diversity and abundance) and aesthetic (e.g. topography) parameters. Both parameters were ranked as 5 (excellent), 4 (very good), 3 (good), 2 (average) or 1 (Poor).

Results Turneffe Atoll oceanography, climate and anthropogenic impact report
7
3. RESULTS 3.1 Temperature The sea surface temperature (SST) data at Turneffe Atoll detected an annual cycle with temperatures being higher during June - September and lower in October - March (Figure 3). During 1995, SST was lowest in March with temperatures of approximately 27?C. SST then proceeded to climb until June when the temperature levelled out at 30?C which remained the mean until September when the temperature declined to around 26?C. SST began to rise again during mid 1996 and reached similar temperatures to 1995, approximately 29?C and higher, although these temperatures persisted for a considerably shorter period. There were two peaks of especially high SST during June and September 1995 when there was a cluster of readings above 31?C. Overall, 1995 appears from the graph to have been a slightly warmer year than 1996, but the mean temperature over the whole period was 28.4?C.
25/5/9518/9/95
15
17
19
21
23
25
27
29
31
33
35
2/20/95 4/11/95 5/31/95 7/20/95 9/8/95 10/28/95 12/17/95 2/5/96 3/26/96 5/15/96 7/4/96 8/23/96 10/12/96 12/1/96 1/20/97 3/11/97
Date
Figure 3. Sea surface temperature at Turneffe Atoll during the survey period. 3.2 Visibility Visibility within the water column did not have any clear trends over the period of surveying. Both horizontal and vertical records fluctuated around a value of approximately 20 m (Figure 4). There was a slightly decreased level of visibility in May and July 1995. During this period, survey work was being carried out in the

Results Turneffe Atoll oceanography, climate and anthropogenic impact report
8
Lagoon, Long Ridge and North Bogue. As can be seen in Table 1, the Lagoon survey area has mean visibilities which are considerably lower than the overall means, which were 19.9 m for horizontal visibility (SD = 7.8, n = 1305) and 18.1 m for vertical visibility (SD = 8.6, n = 385). Other study areas which had particularly low visibilities were Big Lagoon, Back Reef, Dog Flea Cay, Crawl Cay and Rendezvous Point. In contrast, the sites with the clearest water were recorded as Deadmans Cay, Turneffe Flats, Mauger Cay and Calabash Cay. There was no significant difference between vertical visibility in the 15 different reef study areas (ANOVA, p>0.05) but there was a significant difference for horizontal visibility (ANOVA, p<0.01). These results are confused by sampling each area sequentially rather than concurrently, but generally the eastern side seems clearer than the western side. Hence multiple range tests show, for example, that Turneffe Flats has significantly higher horizontal visibility than all other areas.
0
5
10
15
20
25
30
35
40
45
1/24/94 4/24/94 7/24/94 10/24/94 1/24/95 4/24/95 7/24/95 10/24/95 1/24/96 4/24/96 7/24/96 10/24/96
Date
Horizontal visibility Secchi Disc
Figure 4. Vertical and Secchi disc (horizontal) readings of water column visibility
throughout the survey period on Turneffe Atoll.

Results Turneffe Atoll oceanography, climate and anthropogenic impact report
9
Table 1. Vertical and horizontal readings of water column visibility at different survey areas around Turneffe Atoll.
Horizontal Vertical Survey area
n Mean SD n Mean SD Back Reef 25 12.7 5.9 - - - Big Lagoon 5 8.6 2.2 - - - Blackbird Cay 100 19.6 5.6 - - - Calabash Cay 73 22.5 5.3 30 22.8 5.0 Caye Bokel 87 20.0 6.9 53 19.2 8.7 Crawl Cay 14 16.0 5.1 3 19.0 11.5 Deadmans Cay 91 20.3 7.2 2 34.3 8.8 Dogflea Cay 134 21.5 8.8 6 10.4 16.0 Grand Bogue 78 20.3 5.2 - - - Halfmoon Cay 85 20.0 6.5 85 19.4 5.5 Long Ridge 73 20.0 10.6 52 21.1 9.7 Lagoon 84 12.1 8.5 53 10.9 5.3 Mauger Cay 86 22.6 7.4 14 16.4 7.1 North Bogue 105 18.4 5.9 58 16.7 9.0 Rendezvous Point 62 18.0 7.7 6 5.3 2.1 Snake Point 46 21.0 9.1 - - - Tarpon Creek 59 19.7 5.7 8 14.9 10.5 Turneffe Flats 98 25.0 6.1 15 26.9 7.3 3.3 Currents The currents around Turneffe Atoll in each study area are summarised via a series of current roses (Figure 5). Currents were generally ‘weak’. Figure 5 shows that currents on the east and west side generally flow along the north-south axis and on the east-west axis around the north and south tips of the atoll. The strongest currents were generally observed in the north-east of the atoll. Strongest currents in the lagoon were to the west.

Results Turneffe Atoll oceanography, climate and anthropogenic impact report
10
Figure 5. The currents at each survey site around the atoll. Length of bars indicates
frequency of occurrence.

Results Turneffe Atoll oceanography, climate and anthropogenic impact report
11
3.4 Wind The prevailing winds for the whole of Turneffe Atoll are summarised as a wind rose (Figure 6). Dominant winds were clearly north-easterly or easterly. Wind was recorded for just under 90% of the survey sites (calm on 11.7% of surveys) and the majority of conditions were ‘light’ or ‘gentle breeze’ (2 and 3 on the Beaufort Scale). Since diving could not be undertaken in winds beyond a rating of 5, strong winds were not recorded during the survey period, although they certainly occurred. Northerly winds occurred particularly from September 1994 to February 1995.
Figure 6. Wind rose for Turneffe Atoll for the duration of the study. Length of bars
indicate frequency of occurrence. Scale indicates ratings on the Beaufort Scale.
3.5 Natural and anthropogenic impacts 3.5.1 Surface impacts Surface impacts are summarised in Table 2 and shown by study area in Figure 7. ‘Algae’ affected the largest proportion of sites (9.9%) and was found around the entire atoll. ‘Driftwood’ was also found to be present at almost all of the sites surrounding the atoll but was not present as frequently as ‘algae’. ‘Litter’ was present around the entire atoll, but not in the back reef, and was present in 6.5% of sites on average. Tarpon Creek was the area the most affected by ‘litter’ with it being present at 11.9% of survey sites. ‘Sewage’ (broadly defined by CCC) was not frequently seen by divers on the surface of the water and was only present in three areas around the atoll (Dog Flea Cay, Turneffe Flats and Long Ridge). Overall, Blackbird Cay was the most affected area surveyed with all impacts being present except ‘sewage’ and with ‘litter’ and ‘algae’ commonly observed.

Results Turneffe Atoll oceanography, climate and anthropogenic impact report
12
Table 2. Percentage of sites, around whole atoll, affected by each category of surface impact. SD in parentheses. n = 1227.
Litter Sewage Driftwood Algae Fishing nets Sites affected (%) 6.5 (0.3) 0.4 (0.1) 3.1 (0.2) 9.8 (0.6) 0.6 (0.04)
0
5
10
15
20
25
30
35
40
45
Study sites
Algae Litter Driftwood Nets Sewage
Figure 7. Proportion of surveys within each study area affected by each surface impact
category. 3.5.2 Underwater impacts Impacts seen by divers during surveys are summarised in Table 3 and shown by study area in Figure 8. All the underwater impacts were infrequent (<3% of surveys) with ‘coral damage’ and ‘litter’ being most frequent (2.9 and 1.9% respectively). There were obvious differences between study areas with Caye Bokel, Deadmans Cay, Long Ridge and Tarpon Creek having the most ‘Litter’. ‘Coral damage’ occurred in most study areas, but Blackbird Cay and Dog Flea Cay were most affected. ‘Fish traps’ and ‘Lobster pots’ were generally absent but there was an unusual concentration of traps at Crawl Cay. Lobster pots were only present in the Blackbird Cay survey area. ‘Sewage’ was largely absent, but most frequent at Rendezvous Point. Surveys at Blackbird Cay had the highest total percentage of impacts.

Results Turneffe Atoll oceanography, climate and anthropogenic impact report
13
Table 3. Percentage of sites, around whole atoll, affected by each category of underwater impact. SD in parentheses. n = 1227.
Litter Sewage Coral damage Lobster pots Fish traps Sites affected (%) 1.9 (0.1) 0.4 (0.1) 2.9 (0.2) 0.1 (0.02) 0.3 (0.03)
0
2
4
6
8
10
12
14
16
Study site
Litter Coral damage Fish traps Sewage Lobster pots Figure 8. Proportion of surveys within each study area affected by each underwater
impact category. ‘Calabash’ and ‘Halfmoon’ excluded because the categories changed following completion of these study areas.
3.6 Boats A total of 451 boats were seen during the surveys (112 diving, 160 fishing, 41 ‘commercial’, 128 ‘pleasure’ and 10 unknown). A summary of the number of boats per survey (Figure 9) shows the highest density of boats in Caye Bokel, Rendezvous Point, Tarpon Creek and Back Reef (>0.65 boats per survey). Figure 10 shows the activities of these boats and highlights the highest proportion of dive boats in Rendezvous Point, Crawl Cay, Deadmans Cay and Caye Bokel. The highest proportion of fishing boats was in Mauger Cay, Turneffe Flats and Tarpon Creek. Finally, the highest proportion of ‘pleasure’ boats was in Blackbird Cay, Caye Bokel and Deadmans Cay.

Results Turneffe Atoll oceanography, climate and anthropogenic impact report
14
0
0.1
0.2
0.3
0.4
0.5
0.6
0.7
0.8
0.9
Study area
Figure 9. Comparative density of boats in each study area.
0%
20%
40%
60%
80%
100%
Sample Site
Fishing Pleasure Diving Commercial Unknown
Figure 10. Summary of boat activities observed in study area.

Results Turneffe Atoll oceanography, climate and anthropogenic impact report
15
3.7 Overall impression of survey sites 3.7.1 Biological values A summary of the median ratings, from 1 (poor) to 5 (excellent), assigned for biological values (e.g. abundance and diversity of the fauna and flora) in each study area is presented in Figure 11a. Figure 11a shows little variation between the reefal study areas, with all having median values between 2.5 and 3.5 (equivalent to a rating of ‘good’). Lower ratings (equivalent to ‘average’) were recorded for the two lagoonal sites. Figure 11b shows the same data analysed by reef zone. Patch reefs were perceived to have the highest biological values with a median value of 3.8 (‘very good’). Most of the other zones had values close to 3 (‘good’). Lagoon sites were assessed as poorer biologically with this zone only achieving a median of 1.9 (below the threshold for average quality). 3.7.2 Aesthetic values A summary of the median ratings, from 1 (poor) to 5 (excellent), assigned for aesthetic values (e.g. topography) in each study area is presented in Figure 12a. Figure 12a shows little variation between the reefal study areas, with most having median values between 2.5 and 3.5 (equivalent to a rating of ‘good’) and Snake Point having a median rating of over 3.5 (‘very good’). Lower ratings (equivalent to ‘average’) were recorded for the two lagoonal sites and the back reef. Figure 12b shows the same data analysed by reef zone. Patch reefs and outer drop-offs were perceived to have the highest biological values with a median values of approximately 3.5 (‘very good’). Most of the other zones had values of between 2.5 and 3 (‘good’). Lagoon sites were assessed as poorer aesthetically with this zone only achieving a median of below 1.5 (‘poor’).

Results Turneffe Atoll oceanography, climate and anthropogenic impact report
16
0
0.5
1
1.5
2
2.5
3
3.5
4
4.5
5
Study site
Figure 11a. Summary of the ratings for biological values of survey sites in each study
area. Categories from 1 (poor) to 5 (excellent).
0
0.5
1
1.5
2
2.5
3
3.5
4
Lagoon Back reef Reef crest Inner fore reef Outer fore reef Inner drop off Outer drop off Patch reef
Study site
Mea
n b
iolo
gic
al q
ual
ity
Figure 11b. Summary of the ratings for biological values of survey sites in each reef zone.
Categories from 1 (poor) to 5 (excellent). n: Lagoon = 91, Back reef = 30, Reef crest = 26, Inner fore reef = 486, Outer fore reef = 366, Inner drop off = 16, Outer drop off = 210 and Patch reef = 25.

Results Turneffe Atoll oceanography, climate and anthropogenic impact report
17
0
0.5
1
1.5
2
2.5
3
3.5
4
4.5
5
Study sites
Figure 12a. Summary of the ratings for aesthetic values of survey sites in each study area.
Categories from 1 (poor) to 5 (excellent).
0
0.5
1
1.5
2
2.5
3
3.5
4
4.5
5
Lagoon Back reef Reef crest Inner fore reef Outer fore reef Inner drop off Outer drop off Patch reef
Study site
Figure 12b. Summary of the ratings for aesthetic values of survey sites in each reef zone.
Categories from 1 (poor) to 5 (excellent). n: Lagoon = 91, Back reef = 30, Reef crest = 26, Inner fore reef = 486, Outer fore reef = 366, Inner drop off = 16, Outer drop off = 210 and Patch reef = 25.

Discussion Turneffe Atoll oceanography, climate and anthropogenic impact report
18
4. DISCUSSION 4.1 Oceanography and climate The oceanographic and climatic data collected by CCC volunteers are relatively qualitative and unsystematic because the main focus of the surveys was spatial assessment of reef habitat types. However, the database of information is extensive and suitable for highlighting gross patterns and recording anomalous events. The data also provide a baseline for further, more detailed studies. The oceanography and climate of Belize have been the subject of numerous studies (for example see Heyman and Kjerfve, 1999). Belize lies in the subtropical belt and experiences a dry and a wet season (from June to October). There are significant changes in all climatological parameters between these seasons and variation across the country. However, prevailing winds are from the north-east for 70% of the year (Koltes et al., 1998) and data from Turneffe Atoll correlate with this pattern. There was also evidence, particularly in 1994/95, of the northern winds which often occur between November and March as cold and wet air is pushed south by Arctic air masses. Similarly, the current patterns around Turneffe Atoll were consistent with the known pattern of a northerly current seaward of the three atolls, a southerly flow between Turneffe and Lighthouse Reef and some westerly flow around its northern end and within its lagoon (Perkins, 1983). The northerly current is a continuation of the current which flows west from Venezuela and north past Mexico. Currents are commonly wind-driven since the area is micro-tidal and, therefore, the strongest currents were found in the north-eastern section of the atoll since this area is not protected by Lighthouse Reef. The strong flow to the east in the back reefs is likely to represent wave surges rather than true currents. Sea surface temperature (SST) across the atoll was similar to the known means for the area (e.g. Koltes et al., 1998) and reflected the annual variation between wet and dry seasons. The particularly high SST’s in the summer of 1995 correlates with a documented bleaching event throughout Belize which also affected Turneffe Atoll (McField, 1999). The event and continued through the autumn with partial mortality occurring in corals. During this event, which commenced in late September, high seawater temperatures and solar irradiance coincided with low wind speeds and 52% of the corals studied were affected and an estimated 10% of all colonies experienced partial tissue mortality by May 1996 (McField, 1999). Major reef builders, such as Montastraea annularis and Agaricia tenuifolia, were most affected and may cause long term threats to reef integrity, especially if recovery rates are slowed by stress from other sources (Cortés and Hatziolis, 1998). Horizontal and vertical visibility, which are gross surrogates of turbidity and hence water quality, were generally high. This is to be expected for Turneffe, which stands in clear oceanic water beyond the main barrier reef, has extensive seagrass beds and mangrove stands that trap sediment and supports limited building development. However, there was variation around the atoll with lower horizontal visibility on the western side. This is the leeward side of the atoll and presumably is less well flushed than the windward eastern side. Stirring and resuspension of sediment by waves and

Discussion Turneffe Atoll oceanography, climate and anthropogenic impact report
19
currents is responsible for the higher turbidity in the lagoon compared to reefal sites. Detailed comparisons are inappropriate since sites were not surveyed concurrently and turbidity is known to be affected by factors such as rainfall, but the data do provide a baseline for future, more detailed studies. 4.2 Natural and anthropogenic impacts The surface and underwater impacts recorded by CCC volunteers are highly qualitative and not collected systematically but can be used to highlight apparent trends for future studies. Generally, pollution and solid debris were not present in high quantities around the atoll, providing evidence that it is a relatively healthy environment with little influence from anthropogenic effects. At the surface, ‘Algae’ was found around the atoll and is included as a gross surrogate for storm effects. Most of the algae was Sargassum algae and since there were no major storms during the survey work the use of these data are limited. Similarly, the frequency of ‘driftwood’ is difficult to interpret. More importantly, ‘Litter’ was present during 6.5% of surveys and reached a maximum of 12% in areas such as Turneffe Flats. Litter affects the aesthetic quality of the atoll and provides a negatives impression to tourists. Furthermore, large pieces of plastic rubbish pose a mechanical threat to turtles, dolphins and sea birds which may become entangled, maimed and possibly drowned (Pruter, 1987). Sea birds are also known to have ingested small fragments of plastic which could block their digestive tract. Litter may also be toxic to wildlife and chemicals leached from plastic may harm selected invertebrates. There is some evidence that much of this litter originated from the resorts and fishing communities since the most affected study areas were Tarpon Creek (transient fishing community), Blackbird Cay (site of a resort) and Turneffe Flats (site of a resort). ‘Sewage’ was rarely seen but again there may be some evidence that is linked to resorts and fishing communities (e.g. its presence at Turneffe Flats). High levels of sewage can cause nutrient loading and increased abundance of algae to the detriment of corals and carry waterborne diseases. Fish nets were infrequent, but were recorded at known fishing areas such as Caye Bokel where strong currents, and possibly upwelling water, increases the abundance of commercially important fish (Gardiner and Harborne, 2000). Underwater impacts were uncommon but there was some ‘Coral damage’, which includes the results natural and anthropogenic causes. The presence of high coral damage at Blackbird Cay may indicate the effects of divers and boat anchorage in this popular dive area. Submerged ‘Litter’ reflected a different pattern to surface litter and the highest values in the south-east and south-west may be caused by sub-surface current patterns. The data also highlighted a number of ‘Fish traps’ at Crawl Cay, possibly because of the large, mangrove free lagoon in the north of the atoll, although if fish trapping is seasonal the pattern may be partly attributable to the time of the surveys. Similarly to surface impacts, areas close to resorts and fishing communities, such as Blackbird Cay, had the highest frequencies of impacts. Boats around Turneffe Atoll were not numerous and generally small with limited numbers of occupants. Popular dive sites and areas close to resorts, such as Caye Bokel and Blackbird Cay, had the most boats. Fishing vessels were also seen, both on
Discussion Turneffe Atoll oceanography, climate and anthropogenic impact report
20
the reef and in the back reef where fishermen free dive for conch and lobster (ARH, pers. obs.). A recently installed series of mooring buoys should limit the amount of anchor damage by these boats. Future assessment of boat numbers will allow the increase of recreational and fishing activity to be monitored. 4.3 Aesthetic and biological impressions The reef around Turneffe Atoll was generally perceived by CCC volunteers to be aesthetically and biologically ‘good’. Although CCC volunteers receive more scientific training than most sport divers, their opinions represent objective data from non-scientific divers. However, the data are again qualitative and may be limited by the inexperience of many of the divers who undertake their SCUBA training with CCC and hence have not seen other reefs for comparison. Furthermore, when using an ordinal scale, observers are known to favour the middle category (Mumby et al., 1997), which is ‘good’ for these parameters. Despite these limitations, the data provide further evidence that Turneffe offers excellent diving and hence significant potential income generation from tourism. The perception that the lagoon was less interesting than the reef was expected. However, given the known heterogeneity of the reef, it was surprising that there were not clearer differences between the study areas or the reef zones. CCC’s data, therefore, indicates that there is little perceivable difference in biological and aesthetic values around the atoll and diving need not be concentrated on certain areas. The perception of patch reefs (mainly in the northern section of the lagoon) as equivalent to wall diving was also unexpected and may reflect that they are generally surveyed on shallow seagrass surveys and hence are given high ratings because of the relatively uninteresting surroundings. However, shallow patch reefs are often diverse and more colourful because of the high light levels and represent an important resource, especially for snorkelers.

Recommendations Turneffe Atoll Reef Check report
21
5. RECOMMENDATIONS Analysis of CCC’s oceanographic, climatic and natural and anthropogenic impact data from Turneffe Atoll has provided a baseline for future comparisons and indications of requirements for further research. These data, because they are generally qualitative and non-systematic, are only appropriate for highlighting gross trends and patterns and generally the reefs at Turneffe are only currently exposed to a limited number of threats. However, the results do lead to a number of recommendations. Recommendation 1: UCB, the Coastal Zone Management Project or the Fisheries Department continue to collect basic oceanographic, climatic and impacts data to monitor temporal changes. These data will also provide important information on anomalous events, such as the increased water temperatures that led to a bleaching event in 1995. Recommendation 2: The oceanographic data, particularly for currents, should be extended to allow analysis of how coral and fish larvae are entrained and circulated around the atoll. Such information is vital for ensuring that the main sources of larvae are conserved. There was some evidence that the anthropogenic effects that were observed were associated with either the resorts or fishing communities. Recommendation 3: Establish a code of practise for people living an working on the atoll regarding sewage and waste disposal and boat anchoring. Provide a standard environmental awareness briefing for all visitors to the dive resorts. Data from CCC volunteers showed that their biological and aesthetic impressions of the study areas and reef zones around the atoll were very homogeneous. Impressions of the northern patch reefs were unexpectedly high. Recommendation 4: If any sites show evidence of diver impacts, visitors should be encouraged to utilise other areas of the atoll. The relatively sheltered, northern patch reefs could be developed to attract snorkelers. Turneffe Atoll is more remote than many other reefs in the Caribbean and seems to be in good condition. However, Bryant et al. (1998) estimate the threat to the atoll as ‘medium’. Although this threat is lower than many reefs in Central America, there is some cause for concern and pressure from fishing, development and diving, combined with effects from natural events such as coral bleaching, are likely to increase. A marine protected area for Turneffe Atoll has been proposed (Gibson, pers. com.) and this would help to maintain reef health. Such a reserve would also provide additional ecological and economic benefits, such as increased fish catches and income for local communities (Clark, 1996). Recommendation 5: Continue to aim to establish a multiple use marine protected area at Turneffe Atoll, with an integrated monitoring programme to measure its efficacy.

References Turneffe Atoll oceanography, climate and anthropogenic impact report
22
6. REFERENCES Bryant, D., Burke, L., McManus, J. and Spalding, M. 1998. Reefs at Risk. World Resources Institute. Clark J.R. 1996. Coastal zone management handbook. CRC Press. Cortés, J. and Hatziolos, M.E. 1998. Status of coral reefs of Central America: Pacific and Caribbean coasts. Pages 155-163. In: Wilkinson, C.R. (Editor). Status of coral reefs of the world: 1998. AIMS, Australia. Gardiner, R. and Harborne, A.R. 2000. Summary of Coral Cay Conservation’s data on commercially important reef fish and invertebrates from Turneffe Atoll, Belize. Unpublished CCC report. Gill, A.B., Harborne, A.R., Raines, P.S. and Ridley, J.M. 1995. Marine research programme at Turneffe Atoll, Belize. Final report to Darwin Initiative for the Survival of Species. Gill, A.B., Harborne, A.R., Vierros, M., Raines, P.S. and Ridley, J.M. 1996. Bacalar Chico Marine Reserve Project. Final report to the European Union. pp. 62 Harborne, A.R. 1999. Caribbean science staff manual. Unpublished CCC report. Harborne, A.R. and Taylor, F. 2000. Summary of Coral Cay Conservation’s habitat mapping and description data from Turneffe Atoll, Belize. Unpublished CCC report. Heyman, W. D. and Kjerfve, B. 1999. Hydrological and oceanographic considerations for Integrated Coastal Zone Management in Southern Belize. Environmental Management 24(2): 229-245. Koltes, K.H., Tschirky, J.J. and Feller, I.C. 1998. Carrie Bow Caye, Belize. Pages 79-94. In: UNESCO. CARICOMP - Caribbean coral reef, seagrass and mangrove sites. Coastal Region and Small Island Papers 3. UNESCO, Paris. McCorry, D., Mumby, P.J., Raines, P.S. and Ridley, J.M. 1993. South Water Cay Marine Reserve draft management plan. CZMU/CCC. McField, M.D. 1999. Coral response during and after mass bleaching in Belize. Bulletin of Marine Science 64(1): 155-172. Mumby, P.J., Edwards, A.J., Green, E.P., Anderson, C.W., Ellis, A.C. and Clark, C. D. 1997. A visual assessment technique for estimating seagrass standing crop. Aquatic Conservation-Marine and Freshwater Ecosystems 3: 239-251. Mumby, P.J., A.R. Harborne, P.S. Raines and J.M. Ridley. 1995. A critical assessment of data derived from Coral Cay Conservation volunteers. Bulletin of Marine Science 56: 737-751.

References Turneffe Atoll oceanography, climate and anthropogenic impact report
23
Murray, M.R., Zisman, S.A. and Minty, C.D. 1999. Soil-plant relationships and a revised classification of Turneffe Atoll, Belize. Atoll Research Bulletin 464: 1-32. Perkins, J.S. 1983. The Belize Barrier Reef ecosystem: An assessment of its resources, conservation status and management. New York Zoological Society report. Pruter, A.T. 1987. Plastics in the marine environment. Fisheries 12: 16-17. Raines, P.S., D. Mccorry, P.J. Mumby and J.M. Ridley. 1992. Coral Cay Conservation – survey techniques and their application in Belize. Proceedings of the 7th International Coral Reef Symposium 1: 122-126. UNEP/IUCN. 1988. Coral reefs of the world. Volume 1: Atlantic and Eastern Pacific. UNEP Regional Seas Directories and Bibliographies. IUCN, Gland, Switzerland and Cambridge, UK / UNEP, Nairobi, Kenya.