summary appraisal reportreiauctions.com/portals/12/auctionpicsfiles/112793/att...1334 lafayette...
TRANSCRIPT

SUMMARY APPRAISAL REPORT OF
PROPOSED 13,166 SQ. FT. RETAIL/OFFICE BUILDING TO BE LOCATED AT
2145 SANTA BARBARA BOULEVARD LEE COUNTY, CAPE CORAL, FLORIDA
DATES OF VALUATION:
“AS IS” – 18 SEPTEMBER 2007 UPON COMPLETION - 1 MAY 2008
UPON STABILIZATION - 1 NOVEMBER 2008 DATE OF REPORT: 2 OCTOBER 2007
FILE NAME: SANTA BARBARA SQUARE
PREPARED FOR COMMUNITY BANK OF CAPE CORAL
1565 RED CEDAR DRIVE FORT MYERS, FLORIDA 33907
PREPARED BY MAXWELL & HENDRY VALUATION SERVICES, INC.
12600-1 WORLD PLAZA LANE, BUILDING #63 FORT MYERS, FLORIDA 33907


INDIVIDUAL MEMBER
W. Michael Maxwell, MAI, SRA Commercial
State-Certified General Real Phone: (239) 337-0555 Estate Appraiser, RZ 55 Fax: (239) 337-3747
[email protected] Gerald A. Hendry, MAI, CCIM Serving Southwest Florida since 1974 State-Certified General Real Estate Appraiser, RZ 2245 12600-1 World Plaza Lane, Building #63 Residential
Fort Myers, Florida 33907 Phone: (239) 333-1060 Website: www.maxwellhendry.com Fax: (239) 333-1066
[email protected] Toll Free: 1-866-741-0335 ASSOCIATES Matthew H. Caldwell State-Certified General Real Estate Appraiser, RZ 2901 William E. McInnis State-Certified General Real Estate Appraiser, RZ 2232 Christopher G. Reublin State-Registered Trainee Real Estate Appraiser, RI 16310 Timothy D. Rieckhoff State-Certified General Real Estate Appraiser, RZ 2261 Julianne T. Ross State-Certified Residential Real Estate Appraiser, RD 2823 Brooke M. Sanders State-Registered Trainee Real Estate Appraiser, RI 15339 Matthew S. Simmons State-Certified Residential Real Estate Appraiser, RD 5762 Scott H. Simmons State-Certified Residential Real Estate Appraiser, RD 6203 Andrea R. Terregrossa State-Certified General Real Estate Appraiser, RZ 2899
2 October 2007 Community Bank of Cape Coral 1565 Red Cedar Drive Fort Myers, Florida 33907 Attention: Mr. Scott W. Fancher Credit Analyst and Appraisal Review Re: Appraisal of proposed 13,166 square foot (enclosed area), one-story,
retail/office building to be located at 2145 Santa Barbara Boulevard, Lee County, Cape Coral, Florida for Prime Gulf Enterprises, LLC, Project Name: Santa Barbara Square (a.k.a. Prime Gulf Plaza)
Dear Mr. Fancher: As you requested, an inspection and analysis have been made of the above property, which is legally described in the attached appraisal report. The purpose of this assignment is to estimate the market value of the undivided fee simple interest in the land and proposed improvements as if free and clear of all liens, mortgages, encumbrances, and/or encroachments except as amended in the body of this report. No lease fee interest analysis is addressed herein as there are no leases associated with this property. Market value for this purpose is understood to be the most probable price, which a property should bring in a competitive and open market under all conditions requisite to a fair sale, the buyer and seller, each acting prudently, knowledgeably and assuming the price is not affected by undue stimulus. The full definition of market value can be found in the body of this report. As per the Uniform Standards of Professional Appraisal Practice (USPAP), there are three report writing options. These options include a self-contained, summary, or restricted use report format. This appraisal is presented in a summary report format. This summary appraisal report has been prepared in conformity with the Uniform Standards of Professional Appraisal Practice (USPAP).

The intended use of this appraisal report is understood to be for use as a basis of value to assist the client in loan underwriting and/or credit decisions by Community Bank of Cape Coral. The subject property was inspected on 18 September 2007 by Mr. Timothy D. Rieckhoff, Associate Appraiser. Mr. Gerald A. Hendry, MAI, CCIM has made a subsequent inspection of this property. Our compensation in this assignment is not contingent upon the reporting of a predetermined value or direction in value that favors the cause of the client, the amount of the value estimate, the obtainment of a stipulated result, or the occurrence of a subsequent event. In addition to the Assumptions and Limiting Conditions contained in the Addenda to this report, this appraisal also has a Hypothetical Conditions and several Extraordinary Assumptions associated with it. The Hypothetical Condition associated with this appraisal is as follows:
• For the purpose of this analysis it is assumed the proposed improvements exist in the estimation of the prospective Upon Stabilized and Upon Completion values.
In addition, the Extraordinary Assumptions associated with this appraisal are as follows:
• Completion of the proposed facility as illustrated on the architectural and
engineering plans that were provided. The construction plans were prepared by:
International Architecture Division of Archimetrics, Inc. 1415 Dean Street Suite 116 Fort Myers, Florida 33901 Telephone number – 1-239-476-8822 Dated - 9 April 2007 (latest revision dated 10 May 2007)
The site plan was prepared by:
Source, Inc. Engineers - Planners 1334 Lafayette Street Cape Coral, Florida Telephone number – 1-239-549-2345 Dated 21 August 2006
• The values, Upon Completion and Upon Stabilization are prospective future
values. These prospective future values are based on current market evidence and trends. We assume there will be no significant changes to take place in the market prior to these future dates.
• A portion of this assignment involves estimating insurable value, in terms of the
property owner’s building insurance responsibility. This insurable value is based on the building improvements only. This insurable value does not include: any depreciation or obsolescence; site improvements; impact fees; architectural and site engineering fees; land values; foundation or rent/income loss that may be incurred by the property owner during reconstruction; or equipment. This is assumed to be the typical methodology of the insurance industry to develop insurance value and this assignment is subject to same.

• The insurance companies in the State of Florida are currently experiencing changes in the industry including high premium increases and non-renewals due to the recent hurricanes. We assume insurance would be available for the subject. This assignment is subject to same.
If any of these assumptions are found to be false, it could alter our opinions or conclusions. By reason of our investigation and analysis, data contained in this report, and our experience in the real estate appraisal business, it is our opinion the “As Is” (land only) market value of the subject property, as of 18 September 2007, is as follows: ONE MILLION TWO HUNDRED TWENTY THOUSAND DOLLARS ...................($1,220,000.00) In addition, it is our opinion the prospective market value of the subject property Upon Completion, as of 1 May 2008, the anticipated date of completion, is expected to be as follows: THREE MILLION THREE HUNDRED SIXTY THOUSAND DOLLARS................($3,360,000.00) In addition, it is our opinion the prospective market value of the subject property Upon Stabilization, as of 1 November 2008, the anticipated date of stabilization, is expected to be as follows: THREE MILLION SEVEN HUNDRED TWENTY FIVE THOUSAND DOLLARS ..($3,725,000.00) In addition, it is our opinion the prospective insurable value of the subject property, upon completion as of 1 May 2008, the anticipated date of completion, is estimated to be as follows: ONE MILLION EIGHT HUNDRED FIFTY THOUSAND DOLLARS......................($1,850,000.00) Respectfully submitted,
Gerald A. Hendry, MAI, CCIM State-Certified General Real Estate Appraiser RZ 2245
Timothy D. Rieckhoff, Associate Appraiser State-Certified General Real Estate Appraiser RZ 2261


EXECUTIVE SUMMARY OWNER OF RECORD/ PURCHASE HISTORY:
The owner of record of the subject property is Prime Gulf Enterprises, LLC whose address is 833 West Trenton Avenue, Suite 4, Morrisville, Pennsylvania 19067. The subject property was last acquired as an assemblage of three separate parcels in December 2004 for a total of $725,000 as per Officials Record Book 4544, Page 2180; Official Record Book 4547, Page 2318; and Official Record Book 4547, Page 2330 of the public records of Lee County, Florida. We are not aware of the subject property being listed for sale or under contract at this time.
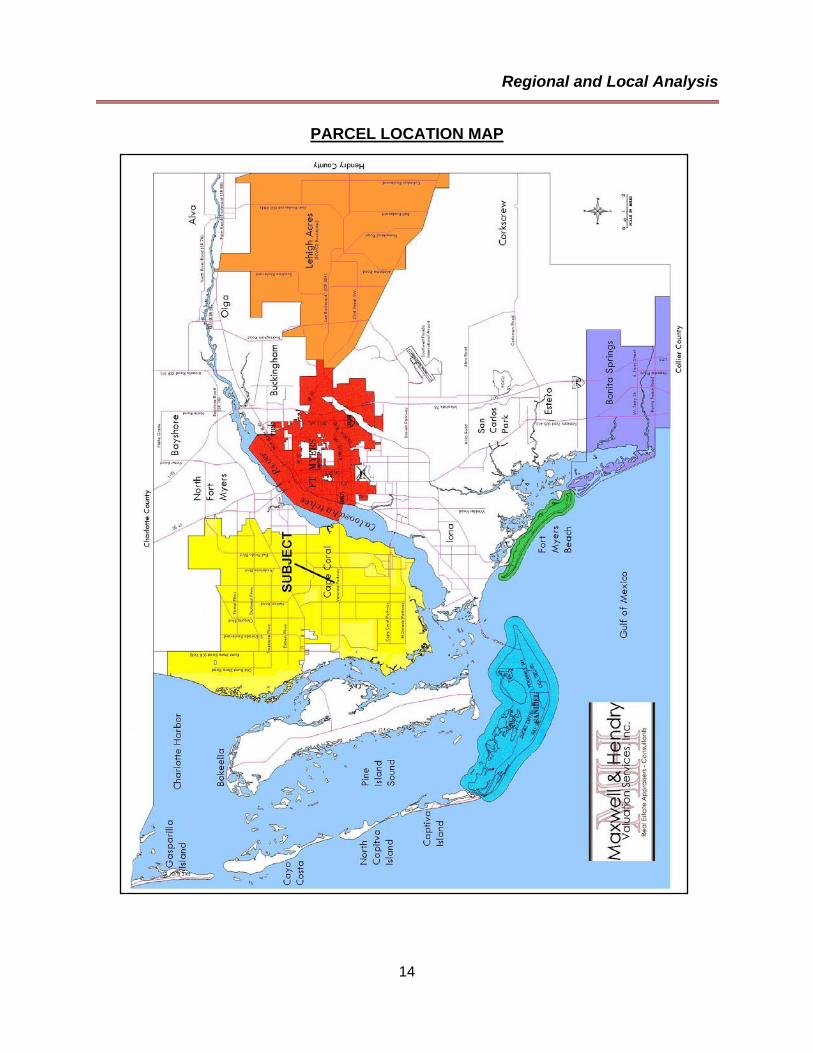
LOCATION: The subject is located on the east side of Santa Barbara
Boulevard, with additional frontage on S.E. Santa Barbara Place, approximately ½ mile north of Veterans Parkway in Cape Coral, Lee County, Florida. The property address is 2145 Santa Barbara Boulevard, Cape Coral, Florida 33991. It can further be described as being located in Section 25, Township 44 South, Range 23 East, Lee County, Florida.
LEGAL DESCRIPTION: Lots 22 - 25 and lots 84 - 89 and vacated alleyway as per Official
Record Book 3268, Page 3833 and Instrument Number 2005000125028, Block 930, Unit 26, Cape Coral Subdivision, as per Plat Book 14, Page 137 of the public records of Lee County, Florida.
LAND AREA/SHAPE: As per the survey provided, the subject site is "L" in shape,
benefiting from 160.00’ of frontage on Santa Barbara Boulevard and 240’ of frontage on S.E. Santa Barbara Place. The overall depth of the property is 265'. In total it contains 53,000 square feet or 1.217 acres.
IMPROVEMENTS: The subject property is proposed to be improved with a multi-
tenant, 13,166 square foot (enclosed and rentable area), one story, CBS/flat roof with roof cupolas, retail/office building. In addition, it will have a total of 1,927 square feet of covered walkway. In total, it will be divided into 8 rental units. In addition, site improvements will include a total of 54 open, asphalt paved, striped and curbed parking spaces with three designated for handicap use. Additional site improvements will include signage and landscaping.
ZONING/LAND USE: C-1, Pedestrian Commercial District/CP-
Commercial/Professional HIGHEST & BEST USE: Commercial Retail/Office Development
ESTIMATES OF VALUE: “AS IS” - Cost Approach: Sales Comparison Approach: Income Approach: Final Value Estimate:
N/A $1,220,000 N/A $1,220,000
ESTIMATES OF VALUE: UPON STABILIZATION - Cost Approach: Sales Comparison Approach: Income Approach: Final Value Estimate:
$3,745,000 $3,755,000 $3,725,000 $3,725,000
ESTIMATES OF VALUE: UPON COMPLETION - Cost Approach: Sales Comparison Approach: Income Approach: Final Value Estimate:
N/A N/A $3,360,000 $3,360,000
ESTIMATES OF VALUE: INSURABLE VALUE:
$1,850,000
EXPOSURE TIME: The estimated exposure time is 12 months INTEREST APPRAISED: Fee Simple Interest DATE OF INSPECTION: 18 September 2007 DATES OF VALUATION: “As Is” – 18 September 2007
Prospective Market Value Upon Completion - 1 May 2008 Prospective Market Value Upon Stabilization - 1 November 2008
DATE OF REPORT: 2 October 2007 APPRAISER: Gerald A. Hendry, MAI, CCIM
Timothy D. Rieckhoff, Associate Appraiser HYPOTHETICAL CONDITION:
This appraisal is subject to the following Hypothetical Condition:
• For the purpose of this analysis it is assumed the proposed improvements exist in the estimation of the prospective Upon Stabilized and Upon Completion values.
EXTRAORDINARY ASSUMPTIONS:
This appraisal is subject to the following Extraordinary Assumptions:
• Completion of the proposed facility as illustrated on

the architectural and engineering plans that were provided. The construction plans were prepared by:
International Architecture Division of Archimetrics, Inc. 1415 Dean Street Suite 116 Fort Myers, Florida 33901 Telephone number – 1-239-476-8822 Dated - 9 April 2007 (latest revision dated 10 May 2007) The site plan was prepared by: Source, Inc. Engineers - Planners 1334 Lafayette Street Cape Coral, Florida Telephone number – 1-239-549-2345 Dated 21 August 2006
• The values, Upon Completion and Upon Stabilization
are prospective future values. These prospective future values are based on current market evidence and trends. We assume there will be no significant changes to take place in the market prior to these future dates.
• A portion of this assignment involves estimating
insurable value, in terms of the property owner’s building insurance responsibility. This insurable value is based on the building improvements only. This insurable value does not include: any depreciation or obsolescence; site improvements; architectural and site engineering fees; impact fees; land values; foundation or rent/income loss that may be incurred by the property owner during reconstruction; or equipment. This is assumed to be the typical methodology of the insurance industry to develop insurance value and this assignment is subject to same.
• The insurance companies in the State of Florida are
currently experiencing changes in the industry including high premium increases and non-renewals due to the recent hurricanes. We assume insurance would be available for the subject. This assignment is subject to same.
If any of these assumptions are found to be false, it could alter our opinions or conclusions.


SCOPE OF WORK The scope of work is the type and extent of research and analyses in an assignment. It must include the research and analyses that are necessary to develop credible assignment results. Scope of work includes, but is not limited to:
• the degree to which the property is inspected or identified; • the extent of research into physical or economic factors that could affect the property; • the extent of data research; and • the type and extent of analysis applied to arrive at opinions or conclusions.
Extent of Property Identification/Inspection: For this analysis, we identified the subject property via public records and obtained various information from this source including, but not limited to:
• Site size • Zoning • Land Use • Real Estate taxes
In addition, site inspection of the subject property was made on 18 September 2007 by Mr. Timothy D. Rieckhoff, Associate Appraiser. Mr. Gerald A. Hendry, MAI, CCIM also made an inspection of the subject. Report Type: This appraisal is presented in a summary report format. In this analysis, consideration has been given to all three approaches to value (Cost, Sales Comparison, and Income Approaches to Value). In this appraisal, we are to analyze the subject property in four ways: the estimated market value of the land in terms of “As Is”, the estimated prospective market value Upon Completion, the prospective market value Upon Stabilization, and the estimated insurable value. In terms of the land value, the estimated “As Is” market value is the value of the property as a single parcel with a highest and best use for commercial development. Within this analysis, we will utilize the Sales Comparison Approach to Value to estimate the value of the site. In estimating the prospective market value Upon Completion, we will use all three traditional approaches to value. In the Cost Approach we will consider both the project cost as reported by the developer as well as the Marshall Valuation Service, a nationally recognized cost service. The estimated reproduction cost of this facility will be added to the estimated land value, as developed in the “As Is” analysis. In the Sales Comparison Approach we will use recent sales of competitive properties and analyze them in terms of a Potential Gross Rent Multiplier as well as a Sales Price per Square Foot method. In the Income Approach we will estimate the market rent as well as expenses associated with this property to develop an estimated Net Operating Income. This will be applied to an Overall Capitalization Rate which will be estimated from various sources, in order to estimate the value via this approach. In estimating the prospective market value Upon Stabilization, we will use the Income Approach and will employ a Discounted Cash Flow Analysis of the property, taking into account:
o estimated market rents as no units are pre-leased o estimated absorption of the units into the marketplace, o anticipated expenses
o estimated increases to the rental rates and expenses o terminal capitalization rate o future sales expense o realistic discount rate
We will be analyzing this property in terms of the fee simple interest as none of the units are leased. In estimating the insurable value we relied on the reproduction cost new as supplied by the developer as well as various cost estimates provided by Marshall Valuation Service, a nationally recognized cost service. Included in this analysis are costs for demolition and debris removal. We are of the opinion utilizing these various methods will develop a reliable result. Extent of Market Analysis: The subject’s market area was inspected and analyzed as to its physical and economic factors. In addition, we gathered market data from governmental websites, market participants, and industry publications. The primary emphasis of the data research concentrated on the Lee County market. Extent of Data Research: Data research was conducted using the following sources:
• Public Records of Lee County, Florida; • Sunshine MLS, a computerized multiple listing service; • Loopnet, a commercial marketing website; • Inspection of the comparable properties • Information/interviews from market participates, including:
• property owners, • real estate brokers/agents and property managers
• Marshall Valuation Service, a nationally recognized cost service The time period researched for sales data encompasses the last three years up until the date of the most current data available. All of the comparable sales were verified, or efforts were made to verify them with the buyer, seller, or a property representative. In the analysis, the selling price, financing, motivation to purchase/sell, and, if applicable, any lease or income/expense information was verified at the time of sale. We relied on public records and market rates if the sales could not be verified. The estimation of market rent is based on a rental study of the market area. Information Provided: For this appraisal, reliance was placed upon information provided by the property owner. We obtained from the property owner:
• Architectural plans • Survey • Development cost breakdown • Performa • Environmental study summary

TABLE OF CONTENTS PHOTOGRAPHS .......................................................................................................................................... 1
AERIAL PHOTOGRAPH OF SUBJECT PROPERTY...................................................................... 2 PHOTOGRAPHS ............................................................................................................................. 3
INTRODUCTION........................................................................................................................................... 7
INTENDED USER............................................................................................................................ 8 INTENDED USE .............................................................................................................................. 8 PURPOSE OF THE APPRAISAL .................................................................................................... 8 COMPETENCY PROVISION........................................................................................................... 9 INTEREST APPRAISED.................................................................................................................. 9 IDENTIFICATION OF THE SUBJECT PROPERTY ........................................................................ 9 OWNER OF RECORD/PURCHASE HISTORY............................................................................. 10 DATE OF INSPECTION................................................................................................................. 10 DATE OF COMPLETION............................................................................................................... 10 DATE OF STABILIZATION ............................................................................................................ 10 DATE OF REPORT........................................................................................................................ 10 EXPOSURE AND MARKETING TIME........................................................................................... 11
REGIONAL AND LOCAL ANALYSIS.......................................................................................................... 13
PARCEL LOCATION MAP............................................................................................................. 14 SOUTHWEST FLORIDA/LEE COUNTY DATA............................................................................. 15 CAPE CORAL DATA ..................................................................................................................... 25
MARKET AREA ANALYSIS........................................................................................................................ 29
MARKET AREA MAP..................................................................................................................... 30 MARKET AREA ANALYSIS........................................................................................................... 31
SITE DESCRIPTION AND ANALYSIS ....................................................................................................... 35
SITE LOCATION MAP ................................................................................................................... 36 SURVEY......................................................................................................................................... 37 SITE DATA..................................................................................................................................... 38
SUBJECT IMPROVEMENT ANALYSIS ..................................................................................................... 43
SUBJECT IMPROVEMENT PLAN - SITE PLAN........................................................................... 44 SUBJECT IMPROVEMENT PLAN – ELEVATION ........................................................................ 45 SUBJECT IMPROVEMENT PLAN – FLOOR PLAN...................................................................... 46 DESCRIPTION OF SUBJECT IMPROVEMENTS......................................................................... 47
HIGHEST AND BEST USE ANALYSIS ...................................................................................................... 51
THE HIGHEST AND BEST USE.................................................................................................... 52 APPRAISAL PROCESS.............................................................................................................................. 55
THE APPRAISAL PROCESS ........................................................................................................ 56 COST APPROACH TO VALUE .................................................................................................................. 57
THE COST APPROACH TO VALUE ............................................................................................. 58 RECONCILIATION OF REPRODUCTION COST ESTIMATE ...................................................... 61 COMPARABLE LAND SALES MAP .............................................................................................. 62 COMPARABLE LAND SALES ....................................................................................................... 63 ANALYSIS/DISCUSSION OF COMPARABLE LAND SALES....................................................... 69 ENTREPRENEURIAL PROFIT...................................................................................................... 72 THE COST APPROACH TO VALUE - RECAPITULATION........................................................... 73

SALES COMPARISON APPROACH TO VALUE....................................................................................... 75 THE SALES COMPARISON APPROACH TO VALUE.................................................................. 76 COMPARABLE IMPROVED SALES MAP..................................................................................... 77 COMPARABLE IMPROVED SALES ............................................................................................. 78 ANALYSIS/DISCUSSION OF IMPROVED COMPARABLES ....................................................... 94 RECONCILIATION OF THE SALES COMPARISON APPROACH TO VALUE ............................ 97
INCOME APPROACH TO VALUE.............................................................................................................. 99
THE INCOME APPROACH TO VALUE....................................................................................... 100 COMPARABLE RENTALS MAP.................................................................................................. 102 COMPARABLE RENTAL 1 .......................................................................................................... 103 ANALYSIS/DISCUSSION OF COMPARABLE RENTALS .......................................................... 109 VACANCY/COLLECTION LOSS ................................................................................................. 110 ANALYSIS OF EXPENSES ......................................................................................................... 111 NET OPERATING INCOME SUMMATION ................................................................................. 112 OVERALL RATE SELECTION/VALUATION - UPON STABILIZATION...................................... 113
ESTIMATION OF PROSPECTIVE MARKET VALUE - UPON COMPLETION ........................................ 115
ESTIMATION OF PROSPECTIVE MARKET VALUE - UPON COMPLETION ........................... 116 DISCOUNTED CASH FLOW MODEL ......................................................................................... 118
INSURABLE VALUE ................................................................................................................................. 119
ESTIMATION OF INSURABLE VALUE ....................................................................................... 120 RECONCILIATION OF VALUE ESTIMATES ........................................................................................... 121
CERTIFICATE OF APPRAISAL................................................................................................................ 123 ADDENDA................................................................................................................................................. 127
ENGAGEMENT LETTER............................................................................................................. 128 C-1A ZONING CLASSIFICATION - LEE COUNTY ..................................................................... 130 ASSUMPTIONS AND LIMITING CONDITIONS .......................................................................... 143 QUALIFICATIONS OF GERALD A. HENDRY, MAI, CCIM ......................................................... 147 QUALIFICATIONS OF TIMOTHY D. RIECKHOFF...................................................................... 149

Photographs
1
PHOTOGRAPHS

Photographs
2
AERIAL PHOTOGRAPH OF SUBJECT PROPERTY

Photographs
3
PHOTOGRAPHS
NE’LY VIEW OF THE SUBJECT SITE, AS SEEN FROM SANTA BARBARA BOULEVARD
SE’LY VIEW OF THE SUBJECT SITE, AS SEEN FROM SANTA BARBARA BOULEVARD
Photographs
4
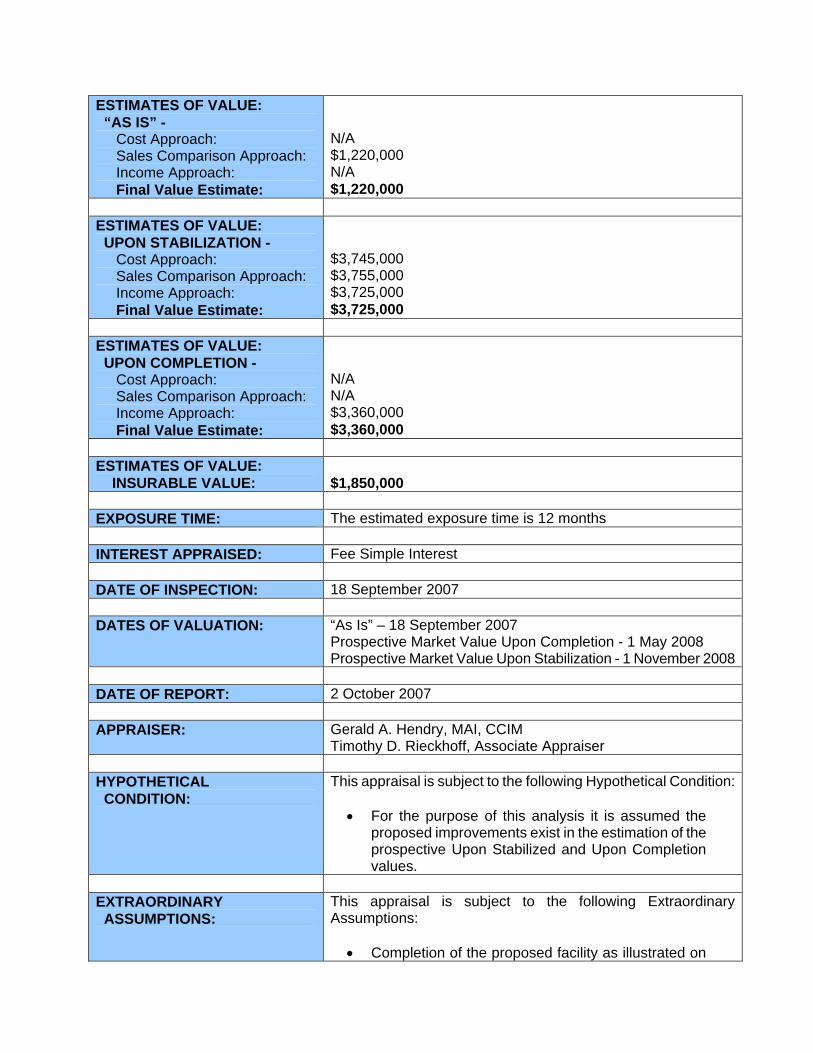
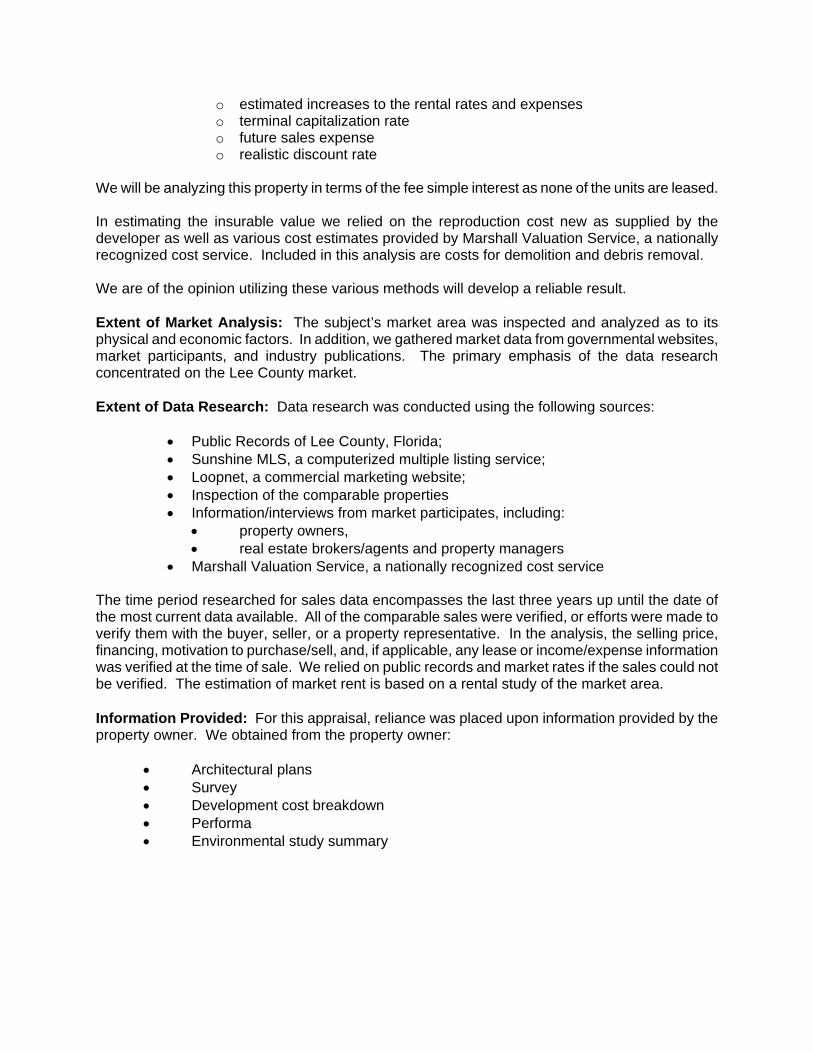
PHOTOGRAPHS - CONTINUED
SW’LY VIEW OF THE SUBJECT SITE, AS SEEN FROM SE SANTA BARBARA PLACE
NW’LY VIEW OF THE SUBJECT SITE, AS SEEN FROM SE SANTA BARBARA PLACE
Photographs
5
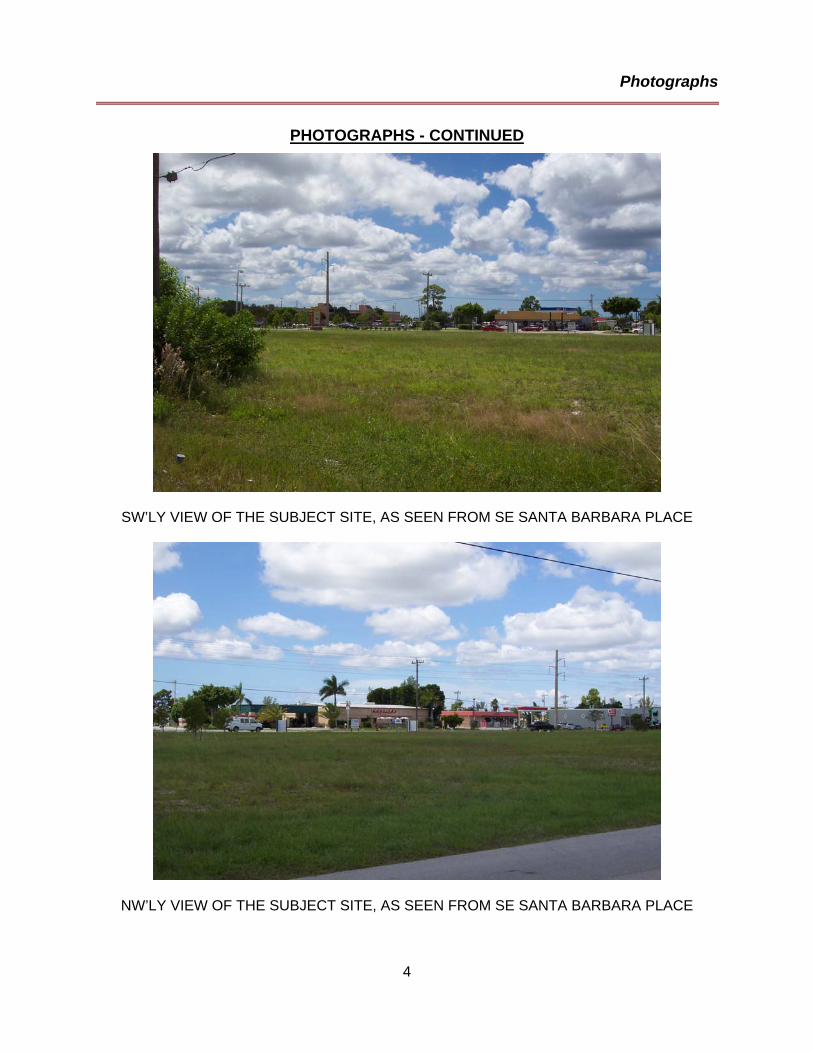
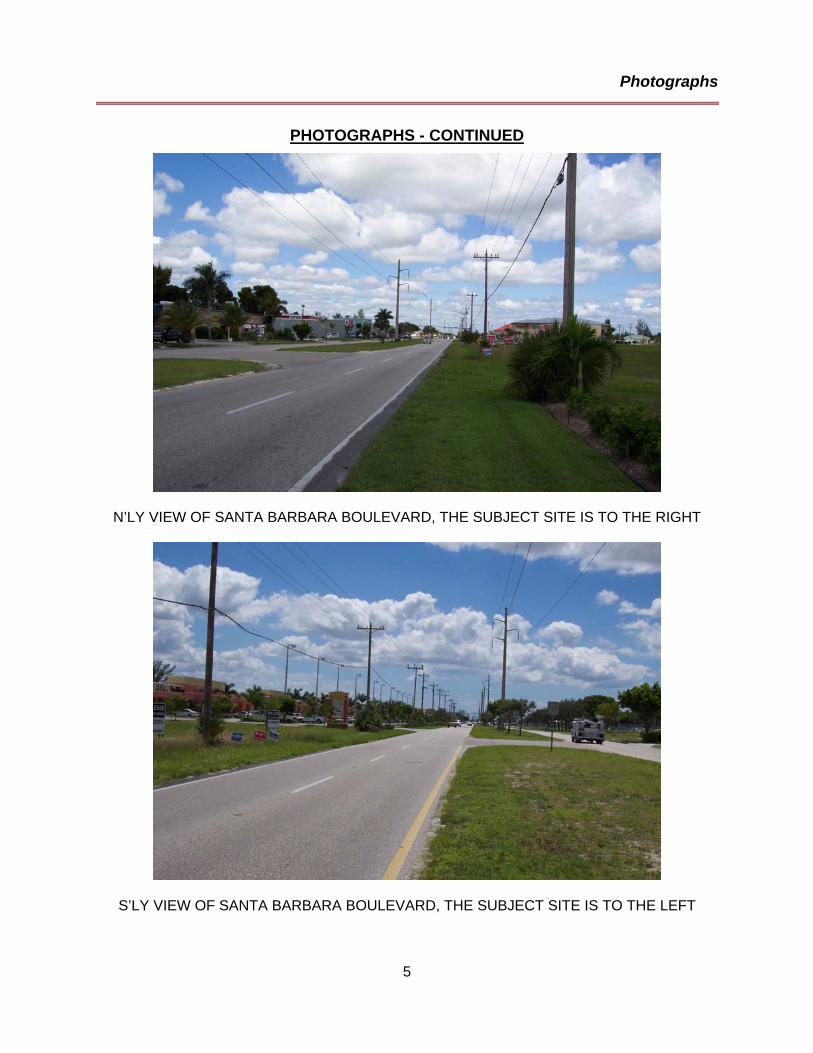
PHOTOGRAPHS - CONTINUED
N’LY VIEW OF SANTA BARBARA BOULEVARD, THE SUBJECT SITE IS TO THE RIGHT
S’LY VIEW OF SANTA BARBARA BOULEVARD, THE SUBJECT SITE IS TO THE LEFT

Photographs
6
PHOTOGRAPHS - CONTINUED
S’LY VIEW OF SE SANTA BARBARA PLACE, THE SUBJECT IS TO THE RIGHT
N’LY VIEW OF SE SANTA BARBARA PLACE, THE SUBJECT IS TO THE LEFT

Introduction
7
INTRODUCTION

Introduction
8
INTENDED USER: This appraisal is made for the exclusive use of Community Bank of Cape Coral, Attention: Mr. Scott W. Fancher, Credit Analyst, Appraisal Review, and its use by others is strictly prohibited. This appraisal is made subject to the Assumptions and Limiting Conditions contained in the Addenda to this report, as well as the Hypothetical Condition and Extraordinary Assumptions contained herein. INTENDED USE: The intended use of this appraisal is understood to be for use as a basis of value for assisting the client in terms of loan underwriting and/or credit decisions. Any other use is considered to be an unintended use. This appraisal assignment was not based on a requested minimum valuation, specific valuation, or the approval of a loan. PURPOSE OF THE APPRAISAL: The purpose of the appraisal is to estimate the “As Is” (land only) market value of the subject property, the prospective market value of the subject property Upon Completion, as well as the prospective market value of the subject property Upon Stabilization. In addition, the purpose of the appraisal is to estimate the Insurable value. Market value, as defined by the agencies that regulate financial institutions in the United States and published by the Appraisal Institute in The Dictionary of Real Estate Appraisal, Fourth Edition (Page 177), is:
The most probable price which a property should bring in a competitive and open market under all conditions requisite to a fair sale, the buyer and seller each acting prudently and knowledgeably, and assuming the price is not affected by undue stimulus.
Implicit in this definition is the consummation of a sale as of a specified date and the passing of title from seller to buyer under conditions whereby:
a. Buyer and seller are typically motivated.
b. Both parties are well informed or well advised, and acting in what they
consider their best interests.
c. A reasonable time is allowed for exposure in the open market.
d. Payment is made in terms of cash in U.S. dollars or in terms of financial arrangements comparable thereto; and
e. The price represents the normal consideration for the property sold un-
affected by special or creative financing or sales concessions granted by anyone associated with the sale.
Insurable value is defined by The Dictionary of Real Estate Appraisal, Fourth Edition (Page 147), as:
1. The value of an asset or asset group that is covered by an insurance policy; can be estimated by deducting costs of non-insurable items (e.g., land value) from market value.
Introduction
9
2. Value used by insurance companies as the basis for insurance. This value is often considered to be replacement or reproduction cost plus allowances for debris removal or demolition less deterioration and non-insurable items. It is sometimes cash value or market value, but often entirely a cost concept. (Marshall & Swift LP)
COMPETENCY PROVISION: This summary appraisal report has been prepared in conformity with the Uniform Standards of Professional Appraisal Practice (USAP). Within USPAP, there is a Competency Provision which states, in part, "Prior to accepting an assignment or entering into an agreement to perform any assignment, an appraiser must properly identify the problem to be addressed and have knowledge and experience to complete the assignment competently...". If the appraisers lack the knowledge or experience necessary for a particular assignment, this must be disclosed and all steps necessary to complete the assignment competently must be taken. In regard to this appraisal, we have the necessary knowledge and experience to complete the assignment. INTEREST APPRAISED: The interest being appraised is the fee simple interest in the land and proposed improvements, as if free and clear of all liens, mortgages, encumbrances, and/or encroachments except as amended in the body of this report. Fee simple interest is defined by The Dictionary of Real Estate Appraisal, Fourth Edition (Page 113), as:
Absolute ownership unencumbered by any other interest or estate, subject only to the limitations imposed by the governmental powers of taxation, eminent domain, police power, and escheat.
No leased fee interest is addressed herein, as none of the units are leased. IDENTIFICATION OF THE SUBJECT PROPERTY: The subject property is a proposed, 13,16 square foot (enclosed and rentable area), one story, CBS/flat roof with cupolas, multi-tenant retail/office building. It is to be located on a site containing 53,000 square feet or 1.217 acres. The site is "L" in shape benefiting from 160.00’ frontage on Santa Barbara Boulevard and 240.00' of frontage on S.E. Santa Barbara Place. The subject property is located on the east side of Santa Barbara Boulevard, approximately ½ mile north of Veterans Parkway in Cape Coral, Lee County, Florida. The property address is 2145 Santa Barbara Boulevard, Cape Coral, Florida 33991. It further can be described as being in Section 25, Township 44 South, Range 23 East, Lee County, Florida. The legal description of the subject is as follows:
Lots 22 - 25 and lots 84 - 89 and vacated alleyway as per Official Record Book 3268, Page 3833 and Instrument Number 2005000125028, Block 930, Unit 26, Cape Coral Subdivision, as per Plat Book 14, Page 137 of the public records of Lee County, Florida.

Introduction
10
OWNER OF RECORD/PURCHASE HISTORY: The owner of record of the subject property is Prime Gulf Enterprises, LLC whose address is 833 West Trenton Avenue, Suite 4, Morrisville, Pennsylvania 19067. The subject property was last acquired as an assemblage of three separate parcels in December 2004 for a total of $725,000 as per Officials Record Book 4544, Page 2180; Official Record Book 4547, Page 2318; and Official Record Book 4547, Page 2330 of the public records of Lee County, Florida. We are not aware of the subject property being listed for sale or under contract at this time. DATE OF INSPECTION: The subject property was inspected on 18 September 2007 by Mr. Timothy D. Rieckhoff, Associate Appraiser. Mr. Gerald A. Hendry, MAI, CCIM has made a subsequent inspection of the subject site. The “As Is” (land only) market value is estimated as of this date. DATE OF COMPLETION: As per documentation provided by the developer’s representative, the estimated date of completion is approximately six months from the start date. As such, we have estimated a date of completion of 1 May 2008 for the purposes of this analysis. The prospective market value Upon Completion is estimated as of this date. DATE OF STABILIZATION: The date of stabilization is when all of the units within the proposed subject building are occupied. It is our opinion there will be some pre-leasing of these units prior to completion. It is not anticipated that this pre-leasing activity will start occurring until later on in the construction process. For the purposes of this analysis, we will assume the subject property will be fully leased within six months after the date of completion or 1 November 2008. DATE OF REPORT: The date of this appraisal report is 2 October 2007.

Introduction
11
EXPOSURE AND MARKETING TIME: Reasonable exposure time is one of a series of conditions contained within the market value definition. Exposure time is always presumed to precede the effective date of the appraisal. Reasonable exposure time should be differentiated from marketing time, whereas reasonable exposure time is a historic event, and marketing time is a period immediately after the effective date of the appraisal. The estimated market value is based on the estimated exposure time for the subject property and not the marketing time. In this situation, we have estimated the exposure time for the subject property to be approximately 12 months. Marketing time, which is a period immediately after the effective date of the appraisal, is also considered to be approximately 12 months. It should be emphasized, in order to achieve the exposure and marketing time as estimated, a list price would have to be similar to that of the estimated value as reported herein. Furthermore, it is assumed the property would be actively and aggressively marketed.

12

Regional and Local Analysis
13
REGIONAL AND LOCAL ANALYSIS
Regional and Local Analysis
14
PARCEL LOCATION MAP

Regional and Local Analysis
15
SOUTHWEST FLORIDA/LEE COUNTY DATA: Lee County, named for Robert E. Lee, was created from Monroe County in 1887, and included the present-day Collier, Hendry, and Lee Counties. Lee County was split into the three (3) current counties in 1923. The present-day Lee County encompasses 1,212 square miles, with a variety of natural inland, coastal, and barrier island habitats and a year-round population over 540,000. The westerly flowing Caloosahatchee River bisects the county and is part of the cross-state Intracoastal Waterway. There are five (5) incorporated municipalities in Lee County as follows:
City of Fort Myers: Incorporated 1886. County Seat. 48.31 square miles. 2006 population - 65,729. The oldest permanent settlement in Lee County, the City’s River District was the site of Fort Myers, one of many forts utilized during the 2nd and 3rd Seminole Wars and Civil War. As the original county seat, the City is home to the majority of professional businesses in Lee County. The City has expanded their municipal boundaries considerably over the last decade in an effort to diversify their tax base. City of Cape Coral: Incorporated 1970. 114 square miles. 2006 population – 150,000. Originally developed by Leonard and Jack Rosen, owners of the Gulf American Land Corporation, in 1957, the City is now the largest by population in Lee County and second largest in the State of Florida by square miles. As a pre-platted, traditionally designed subdivision, the City has an extreme degree of uniformity. The City is home to the majority of Lee County’s workforce population. City of Sanibel: Incorporated 1974. 17.5 square miles. 2005 population – 6,272. Encompassing the geographical boundaries of Sanibel Island, the City was incorporated in response to State recommendations to develop high-density residential uses along the beaches and a high-traffic coastline causeway, among other issues. The community was settled in the period between 1885-1945. Nearly ½ of the island is set aside as natural preserve. Town of Fort Myers Beach: Incorporated 1995. Encompassing the geographical boundaries of Estero Island, the Town was incorporated in response to citizen desire for greater control over land development codes, among other issues. The community was settled in the period between 1885-1945. City of Bonita Springs: Incorporated 1999. 33 square miles. The City was incorporated in response to citizen desire for greater control over land development codes, among other issues. The City includes a portion of mainland Lee County and the adjacent islands. The community was settled in the period between 1885-1945.
There are many other unincorporated, yet distinct, communities in Lee County, both rural and suburban in nature. The following are a few of the most significant: Alva, Bayshore, Boca Grande, Captiva, Corkscrew, Buckingham, Estero, Iona, Lehigh Acres, North Fort Myers, Pine Island, and San Carlos Park.

Regional and Local Analysis
16
Lee County is a growing county with many diverse geographical areas and populous communities. The County is the center of growth and activity for the five (5) county area (Charlotte, Collier, Glades, Hendry, and Lee). Lee County should continue in this role for the foreseeable future. There are four basic factors that influence value according to The Appraisal of Real Estate, Twelfth Edition. These factors include:
• Social Forces • Economic Forces • Governmental Forces • Environmental Forces
Each of the forces interacts, resulting in increases, decreases, or stabilization of property values. As a result, these forces also serve to directly affect the demand for real property in a particular area. The four forces that affect values are described as follows: I. SOCIAL FORCES: Population fluctuation has a significant impact on property values. The Fort Myers/Cape Coral MSA is one of the top 50 fastest-growing metro areas in the country and experienced a 33% percent increase in total population from 2000 to 2006. The population increases Lee County has experienced since 1940 are shown below:
Lee County Population Change: 1940-2006
17,488
23,404
54,539
105,216
205,266
335,113
440,888
454,918
475,073
521,253
549,442
585,608
618,000
497,022
0 100,000 200,000 300,000 400,000 500,000 600,000 700,000
1940
1950
1960
1970
1980
1990
2000
2001
2002
2003
2004
2005
2006
2010 est.
Source: University of Florida, Bureau of Economic & Business Research, 2006

Regional and Local Analysis
17
Below is an illustration of the growth of Florida’s MSA from 1990 to 2005:
Change in Population - Florida's MSA's: 1990 vs. 2005
1,319,189
2,725,191
318,256
687,873
166,595
456,077
162,374
2,099,437
302,978
349,421
2,464,145
540,459
550,298
1,295,557
256,538
193,768
373,631
567,162
1,787,769
577,653
863,503
2,067,959
233,609
489,483
110,975
344,406
126,994
1,224,844
194,835
152,099
1,937,194
398,978
405,382
906,727
181,596
143,777
251,071
335,113
1,255,531
399,438
0 500,000 1,000,000 1,500,000 2,000,000 2,500,000 3,000,000
West Palm Beach/Boca Raton
Tampa/St. Petersburg/Clearwater
Tallahassee
Sarasota/Bradenton
Punta Gorda
Pensacola
Panama City
Orlando
Ocala
Naples
Miami
Melbourne/Titusville/Palm Bay
Lakeland/Winter Haven
Jacksonville
Gainesville
Fort Walton Beach
Fort Pierce/Port St. Lucie
Fort Myers/Cape Coral
Fort Lauderdale
Daytona Beach
Source: Florida Research and Economic Database 2005; Tim Lynch, PhD, Director, Center for Economic Forecasting and Analysis, Florida State University, March 23, 2005, www.safeatworkfl.org/documents/MetroAreaRpt.pdf According to the latest statistics from the Bureau of Economic and Business Research at the University of Florida, Lee County’s permanent population grew by 36,166 in the 12 months ending April 1, 2006. This 6.6% increase in population set a record for the highest 12-month growth in the county’s history. The Bureau of Economic Research at the University of Florida estimates that Lee County’s population will be nearly 618,000 by the Year 2010. The Bureau of Economic Research at the University of Florida estimates that the Lee County population will be nearly 618,000 by the Year 2010. Lee County is not the only county in Southwest Florida that has experienced population increases over the past two decades. Therefore, a strong continued demand for commercial/industrial support facilities should encompass the entire Southwest Florida area. The following summary is presented:

Regional and Local Analysis
18
Southwest Florida Population Change : 1990 vs. 2005
367,867
306,779
549,442
93,456
38,376
27,333
11,252
32,606
317,788
154,030
277,776
211,707
335,113
68,432
25,773
19,499
7,591
23,865
152,099
110,975
0 100,000 200,000 300,000 400,000 500,000 600,000
Sarasota
Manatee
Lee
Highlands
Hendry
Hardee
Glades
DeSoto
Collier
Charlotte
Source: University of Florida, Bureau of Economic & Business Research, 2006 Population increases tend to have a favorable affect on land values. This trend is greatly influenced by anticipation. According to The Appraisal of Real Estate, anticipation relates to value created by the expectation of benefits to be derived in the future. The expectation of benefits does not necessarily have to include income but may involve the enjoyment of owning and occupying a property. To illustrate the affect of population on land values in Lee County, the following is presented:
Increase in Taxable Values: 1994-2004
$19,915,900
$20,646,700
$21,323,500
$22,197,200
$23,374,200
$25,257,500
$27,880,900
$31,854,500
$36,899,600
$43,139,900
$46,978,900
$0 $20,000,000 $40,000,000 $60,000,000
1994
1995
1996
1997
1998
1999
2000
2001
2002
2003
2004
Source: Lee County Property Appraiser’s Office

Regional and Local Analysis
19
II. ECONOMIC FORCES: Economic considerations involve the financial capacity of the inhabitants of a region to rent or own property and properly maintain it. Personal Income:
As land values have increased in Lee County, so have income levels. The following chart details the increase in per capita income since 1995 in Lee County:
Change in Per Capita Income: 1995-2003
$23,
259
$23,
790
$24,
762
$25,
893
$26,
568
$29,
011
$31,
138
$31,
562
$31,
487
$15,000
$20,000
$25,000
$30,000
$35,000
1995 1996 1997 1998 1999 2000 2001 2002 2003
Employment:
This increase in personal income is largely attributed to the reductions in unemployment from 1994-2004. The following illustration summarizes labor force trends over the past 11 years:
Lee County Employment: 1994-2004
159,
093
162,
866
163,
182
165,
545
170,
032
175,
375
179,
973
186,
060
200,
798
208,
376
236,
937
8,196 7,074 6,395 5,789 5,206 4,598 4,951 6,1638,359 8,749
9,556
0
50,000
100,000
150,000
200,000
250,000
300,000
1994 1995 1996 1997 1998 1999 2000 2001 2002 2003 2004
Unemployed
Employed
Source: State of Florida, Department of Labor and Employment Security

Regional and Local Analysis
20
Economic Base:
One of the primary reasons for Lee County's low unemployment rate is its diversified economy. At one time, Lee County was primarily agriculturally oriented. The diversification of Lee County's economy over time has had a favorable effect on property values. The analysis of Lee County’s 2004 labor force is presented below:
Lee County Employmeny by Industry: 2004
Public Administration, 5.20%
Construction, 13.30%
Manufacturing, 3.20%
Trade, Transportation, & Utilities, 21.90%
Information, 2.10%
Financial Activities, 5.90%
Professional & Business Services,
11.80%
Natural Resources & Mining, 2.00%
Education & Health, 17.40%
Unclassified, 0.10%
Leisure & Hopitality, 12.70%
Other, 3.30%
Source: http://www.eflorida.com/profiles/CountyReport.asp?CountyID'60&Display'all, accessed 2/24/06
Banking and Finance:
Financial institutions in Lee County have experienced strong growth over the past few years. As of June 2005, there are 29 banks with 188 branches in Lee County, which hold $10,315,236,000 in deposits. This growth can be shown on the following page.

Regional and Local Analysis
21
Amount of Deposits in Lee County: 1996-2005
$4,8
92,6
51,0
00
$5,0
42,5
28,0
00
$5,2
98,8
61,0
00
$5,0
25,6
10,0
00
$6,1
24,2
29,0
00
$6,3
22,0
00,0
00
$6,7
06,1
29,0
00
$7,3
56,3
61,0
00
$8,3
95,4
47,0
00
$10,
315,
236,
000
$0
$2,000,000,000
$4,000,000,000
$6,000,000,000
$8,000,000,000
$10,000,000,000
$12,000,000,000
1996 1997 1998 1999 2000 2001 2002 2003 2004 2005
Source: Federal Deposit Insurance Corporation, Division of Supervision, FDIC/OTS Summary of Deposits, 2005
Construction:
The following figures represent the activity of the Lee County Division of Code and Building Services for the past two calendar years:
Lee County Building Permits: 2004-2005
13,171
18,469
8,891
10,4221,207
2,143
0
5,000
10,000
15,000
20,000
25,000
30,000
35,000
2004 2005
CommercialMulti-FamilySingle Family
Source: Lee County, City of Cape Coral, and City of Fort Myers Community Development Offices via News- Press Market Watch, 2006 program
The total value of all building permits for 2006 was down 17% (from 4.7 billion in 2005 to 3.92 billion in 2006). Single family permits fell 34% over the same period. The number of multi-family permits

Regional and Local Analysis
22
declined 31% in 2006 from 2005. The number and value of commercial permits went up 6% and 61%, respectively. Permit activity (and values) are expected to moderate for 2007 due to the real estate slowdown. III. GOVERNMENTAL FORCES: Lee County is governed by a county commission of five commissioners elected to four-year terms. Lee County contains five cities (Fort Myers, Cape Coral, Sanibel, Fort Myers Beach and Bonita Springs), each of which has its own form of government and each offering its own services. Services:
The cities of Fort Myers, Cape Coral and Sanibel each have their own police and fire protection. The Town of Fort Myers Beach has its own fire protection, but not police protection. Police protection for Fort Myers Beach is provided by the Lee County Sheriff's Department. The balance of the county is patrolled by the Florida State Highway Patrol and the Lee County Sheriff's Department. The police system is adequate. Lee County has experienced a decrease in the crime rate in recent years. Fire protection is also adequate as substations are situated in all portions of the county. Utilities:
Embarq (f/k/a Sprint) and KMC Telecom, Inc. serve Southwest Florida. Sprint has a fiber optic backbone that has the ability to connect all of its central offices and maintain high network availability. KMC Telecom, Inc., along with Embarq (f/k/a) Sprint, has a SONET ring surrounding Fort Myers. This SONET ring safeguards customers from service interruptions by using diverse routing of its fiber optic cables. The City of Fort Myers and some sections of Lee County receive their electricity from Florida Power and Light Company. The balance of Lee County receives its power from the Lee County Electric Cooperative. Gas is available from any one of the manufactured bottled gas dealers in the county. Natural gas is now available in many parts of Lee County. In early 2000, a new pipeline to the area extended service from northern part of the state. There is an adequate supply of water for business or private use either from the City of Fort Myers, the City of Cape Coral, the City of Bonita Springs, Florida Governmental Utility Authority, or from Lee County's water system. The county water system went into operation in the spring of 1968 and now provides purified water to residences and businesses throughout the county. Private wells are used in outlaying areas. Areas of Lee County not covered by municipalities are serviced by Lee County Utilities and the Greater Pine Island Water Association. Sewer service is provided either by Lee County Utilities or the city municipality. The City Of Fort Myers has a sewage disposal system and treatment plant. Other sewage plants are located in the more densely populated sections of Lee County. Private septic tanks are used in outlying areas. Medical Services:
Lee County has six general and two specialized hospitals, 16 nursing homes, 44 assisted living facilities, a veteran's clinic and several walk-in emergency facilities. Ambulance service in Lee County is operated as a department of the Lee County Emergency Service.

Regional and Local Analysis
23
Communications:
The Fort Myers News-Press, the area’s largest newspaper, is published daily. The Daily Breeze from Cape Coral is also published daily except Sunday. Several weekly newspapers serve different locations throughout Lee County, along with 41 radio stations and 8 local television stations. Roads and Transportation:
Even with the tremendous growth in the area, Lee County's road system is rated as adequate. There are four major north/south traffic arteries through Lee County and Fort Myers, which include U.S. 41, McGregor Boulevard, I-75, and Summerlin Road. The major east/west arteries include State Road 78, Colonial Boulevard, College Parkway, Daniels Parkway, Alico Road and Corkscrew Road. Alico Road is in the process of being widened. Part of Corkscrew Road has already been widened, with the remaining scheduled for widening in the near future. In addition to Alico and Corkscrew Roads being widened, Three Oaks Parkway is being widened and will eventually connect with Livingston road in Collier County. In order to prepare for the continuing growth, Estero Parkway is being extended from Three Oaks Parkway to Ben Hill Griffin Parkway and Metro Parkway is being extended from Six Mile Cypress Parkway to Alico Road. Also, flyovers are being built at the Summerlin Road and Gladiolus Drive interchange, the Summerlin Road and San Carlos Boulevard interchange and the Summerlin Road and College Parkway interchange. The area is also served by two airports. Page Field, located within the city limits of Fort Myers, provides two runways for private aircraft. The Southwest Florida International Airport is located east of I-75 at the eastern terminus of Daniels Parkway. Twenty-four airlines provide service to all parts of the country as well as other countries. There were a record 7,518,169 passengers in 2005. The Southwest Florida International Airport recently underwent a $437 million dollar expansion, which opened in September 2005. The expansion includes a new 28-gate, two story terminal, as well as three concourses, a three story parking garage/rental car facility, and a new taxiway. Also included as part of the expansion is a dual roadway system where the upper level is used for departures and the lower level is used for arrivals. Ben Hill Griffin Parkway and Treeline Avenue have been extended to provide entrance to the new terminal between Daniels Parkway and Alico Road. There will also be a new southern access point to I-75. Land Use Control:
The Lee County Local Planning Agency presented a new Comprehensive Land Use Plan in early 1984. This plan designates areas in Lee County for growth, new development, and environmental protection. This Comprehensive Plan should help to guide Lee County in its future growth. The Division of Community Development enforces all zoning regulations for the unincorporated areas of Lee County. Education: Lee County's educational facilities have kept pace with the influx of population. Within the past several years, Lee County has spent over $500 million in new construction and renovation projects, including four new high schools, a high-tech vocational campus and several new magnet schools. Lee County has 39 elementary school (K - 5), 15 Middle Schools (6 - 8), 12 senior high schools (9 - 12), 4 schools (K - 8), 1 school (6 - 12), 11 Special Centers, 3 Alternative Schools, 10 Charter schools and 2 high tech centers.

Regional and Local Analysis
24
Two public institutions of higher education serve Lee county's population: Edison Community College, which is a two year undergraduate school; and Florida Gulf Coast University, Florida's 10th state university and the first public university established in Florida in 25 years. Government Efficiency:
In general, the Lee County government has been efficient in its governing of the county. The Comprehensive Land Use Plan is an attempt to control Lee County's growth, without unnecessarily hampering development. Government budgeting and expenditures have been good, and bond indebtedness is minimal. Although the Comprehensive Land Use Plan has met with some resistance, it has served to allow for more consistent, calculated growth in Lee County. IV. ENVIRONMENTAL FORCES: Lee County is bordered by Hendry County to the east, Collier County to the south, and Charlotte County to the north. The county's western boundary is the Gulf of Mexico. The county contains a total of 803 square miles of land area and 200 + square miles of inland water area. The county is ranked thirteenth in area in the state. There are five incorporated cities within Lee County: Fort Myers (the county seat), Cape Coral, Sanibel Island, Fort Myers Beach and Bonita Springs. Other communities in the county include Lehigh Acres, Alva, Tice, Olga, Estero and North Fort Myers. The county has a sub-tropical climate. The average temperature is 74.4 degrees with a monthly mean high of 91.6 in the summer months and an average winter mean of 64.1 degrees. Temperature extremes are infrequent with only a rare freeze and few readings above the mid-90’s. Rainfall averages just around 52 inches annually with the heaviest rains during the summer months. The warm climate coupled with the area's beautiful sandy beaches makes Lee County a tourist paradise. The area is generally considered to be a very pleasant place to live. This has been reflected by the tremendous influx of residents to this area over the past few decades. Lee County is fast becoming known as a major vacation spot. The miles of sandy beaches, which include famous Sanibel and Captiva Islands, serve as vacation spots for a growing number of tourists. Fishing, shelling, boating, and skiing are very popular activities as the area has an abundance of navigable waterways and fishing areas. The Lee County and Collier County area is fast becoming recognized as the golf capital of Florida. This two county area has been developed with more new golf courses than any other area in the country over the past five years according to Golf Digest. New courses include Heritage Greens, Westminster, Pelican Sound, Legends, Stoneybrook, and The Brooks, to name a few. Tennis, biking, and other recreational activities are also popular in Southwest Florida. CONCLUSION: All of the preceding factors contribute a vital part to the thriving economy of Lee County. The recent increases in population in Lee County indicate that the demand for both housing and support facilities should continue. This in turn should serve to increase property values and demand for same. Lee County has a very diversified economy, which has contributed favorably to both population increases and to escalating property values. The county as a whole should continue to thrive and prosper well into the foreseeable future.

Regional and Local Analysis
25
CAPE CORAL DATA: Cape Coral is located on the southwestern coast of Florida at the mouth of the Caloosahatchee River. Cape Coral extends approximately 11 miles along the banks of this mile wide river. In relation to the Fort Myers and Lee County area, of which Cape Coral is part, it borders the mainland of Lee County to the west and northwest. On Cape Coral's western boundary is the Matlacha Pass, which is an open body of water connecting Charlotte Harbor with San Carlos Bay; farther to the west is Pine Island. At its northern extremity, Cape Coral extends off of Burnt Store Road approximately one mile south of Charlotte County. To the south, Cape Coral extends approximately five miles north of the northern boundary of the tip of Sanibel Island. Cape Coral is approximately nine miles from downtown Fort Myers. The initial developments of Cape Coral were begun on 4 November 1957. On 10 June 1958, the first family moved to this 61,000 acre development lying west of the mainland of Lee County. Cape Coral Development incorporated the area in December 1970. The Cape Coral subdivision consists of approximately 114 square miles which, upon its incorporation and annexation of other areas, makes it the second largest city (in area) in the state of Florida. The developers of Cape Coral Subdivision foresee a future population of approximately 300,000 people. The census report of 1990 indicated a growth in population to 74,991, which increased more than six times since 1970. As of April 1, 2007, Cape Coral’s population was 167,572, up from 140,195 in 2005 and 127,985 in 2004. The City of Cape Coral remains about 60 percent vacant, and city officials estimate a build out population of 413,000 by 2080. Cape Coral is currently the eleventh largest Florida city in population. The population increase of the Cape Coral area can be attributed to various social factors within the subdivision and the city. The breakdown of age groups by percentage of the total population as of 2002 is shown below:
Cape Coral Age Distribution
0-5, 6%
6-13, 13%
14-17, 6%
18-24, 6%
25-34, 13%
35-44, 16%
45-54, 13%
55-64, 10%
65+, 17%0-56-1314-1718-2425-3435-4445-5455-6465+

Regional and Local Analysis
26
Population increases tend to have a favorable affect on land values. This trend is greatly influenced by anticipation. According to The Appraisal of Real Estate, anticipation relates to value created by the expectation of benefits to be derived in the future. The expectation of benefits does not necessarily have to include income but may involve the enjoyment of owning and occupying a property. In 2006, there were 4,313 single family building permits issued, which is a 44% decrease over the figure for 2005. As land values have increased in Cape Coral so have income levels. The median household income was $51,344 in 2006 compared to $46,115 in 2002, which is an 11.34% increase. In regards to employment as of December 2005 70,845 Cape Coral residents were employed, while 1,981 people were unemployed, resulting in an unemployment rate of 2.7%. This is a decrease of 0.6% since 2002. Exclusive of the area's tropical climate, which has average temperatures ranging between 70 and 95 degrees, Cape Coral has numerous other factors which have attracted people to the area. Although Cape Coral was originally developed as a retirement community, its population has diversified and median age had dropped significantly, from 52.5 years in 1970 to 44 years in 2006. Lured by affordable housing rates, a low crime rate, and excellent schools, Cape Coral has become an attractive place to live for young families. Cape Coral has numerous shopping centers, medical facilities, education facilities and recreational facilities. The most popular attraction is Sun Splash Family Water Park. This attracts visitors not only from Cape Coral, but also from surrounding areas in Lee County. Most of the major banks and saving and loans in Fort Myers have branch offices located in Cape Coral for the convenience of businesses and residents. The Cape Coral Hospital was founded in 1977 and is a full service facility with 281 beds. Cape Coral also has a complete public education system including seven elementary schools, five middle schools, three high schools, and two special centers. The Cape Coral High School, located on Santa Barbara Boulevard, opened in 1980. A second high school, Mariner High School, opened in 1987 and is located north of Pine Island Road on Chiquita Boulevard. The newest high school, Ida S. Baker High School, opened in 2004 and moved to its permanent facility on Aqualinda Boulevard in 2005. Cape Coral's electricity is supplied by the Lee County Electric Cooperative, Inc. Telephone service is provided through Embarq - Florida. The city is equipped with a large municipal reverse osmosis water treatment plant which has a capacity to supply up to 15 million gallons of water per day. This is sufficient for the growing population at this time. The city is currently expanding sewer and water lines, plus "dual water" lines to new areas of Cape Coral Since Cape Coral's inception in 1970, it has maintained its own police and fire departments. The city police department includes a detective division as well as patrolmen. The Cape Coral Fire Department currently has ten fire stations located throughout the city. Cape Coral has a relatively good road network. The major arteries throughout Cape Coral are Del Prado Boulevard, Cape Coral Parkway and Pine Island Road. The Mid-Point Memorial Bridge was completed in 1997 which provides access to Fort Myers from Veteran's Memorial Parkway. Veteran's Memorial Parkway extends from the Mid-Point Bridge west and connects to Burnt Store Road thereby providing an alternative east/west thoroughfare. There are several other north/south arteries including Santa Barbara Boulevard, Skyline Parkway and Chiquita Boulevard. Public transportation in Cape Coral is serviced through the Lee County Transit Authority. Buses run on a regular schedule to and from major locations within the Cape Coral area. The public transportation or bus system has been expanded to provide Cape Coral residents with better service. Cape Coral does not have its own municipal airport, and air service is provided by the Southwest Florida International Airport. The airport has recently undergone a $437 million expansion which includes a
Regional and Local Analysis
27
new mid-field terminal, a new 8000' runway, a dual road system and an extension of Treeline Avenue to provide a new entrance. Currently, 24 airlines operate out of this airport, and in 2005, a record 7,518,169 passengers used this airport. With the influx of people moving to Cape Coral, several residential/commercial projects are underway. These include Entrada, Coral Lakes, West Cape Estates and Sandoval. In 2005 there were 6,497 new occupational/contractor licenses issued along with the renewal of 11,426 licenses. These include such contractors as builders, plumbers, electricians, etc. Historically, commercial development in Cape Coral has been located in the downtown core area of the city. However, over the past few years it has expanded north along Del Prado Boulevard and Pine Island Road. As the residential population has begun to move north and west away from the downtown core area (suburbia), the commercial development has followed. Small strip shopping centers, banks, and office buildings continue to be constructed along Del Prado Boulevard to accommodate the growth and increased traffic. Pine Island Road is destined to become a major commercial artery with the Pine Island Road District Land Use Plan. Several multi-use villages will be constructed along Pine Island Road which will consist of residential and commercial uses. Presently, Cape Coral has one enclosed mall, Coralwood, in full operation, and several shopping centers. Increased commercial development along major arteries will enable the local Cape Coral marketplace to satisfy the local residents' needs without traveling to Fort Myers. The present increased development, especially of commercial use, is an attempt by developers and merchants to capture the local market by providing those goods and services demanded by an expanding growth of the city. Conclusion: Overall, Cape Coral has a strong economic base. Positive economic factors include a strong built-in population growth due to the area's appeal as a tourist and retirement area. The saltwater and freshwater lakes attract people interested in boating, fishing and other water related activities. Other strong factors include a broader economic base as other industries besides tourism and construction grow. After considering the overall economic picture of the city, Cape Coral appears to have a strong economic future and should continue to grow and prosper in the foreseeable future. Sources: 2006 Florida Statistical Abstract
City of Cape Coral Website Cape Coral Annual Report 2006

28

Market Area Analysis
29
MARKET AREA ANALYSIS

Market Area Analysis
30
MARKET AREA MAP

Market Area Analysis
31
MARKET AREA ANALYSIS: A market area is defined by The Dictionary of Real Estate Appraisal, Fourth Edition, (Page 174) as:
The geographical or locational delineation of the market for a specific category of real estate, i.e. The area in which alternative, similar properties effectively compete with the subject property in the minds of probable, potential purchasers and users. area”.
The subject market area, as will be defined in this section, consists of complementary land uses such as general commercial, office, industrial, agricultural, as well as single and multi-family residential. Market Area Delineation: The subject’s general market area is generally considered to be those properties that front on are within one-half mile north and south of Veterans Parkway from the Veterans Memorial Mid-Point Bridge in eastern Cape Coral to Pine Island Road in the western portion of the city. This thoroughfare was opened in conjunction with the Veterans Memorial Mid-Point Bridge in the latter part of 1997. This thoroughfare provides excellent access through the south, central area of Cape Coral, terminating to the east at the Veterans Memorial Mid-Point bridge, which provides easterly access into the City of Fort Myers via Colonial Boulevard as well as Interstate 75, State Road 82 and the community of Lehigh Acres in eastern Lee County. Furthermore, Veterans Parkway continues westward approximately seven miles then turns north to connect to Pine Island Road and Burnt Store Road. Burnt Store Road provides a northerly access to Charlotte County. Eventually Veterans Parkway is planned to be part of a beltway that will transition across Cape Coral and Lee County. This market area is located in close proximity to numerous support facilities throughout Cape Coral. Traffic counts are adequate and the long-term outlook is favorable for this delineated market area. It should be noted, throughout the City of Cape Coral as well as Lee County we recently have observed an oversupply of residential housing product. This has impacted the commercial market in general. However, there are commercial sub-markets that appear to be strong at this time as there is very little availability of commercial space within these areas. Traffic counts are adequate and the long-term outlook is favorable for this delineated market area. Stage of Life Cycle: A market area normally goes through four stages during its life cycle. These four stages are as follows:
• Growth - a period during which the market area gains public favor and acceptance.
• Stability - a period of relative equilibrium without market gains or losses.
• Decline - a period of diminishing demand. • Revitalization - a period of renewal, modernization, and
increased demand.

Market Area Analysis
32
The subject market area is considered to be within its stability stage and to a limited degree its growth stage of its life cycle. The subject property is located in an area of Cape Coral that has experienced strong commercial growth up until the middle of this decade. Throughout the City of Cape Coral as well as Lee County we recently have observed an oversupply of residential housing product. In addition, we have observed a leveling of commercial demand. Considering these factors, we are of the opinion the subject’s market area is within its stability stage and to a limited degree its growth stage of its life cycle. It is our opinion, one should be cautious in the short term. However, the long term aspects of this delineated market area are considered to be good as the demand for Southwest Florida as well as the City of Cape Coral, has been strong and this trend should continue once this oversupply of residential housing units has been absorbed. Land Uses and Development: Land uses within the subject market area are typically commercial along the major traffic arteries and intersections with Veterans Parkway. Residential uses, including single and multi-family, become predominate in areas removed from these intersections. Traffic counts along the major thoroughfares are strong and this trend is expected to continue. As noted we have observed an oversupply of residential product throughout Lee County and Cape Coral. It has been reported there is approximately a two year supply of housing in this area yet to be absorbed into the market. Linkages: The major east/west thoroughfare in this market area is Veterans Parkway. This roadway is intersected by several major north/south thoroughfares, including, Del Prado Boulevard, Country Club Boulevard, Santa Barbara Boulevard, Skyline Boulevard, Chiquita Boulevard and Surfside Boulevard. This road network provides for excellent access to all local streets as well as points throughout Cape Coral. Almost all of the north/south thoroughfares provide access to Cape Coral Parkway, in southern Cape Coral and to Pine Island Road, in central Cape Coral. Veterans Parkway, in the western portion of the city, turns northbound and terminates at Pine Island Road. This road continues north and is known as Burnt Store Road which provides northerly access to Charlotte County. Eventually Veterans Parkway is planned to be part of a beltway that will transition across Cape Coral and Lee County. Following is a summary of the distances to some of the major support facilities in the area:
Support Facilities Distance from Neighborhood Residential areas Within subject market area School/Churches/Recreation Center Within subject market area and
within a two mile radius Employment centers Within a 5 - 10 mile radius Interstate 75 7 miles east (1) U.S. 41 3 miles east (1) Southwest Florida International Airport 10 miles southeast (1) Note 1 – Distance is from the eastern
portion of this market area

Market Area Analysis
33
Utilities and Governmental Services: Utilities currently available in this area include municipal water and sewer service provided by the City of Cape Coral, electricity provided by Lee County Electric Cooperative and telephone service provided by Embarq. Police and fire protection are considered to be adequate in this area and both are provided by the City of Cape Coral. Economic Characteristics: The economics of this market area are greatly impacted by the housing demand and general growth of this area. In the early part of this decade we had seen strong demand for all types of real estate product including residential, industrial and commercial through Cape Coral and Lee County. This demand was greatly enhanced because of the historically low interest rates at that time. Within the past 12-24 months we have seen a slow down, especially in the residential market due to an oversupply of building of this product throughout the general area. We are of the opinion this will have an impact on the commercial as well as industrial market and therefore are of the opinion that a typical developer/investor should use caution. The general demand of Southwest Florida is still adequate and this trend should continue. Furthermore, the demand should pickup once the oversupply of residential housing units has been absorbed in the market place. At this time we are not able to predict when this will occur. Commercial property value appears to be settling to some degree due in part to this oversupply of housing but also because of the increase in the non-homesteaded real estate taxes as well as commercial insurance premiums. In general, we have seen a 50%-75% increases in Common Area Maintenance (CAM) charges associated with commercial real estate over the last several years. Base rents have also gone up but not as dramatically. In fact, to some degree they are suppressed because of the increases of CAM charges. The overall economic outlook for this area is considered to be adequate to good, but in the short term, investors and developers are advised to proceed with caution. Conclusion: In summary, the subject market area is considered to be within its stability and to a limited degree its growth stage of its life cycle. The overall economic outlook is considered to be adequate to good for this area but due to a variety of reasons, including an oversupply of residential housing, increases to real estate taxes for non-homesteaded properties as well as increases to commercial insurance premiums, the short term outlook is considered to be stable and a developer/investor is advised to proceed with caution for this short term.

34

Site Description and Analysis
35
SITE DESCRIPTION AND ANALYSIS

Site Description and Analysis
36
SITE LOCATION MAP

Site Description and Analysis
37
SURVEY

Site Description and Analysis
38
SITE DATA: Location: The subject is located on the east side of Santa Barbara Boulevard, with additional frontage on S.E. Santa Barbara Place, approximately ½ mile north of Veterans Parkway in Cape Coral, Lee County, Florida. The property address is 2145 Santa Barbara Boulevard, Cape Coral, Florida 33991. It can further be described as being located in Section 25, Township 44 South, Range 23 East, Lee County, Florida. Land Size/Shape: As per the survey provided, the subject site is "L" in shape, benefiting from 160.00’ of frontage on Santa Barbara Boulevard and 240’ of frontage on S.E. Santa Barbara Place. The overall depth of the property is 265'. In total it contains 53,000 square feet or 1.217 acres. Zoning: The subject property is zoned C-1, Pedestrian Commercial District as per the City of Cape Coral. The purpose and intent of this zoning classification is to establish:
• permit areas designed to encourage and facilitate commercial activities intended to serve a large trade area, including major shopping facilities oriented to pedestrian shoppers;
• permit other uses generally compatible with such commercial uses; and • otherwise implement this Ordinance.
Various permitted using within this zoning classification are, but not limited to:
• Assisted Living Facility • Banks and financial establishments • Business offices • Child Care Facility • Clothing store, general • Department store • Drug store • Hardware store • Medical office • Personal services • Nightclub • Pet shop • Pharmacy • Places of Worship • Restaurants-groups • Variety store
A full explanation of this zoning classification can be found in the addenda to this report.
Site Description and Analysis
39
Land Use: The subject is located within the Commercial/Professional Future Land Use category as per the City of Cape Coral’s Future Land Use Map. The "Professional" zoning designation ("P-1") is by far the more restrictive of the two. In cases where the Future Land Use Map mandates a rezoning to a "Commercial/Professional" land use, the City will, whenever possible, grant pedestrian commercial ("C-1") zoning only to properties with 250 feet or more of depth which are located on four-lane thoroughfares. The purpose for this recommendation is to encourage greater depth along the City's four-lane corridors, thereby avoiding the development pattern which has characterized the growth of Del Prado Boulevard. The "Professional" designation conforms essentially to the City's Professional (P-1) zoning district. This district is mostly for business and medical offices, with some other related uses and light intensity retail, including Social Services offices, Mortgage brokers, Specialty Retail Shops, Florist Shops and standard Government office space. Professional uses will generally be acceptable on sites of 125 feet of depth, although in many cases larger sites are permitted. A few areas designated "Commercial/Professional" on the Future Land Use Map have been designated for professional use only. Commercial uses in these areas may only be allowed through a Planned Development Project (PDP) process, and provided that the commercial uses are compatible with the surrounding professional uses. These areas are the "Commercial/Professional" designated areas immediately east, west and south of the existing City Hall site on Nicholas Parkway. These professional uses to serve and interact with the City Hall complex; the blocks designated "Commercial/Professional" on the north side of Viscaya Parkway west of Del Prado, so designated to provide primarily medical and related uses in conjunction with the hospital; and the two blocks (Blocks 1699 and 1700) on the north side of Cape Coral Parkway between Skyline and Pelican Boulevard. Other areas may be designated for professional use only as a policy decision to ensure compatibility with surrounding land uses. The "Commercial" designation is essentially the City's Pedestrian Commercial (C-1) zoning district. This is the City's most common commercial zoning district. It encompasses a wide range of commercial uses, including those permitted in the professional zoning district. Permitted uses in the C-1 zoning district include food stores, lawn and garden supply stores, specialty retail shops, veterinary and animal clinics, nature and wildlife preserves, building materials stores, etc. Building heights are generally restricted to three stories or 45 feet, except in the Community Redevelopment Area in which five stories are permitted on larger sized properties. Access: The subject is located on the east side of Santa Barbara Boulevard and is positioned on this thoroughfare at a full median cut. In addition, it has access from S.E. Santa Barbara Place. Utilities: Utilities available to the subject property include municipal water and sewer service provided by City of Cape Coral Utilities, electricity provided by Lee County Electric Cooperative, and telephone service provided by Embarq. In addition, the City of Cape Coral provides irrigation service to this site.

Site Description and Analysis
40
Topography/Elevation: The subject site is level and is similar to that of other undeveloped sites in this area. The subject site appears to be similar to the road grades of both Santa Barbara Boulevard and S.E. Santa Barbara Place. The site has been cleared of all of its natural vegetation, with the exception of natural grass. Flood Zone: As per the National Flood Insurance Program, Flood Insurance Rate Map (FIRM), Community Panel #125095-0035-C, the subject is located within Zone B, which is not considered to be a flood hazard area. Flood insurance is available in participating communities but is not required in this zone. The effective date of this map is 18 September 1985. Environmental Concerns: There were no environmental concerns observed on the subject site. In addition, we were provided a summary page from a Phase I Environmental Site Assessment on the subject property. This Phase I Assessment was prepared by Allied Engineering and Testing Incorporated, whose address is 5850 Corporation Circle, Fort Myers, Florida. Their phone number is (239) 334-6833. The date of this assessment is 6 June 2007. As per the summary page provided, there was no evidence or recognized environmental conditions in connection with the property and there was not sufficient evidence to recommend further assessment of on-site or off-site conditions at the time of this assessment. Present Use: At the present time, the subject property is idle and vacant land. Taxes and Assessments: According to the 2006 Lee County tax roll, the subject parcel is assessed as a vacant commercial site with a market assessed and taxable value of $401,280. The 2006 ad valorem real estate taxes on the subject property, based on this assessment, were $7,338.08. With an early payment discount in November 2006, the taxes were $7,044.56. The Tax Identification or STRAP number associated with the subject site is 25-44-23-C4-00930.0220. The 2007 Notice of Proposed Taxes are currently available for the property. According to the Truth In Millage (TRIM) Notice, the 2007 market, assessed and taxable value is $739,200. The proposed 2007 taxes, if the proposed budget change is made, will be $12,909.90. The proposed 2007 taxes, if no budget change is made is $13,661.38. Since the subject property is a proposed retail/office facility, we must estimate what the anticipated ad valorem real estate tax obligation will be for this property once it is completed. We have utilized a variety of comparable properties in this immediate market area in order to estimate this tax obligation. The following is this real estate tax study:
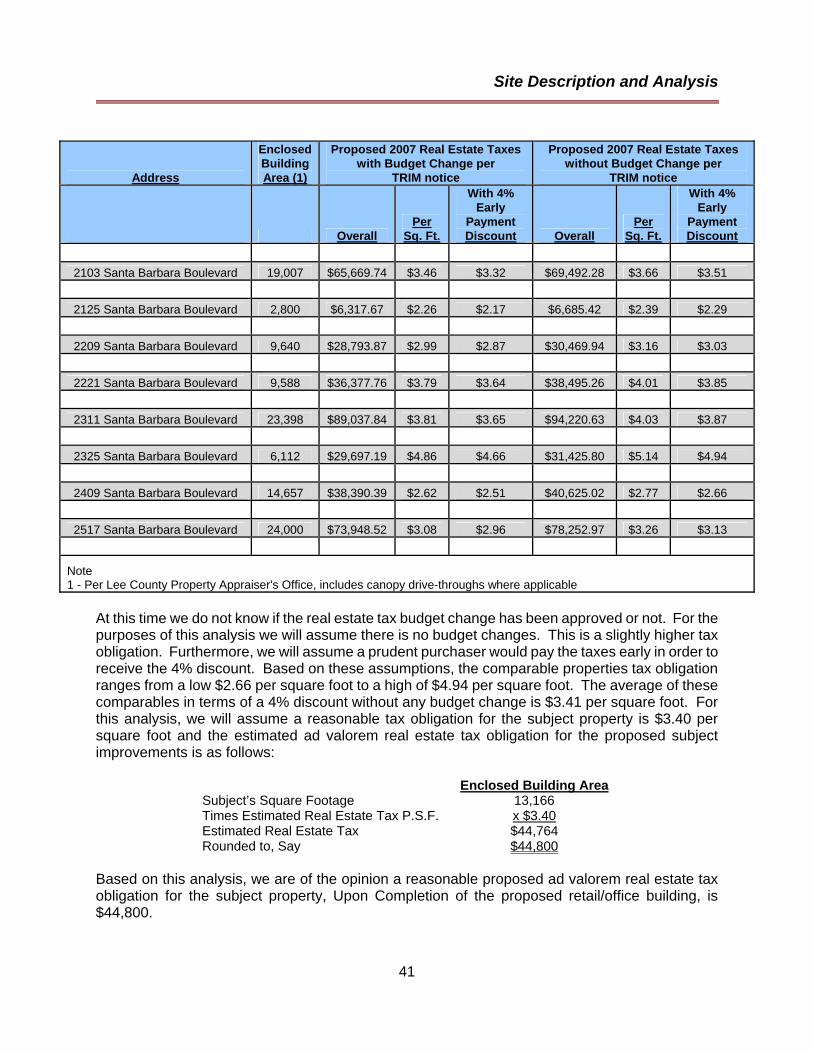
Site Description and Analysis
41
Address
Enclosed Building Area (1)
Proposed 2007 Real Estate Taxes with Budget Change per
TRIM notice
Proposed 2007 Real Estate Taxes without Budget Change per
TRIM notice
Overall Per
Sq. Ft.
With 4% Early
Payment Discount Overall
Per Sq. Ft.
With 4% Early
Payment Discount
2103 Santa Barbara Boulevard 19,007 $65,669.74 $3.46 $3.32 $69,492.28 $3.66 $3.51
2125 Santa Barbara Boulevard 2,800 $6,317.67 $2.26 $2.17 $6,685.42 $2.39 $2.29
2209 Santa Barbara Boulevard 9,640 $28,793.87 $2.99 $2.87 $30,469.94 $3.16 $3.03
2221 Santa Barbara Boulevard 9,588 $36,377.76 $3.79 $3.64 $38,495.26 $4.01 $3.85
2311 Santa Barbara Boulevard 23,398 $89,037.84 $3.81 $3.65 $94,220.63 $4.03 $3.87
2325 Santa Barbara Boulevard 6,112 $29,697.19 $4.86 $4.66 $31,425.80 $5.14 $4.94
2409 Santa Barbara Boulevard 14,657 $38,390.39 $2.62 $2.51 $40,625.02 $2.77 $2.66
2517 Santa Barbara Boulevard 24,000 $73,948.52 $3.08 $2.96 $78,252.97 $3.26 $3.13
Note 1 - Per Lee County Property Appraiser's Office, includes canopy drive-throughs where applicable
At this time we do not know if the real estate tax budget change has been approved or not. For the purposes of this analysis we will assume there is no budget changes. This is a slightly higher tax obligation. Furthermore, we will assume a prudent purchaser would pay the taxes early in order to receive the 4% discount. Based on these assumptions, the comparable properties tax obligation ranges from a low $2.66 per square foot to a high of $4.94 per square foot. The average of these comparables in terms of a 4% discount without any budget change is $3.41 per square foot. For this analysis, we will assume a reasonable tax obligation for the subject property is $3.40 per square foot and the estimated ad valorem real estate tax obligation for the proposed subject improvements is as follows:
Enclosed Building Area Subject’s Square Footage 13,166 Times Estimated Real Estate Tax P.S.F. x $3.40 Estimated Real Estate Tax $44,764 Rounded to, Say $44,800
Based on this analysis, we are of the opinion a reasonable proposed ad valorem real estate tax obligation for the subject property, Upon Completion of the proposed retail/office building, is $44,800.

42

Subject Improvement Analysis
43
SUBJECT IMPROVEMENT ANALYSIS

Subject Improvement Analysis
44
SUBJECT IMPROVEMENT PLAN - SITE PLAN

Subject Improvement Analysis
45
SUBJECT IMPROVEMENT PLAN – ELEVATION

Subject Improvement Analysis
46
SUBJECT IMPROVEMENT PLAN – FLOOR PLAN

Subject Improvement Analysis
47
DESCRIPTION OF SUBJECT IMPROVEMENTS: We were provided architectural plans for the proposed retail/office facility. These plans were prepared by:
International Architecture Division of Archimetrics, Inc. 1415 Dean Street Suite 116 Fort Myers, Florida 33901 Telephone number – 1-239-476-8822 Dated - 9 April 2007 (latest revision dated 10 May 2007)
Furthermore, the site plan was prepared by:
Source, Inc. Engineers - Planners 1334 Lafayette Street Cape Coral, Florida Telephone number – 1-239-549-2345 Dated 21 August 2006
If the reader desires a complete understanding of this proposed facility, they are encouraged to obtain a set of plans from the aforementioned firms. The proposed facility is a 13,166 square foot (enclosed and rentable area), one story retail/office facility. Basic Construction Features: The proposed improvements are considered to be a good to excellent quality, Class C, community center. The basic construction is CBS with a single pitch, flat roof along with three cement tile, hip roof designed cupolas and parapet. In addition, it will have a front covered walkway with decorative arches and columns. It will be a single story structure designed for eight multi-tenant units. The general placement of the building will be towards the eastern portion of it allowing ample parking in the front of the structure as it faces Santa Barbara Boulevard. There will be one ingress/egress from this thoroughfare. No access will be available to S.E. Santa Barbara Place.

Subject Improvement Analysis
48
Size of Building: The following is the breakdown of the proposed subject improvements:
First Level Rentable Areas Store/Office Area Unit Sq. Ft. 100 1,741 200 1,684 300 1,764 400 1,394 500 1,394 600 1,764 700 1,684 800 1,741 Subtotal 13,166 Non-Enclosed Area Covered Walkway 1,927 Total Gross Building Area 15,093
Foundation/Flooring: The foundation and flooring will consist of a concrete footer along with a 4" concrete slab. Exterior Walls: Pre-engineered steel structure supported, 5/8" cementitious coated and painted CB walls. In addition it will have decorative arches and columns associated with a covered walkway. Exterior Openings: Each unit will have a pre-finished aluminum storefront with clear impact resistant glass and double entry doors as well as a single rear personnel door.

Subject Improvement Analysis
49
Roof: The main roof structure will be flat with a slight slope with commercial grade roof covering supported by a 1 ½" galvanized steel deck supported by steel purlins. The copulas' roof structure will be a cement "S" tile roof covering supported by pre-engineered galvanized metal stud trusses with a 4/12 pitch. Two roof copulas, at either end of the building measure 25' x 25' and one copula will be at the front center of the building and measures 51' x 51'. Various heights associated with the roof structure are as follows:
Tie Beam - 17' 0" Top of Parapet - 20' 0" to 22' 8" Top of the two smaller copulas - 29' 8" Top of large copula - 36' 8"
HVAC System: Each of the units will have a central air conditioning system. Interior Finishes: The interior finishes, as per the plans are as follows:
Concrete exposed, smooth trowel flooring Separated by ½ " gypsium board, ready to paint, firewalls supported by metal studs Exposed trusses Finished ceilings to be at 12' 0" Single restroom with finished vinyl flooring and painted gypsium board walls in each unit
Site Improvements: The site improvements will consist of 54 asphalt paved, striped and curbed parking spaces, of which three will be designated for handicap use. The parking lot will be adequately landscaped and will have irrigation water provided by the City of Cape Coral. It will have a single ingress/egress from Santa Barbara Boulevard. Condition/Estimation of Effective Age: The subject improvements are proposed; therefore, for the purposes of this report, the improvements are considered to be new. The Total Economic Life of this structure is estimated to be 40 years. As such, the estimated depreciation associated with this improvement can be calculated as follows:
0 Years Effective Age 40 Years Total Economic Life = 0% Depreciation

Subject Improvement Analysis
50
Functional Obsolescence: The proposed subject improvements are designed as a one story, multi-tenant retail/office building. After reviewing the plans, it is our opinion the proposed subject improvements do not suffer from any functional obsolescence. External Obsolescence: It is our opinion the subject property is located in an area that has adequate demand for office/retail use. Furthermore, current interest rates are affordable and, as such, we are of the opinion the subject does not suffer from any external obsolescence.

Highest and Best Use Analysis
51
HIGHEST AND BEST USE ANALYSIS
Highest and Best Use Analysis
52
THE HIGHEST AND BEST USE: Real estate is valued in terms of its highest and best use. Highest and best use is the use which would be the most profitable and likely use of a property. It may also be defined as that available use and program of future utilization which produces the highest present land value. Highest and best use is defined by The Dictionary of Real Estate Appraisal, Fourth Edition (Page 135), as:
The reasonably probable and legal use of vacant land or an improved property, which is physically possible, appropriately supported, financially feasible and that results in the highest value. The four criteria the highest and best use must meet are legal permissibility, physical possibility, financial feasibility, and maximum profitability.
The Highest and Best Use Analysis begins with an analysis of the property as if vacant and available to be put to its highest and best use. The property is further analyzed if there are improvements on the property or proposed for the site. In this situation, the subject property is a proposed facility. The four criteria of highest and best use that a property must meet are as follows:
• Legally Permissible Use - what uses are permitted by zoning and deed restrictions on the subject property?
• Physically Possible Use - what uses are physically possible to put on the site?
• Financially Feasible Use - which possible and permissible uses will produce a net return to the owner of the site?
• Maximally Productive Use - among the feasible uses, which use will produce the highest net return?
Highest and Best Use As Vacant: The highest and best use analysis of the site as though vacant assumes that a site is either vacant or can be made so through demolition of any improvements. This analysis examines the type of improvement that is most appropriate for a particular site. Legally Permissible:
The subject property is zoned C-1, Pedestrian Commercial District, which is a commercial zoning classification in Cape Coral. The Cape Coral Comprehensive Land Use Plan has designated the subject property for Commercial-Professional land use. It appears the subject property is legally permissible for commercial development. Physically Possible:
The subject site consists of a 53,000 square foot or 1.217 acre parcel and is “L” in shape. It has adequate width and depth for development. It is fronts on Santa Barbara Boulevard as well as S.E. Santa Barbara Place. Access to the site is considered to be adequate. Accordingly, in terms of physically possible, a wide variety of uses could be constructed on this site including commercial, residential and industrial.

Highest and Best Use Analysis
53
Financially Feasible:
The demand for commercial properties in this area of Cape Coral is considered to be adequate at this time. However, it is important a prudent investor/developer be cautiously optimistic. Due to the oversupply of residential housing units throughout Lee County, the increase in Ad Valorem real estate tax obligations for non-homesteaded real estate as well as the increase to commercial insurance premiums, we have observed a leveling of rental rates for commercial retail and office space within this area of Lee County. In terms of residential use of the property, it is our opinion the subject site is not financially feasible for this type of use due to the overall underlying land value being to high to support any type of residential development. Likewise, in terms of industrial development, the land value is at a level that could not support industrial development. Accordingly, we conclude the financially feasible use of the subject property is for commercial development. Maximally Productive:
It has been estimated the highest and best use of the subject site, as though vacant, would be to develop it with an commercial building that would maximize the site in terms of rentable area, designed in such as fashion that would appeal to wide variety of potential tenants and utilize the exposure to Santa Barbara Boulevard to its fullest potential. Highest and Best Use As Proposed/Conclusion: After considering the subject property’s legally permissible, physically possible, financially feasible, and maximally productive uses, it is our opinion the highest and best use of the subject site, as if vacant, is for commercial development. The subject property is proposed to be improved with a good to excellent quality cost, Class C, community center with 13,166 square feet of enclosed building area. This creates a land to building ratio of 4.03:1. Furthermore, it is designed to appeal to a wide variety of users/tenants and is to be placed on the site to provide maximum exposure to Santa Barbara Boulevard. Accordingly, it is our opinion the proposed improvements fall within the realm of the estimated highest and best use of this property.

54
Appraisal Process
55
APPRAISAL PROCESS

Appraisal Process
56
THE APPRAISAL PROCESS: There are three standard approaches to property valuation:
• Cost Approach to Value • Sales Comparison Approach to Value • Income Approach to Value
Cost Approach to Value: The Cost Approach to Value requires estimating the reproduction cost new of the improvements, utilizing current labor and material prices and modern construction techniques. Accrued deprecia-tion is next computed and subtracted from the cost new. Finally, the land value is added to the remainder to derive a value for the property as a whole. The Cost Approach is most reliable when the improvements are new and the land value can be reasonably estimated. Conversely, when the improvements are old and/or adequate land sales are not available, the Cost Approach tends to lose credence. Sales Comparison Approach to Value: An estimate under the Sales Comparison Approach to Value is derived by comparing the property under appraisal with other similar properties that have sold in recent months. The Sales Comparison Approach is most reliable when the comparable sales are very similar to the subject. Conversely, when large or numerous adjustments are necessary, the Sales Comparison Approach is less reliable. Income Approach to Value: The Income Approach to Value is normally applied only to commercial or strictly income oriented properties, since it measures the present worth of future rights to income. The Income Approach to Value, when adequate income and expense data are available, is probably the most reliable approach in the valuation of commercial properties as it best represents investors' and lenders' actions in the marketplace. The preceding three approaches may indicate different values. Within this analysis, we are utilizing all three traditional approaches to value in estimating the prospective market value of the subject property Upon Stabilization. Within the Cost Approach to Value, we are also utilizing the Sales Comparison Approach to Value in order to estimate the “As Is”, (land only) value. In estimating the prospective market value of the subject property Upon Completion, we will employ a Discounted Cash Flow (DCF) model. This will take into account the absorption of the tenant space into the market place both in terms of pre-leases as well as leasing activity after the property has been completed. Furthermore, this DCF model will take into account anticipated future rental income increases as well as expenses associated with this property over a typical holding period. This methodology reflects typical investor thinking of a property similar to the subject. In addition, we will also estimate the Insurable Value, based on the aforementioned definition. The following are these analyses.
Cost Approach to Value
57
COST APPROACH TO VALUE

Cost Approach to Value
58
THE COST APPROACH TO VALUE: The Cost Approach to Value is based on the "Principle of Substitution", which says that a prudent purchaser would pay no more for a property than the cost of acquiring an equally desirable substitute. This principle says that value cannot exist above the required cost involved in purchasing a lot and erecting a similar building on it, as long as substitution can be made without delay and in a convenient manner. The steps in the Cost Approach to Value, as applied in this appraisal, are as follows:
• An estimate is made of the reproduction cost new of the building and its appurtenances, based on today's labor and material prices.
• By the same or similar procedure, estimate the present reproduction cost of
other improvements such as site improvements and any minor structures. • Add any indirect costs such as out-of-pocket and impact fees. • From this amount there is deducted the estimated amount of depreciation
(physical deterioration and functional and external obsolescence). The result is the depreciated or present worth of the improvements.
• To this is added the land value as found by the Sales Comparison Approach
to Value. The result is the indicated replacement cost. • Finally, any applicable entrepreneurial profit percentage is added to obtain
the total value indication via the Cost Approach. Estimate of Reproduction Cost: We have been provided a cost estimation for construction of this project. In addition, we are also independently estimating the cost of development via cost manuals.

Cost Approach to Value
59
Estimated Cost per Developer: We have been provided a cost estimate by the developer. All expenses, with the exception of the estimated land value and entrepreneurial profit were provided by the developer. These other two costs are estimated by us. The following is this cost estimation:
Contractor Costs for Taylor Pansing, Inc. $1,527,419 Contingency for cost overruns of 10% $152,742 Construction Management Fee of 5% $76,371 Architectural Fees $129,400 City of Cape Coral Impact Fees $95,000 Civil Engineer $73,300 Road widening fees to the City of Cape Coral $40,250 Building Signage $39,100 Construction Insurance $27,500 Parking lot site lighting $21,000 Landscaping $18,500 Legal expense $13,100 Total Construction Cost $2,213,682
Based on this developer cost estimate, prior to land costs and entrepreneurial profit being added, the price per square foot is $168.14 of enclosed building area ($2,213,682 ÷ 13,166 square feet).

Cost Approach to Value
60
Cost Estimate via Cost Manual:
In addition to the summary of the Unit-in-Place Method as provided by the contractor, we are also estimating the reproduction cost via a cost manual in the Comparative-Unit Method. Within this analysis, we found the proposed subject building to be a good to excellent cost, Class C, community center, as found in Section 13, Page 34 of the May 2006 issue of the Marshall Valuation Service. The cost, before refinements, is estimated to be $101.85 per square foot for the enclosed building area. After certain refinements are made, the following cost is developed:
Base Cost Per Square Foot $101.85Plus Raised Copulas $ 20.19Plus Covered Walkways $ 5.98Times Wall Height Multiplier x 1.106Times Perimeter Multiplier x 0.935Times Current Cost Multiplier x 1.07Times Local Cost Multiplier x 1.02Adjusted Cost Per Square Foot $144.46
Site Improvements: We have also estimated site improvements on the property as follows:
Clearing/Fill/Grading/Parking/Landscaping/Signage $125,000 Water/Sewer (included in impact fee cost) $ 0 Total Site Improvements $125,000
Indirect Construction Costs: Certain costs that are not included in the Marshall Valuation Service's direct reproduction costs are also being estimated. These costs are also known as soft costs. Indirect Costs are defined by The Dictionary of Real Estate Appraisal, Fourth Edition (Page 145), as:
Expenditures or allowances for items other than labor and materials that are necessary for construction, but are not typically part of the construction contract. Indirect costs may include administrative costs; professional fees; financing costs and the interest paid on construction loans; taxes and the builder's or developer's all-risk insurance during construction; and marketing, sales, and lease-up costs incurred to achieve occupancy or sale.

Cost Approach to Value
61
We have estimated several indirect costs associated with a property of this type as follows:
1. Loan Commitment Fee: Typically, developers/owners use land value as equity and borrow funds for construction. This fee typically runs approximately 1% of the loan amount. This expense can be calculated as follows:
$2,135,586* x .01 = $21,356 *Includes impact fees
2. Out-of-Pocket Expenses: This indirect cost includes the cost of appraisals, documentary stamp tax, recording fees, attorney's fees, and surveys. This cost is estimated at 3% of the loan amount. This expense is calculated as follows:
$2,135,586* x .03 = $64,068 * Includes impact fees
3. Impact Fees: The City of Cape Coral imposes impact fees for new construction. We have estimated the impact fees, based on the City of Cape Coral's website to be $108,626.
Summary of Costs via Comparative-Unit Method (Cost Manual):
Building $1,901,960 Site Improvements $ 125,000 Subtotal $2,026,960 Plus Indirect Costs $ 194,049 Total Reproduction Cost New $2,221,010
This cost estimate, before the estimated depreciation, if any, land value and entrepreneurial profit, is $168.69 per square foot ($2,135,586 ÷ 13,166 square feet). RECONCILIATION OF REPRODUCTION COST ESTIMATE: For this analysis, we have been provided a cost breakdown by the developer, which equates out to $168.14 per square foot of enclosed building area. In addition, we have estimated the cost via the cost manual, at $168.69 per square foot. These two cost estimates vary by less than 1%. It is our opinion, most weight should be placed on the Developers Cost Estimate, which is supported by the cost manual. The estimation of the subject site value, along with entrepreneurial profit, is as follows:

Cost Approach to Value
62
COMPARABLE LAND SALES MAP

Cost Approach to Value
63
COMPARABLE LAND SALE 1 266
DATE OF SALE: May 31, 2007 ADDRESS: 219 Del Prado Boulevard South SALE PRICE: $650,000 STRAP #: 17-44-24-C1-01322.0280 RECORDING: 2007000176359 UTILITIES: Full GRANTOR: Scheffler Hurley Investments, LLC
ZONING: C-1
GRANTEE: Gulf Coast Land and Investment Group
LAND USE: CP
FINANCING: Cash HIGHEST AND BEST USE: Commercial SALE HISTORY: See Comments SITE AREA: 32,400 Square Feet or 0.744
Acres VERIFICATION: Hal Arkin, Broker UNIT OF VALUE: $20.06 Per Square Foot COMMENTS: The subject property is located on the east side of Del Prado Boulevard, south of Hancock Bridge Parkway in Cape Coral, Florida. The property has right-in/right-out access. Prior sales were: $570,000 - July 2004 as per OR 4401/500 and $270,000 - May 2004 as per OR 4311/2158.
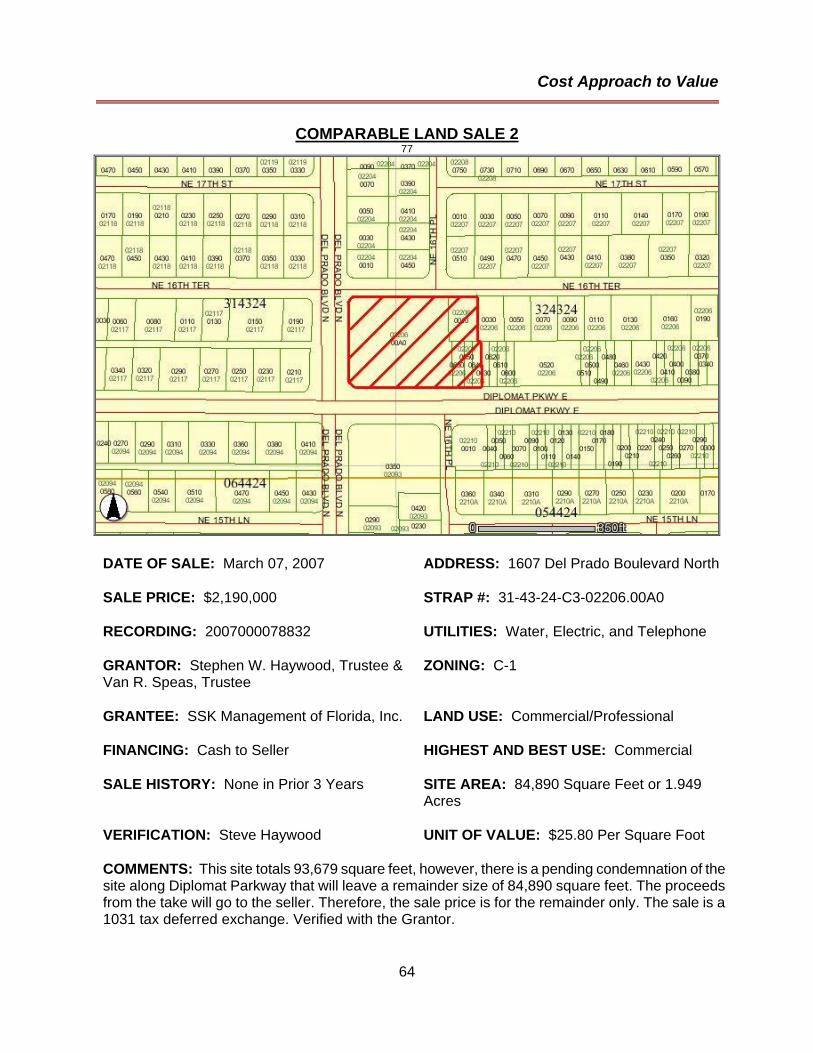
Cost Approach to Value
64
COMPARABLE LAND SALE 2 77
DATE OF SALE: March 07, 2007 ADDRESS: 1607 Del Prado Boulevard North SALE PRICE: $2,190,000 STRAP #: 31-43-24-C3-02206.00A0 RECORDING: 2007000078832 UTILITIES: Water, Electric, and Telephone GRANTOR: Stephen W. Haywood, Trustee & Van R. Speas, Trustee
ZONING: C-1
GRANTEE: SSK Management of Florida, Inc. LAND USE: Commercial/Professional FINANCING: Cash to Seller HIGHEST AND BEST USE: Commercial SALE HISTORY: None in Prior 3 Years SITE AREA: 84,890 Square Feet or 1.949
Acres VERIFICATION: Steve Haywood UNIT OF VALUE: $25.80 Per Square Foot COMMENTS: This site totals 93,679 square feet, however, there is a pending condemnation of the site along Diplomat Parkway that will leave a remainder size of 84,890 square feet. The proceeds from the take will go to the seller. Therefore, the sale price is for the remainder only. The sale is a 1031 tax deferred exchange. Verified with the Grantor.

Cost Approach to Value
65
COMPARABLE LAND SALE 3 86
DATE OF SALE: October 31, 2006 ADDRESS: 2534 SE Santa Barbara Place SALE PRICE: $585,000 STRAP #: 36-44-23-C1-00555.0210 RECORDING: 2006000418173 UTILITIES: Full GRANTOR: DTD Assets Management, Inc. ZONING: C-1 GRANTEE: Tropical Network Business, Inc. LAND USE: CP FINANCING: Cash to Seller HIGHEST AND BEST USE: Commercial SALE HISTORY: None in Prior 3 Years SITE AREA: 19,950 Square Feet or 0.458
Acres VERIFICATION: Russell Nersesov UNIT OF VALUE: $29.32 Per Square Foot COMMENTS: This is a vacant commercial parcel with exposure to the Santa Barbara Boulevard/Veterans Parkway intersection. However, this parcel is accessed from a side street, SE Santa Barbara Place. The recorded sale price was $645,000, however this included $60,000 in permits and architectural plans.

Cost Approach to Value
66
COMPARABLE LAND SALE 4 406
DATE OF SALE: October 25, 2006 ADDRESS: 4805 SW 18th Avenue SALE PRICE: $1,800,000 STRAP #: 16-45-23-C2-04635.0200 RECORDING: 2006000406925 UTILITIES: Full GRANTOR: 18th Avenue. LLC ZONING: C-1 GRANTEE: Suncoast Schools Federal Credit Union
LAND USE: Commercial Professional
FINANCING: Cash to Seller HIGHEST AND BEST USE: Commercial SALE HISTORY: $650,000 in August 2004 as per OR 4444/2311
SITE AREA: 62,500 Square Feet or 1.435 Acres
VERIFICATION: Broker - Hal Arkin UNIT OF VALUE: $28.80 Per Square Foot COMMENTS: This parcel is located at the southwest corner of Cape Coral Parkway and SW 17th Place. This is a vacant commercial parcel which has frontage on three streets and is in close proximity to the Camelot Isles Shopping Center. The grantee plans on building a branch bank.

Cost Approach to Value
67
COMPARABLE LAND SALE 5 34
DATE OF SALE: July 11, 2006 ADDRESS: 1227 Viscaya Parkway SALE PRICE: $1,610,900 STRAP #: 19-44-24-C2-00801.0520 RECORDING: 2006000283370 UTILITIES: Full GRANTOR: L.H.DD., LLC ZONING: P-1 GRANTEE: Friday, LLC LAND USE: CP FINANCING: Cash to Seller HIGHEST AND BEST USE: Commercial SALE HISTORY: $80,000 - June 2004 as per OR 4342/1444, $329,500 - January 2004
SITE AREA: 75,000 Square Feet or 1.722 Acres
VERIFICATION: Grantee's Broker UNIT OF VALUE: $21.48 Per Square Foot COMMENTS: This property is located on the north side of Viscaya Parkway, west of Del Prado Boulevard near Cape Coral Hospital. The purchase price included a Development Order and plans for a medical facility. The Grantee also purchased an adjacent site from a different grantor.

Cost Approach to Value
68
COMPARABLE LAND SALE 6 405
DATE OF SALE: May 25, 2006 ADDRESS: 2536 Skyline Boulevard SALE PRICE: $1,800,000 STRAP #: 34-44-23-C2-0030A.0000 RECORDING: 2006000222108 UTILITIES: Full GRANTOR: Windsor-Thomas Group, Inc. ZONING: C-1 GRANTEE: Bank of America, N.A. LAND USE: Commercial Professional FINANCING: Cash to Seller HIGHEST AND BEST USE: Commercial SALE HISTORY: None as platted SITE AREA: 45,440 Square Feet or 1.043
Acres VERIFICATION: grantee UNIT OF VALUE: $39.61 Per Square Foot COMMENTS: This property is located at the northwest corner of Skyline Boulevard and SW 26th Street. This is a vacant commercial outparcel located at the Home Depot. The grantee plans on building a branch bank on the site.

Cost Approach to Value
69
ANALYSIS/DISCUSSION OF COMPARABLE LAND SALES: The preceding vacant land sales are considered to be the most recent and similar sales available for direct comparison purposes. All of the sales are recent, having occurred between May 2006 and May 2007. They were chosen because of their proximity to the subject, size, and/or sale date. All of the sales are considered to be likely alternatives for a prospective purchaser of the subject site. Explanation of Non-Physical Adjustments: The sales are analyzed utilizing the Price Per Square Foot Method, as the market typically acquires commercial properties utilizing this multiplier. Non-physical adjustments are applied to the comparable sales for property rights, financing, conditions of sale, and market conditions (time). None of the sales require an adjustment for property rights or financing. All of the sales are considered to be arm's length transactions and therefore no adjustments in this category were required. None of the sales are adjusted upwards for time advancement. It is our opinion, we are in a level market and therefore no time adjustment is applied to any of the comparables in this analysis. Before and after non-physical adjustments are considered, the sales range from a low of $20.06 per square foot for Comparable Sale 1 to a high of $39.61 per square foot for Comparable Sale 6. Explanation of Physical Adjustments: In analyzing the physical characteristics of the comparable properties, the Relative Comparison Analysis is being considered. This analysis considers qualitative adjustments rather than quantitative adjustments. The Relative Comparison Analysis analyzes comparable properties in terms of inferiority, superiority, or similarity to the subject. These adjustments are not expressed as a dollar or percentage adjustment. In this portion of the analysis, we are analyzing the comparables in terms of size/shape, utilities, location/position, and zoning/land use/entitlements. The following is a summary of the comparables and their appropriate adjustments:

Cost Approach to Value
70
SUBJECT SALE 1 SALE 2 SALE 3 SALE 4 SALE 5 SALE 6
LOCATION
Del Prado Boulevard In Section 17-44-24
Del Prado Boulevard In Section 31-43-24
Santa Barbara Pl.
In Section 36-44-23
SW 18th Place & Cape Coral Pkwy.
In Section 16-45-23
Viscaya Parkway In Section 19-44-24
Skyline Blvd & SW 26th Street
In Section 23-44-23
SALES PRICE $650,000 $2,190,000 $585,000 $1,800,000 $1,610,900 $1,800,000
SIZE - Square Feet 53,000 32,400 84,890 19,950 62,500 75,000 45,440
PRICE Per Square Foot $20.06 $25.80 $29.32 $28.80 $21.48 $39.61
APPRAISAL EFFECTIVE DATE September-07
SALE DATE
Closing Date May-07 March-07 October-06 October-06 July-06 May-06
ELAPSED MONTHS 4 6 11 11 14 16
ADJUSTMENTS:
NON-PHYSICAL ADJUSTMENTS
PROPERTY RIGHTS 0% 0% 0% 0% 0% 0%
FINANCING 0% 0% 0% 0% 0% 0%
CONDITION OF SALE 0% 0% 0% 0% 0% 0%
MARKET ADVANCEMENT (TIME) 0% 0% 0% 0% 0% 0%
ADJUSTED SALES PRICE per Square Foot $20.06 $25.80 $29.32 $28.80 $21.48 $39.61
PHYSICAL ADJUSTMENTS
SIZE/SHAPE Similar Similar Superior Similar Similar Similar
UTILITIES Similar Similar Similar Similar Similar Similar
LOCATION / POSITION / ACCESS Inferior Similar Superior Superior Inferior Superior
ZONING/LAND USE/ENTITLEMENTS Similar Similar Similar Similar Similar Similar
NET ADJUSTMENT Inferior Similar Superior Superior Inferior Superior

Cost Approach to Value
71
In consideration of the physical adjustments, all of the comparables are similar to the subject in terms of size/shape with the exception of Comparable Sale 3. This is a smaller site and therefore a downward adjustment is applied to this comparable. In terms of utilities, all of the comparables are similar and therefore require no adjustment in this category. In terms of location/position/access, Comparable Sale 1 and 5 are considered inferior to the subject and therefore are adjusted upward in this category. Comparable Sale 2 is similar to the subject and therefore requires no adjustment in this category. Comparable Sales 3, 4 and 6 are superior to the subject in varying degrees and therefore require downward adjustment in this category. In terms of zoning/land use/entitlements, all of the comparables are similar and therefore require no adjustment in this category. In the final analysis, Comparable Sale 1 and 5 are considered to be inferior to the subject and therefore require upward adjustments. Comparable Sale 2 requires no adjustments and Comparable Sales 3, 4, and 6 are considered superior to the subject and therefore require downward adjustments. In the final analysis, we are of the opinion a reasonable market value for the subject site is $23.00 per square foot, which is supported by all of the comparables. The following is the estimation of the subject site value:
Subject site square footage 53,000 Estimated Value per square foot x $ 23.00 Indicated Value $1,219,000 Rounded to, Say $1,220,000
Cost Approach to Value
72
ENTREPRENEURIAL PROFIT: Developer profit is the percentage of a project's cost payable to a developer for bringing a project into the marketplace. Typically, new projects have actual costs (land and improvements) that are less than the value indications shown by the Sales Comparison and Income Approaches to Value. This difference is referred to as profit incentive an entrepreneur would expect in the pursuit of a particular project. Typically, entrepreneurial profit percentages range from 5% to over 20%, depending upon the type of project and the anticipated rates of return on capital. In this situation, the Cost Approach to Value, before entrepreneurial profit, is approximately 9.00% less than both the Sales Comparison and Income Approaches to Value. Accordingly, a 9.00% entrepreneurial profit is factored into the Cost Approach to Value. On the following page is the estimation of the prospective market value of the subject property Upon Stabilization, via the Cost Approach to Value.

Cost Approach to Value
73
THE COST APPROACH TO VALUE - RECAPITULATION
PROSPECTIVE MARKET VALUE UPON STABILIZATION Contractor Costs for Taylor Pansing, Inc. $1,527,419 Contingency for cost overruns of 10% $152,742 Construction Management Fee of 5% $76,371 Architectural Fees $129,400 City of Cape Coral Impact Fees $95,000 Civil Engineer $73,300 Road widening fees to the City of Cape Coral $40,250 Building Signage $39,100 Construction Insurance $27,500 Parking lot site lighting $21,000 Landscaping $18,500 Legal expense $13,100 Total Construction Cost $2,213,682 Land (1) $1,220,000 Subtotal $3,433,682 Add Entrepreneurial Profit at 9.00% $309,031 Indicated Value $3,742,713 Rounded to, say $3,745,000 Notes 1 - Estimated by appraiser

74

Sales Comparison Approach to Value
75
SALES COMPARISON APPROACH TO VALUE

Sales Comparison Approach to Value
76
THE SALES COMPARISON APPROACH TO VALUE: The Sales Comparison Approach to Value is a process of comparing sales of similar properties in the marketplace to the subject parcel. Market data, when carefully verified and analyzed, is good evidence of value because it represents the actions and reactions of sellers, users, and investors. The market value estimate has been defined as an interpretation of the reactions of typical users and investors in the market. The Sales Comparison Approach is based on the principle of substitution, which states that a prudent purchaser would not pay more for a property than the cost of acquiring a comparable substitute property. The price a typical purchaser pays is usually the result of an extensive shopping process in which they are constantly comparing available alternatives. The steps in the Sales Comparison Approach to Value, as applied in this appraisal, are as follows:
• Seek out similar properties for which pertinent sales and data are available. • Qualify the prices as to terms, motivating forces, and bona fide nature. • Compare each of the comparable properties' important attributes with the
corresponding ones of the property being appraised under the general division of time, location, and physical characteristics.
• Consider all dissimilarities in terms of their probable effect upon the sale
price. • Formulate an opinion of relative value of the property being appraised as
compared with the price of each similar property.
The sales selected are commercial retail/office buildings, which have recently sold within the Lee County marketplace. In this situation, these sales are analyzed in terms of a Potential Gross Income Multiplier (PGIM) Method, as well as a Price Per Square Foot Method. The following are the sales considered, as well as an analysis of same.

Sales Comparison Approach to Value
77
COMPARABLE IMPROVED SALES MAP

Sales Comparison Approach to Value
78
COMPARABLE IMPROVED SALE 1 252
DATE OF SALE: August 22, 2007 ADDRESS: 2950 Winkler Avenue SALE PRICE: $4,600,000 STRAP #: 31-44-25-P4-00400.006A RECORDING: 2007000271738 UTILITIES: Full GRANTOR: BFM Properties, LLC ZONING: B-2 GRANTEE: Mucca Mucca, LLC LAND USE: B-2 FINANCING: Conventional HIGHEST AND BEST USE: Commercial SALE HISTORY: None as developed VERIFICATION: Dan Miller, broker GROSS BUILDING AREA: 17,212 Square Feet
SITE AREA: 74,685 Square Feet
NET BUILDING AREA: 16,992 Square Feet ACTUAL AGE: 2006 LAND TO BUILDING RATIO: 4.40:1 EFFECTIVE AGE: New (2006) COMMENTS: This is a community shopping center that is in excellent condition. It is located on the southwest corner of Winkler Avenue and Metro Parkway. This property came under contract on 30 May 2007 after less than 30 days on the market. It sold for the full list price.
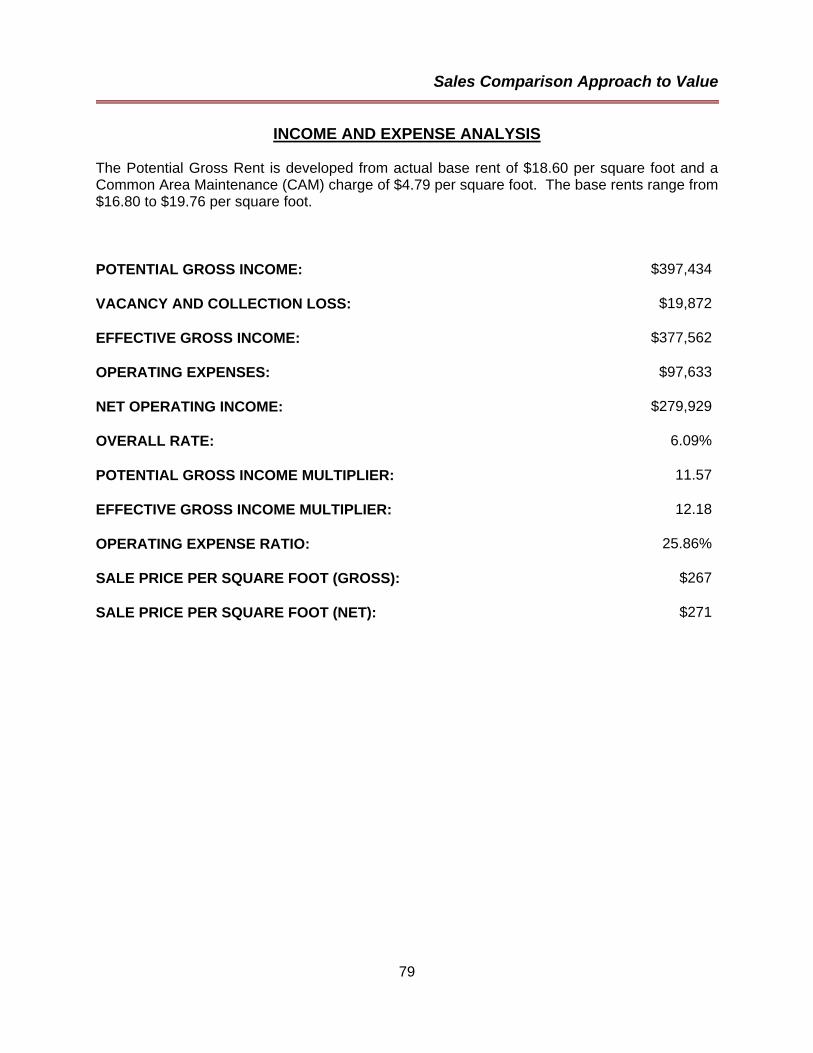
Sales Comparison Approach to Value
79
INCOME AND EXPENSE ANALYSIS
The Potential Gross Rent is developed from actual base rent of $18.60 per square foot and a Common Area Maintenance (CAM) charge of $4.79 per square foot. The base rents range from $16.80 to $19.76 per square foot. POTENTIAL GROSS INCOME: $397,434 VACANCY AND COLLECTION LOSS: $19,872 EFFECTIVE GROSS INCOME: $377,562 OPERATING EXPENSES: $97,633 NET OPERATING INCOME: $279,929 OVERALL RATE: 6.09% POTENTIAL GROSS INCOME MULTIPLIER: 11.57 EFFECTIVE GROSS INCOME MULTIPLIER: 12.18 OPERATING EXPENSE RATIO: 25.86% SALE PRICE PER SQUARE FOOT (GROSS): $267 SALE PRICE PER SQUARE FOOT (NET): $271

Sales Comparison Approach to Value
80
COMPARABLE IMPROVED SALE 2 248
DATE OF SALE: July 25, 2007 ADDRESS: 13161 - 13261 McGregor
Boulevard SALE PRICE: $10,500,000 STRAP #: 21-45-24-00-00004.0000 RECORDING: 2007000238169 UTILITIES: Full GRANTOR: McGregor Properties Partnership and McGregor Boulevard Center, LTD.
ZONING: C-1, CT
GRANTEE: Terra Design Center, LLC LAND USE: Central Urban FINANCING: Cash to seller HIGHEST AND BEST USE: Commercial SALE HISTORY: None in the last 3 years VERIFICATION: Paul Sands, Broker GROSS BUILDING AREA: 47,310 Square Feet SITE AREA: 209,076 Square Feet NET BUILDING AREA: 44,037 Square Feet ACTUAL AGE: 1982-85 LAND TO BUILDING RATIO: 4.75:1 EFFECTIVE AGE: 10 - 15 years COMMENTS: These improvements consist of a contemporary, Class C, community shopping center. There are four (4) buildings in total. It is located on a 4.80 acre site. This sale was verified as arm's length.

Sales Comparison Approach to Value
81
INCOME AND EXPENSE ANALYSIS
The Potential Gross Rent is developed from an estimated market base rent of $15.65 per square foot and a Common Area Maintenance (CAM) charge of $3.96 per square foot. POTENTIAL GROSS INCOME: $871,492 VACANCY AND COLLECTION LOSS: $26,145 EFFECTIVE GROSS INCOME: $845,347 OPERATING EXPENSES: $193,888 NET OPERATING INCOME: $651,459 OVERALL RATE: 6.20% POTENTIAL GROSS INCOME MULTIPLIER: 12.05 EFFECTIVE GROSS INCOME MULTIPLIER: 12.42 OPERATING EXPENSE RATIO: 22.94% SALE PRICE PER SQUARE FOOT (GROSS): $222 SALE PRICE PER SQUARE FOOT (NET): $238

Sales Comparison Approach to Value
82
COMPARABLE IMPROVED SALE 3 152
DATE OF SALE: June 01, 2007 ADDRESS: 16050 South Tamiami Trail SALE PRICE: $2,000,000 STRAP #: 01-46-24-00-00004.1010 RECORDING: 2007000192333 UTILITIES: Full GRANTOR: L. I. Smith and Fred B. Williams ZONING: C-1 GRANTEE: P.F. Holdings Florida, LLC LAND USE: Suburban FINANCING: Cash to Seller HIGHEST AND BEST USE: Commercial SALE HISTORY: $1,125,000 - September 1999 as per OR 3164/4164
VERIFICATION: Buddy Smith, grantor
GROSS BUILDING AREA: 10,531 Square Feet
SITE AREA: 40,760 Square Feet
NET BUILDING AREA: 10,501 Square Feet ACTUAL AGE: 1994 LAND TO BUILDING RATIO: 3.88:1 EFFECTIVE AGE: 5 Years COMMENTS: This is a well maintained retail/office center. It is located on a service road which has both a full, non-signalized median cut as well as a right-in/right-out access form South Tamiami Trail. The unit square footage sizes are as follows: 700 (two); 924 (2); 955 (1); 975 (1); 1,392 (10; 1,826 (1) and; 2,105 (1). It is located on a 40,760 square foot site.

Sales Comparison Approach to Value
83
INCOME AND EXPENSE ANALYSIS
PGI is derived from the actual rent of $17.00 per square foot ($16-$18 psf range) plus $5.00 psf CAM POTENTIAL GROSS INCOME: $231,022 VACANCY AND COLLECTION LOSS: $11,551 EFFECTIVE GROSS INCOME: $219,471 OPERATING EXPENSES: $52,505 NET OPERATING INCOME: $166,966 OVERALL RATE: 8.35% POTENTIAL GROSS INCOME MULTIPLIER: 8.66 EFFECTIVE GROSS INCOME MULTIPLIER: 9.11 OPERATING EXPENSE RATIO: 23.92% SALE PRICE PER SQUARE FOOT (GROSS): $190 SALE PRICE PER SQUARE FOOT (NET): $190

Sales Comparison Approach to Value
84
COMPARABLE IMPROVED SALE 4 122
DATE OF SALE: January 22, 2007 ADDRESS: 211 Hancock Bridge Parkway SALE PRICE: $2,450,000 STRAP #: 13-44-23-C1-01095.0110 RECORDING: 2007000031808 UTILITIES: Full GRANTOR: PL Properties, LLC ZONING: Corr GRANTEE: Keller-Boyette LP LAND USE: Pine Island Road District FINANCING: Cash to Seller HIGHEST AND BEST USE: Commercial SALE HISTORY: $2,100,000 - January 2004 as per OR 4188/4562
VERIFICATION: broker
GROSS BUILDING AREA: 15,040 Square Feet
SITE AREA: 42,575 Square Feet
NET BUILDING AREA: 13,600 Square Feet ACTUAL AGE: 2000 LAND TO BUILDING RATIO: 3.13:1 EFFECTIVE AGE: 5-6 years COMMENTS: This property is located on the north side of Hancock Bridge Parkway, just south of Pine Island Road. This is a CBS, multi-tenant retail center constructed in 2000. The building was in good condition at the time of sale.

Sales Comparison Approach to Value
85
INCOME AND EXPENSE ANALYSIS
PGI is derived from the actual rent of $15,330 per month plus $.5.00 P.S.F. CAM. POTENTIAL GROSS INCOME: $251,960 VACANCY AND COLLECTION LOSS: $12,598 EFFECTIVE GROSS INCOME: $239,362 OPERATING EXPENSES: $71,590 NET OPERATING INCOME: $167,772 OVERALL RATE: 6.85% POTENTIAL GROSS INCOME MULTIPLIER: 9.72 EFFECTIVE GROSS INCOME MULTIPLIER: 10.24 OPERATING EXPENSE RATIO: 29.91% SALE PRICE PER SQUARE FOOT (GROSS): $163 SALE PRICE PER SQUARE FOOT (NET): $180

Sales Comparison Approach to Value
86
COMPARABLE IMPROVED SALE 5 99
DATE OF SALE: December 12, 2006 ADDRESS: 3321 Del Prado Boulevard South SALE PRICE: $2,650,000 STRAP #: 05-45-24-C1-00599.0040 RECORDING: 2006000467405 UTILITIES: Full GRANTOR: Freedom Boat Company ZONING: P-1 GRANTEE: TAL Enterprises, LLC LAND USE: Professional Commercial FINANCING: Conventional HIGHEST AND BEST USE: Office
Development SALE HISTORY: $425,000 - May 2003 as per OR 3970/1269 - Vacant Land
VERIFICATION: broker
GROSS BUILDING AREA: 10,000 Square Feet
SITE AREA: 34,979 Square Feet
NET BUILDING AREA: 9,568 Square Feet ACTUAL AGE: 2006 LAND TO BUILDING RATIO: 3.66:1 EFFECTIVE AGE: New COMMENTS: This property is located on the east side of Del Prado Boulevard, north of Palaco Grande Boulevard. This is a recently constructed multi-tenant CBS retail/office center. The building is 100% leased by eight tenants. It was in excellent condition at the time of sale.

Sales Comparison Approach to Value
87
INCOME AND EXPENSE ANALYSIS
Based on actual average rents of $29.23 P.S.F. and CAM charges of $4.00 P.S.F. POTENTIAL GROSS INCOME: $317,753 VACANCY AND COLLECTION LOSS: $15,888 EFFECTIVE GROSS INCOME: $301,865 OPERATING EXPENSES: $56,592 NET OPERATING INCOME: $245,273 OVERALL RATE: 9.26% POTENTIAL GROSS INCOME MULTIPLIER: 8.34 EFFECTIVE GROSS INCOME MULTIPLIER: 8.78 OPERATING EXPENSE RATIO: 18.75% SALE PRICE PER SQUARE FOOT (GROSS): $265 SALE PRICE PER SQUARE FOOT (NET): $277
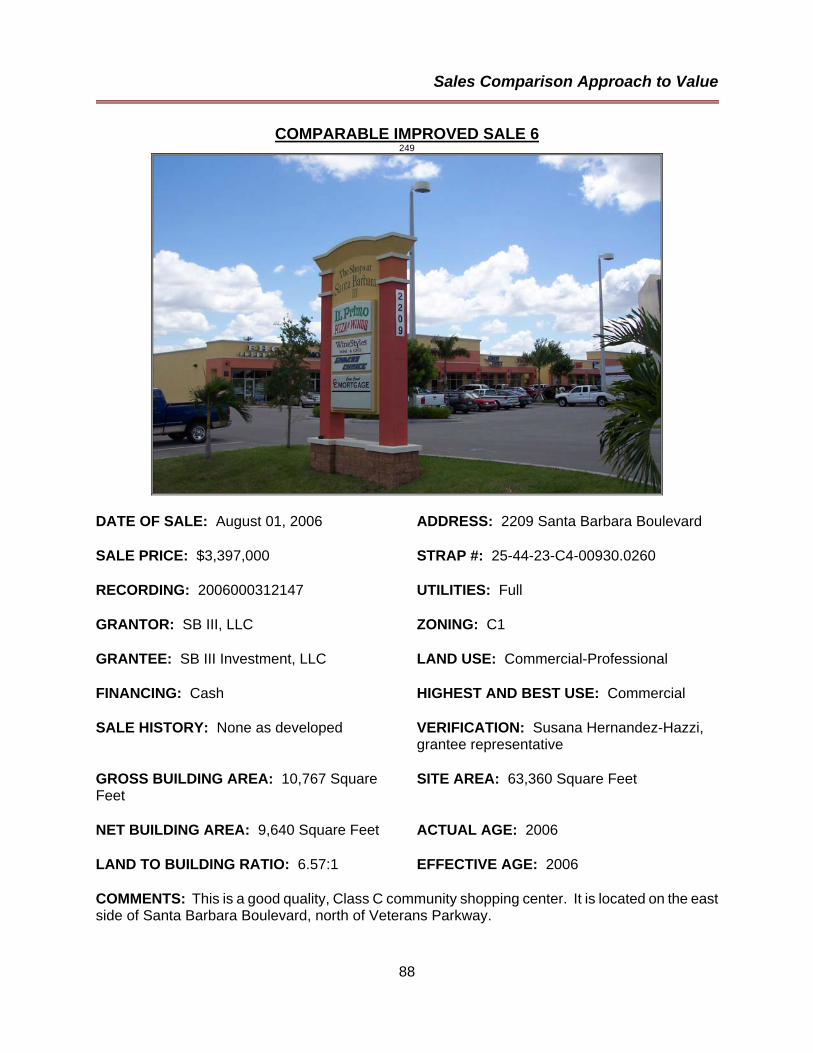
Sales Comparison Approach to Value
88
COMPARABLE IMPROVED SALE 6 249
DATE OF SALE: August 01, 2006 ADDRESS: 2209 Santa Barbara Boulevard SALE PRICE: $3,397,000 STRAP #: 25-44-23-C4-00930.0260 RECORDING: 2006000312147 UTILITIES: Full GRANTOR: SB III, LLC ZONING: C1 GRANTEE: SB III Investment, LLC LAND USE: Commercial-Professional FINANCING: Cash HIGHEST AND BEST USE: Commercial SALE HISTORY: None as developed VERIFICATION: Susana Hernandez-Hazzi,
grantee representative GROSS BUILDING AREA: 10,767 Square Feet
SITE AREA: 63,360 Square Feet
NET BUILDING AREA: 9,640 Square Feet ACTUAL AGE: 2006 LAND TO BUILDING RATIO: 6.57:1 EFFECTIVE AGE: 2006 COMMENTS: This is a good quality, Class C community shopping center. It is located on the east side of Santa Barbara Boulevard, north of Veterans Parkway.

Sales Comparison Approach to Value
89
INCOME AND EXPENSE ANALYSIS
The Potential Gross Rent is developed from an estimated market base rent of $26.00 per square foot and a Common Area Maintenance (CAM) charge of $7.16 per square foot. POTENTIAL GROSS INCOME: $319,662 VACANCY AND COLLECTION LOSS: $15,983 EFFECTIVE GROSS INCOME: $303,679 OPERATING EXPENSES: $73,577 NET OPERATING INCOME: $230,102 OVERALL RATE: 6.77% POTENTIAL GROSS INCOME MULTIPLIER: 10.63 EFFECTIVE GROSS INCOME MULTIPLIER: 11.19 OPERATING EXPENSE RATIO: 24.23% SALE PRICE PER SQUARE FOOT (GROSS): $316 SALE PRICE PER SQUARE FOOT (NET): $352

Sales Comparison Approach to Value
90
COMPARABLE IMPROVED SALE 7 126
DATE OF SALE: August 01, 2006 ADDRESS: 2311 Santa Barbara Boulevard SALE PRICE: $7,592,000 STRAP #: 25-44-23-C4-00930.0380 RECORDING: 2006000312271 UTILITIES: Full GRANTOR: Universal Investment Fund ZONING: C-1 GRANTEE: SB 1 Investment, LLC LAND USE: Commercial Professional FINANCING: Cash to Seller HIGHEST AND BEST USE: Commercial SALE HISTORY: None in Prior 3 Years VERIFICATION: Thomas Gunderson GROSS BUILDING AREA: 26,680 Square Feet
SITE AREA: 121,440 Square Feet
NET BUILDING AREA: 23,350 Square Feet ACTUAL AGE: 2004 LAND TO BUILDING RATIO: 5.20:1 EFFECTIVE AGE: 2 Years COMMENTS: The subject property is located on the east side of Santa Barbara Boulevard, north of Veterans Parkway in Cape Coral, Florida. This is a multi-tenant CBS retail center. It was in excellent condition at the time of sale.

Sales Comparison Approach to Value
91
INCOME AND EXPENSE ANALYSIS
Based on actual rents and CAM charges. POTENTIAL GROSS INCOME: $774,286 VACANCY AND COLLECTION LOSS: $38,714 EFFECTIVE GROSS INCOME: $735,572 OPERATING EXPENSES: $178,219 NET OPERATING INCOME: $557,353 OVERALL RATE: 7.34% POTENTIAL GROSS INCOME MULTIPLIER: 9.81 EFFECTIVE GROSS INCOME MULTIPLIER: 10.32 OPERATING EXPENSE RATIO: 24.23% SALE PRICE PER SQUARE FOOT (GROSS): $285 SALE PRICE PER SQUARE FOOT (NET): $325
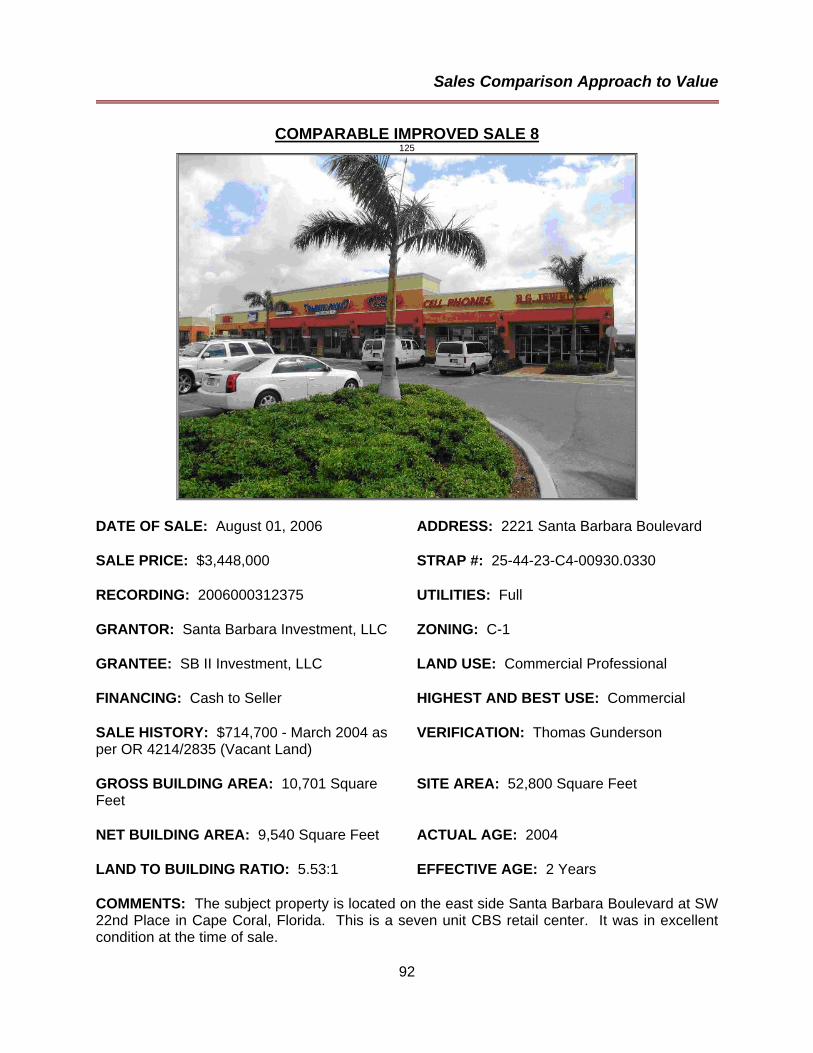
Sales Comparison Approach to Value
92
COMPARABLE IMPROVED SALE 8 125
DATE OF SALE: August 01, 2006 ADDRESS: 2221 Santa Barbara Boulevard SALE PRICE: $3,448,000 STRAP #: 25-44-23-C4-00930.0330 RECORDING: 2006000312375 UTILITIES: Full GRANTOR: Santa Barbara Investment, LLC ZONING: C-1 GRANTEE: SB II Investment, LLC LAND USE: Commercial Professional FINANCING: Cash to Seller HIGHEST AND BEST USE: Commercial SALE HISTORY: $714,700 - March 2004 as per OR 4214/2835 (Vacant Land)
VERIFICATION: Thomas Gunderson
GROSS BUILDING AREA: 10,701 Square Feet
SITE AREA: 52,800 Square Feet
NET BUILDING AREA: 9,540 Square Feet ACTUAL AGE: 2004 LAND TO BUILDING RATIO: 5.53:1 EFFECTIVE AGE: 2 Years COMMENTS: The subject property is located on the east side Santa Barbara Boulevard at SW 22nd Place in Cape Coral, Florida. This is a seven unit CBS retail center. It was in excellent condition at the time of sale.

Sales Comparison Approach to Value
93
INCOME AND EXPENSE ANALYSIS
Based on actual rents and CAM charges. POTENTIAL GROSS INCOME: $316,346 VACANCY AND COLLECTION LOSS: $15,817 EFFECTIVE GROSS INCOME: $300,529 OPERATING EXPENSES: $72,678 NET OPERATING INCOME: $227,851 OVERALL RATE: 6.61% POTENTIAL GROSS INCOME MULTIPLIER: 10.90 EFFECTIVE GROSS INCOME MULTIPLIER: 11.47 OPERATING EXPENSE RATIO: 24.18% SALE PRICE PER SQUARE FOOT (GROSS): $322 SALE PRICE PER SQUARE FOOT (NET): $361

Sales Comparison Approach to Value
94
ANALYSIS/DISCUSSION OF IMPROVED COMPARABLES: The preceding improved comparables are considered to be the most recent and similar available for comparison purposes. All of the comparables are closed transactions having occurred between August 2006 and August 2007. All of these comparables are considered to be good indicators of value for the subject property. All of the comparables are located within the Lee County marketplace and are considered to be likely alternatives for an investor if also considering the subject property. Application of the Sales Comparison Approach to Value: A typical purchaser of the subject property would be an investor seeking an income stream that is real estate oriented. As such, it is our opinion the sales contained in this analysis are considered to be the best and most current sales available for comparison purposes. In analyzing the subject property, we are utilizing the Potential Gross Income Multiplier (PGIM) Method, as well as the Price Per Square Foot Method. The following are these analyses. Estimation of Market Value via Potential Gross Income Multiplier (PGIM) Method: The Potential Gross Income Multiplier (PGIM) Method is most commonly used and is based on the proposition that an informed purchaser would pay no more for a property than the cost of obtaining a return on the same amount and embodying the same risk as that involved in the subject property. This method is most reliable when abundant sales and rental data are available, there are reasonable and consistent operating expenses, and properties sell with a sufficient frequency in the marketplace to produce a discernible PGIM pattern. The following are the PGIMs for the comparable improved sales:
Sale Number Sale Date
Cash Equal.
Sales Price ÷
Potential Gross
Income = PGIM
Operating Expense
Ratio
Net Income Ratio
Subject September-07
Sale 1 August-07 $4,600,000 ÷ $397,434 = 11.57 25.86% 74.14%
Sale 2 July-07 $10,500,000 ÷ $871,492 = 12.05 22.94% 77.06%
Sale 3 June-07 $2,000,000 ÷ $231,022 = 8.66 23.92% 76.08%
Sale 4 January-07 $2,450,000 ÷ $251,960 = 9.72 29.91% 70.09%
Sale 5 December-06 $2,650,000 ÷ $317,753 = 8.34 18.75% 81.25%
Sale 6 August-06 $3,397,000 ÷ $319,662 = 10.63 24.23% 75.77%
Sale 7 August-06 $7,592,000 ÷ $774,286 = 9.81 24.23% 75.77%
Sale 8 August-06 $3,448,000 ÷ $316,346 = 10.90 24.18% 75.82%

Sales Comparison Approach to Value
95
The preceding PGIMs range from a low of 8.34 for Comparable 5 to a high of 12.05 for Comparable 2. We are of the opinion a reasonable PGIM for the subject property is 9.50, which is supported by all of the comparables. As will be noted later in the Income Approach to Value, the subject’s potential gross income is estimated at $395,507 (including CAM). The prospective market value of the subject property Upon Stabilization, based on the Potential Gross Income Multiplier (PGIM) Method, can be illustrated as follows:
Potential Gross Income $ 395,507Times Estimated PGIM x 9.50Indicated Value $3,757,317Rounded to, Say $3,755,000
Estimation of Market Value via Price Per Square Foot Method: The comparable sales are also being analyzed via the Price Per Square Foot Method. In this methodology, each of the comparables are adjusted for location, quality of construction, and condition (age) in comparison to the subject property, if appropriate. The estimated value is then applied to the square footage of the subject property. A synopsis of the comparables, as well as their adjustments, can be shown as follows:

Sales Comparison Approach to Value
96
Sale Sale Sale Sale Sale Sale Sale Sale Subject 1 2 3 4 5 6 7 8 Sale Date September-07 August-07 July-07 June-07 January-07 December-06 August-06 August-06 August-06 Net Building Area Square Feet 13,166 16,992 44,037 10,501 13,600 9,568 9,640 23,350 9,540 Effective Age (Years) New New 10 - 15 5 5 - 6 New New New New Sales Price $4,600,000 $10,500,000 $2,000,000 $2,450,000 $2,650,000 $3,397,000 $7,592,000 $3,448,000 Sales Price per Square Foot $270.72 $238.44 $190.46 $180.15 $276.96 $352.39 $325.14 $361.43 Elapsed Time (Months) 0 2 3 8 9 13 13 13 Non-Physical Adjustments Property Rights $0 $0 $0 $0 $0 $0 $0 $0 Financing $0 $0 $0 $0 $0 $0 $0 $0 Conditions of Sale $0 $0 $0 $0 $0 $0 $0 $0 Cash Equal. Sales Price $4,600,000 $10,500,000 $2,000,000 $2,450,000 $2,650,000 $3,397,000 $7,592,000 $3,448,000 Add Time (Adjusted Monthly/Location) $0 $0 $0 $0 $0 $0 $0 $0 Time Adjusted Sales Price $4,600,000 $10,500,000 $2,000,000 $2,450,000 $2,650,000 $3,397,000 $7,592,000 $3,448,000 Divided by Building Area 16,992 44,037 10,501 13,600 9,568 9,640 23,350 9,540 Value P.S.F. of Improvement Area $270.72 $238.44 $190.46 $180.15 $276.96 $352.39 $325.14 $361.43 Physical Adjustments Location Inferior Inferior Inferior Inferior Inferior Similar Similar Similar Quality Similar Similar Inferior Inferior Similar Similar Similar Similar Condition (Age) Similar Inferior Inferior Inferior Similar Similar Similar Similar Net Adjustment Inferior Inferior Inferior Inferior Inferior Similar Similar Similar
Sales Comparison Approach to Value
97
Prior to any adjustments, the comparable sales have prices ranging from a low of $190.46 per square foot for Comparable Sale 3 to a high of $361.43 per square foot for Comparable Sale 8. After taking into account non-physical adjustments for property rights, financing, conditions of sale, and market advancement (time), the comparables sales have the same range of value as before the non-physical adjustments are considered. It is our opinion no market advancement (time) should be applied to any of the comparables at this time due to the leveling trend in the market place. In terms of physical adjustments, the Relative Comparison Analysis is considered. This analysis considers qualitative adjustments rather than quantitative adjustments. The Relative Comparison Analysis analyzes comparables properties in terms of inferiority, superiority, or similarity to the subject property. These adjustments are not expressed as a dollar or percentage adjustment. In this portion of the analysis, we are analyzing the comparables in terms of location, quality, and condition (age). In our opinion, Comparable Sales 1 through 5 are inferior to the subject in terms of location and therefore are adjusted upward. Comparable Sales 6 through 8 are similar and therefore require no adjustment in this category. In terms of quality, all of the comparables are similar with the exception of Comparable Sales 3 and 4. These sales are considered inferior and are adjusted upwards in this category. In terms of condition (age), all of the comparable sales are similar except for Comparable Sales 2, 3 and 4, which are inferior and are adjusted upwards in this category. After consideration of all of the sales and considering the analysis of same, it is our opinion a reasonable price per square foot for the subject property is $290.00 per square foot of enclosed area. Accordingly, the prospective market value of the subject property Upon Stabilization, based on the Price Per Square Foot Method, can be illustrated as follows:
Subject’s Net Building Square Footage 13,166 Times Estimated Value P.S.F. x $290.00 Indicated Value $3,818,140 Rounded to, Say $3,820,000
RECONCILIATION OF THE SALES COMPARISON APPROACH TO VALUE: The Sales Comparison Approach to Value has utilized two methods of valuation: the Sale Price Per Square Foot Method and the Potential Gross Income Multiplier (PGIM) Method. The Potential Gross Income Multiplier (PGIM) Method indicates a prospective market value of $3,755,000 for the subject property. The Sale Price Per Square Foot Method indicates a prospective market value of $3,820,000 for the subject property. Strongest weight is placed on the Potential Gross Income Multiplier as a typical purchaser of a property similar to the subject is interested in an income stream and therefore most weight is placed on this approach. Accordingly, we estimate a reasonable prospective market value for the subject property Upon Stabilization, via the Sales Comparison Approach to Value, to be $3,755,000.

98

Income Approach to Value
99
INCOME APPROACH TO VALUE

Income Approach to Value
100
THE INCOME APPROACH TO VALUE: The Income Approach to Value is based on the premise that an investor who purchases income producing real estate is trading a sum of present dollars for the right to receive future dollars. Income producing property is typically purchased for investment purposes, and the projected net income stream is the critical factor affecting its market value. The Income Approach is also greatly affected by the principle of anticipation. This is reflected in the definition of value which states that the value is the present worth of all rights to future benefits. Therefore, the projected income stream is of extreme importance when estimating a property's value. The appraiser must consider both quality and quantity of the income stream as it relates to value. Many factors can affect net income, including supply and demand, changes in land use, or traffic patterns. External forces such as a rise in interest rates or social changes may also have an affect on value. The valuation of a property utilizing the Income Approach consists of the following procedure:
• Estimate Gross Income either by contract rent or comparison to similar properties (market rent).
• Estimate an appropriate vacancy and collection loss. • Estimate expenses which consist of three categories: fixed (expenses not
affected by occupancy), variable (expenses affected by occupancy), and reserves for replacement.
• Subtract expenses from effective gross income to arrive at net operating
income. • By use of the proper capitalization technique, convert net income into value.
Since the purpose of this approach is to estimate the subject’s market value based on a fee simple analysis, market rent is being estimated in this situation. According to The Dictionary of Real Estate Appraisal, Fourth Edition (Page 176), the definition of market rent is as follows:
The most probable rent that a property should bring in a competitive and open market reflecting all conditions and restrictions of the specified lease agreement including term, rental adjustment and revaluation, permitted uses, use restrictions, and expense obligations; the lessee and lessor each acting prudently and knowledgeably, and assuming consummation of a lease contract as of a specified date and the passing of the leasehold from lessor to lessee under conditions whereby: 1. Lessee and lessor are typically motivated.; 2. Both parties are well informed or well advised, and acting on what they consider their best interests.; 3. A reasonable time is allowed for exposure in the open market.; 4. The rent payment is made in terms of cash in U.S. dollars, and is expressed as an amount per time period consistent with the payment schedule of the lease contract.; 5. The rental amount represents the normal consideration for the property leased unaffected by special fees or concessions granted by anyone associated with the transaction.

Income Approach to Value
101
Within this analysis, we are utilizing comparable rental properties located within the subject's general market area that a typical tenant seeking retail/office space would consider as a likely alternative. The following is this analysis.

Income Approach to Value
102
COMPARABLE RENTALS MAP

Income Approach to Value
103
COMPARABLE RENTAL 1 67
ADDRESS: 2209 - 2311 Santa Barbara Boulevard Cape Coral FL BUILDING AREA: 42,530 Square Feet MINIMUM UNIT SIZE: 1,340 Square Feet MAXIMUM UNIT SIZE: 9,420 Square Feet MINIMUM RENTAL RATE: $23.00 Per Square Foot MAXIMUM RENTAL RATE: $26.00 Per Square Foot CAM CHARGES: $7.16 Per Square Foot TERMS: Minimum 5 Years with 4% Annual Increases, Net COMMENTS: All leases are reported to be absolute net with a CAM pass through for real estate taxes, insurance, maintenance, utilities, and management. This community center has a right-in/right-out access from Santa Barbara Boulevard as well as rear access.

Income Approach to Value
104
COMPARABLE RENTAL 2 274
ADDRESS: 230 Santa Barbara Boulevard Cape Coral FL BUILDING AREA: 31,106 Square Feet MINIMUM UNIT SIZE: 1,502 Square Feet MAXIMUM UNIT SIZE: 1,865 Square Feet MINIMUM RENTAL RATE: $20.00 Per Square Foot MAXIMUM RENTAL RATE: $20.00 Per Square Foot CAM CHARGES: Expenses are passed through to the tenant via an determined CAM TERMS: Multi-year, net COMMENTS: This is a proposed center. It is to be located on the southwest corner of Santa Barbara Boulevard and Mid Cape Terrace, approximately 2,000' south of Pine Island Road. Available occupancy is scheduled for January 2009.

Income Approach to Value
105
COMPARABLE RENTAL 3 195
ADDRESS: 1327 N.E. Pine Island Road Cape Coral FL BUILDING AREA: 11,290 Square Feet MINIMUM UNIT SIZE: 1,000 Square Feet MAXIMUM UNIT SIZE: 3,000 Square Feet MINIMUM RENTAL RATE: $24.00 Per Square Foot MAXIMUM RENTAL RATE: $24.00 Per Square Foot CAM CHARGES: Expenses passed through via an undisclosed CAM TERMS: , COMMENTS: This is a CBS neighborhood shopping center that is 'anchored" by a Mel's Diner restaurant. It is located on the north side of Pine Island Road with adequate access.

Income Approach to Value
106
COMPARABLE RENTAL 4 65
ADDRESS: 728 Pine Island Road Cape Coral FL BUILDING AREA: 21,400 Square Feet MINIMUM UNIT SIZE: 1,200 Square Feet MAXIMUM UNIT SIZE: 6,850 Square Feet MINIMUM RENTAL RATE: $18.00 Per Square Foot MAXIMUM RENTAL RATE: $28.00 Per Square Foot CAM CHARGES: $4.50 Per Square Foot TERMS: Multi-Year, with 4% Annual Increases, Triple Net Lease COMMENTS: This retail/office center currently has three (3) restaurants occupying 6,000 square feet. It is a new center with good access from Pine Island Road. Units are being offered as Vanilla Shells. Absorption has been approximately 950 square feet per month.

Income Approach to Value
107
COMPARABLE RENTAL 5 64
ADDRESS: 814 Pine Island Road Cape Coral FL BUILDING AREA: 40,150 Square Feet MINIMUM UNIT SIZE: 627 Square Feet MAXIMUM UNIT SIZE: 4,892 Square Feet MINIMUM RENTAL RATE: $22.00 Per Square Foot MAXIMUM RENTAL RATE: $30.00 Per Square Foot CAM CHARGES: $4.50 Per Square Foot TERMS: Multi-Year with 5% Annual Increases, COMMENTS: This neighborhood center has recently been completed. It is accessed from Skyline Boulevard and S.W. 4th Street. Rent on Skyline Boulevard is $26.00 to $30.00 per square foot. Rent off the road is $22.00 per square foot. The annual rent adjustment is 5%. The CAM is for real estate taxes, insurance, maintenance, utilities and management. The units are rented as "vanilla shells". Absorption has been at approximately 1,250 square feet per month.

Income Approach to Value
108
COMPARABLE RENTAL 6 66
ADDRESS: 1101 Pine Island Road Cape Coral FL BUILDING AREA: 81,708 Square Feet MINIMUM UNIT SIZE: 1,500 Square Feet MAXIMUM UNIT SIZE: 2,536 Square Feet MINIMUM RENTAL RATE: $23.00 Per Square Foot MAXIMUM RENTAL RATE: $25.00 Per Square Foot CAM CHARGES: $4.50 Per Square Foot TERMS: Multi-Year, with 4% Annual Increases, Net COMMENTS: This is a proposed retail/office center. It is expected to be completed in the January/February 2008. Currently 4,000 square feet is lease. This indicates an absorption of approximately 350 square feet per month. This absorption should increase once the center nears completion and/or completed. It is located on the north side of Pine Island Road, just west of Skyline Boulevard.

Income Approach to Value
109
ANALYSIS/DISCUSSION OF COMPARABLE RENTALS: In estimating the market rent for the subject property, we have utilized competitive properties in this local marketplace that a typical tenant would consider if also considering the subject property. The base rental rates of the comparable properties range from a low of $18.00 per square foot, to $30.00 per square foot on a net basis. Two of the comparables are proposed projects as where the balance of the comparables are existing. Comparable Rental 1 is immediately south of the subject and is comprised of three separate buildings. The most recent rental occurred in this building at $23.00 per square foot. A summary of the comparable rentals is illustrated as follows:
Rental Number
Building Area Base Rent Range
Net w/CAM or Gross
1 42,530 $23.00 $26.00 Net - CAM $7.16 2 31,106 $20.00 $20.00 Net - CAM Not disclosed 3 11,290 $24.00 $24.00 Net - CAM Not disclosed 4 21,400 $18.00 $28.00 Net - CAM $4.50 5 40,150 $22.00 $30.00 Net - CAM $4.50 6 81,708 $23.00 $25.00 Net - CAM $4.50
Notes 1 - CAM is only for the $18.00 psf rent, the $24.00 psf rent is gross 2 - This rental comparable is leased on a full service bases, including janitorial and electric
It is our opinion, taking into account the comparable rentals found within this immediate market area, the general design, location, and access of the subject property, the estimated market rental rate for the subject property is $20.00 - $25.00 or say $23.00 per square foot on a net basis. As such, various expenses associated with this property would be passed through to the tenant via a Common Area Maintenance (CAM) charge. This rental rate will be factored into the forthcoming analysis.
Income Approach to Value
110
VACANCY/COLLECTION LOSS: Upon Stabilization:
This commercial submarket within the overall market area of the subject property appears to be very strong in terms of occupancy levels for retail/office space. The energy associated with this area is due in part to Veterans Parkway but also to the Target/Publix center as well as the nearby Lowe's Home Center. We are aware of higher vacancy levels in other areas of Cape Coral and Lee County, which is due in part to the oversupply of housing in this general market area. It has been reported there is upward to 24 months of oversupply of housing in this general marketplace. However, again, we observed strong occupancy levels within this immediate market area, which appears to be poised to accept more retail/office space. We are of the opinion a vacancy and collection of the subject property upon stabilization would be 5%. Upon Completion:
In the forthcoming Discounted Cash Flow (DCF) model, in estimating the perspective market value of the subject property Upon Completion, we are assuming only a portion of the building will be pre-leased. In our efforts to prepare the rental study for this project, we interviewed a wide variety of brokers, property managers, and market participants as well as reviewed other similar type properties in the market place and have concluded there will be approximately a 1/3 of the building will be pre-leased. After the time of completion, the balance of the space should be leased within 6 months. For the purposes of the forthcoming DCF model, we will assume approximately 2-3 units or 1/3 of the building will be pre-leased prior to completion. In addition, we estimate the balance of the building will be fully leased within 6 months after completion or by 1 November 2008. Year 1 within the holding period in the DCF model will reflect a vacancy and collection loss of 33%. Year 2, and thereafter, the model will reflect a 5% vacancy and collection loss.

Income Approach to Value
111
ANALYSIS OF EXPENSES: We were either provided or estimated the operating expenses associated with the subject property. The analysis of expenses can be divided into three categories: fixed, variable, and reserves for replacement. This analysis appears as follows: Fixed Expenses: Fixed expenses are expenses that do not normally vary with occupancy.
Real Estate Taxes: Since the subject property is proposed, we have estimated the ad valorem real estate tax obligation for this property. We estimate a reasonable tax obligation for the subject property to be $44,800 per year. Insurance: The annual insurance premium for the subject property was not provided. We estimate a reasonable insurance premium for the subject building to be $23,000.
Variable Expenses: Variable expenses are those expenses which vary with occupancy. These categories would include management, maintenance/repairs, and other miscellaneous expenses.
Management: Management expense typically includes collection of rents, payment of expenses, and dealing with tenant concerns. Locally, management is based on an applied percent of the base rent collected. Typically, local management fees are based on approximately 4% of the base rent, which is applied in the forthcoming analysis. General Maintenance: Typically, general maintenance includes exterior maintenance such as lawn care, general cleanup, exterior pest control, and nominal interior repairs. It has been estimated the general maintenance on the building is $7,500 per year. Utilities: Within this analysis, we are factoring in a common area electric charge of $2,400 per year.
Reserves for Replacement: Reserves for replacement allow for the replacement of short-lived components that normally wear out more quickly than the main structure. This allowance will be made based on a percentage of the Effective Gross Income. In terms of the subject property it is our opinion because it will be new, a smaller percentage of Effective Gross Income should be set aside for reserves. For this analysis, we will assume 1% of the Effective Gross Income will be set aside for reserves for replacement. In the DCF model the reserves will change over time because of the Effective Gross Income will also change during the holding period. On the following page is the estimated net operating income for the subject property.

Income Approach to Value
112
NET OPERATING INCOME SUMMATION Base Rent Retail/Office 13,166 Sq. Ft. @ $23.00 = $302,818Plus CAM 13,166 Sq. Ft. @ $7.04 = $92,689 Less Vacancy and Collection @ 5.00% -$19,775 Effective Gross Income $375,731 Less Operating Expenses Fixed Expenses Real Estate Taxes $44,800 Insurance $23,000 Total Fixed Expenses $67,800 Variable Expenses Management at 4.00% $15,029 Maintenance $7,500 Utilities $2,400 Total Variable Expenses $24,929 Reserves for Replacement $3,757 Less Total Expenses -$96,486 Net Operating Income $279,245

Income Approach to Value
113
OVERALL RATE SELECTION/VALUATION - UPON STABILIZATION: Selection of the capitalization rate is one of the most critical steps in the Income Approach to Value. Selecting the proper rate must be done carefully. A difference of only 1% can change the value indication thousands of dollars. We are utilizing several methodologies in order to estimate the subject’s overall rate. One of the methods we will utilize is the Direct Capitalization Method, whereby the comparable market sales used in the Sales Comparison Approach to Value will be analyzed to determine the overall rate. This method is most basic, direct, and easily understood of all of the methods. The formula for this method:
Net Operating Income = Value Estimate Overall Rate
This method is based solely on market evidence, in this case on the comparable improved sales found in the Sales Comparison Approach to Value. The following grid will show the indicated overall rates for the comparable improved sales:
SALE 1 SALE 2 SALE 3 SALE 4 SALE 5 SALE 6 SALE 7 SALE 8
Sale Date August-07 July-07 June-07 January-07 December-
06 August-06 August-06 August-06
Net Income $279,929 $651,459 $166,966 $167,772 $245,273 $230,102 $557,353 $227,851
Sales Price $4,600,000 $10,500,000 $2,000,000 $2,450,000 $2,650,000 $3,397,000 $7,592,000 $3,448,000
= Overall Rate 0.0609 0.0620 0.0835 0.0685 0.0926 0.0677 0.0734 0.0661 Within this methodology, the overall rates for the comparables range from a low of .0609 for Comparable Sale 1 to a high of .0926 for Comparable Sale 5. With the exclusion of Comparable 5, the high end of this array is .0835 for Comparable Sale 3. We are of the opinion, a reasonable overall capitalization rate is .0750, which is supported by these comparables. We have also referred to the Korpacz Real Estate Investor Survey, 3rd Quarter 2007, published by PriceWaterhouseCoopers. The National Net Lease Market indicates an overall capitalization rate range of 6.00% to 10.00% with an average of 7.54%. It is our opinion, stronger weight should be placed on the overall rate as developed directly from the local marketplace. Accordingly, we estimate a reasonable overall capitalization rate for the subject property to be .0750. Therefore, we estimate the prospective market value of the subject property Upon Stabilization, via the Income Approach to Value, to be as follows:
Net Operating Income = Value or $279,245 = $3,723,267 Overall Rate .0750 Rounded to, Say $3,725,000

114

Estimation of Prospective Market Value - Upon Completion
115
ESTIMATION OF PROSPECTIVE MARKET VALUE - UPON COMPLETION

Estimation of Prospective Market Value - Upon Completion
116
ESTIMATION OF PROSPECTIVE MARKET VALUE - UPON COMPLETION: In addition to the analysis of the subject property in terms of an estimated prospective market value Upon Stabilization, we are also estimating the prospective market value of the subject property Upon Completion. In the preceding Income Approach to Value, we discussed occupancy levels both in terms of a stabilized basis as well as the anticipated pre-leasing and lease up time frame after completion of construction. It is our opinion little rental activity will occur on this property until it is almost completed. At that time, we anticipate that approximately one-third of the units will be pre-leased. After completion we anticipate the balance of the units to be leased with 6 months. Accordingly, we anticipate a vacancy and collection loss associated with the first year of the DCF Model to be 33%. In years two and beyond, we anticipate stabilized vacancy and collection at 5.0%. In order to analyze the subject property in terms of a prospective market value Upon Completion, we are utilizing a Five Year Discounted Cash Flow (DCF) Analysis, which takes into account the estimated vacancy and collection loss that is projected for the proposed subject improvements after completion. In addition, the Five Year Discounted Cash Flow (DCF) Model reflects anticipated increases in rent levels, as well as expenses along with typical investor thinking for an income producing type property. Discounted Cash Flow (DCF) Method: Income producing properties are typically purchased for investment purposes and from an investor's point of view. Therefore, value is created by the expectation of benefits to be derived in the future. Value can be defined as a present worth of all future benefits. Income capitalization methods and techniques all represent attempts to quantify these expected future benefits. In the simplest format, capitalization involves dividing one year's net operating income by an estimated overall capitalization rate. An additional method would be to analyze the anticipated changes in both income and expenses. In our opinion, a Discounted Cash Flow (DCF) Method is appropriate since the income stream of the subject property is likely to change over time. As a result, a Discounted Cash Flow (DCF) Method is generally utilized in sophisticated investment properties where purchasers of these types of properties generally think in these terms. A prospective purchaser of the subject property is most interested in the potential income of the property and the prospects for increases over a typical holding period, which in this case is estimated to be five (5) years. At the end of the holding period, the investor would possibly sell the property to another investor. The Discounted Cash Flow (DCF) Method best represents the investment conditions of the subject property by virtue of its rental income, as well as being applicable to the aforementioned value definitions. In the forthcoming Discounted Cash Flow (DCF) Model, the anticipated income streams over the next five years are shown. Although a Five Year Discounted Cash Flow (DCF) Method is utilized, the sixth year net operating income is also calculated in the model, as an investor will capitalize the anticipated income stream over that next year. The Discounted Cash Flow Model requires that the estimated net operating income for each of the next five years be discounted back to present value. The net operating income takes into account the rental income, the CAM charges collected and various expenses associated with this property. The Net Operating Income for each year is then discounted back with an appropriate discount rate. The discounted values of each year are added together to calculate the discounted cash flow of the income stream. This figure is then added to the discounted value of the anticipated reversion. This is the capitalization of the sixth year net operating income, less sales expenses, with the terminal capitalization rate to indicate the estimated value of the subject property. We are of the opinion a reasonable sale expense

Estimation of Prospective Market Value - Upon Completion
117
associated with this property is 2.5%. The terminal capitalization rate is typically 1/4% to 1% higher to represent additional risk of maintaining an income stream over that period of time. However, it is possible that the terminal rate can be lower if expectations of improvement are strong. In this situation, we estimate the terminal capitalization rate to be 1% higher than the capitalization rate observed in the marketplace. This is due to the risk associated with the anticipation of interest rates increasing during this holding period. Estimate of Discount Rate:
The applicable discount rate utilized in this appraisal is 9.75%. Currently, investors can yield 2% to 4% with little or no risk via CD's, money market funds and zero coupon bonds. Conversely, high risk investments such as real estate or oil and gas, might anticipate a return in excess of 25% to 30%. The discount rate can be derived by using the Band of Investment Method. If one utilizes a 8.50% interest rate, a loan to value ratio of 80%, with a 15% return on capital, a 9.75% discount rate appears reasonable. In addition to the Band of Investment Method, we also relied upon the Korpacz Real Estate Investor Survey, 3rd Quarter 2007, as published by PriceWaterhouseCoopers. Within this publication, under the National Net Lease Market, the discount rate range is from 8.00% to 12.00% with an average of 10.35%. It is our opinion, a reasonable discount rate for the subject property is 9.75%, and is supported by the above referenced national survey. The 9.75% discount rate will be utilized in the forthcoming Discounted Cash Flow (DCF) Model. In the following Discounted Cash Flow (DCF) Model, we are estimating the prospective market value of the subject property Upon Completion. The subject property is currently proposed. As previously noted, we are of the opinion there will be some leasing activity on this property prior to completion and this most likely will occur towards the end of construction. Furthermore, we have estimated it will take approximately 6 months for this property to be fully leased after completion. We are estimating approximately one-third of the facility will be pre-leased. After the structure is completed, leasing activity should continue on with units being absorbed into the market on a monthly or quarterly basis. For the purposes of the DCF Model we will factor a 33% vacancy and collection loss in Year 1. After that time frame it is anticipated it will be fully stabilized with a 5.0% vacancy and collection loss. The forthcoming DCF Model illustrates a five year holding period. It is anticipated a typical investor would sell this property at the end of that timeframe. The income stream for Years 1 through 5 are then discounted to present value based at the estimated discount rate of 9.75%. Then, the estimated net operating income of Year 6 is capitalized at the terminal capitalization rate of 8.50%. Deducted from this future value is an anticipated sales expense of 2.5%. The future value less sales expense is then discounted back five years to estimate the present value of the reversion or sale of this property at the beginning of the sixth year. The present worth of the income stream plus the present value of the reversion, after sales expenses and are deducted, indicates the prospective market value of the subject property Upon Completion. Given the conditions of this analysis, including the projected increases to the rental rates and expenses, as well as the estimated discount rate and terminal capitalization rate, the Discounted Cash Flow (DCF) Model for the subject property can be illustrated on the following page.

Estimation of Prospective Market Value - Upon Completion
118
DISCOUNTED CASH FLOW MODEL - PROSPECTIVE MARKET VALUE UPON COMPLETION
YEAR 1 YEAR 2 YEAR 3 YEAR 4 YEAR 5 YEAR 6 Gross Income Rental Income Retail/Office $302,818 $311,903 $321,260 $330,897 $340,824 $351,049 Plus CAM $85,775 $92,561 $96,043 $99,658 $103,410 $107,306 Potential Gross Income $388,593 $404,464 $417,303 $430,555 $444,234 $458,355 Less Vacancy and Collection at 33.33% 5.00% 5.00% 5.00% 5.00% 5.00% equals -$129,530 -$20,223 -$20,865 -$21,528 -$22,212 -$22,918 Effective Gross Income $259,063 $384,240 $396,438 $409,027 $422,023 $435,437 Less Operating Expenses FIXED EXPENSES Real Estate Tax -$44,800 -$46,592 -$48,456 -$50,394 -$52,410 -$54,506 Insurance -$23,000 -$23,920 -$24,877 -$25,872 -$26,907 -$27,983 VARIABLE EXPENSES Management -$8,075 -$11,852 -$12,208 -$12,574 -$12,951 -$13,340 Maintenance -$7,500 -$7,725 -$7,957 -$8,195 -$8,441 -$8,695 Utilities (common area) -$2,400 -$2,472 -$2,546 -$2,623 -$2,701 -$2,782 Reserves -$2,591 -$3,842 -$3,964 -$4,090 -$4,220 -$4,354 Net Operating Income $170,697 $287,837 $296,430 $305,280 $314,393 $323,777 Equals Present Value at
9.75% $155,533 $238,967 $224,238 $210,416 $197,447 Present Value of the Income Stream $1,026,601 Variables: Year 6th NOI: $323,777 Present Value of the Reversion $2,332,434 Terminal Cap Rate: 8.50% Total (Income Stream plus Reversion) $3,359,036 Future Sales Expense: 2.50% Estimated Market Value $3,359,036 Rounded to, say $3,360,000

Insurable Value
119
INSURABLE VALUE

Insurable Value
120
ESTIMATION OF INSURABLE VALUE: The purpose of this section of this assignment is to estimate the insurable value of the proposed subject improvements. The insurable value is being estimated via the Cost Approach to Value. For this assignment, insurable value is defined as full replacement cost new. In addition, as per The Dictionary of Real Estate Appraisal, Fourth Edition (Page 147), the definition of insurable value is:
1. The value of an asset or asset group that is covered by an insurance policy; can be
estimated by deducting cost of non-insurable items (e.g. land value) for market value.
2. The value used by insurance companies as a basis for insurance. This value is often considered to be replacement or reproduction cost plus allowances for debris removal or demolition less deterioration or non-insurable items. It is sometimes cash value or market value, but often entirely a cost concept. (Marshall & Swift LP)
For purposes of this analysis, we will estimate the replacement cost new of the improvements. This value does not include: any depreciation or obsolescence; site improvements; impact fees; architectural and site engineering fees; land value; rent/income loss that may be incurred by the property owner during reconstruction; landscaping; or any equipment associated with the property. Utilizing the developer’s cost, as previously illustrated in this report, in conjunction with the aforementioned insurable value definition, we estimate the insurable value as follows: Reproduction Cost $2,213,682 Plus Debris Removal $ 58,663 Replacement Value $2,272,345Less Depreciation $ 0Cash Value $2,272,345Excluded Value Architectural (1) $1 29,400 City of Cape Coral Impact Fees (1) $ 95,000 Civil Engineer (1) $ 73,300 Road widening fees to the City of Cape Coral (1) $ 40,250 Landscaping (1) $ 18,500 Foundation $ 68,624 Subtotal -$ 425,074Indicated value $1,847,270Rounded to, say $1,850,000 Note 1 - As supplied by developer

Reconciliation of Value Estimates
121
RECONCILIATION OF VALUE ESTIMATES: “As Is” Value: $1,220,000 Prospective Market Value Upon Stabilization: Cost Approach to Value: $3,745.000 Sales Comparison Approach to Value: $3,755,000 Income Approach to Value: $3,725,000 Prospective Market Value Upon Completion: $3,360,000 Insurable Value $1,850,000
The above estimates are based on differing approaches, which are indications in each situation. In order to estimate the “As Is” (land only) value of the subject property we utilized the sales comparison approach, incorporated into the Cost Approach to Value. In terms of the comparable land sales, we considered a variety of adjustments, both non-physical as well as physical. In the final analysis, we are of the opinion the “As-Is” market value of the subject property (land only), as of 18 September 2007, is $1,220,000. In order to estimate the Perspective Market Value Upon Stabilization, we employed all three traditional approaches to value, Cost, Sales Comparison and Income. Within the Cost Approach to Value, we were supplied the Developer’s Cost Estimate. In addition, the Marshall Valuation Service, a nationally recognized cost service, was utilized in estimating the cost new of the proposed improvements. These two costs are within less than 1% of each other; therefore, we utilized the developer’s cost within this approach. In the final analysis, weight is placed on the Cost Approach to Value, as the subject property is proposed. Within the Sales Comparison Approach to Value, we utilized a variety of comparable retail/office facilities that recently sold in the Lee County marketplace. These comparables were analyzed via a Potential Gross Income Multiplier (PGIM) Method as well as a Price Per Square Foot Method. Strongest weight is placed on the Potential Gross Income Multiplier (PGIM) Method. As a purchaser of the subject property is interest in the income that can be generated by a property similar to the subject. Since all of these comparables have many similar likenesses to the subject and have recent sales dates, strong weight is also placed on this approach to value. As the subject property is an income producing type property, weight is also given to the Income Approach to Value. Within this analysis, we estimated the market rent of the subject property based on comparable rental properties that are considered to be likely alternatives for a prospective tenant. Within this analysis, we not only estimated the market rent, but also various expenses that are associated with the ownership of this property. Furthermore, after estimating the net operating income, we estimated an overall capitalization rate via several methodologies. After estimating a reasonable overall capitalization rate for the subject property, we applied it to the net operating income to estimate the prospective market value of the subject property Upon Stabilization. Since the subject property lends itself to be an investor type property, strong weight is also placed on this approach to value.

Reconciliation of Value Estimates
122
As the subject property lends itself to primarily be an investor type property, strongest weight is placed on the Income Approach to Value, which is well supported by the other two approaches in estimating the prospective market value of the subject property Upon Stabilization. Accordingly, we estimate the prospective market value of the subject property Upon Stabilization, as of 1 November 2008, the estimated date of stabilization, to be $3,725,000. We have also estimated the prospective market value of the subject property Upon Completion of the proposed subject improvements. We employed the Five Year Discounted Cash Flow (DCF) Model in this analysis in order to reflect the anticipated vacancy in the first year. In the Rental Study, for properties competing with the proposed subject improvements, there is a relatively low vacancy in this marketplace. It is anticipated, the subject property will have some pre-leasing associated with it, estimated to be approximately 1/3 prior to completion of construction. The balance of the space is anticipated to require upwards to 6 months after completion to be fully leased. The Discounted Cash Flow (DCF) Model reflects this anticipated vacancy as well as increases to rental rates and expenses over a holding period of five years. The income streams for each year are then discounted at a reasonable discount rate, which are added to the anticipated reversion value to reflect a prospective market value of the subject property Upon Completion. In the final analysis, we are of the opinion the prospective market value of the subject property Upon Completion, as of 1 May 2008, the estimated date of completion, is to be $3,360,000. We have also estimated the Insurable Value of the proposed improvements. This value is based on the building improvements only, which includes demolition and debris removal but excludes various things such as depreciation or obsolescence, site improvements, impact fees, architectural and site engineering fees, land value, foundation and rent/income loss that may be incurred by the property owner during reconstruction as well as any equipment. To develop this estimated value, we relied upon the Cost Approach in estimating the reproduction cost new as supplied by the developer as well as various cost estimates as supplied by Marshall Valuation Service, a nationally recognized cost service. In the final conclusion, we are of the opinion a reasonable insurable value for the subject property is $1,850,000.

Certificate of Appraisal
123
CERTIFICATE OF APPRAISAL We certify that, to the best of our knowledge and belief:
-The statements of fact contained in this report are true and correct.
-The reported analyses, opinions, and conclusions are limited only by the reported assumptions and limiting conditions, and are our personal unbiased professional analyses, opinions, and conclusion.
-We have no present or prospective interest in the property that is the subject of this report, and we have no personal interest or bias with respect to the parties involved.
-We have no bias with respect to the property that is the subject of this report or to the parties involved with this assignment.
-Our engagement in this assignment was not contingent upon developing or reporting predetermined results.
-Our compensation is not contingent upon the development or reporting of a predetermined value or direction in value that favors the cause of the client, the amount of the value opinion, the attainment of a stipulated result, or the occurrence of a subsequent event directly related to the intended use of this appraisal.
-Our analyses, opinions, and conclusions were developed, and this report has been prepared, in conformity with the Uniform Standards of Professional Appraisal Practice. This appraisal assignment was not made nor was the appraisal rendered on the basis of a requested minimum valuation, specific valuation, or an amount which would result in approval of a loan.
-We certify that the use of this report is subject to the requirements of the Appraisal Institute relating to review by its duly authorized representatives.
-As of the date of this report, Gerald A. Hendry, MAI, CCIM, has completed the requirements of the continuing education program of the Appraisal Institute.
-As of the date of this report, Timothy D. Rieckhoff and Gerald A. Hendry, MAI, CCIM have completed the requirements of the continuing education program for the State of Florida's Certified General Appraiser's Certification. Furthermore, Gerald A. Hendry, MAI, CCIM, has completed the requirements of the continuing education program of the Appraisal Institute.-Timothy D. Rieckhoff, Associate Appraiser has made a personal inspection of the property that is the subject of this report. Mr. Gerald A. Hendry, MAI, CCIM has subsequently made a personal inspection of the property that is the subject of this report.
-No one provided significant professional assistance to the person signing this report.
Certificate of Appraisal
124
In addition to the standard Assumptions and Limiting Conditions contained in this report this appraisal has a Hypothetical Condition and several Extraordinary Assumptions associated with it. The Hypothetical Condition associated with this appraisal is as follows: Hypothetical Conditions:
• For the purpose of this analysis it is assumed the proposed improvements exist in the estimation of the prospective Upon Stabilized and Upon Completion values.
Extraordinary Assumptions:
In addition, there are several Extraordinary Assumptions associated with this appraisal are as follows:
• Completion of the proposed facility as illustrated on the architectural and
engineering plans that were provided. The construction plans were prepared by:
International Architecture Division of Archimetrics, Inc. 1415 Dean Street Suite 116 Fort Myers, Florida 33901 Telephone number – 1-239-476-8822 Dated - 9 April 2007 (latest revision dated 10 May 2007) The site plan was prepared by: Source, Inc. Engineers - Planners 1334 Lafayette Street Cape Coral, Florida Telephone number – 1-239-549-2345 Dated 21 August 2006
• The values, Upon Completion and Upon Stabilization are prospective future
values. These prospective future values are based on current market evidence and trends. We assume there will be no significant changes to take place in the market prior to these future dates.
• A portion of this assignment involves estimating insurable value, in terms of
the property owner’s building insurance responsibility. This insurable value is based on the building improvements only. This insurable value does not include: any depreciation or obsolescence; site improvements; architectural and site engineering fees; impact fees; land values; foundation or rent/income loss that may be incurred by the property owner during reconstruction; or equipment. This is assumed to be the typical methodology of the insurance industry to develop insurance value and this assignment is subject to same.
Certificate of Appraisal
125
• The insurance companies in the State of Florida are currently experiencing
changes in the industry including high premium increases and non-renewals due to the recent hurricanes. We assume insurance would be available for the subject. This assignment is subject to same.
If any of these assumptions are found to be false, it could alter our opinions or conclusions. By reason of our investigation and analysis, data contained in this report, and our experience in the real estate appraisal business, it is our opinion the “As Is” (land only) market value of the subject property, as of 18 September 2007, is as follows: ONE MILLION TWO HUNDRED TWENTY THOUSAND DOLLARS ...................($1,220,000.00) In addition, it is our opinion the prospective market value of the subject property Upon Completion, as of 1 May 2008, the anticipated date of completion, is expected to be as follows: THREE MILLION THREE HUNDRED SIXTY THOUSAND DOLLARS................($3,360,000.00) In addition, it is our opinion the prospective market value of the subject property Upon Stabilization, as of 1 November 2008, the anticipated date of stabilization, is expected to be as follows: THREE MILLION SEVEN HUNDRED TWENTY FIVE THOUSAND DOLLARS ..($3,725,000.00) In addition, it is our opinion the prospective insurable value of the subject property, upon completion of 1 May 2008, the anticipated date of completion, is estimated to be as follows: ONE MILLION EIGHT HUNDRED FIFTY THOUSAND DOLLARS......................($1,850,000.00) Respectfully submitted,
Gerald A. Hendry, MAI, CCIM State-Certified General Real Estate Appraiser RZ 2245
Timothy D. Rieckhoff, Associate Appraiser State-Certified General Real Estate Appraiser RZ 2261

126

Addenda
127
ADDENDA

Addenda
128
ENGAGEMENT LETTER

Addenda
129
ENGAGEMENT LETTER – CONTINUED:

Addenda
130
C-1 ZONING CLASSIFICATION - CAPE CORAL - LEE COUNTY: .7 C-1 Pedestrian Commercial District A. Purpose and Intent These districts are established to: (1) permit areas designed to encourage and facilitate commercial
activities intended to serve a large trade area, including major shopping facilities oriented to pedestrian shoppers; (2) permit other uses generally compatible with such commercial uses; and, (3) otherwise implement this Ordinance.
B. Permitted Uses 1. Assisted Living Facility 2. Automatic Teller Machine (ATM) 3. Automotive parking establishment 4. Automotive parts store 5. Banks and financial establishments-groups I and II 6. Bar or cocktail lounge 7. Boat parts store 8. Building materials sales-group I 9. Business offices-groups I and II 10. Carryout/Delivery food service establishment
11. Child Care Facility 12. Cleaning and maintenance services 13. Clothing store, general 14. Clubs: fraternal and membership organization 15. Contractors and builders-groups I and II 16. Cultural facilities, private 17. Day care center, adult 18. Department store 19. Drug store 20. Essential service 21. Essential Service facilities-group I (Ord. 81-04, 8/2/04) 22. Florist shop 23. Flea market, indoor 24. Food stores-groups I and II 25. Gatehouse (only within a Planned Development Project) (Ord. 40-03, 5/12/03) 26. Government Uses-Groups I and II 27. Hardware store 28. Health care facilities-groups I, II, III and IV 29. Hobby, toy, game shops 30. Hotel/Motel and resort (Ord. 68-98, 11/30/98) 31. Household/office furnishings-groups I & II 32. Insurance company 33. Lawn and garden supply store 34. Marina 35. Medical office 36. Mortgage broker 37. Mortuary, funeral home, and crematory 38. Motion picture theater 39. Multi-family Dwelling, only within the Downtown CRA and within a PDP or, when
outside the Downtown CRA, within a Mixed Use Land Use designation and within a PDP, (See Special Regulations). (Ord. 11802, 1/21/03; Ord. 40-03, 5/12/03; Ord. 60-04, 6/14/04)
40. Nature and Wildlife Preserves

Addenda
131
41. Newsstand 42. Nightclub 43. Non-store retailers-groups I and IV 44. Package store 45. Parks-groups I, II, III, and IV 46. Personal services-groups I, II, III, and IV 47. Pet services 48. Pet shop 49. Pharmacy 50. Photofinishing Labs (Ord 3-97, 2/10/97) 51. Places of Worship 52. Printing services establishment 53. Private Park 54. Radio and television stations 55. Recreation, commercial-group I 56. Religious facility 57. Rental establishments-groups I and II 58. Repair shops-groups I and II 59. Research, development and testing laboratories-groups II and III (Ord. 7-91,
2/11/91) 60. Restaurants-groups I, II, III, and IV 61. Restaurant, fast food 62. Schools, commercial 63. Schools: non-profit, private, public, or parochial-group II 64. Social services-groups I and II 65. Specialty retail shops-groups I, II, III and IV 66. Studio 67. Transportation services-groups I and II 68. Used merchandise stores-groups I and II 69. Variety store 70. Veterinary and animal clinics (Ord. 35-94, 6/27/94)
C. Special Exception Uses
1. Automotive & equipment dealers – group I (two acres minimum lot area; see Special Regulations D.10) (Ord. 16-05, 2/28/05) 2. Automotive & equipment dealers-group III 3. Automotive repair and service-group I 4. Automotive service station limited 5. Automotive service station-full service 6. Automotive service establishment 7. Business offices-group III 8. Heliport 9. Helistop 10. Landscaping services establishment 11. Neighborhood Storage Facility - (See Special Regulations D.5) (Ord. 8100, §1,
10/23/00) 12. Recreation, commercial - group III 13. Rental establishments - group III 14. Repair shops - group III 15. Research, development and testing laboratories - group V 16. Self service fuel pumps 17. Self service fuel pump station 18. Storage, Enclosed (See Special Regulations D.1 and D.2 (Ord. 18-99, 5/3/99 19. Used merchandise stores - group V (Ord. 81-00, 10/23/00)

Addenda
132
D. Special Regulations 1. Storage, Enclosed may be permitted as a Special Exception subject to the following
requirements: a. Enclosed storage shall be an accessory use to a permitted use (Ord. 18-99,
5/3/99). b. Minimum lot size of 43,560 square feet or 1 acre (Ord. 18-99, 5/3/99). c. All storage must be situated only to the rear of the structure in which the
primary use is located (Ord. 18-99, 5/3/99). d. Storage shall not interfere with vehicular traffic, off street parking, and
access to alleys or streets (Ord. 18-99, 5/3/99; Ord. 35-99, §1, 6/3/99).
2. Where a commercial property fronts on a four or more laned roadway on one side and on a single-family residential district, as designated on the adopted future Land Use Map, on the opposite side, access for the commercial property shall not be permitted to the Residential District, as designated on the adopted future Land Use Map, for parking and loading areas that require backing maneuvers into the single family residential street. (Ord. 36-93, 7/26/93)
3. Where a commercial property fronts on Del Prado Boulevard or Santa Barbara
Boulevard on one side and on a single family residential district, as designated on the adopted Future Land Use Map, on the opposite side, access for the commercial property shall be permitted to the single family residential street in accordance with the following as well as other appropriate conditional requirements: a. The driveway shall be designed and constructed in accordance with the
requirements of Article V, Section 5.l, Off Street Parking and Circulation Facilities and the City of Cape Coral Engineering Design Standards.
b. The driveway shall be located in accordance with the Arterial/Collector Street 150 foot minimum spacing requirement set forth in the City of Cape Coral Engineering Design Standards. If the commercial property cannot meet this minimum spacing requirement, a joint commercial driveway shared with an adjacent property shall be constructed on the lot line with an agreement to provide an access easement to the adjoining property owner at such time as that property develops as set forth in the City of Cape Coral Engineering Design Standards.
c. The driveway shall not intersect the single family residential street at less than 80 degrees. (City of Cape Coral Engineering Design Standards).
d. The driveway shall meet the minimum sight distance requirements of the City of Cape Coral Engineering Design Standards.
e. The driveway shall be included in any Traffic Impact Study for the property to determine the driveway's impact on the local street and its intersections and if improvements are needed.
f. The property shall be landscaped in accordance with the requirements of Article V, Section 5.2, Landscaping.
g. The property shall be permanently screened from the single family residential district with a properly maintained, 15 foot minimum landscaped separation as required in Article V, Section 5.2.9(A), Landscaping for a Building Site's Perimeter Boundary; Screening Required Adjacent to Residential Property. (Ord. 51-97, 8/15/97)
h. There shall be a minimum of seven feet of green area in side set backs and ten 10) feet of green area in setbacks from the street lot lines facing the single family residential district.
i. Where necessary for safe and efficient turn movements, the City may restrict certain turn movements at the driveway accessing the single family residential street.
Addenda
133
j. For a commercial property fronting on Del Prado Boulevard on one side and on a single family residential district, as designated on the adopted Future Land Use Map, on the opposite side, access for the commercial property shall be permitted to the single family residential street only on those streets which provide access to existing and planned signalized intersections on Del Prado Boulevard. (Ord. 36-93, 7/26/93)
4. No existing or proposed commercial/professional use shall be established,
constructed, enlarged, or expanded on commercially zoned properties located adjacent to a residential future land use classification except by means of either the Planned Development Project (PDP) process as outlined in Article IV, Land Development Regulations, Section 4.2, Planned Development Project Procedure, or the alternative procedure described below. (Ord. 43-94, 8/8/94; Ord. 51-97, 8/15/97; Ord. 47-00, §1, 8/14/00) For purposes of this ordinance, a commercially zoned property shall be deemed to be adjacent to a residential future land use classification only when all or part of a property line of the commercially zoned property abuts a residential future land use classification or when the property is separated from such future land use classification only by an alley, canal, basin, lake, or other waterway. (Ord. 43-94, 8/8/94; Ord. 51-97, 8/15/97) Commercially zoned properties that are entirely separated from a residential future land use classification by any public right-of-way (excluding alleys and canals, basins, lakes or any other waterway) shall not be deemed adjacent to such residential future land use classification. (Ord. 43-94, 8/8/94; Ord. 51-97, 8/15/97)
As an alternative to the PDP required by this sub-subsection, a
commercial/professional use may be established, constructed, enlarged, or expanded on commercially zoned properties located adjacent to a residential future land use classification provided that the City approves a site plan for such development, including enhanced buffering as required herein. For purposes of this sub-subsection, such enhanced buffering shall mean providing buffering in accordance with either any two of a., b., or c. below or providing buffering in accordance with d. below: (Ord. 4700, §1, 8/14/00) a. A solid vegetative hedge not less than eight feet in height at maturity (to be
placed on the residential side of the solid finished masonry wall, if such wall is installed under paragraph c. below). Such hedge must also include shade trees with a minimum mature growing height of 20 feet spaced every 25 feet on center within the entire length of the hedgerow. The hedges must be planted in double staggered rows with plants a minimum of 3.5 feet high at planting, spaced 2.5 feet apart, and be maintained so as to form a 100 percent opaque screen between the residential and commercial or industrial land used within one year of such planting. The hedge and trees required as part of this enhanced buffering area shall be properly maintained at all times, and shall conform to all other applicable provisions found in Section 5.2; or (Ord. 47-00, §1, 8/14/00)
b. A 50 percent increase in the width of the landscaped buffer yard otherwise required by Section 5.2 of the Land Use and Development Regulations; or (Ord. 47-00, §1, 8/14/00)
c. Installation in the buffer area required by Section 5.2 of the Land Use and Development Regulations of a finished solid masonry wall that is either eight feet high or that is located on a landscaped berm so that the top of such wall would be eight feet high. The aforesaid wall must, however, comply with all requirements of Section 3.9 of the Land Use and Development Regulations unless a variance for such wall is obtained from the City. (Ord. 47-00, §1, 8/14/00)

Addenda
134
d. Alternative buffering that is found as part of the site plan approval process to be at least equal to providing any two of the foregoing enhanced buffering options described in Section 2.7.7.D.4.a., b., or c. in terms of mitigating the anticipated negative impact(s) of the commercial/professional use on the adjacent residential land use classification including, but not limited to sound, lighting, traffic, parking, drainage, aesthetic, safety, or waste disposal issues. (Ord. 47-00, §1, 8/14/00; Ord. 50-01, 6/4/01)
5. If a Neighborhood Storage Facility is approved by the Board of Zoning Adjustment
and Appeals as a special exception use, such Neighborhood Storage Facility shall comply not only with the conditions, if any, imposed by the Board of Zoning Adjustment and Appeals, but also shall comply with the following special regulations: (Ord. 81-00, 10/23/00) a. No activity other than loading, unloading, and storage of goods is allowed
from any storage unit. Furthermore, no business may be operated from any storage unit.
b. No loading or unloading activity shall be performed so as to be visible from the public right-of-way.
c. No hazardous or dangerous materials shall be stored in a Neighborhood Storage Facility.
d. A Neighborhood Storage Facility shall be located on a site that is not less than three acres in size.
e. No outdoor storage of any kind shall occur or be allowed on a premises containing a Neighborhood Storage Facility. All storage associated with a Neighborhood Storage Facility shall be entirely confined within one or more enclosed buildings.
f. A Neighborhood Storage Facility shall not be located in a metal building. In addition, the following exterior building materials shall not be used on any Neighborhood Storage Facility exterior wall that is visible from adjoining property or from any public right-of-way: vinyl or plastic siding; corrugated, reflective, or metal panels; smooth, scored, or split-faced block; any translucent material other than glass.(Ord.117-02, 12/9/02)
g. All heating, air conditioning, or other mechanical equipment located on the premises of a Neighborhood Storage Facility shall be shielded or screened so as to minimize the effects of such equipment on surrounding properties. All outdoor lighting located on the premises of a Neighborhood Storage Facility shall be not more than 15 feet in height when measured from the ground and shall be shielded so as to minimize the effects of such lighting on surrounding properties.
h. The roof pitch of any newly-constructed Neighborhood Storage Facility shall be not less than three feet vertical in 12 feet horizontal and not more than 12 feet vertical in twelve (12) feet horizontal. Variations in roof lines shall be used to add interest and reduce "massing" of buildings. At intervals of no more than 50 linear feet, the roof line shall be varied by interrupting the roof line vertically or horizontally no less than two feet as measured at the roof ridge line. Protruding firewall parapets extending at least three feet above the roof line may be substituted for a 50 foot line interruption. The foregoing roof requirements shall apply only to Neighborhood Storage Facility roofs that are visible from an adjoining property or from any public right-of-way. Furthermore, existing structures that were originally designed to contain a different use and that are being adapted to house a proposed Neighborhood Storage Facility shall not be required to meet the foregoing roof requirements though adaptations to their roofs may be required by the

Addenda
135
Board of Zoning Adjustment and Appeals as part of the Special Exception process for the purpose of adding interest and reducing the "massing" of buildings.
i. The maximum building height of any newly-constructed Neighborhood Storage Facility shall be two stories or 35 feet, whichever is less. Existing structures that were originally designed to contain a different use and that are being adapted to house a proposed Neighborhood Storage Facility may exceed the aforesaid maximum building height only if such height is first approved by the Board of Zoning Adjustment and Appeals as part of the Special Exception process.
j. All exterior walls that are visible from adjoining property or from any public right-of-way shall have wall relief at intervals of not more than 50 linear feet. A break or offset of not less than two feet in the vertical plane of exterior walls shall be located at intervals that are not greater than 50 linear feet. The use of pilasters or protruding ribs, while encouraged, shall not be considered as a break in the vertical plane of such exterior walls. All such exterior walls in excess of 14 feet in height shall use horizontal banding, bays, reveals, small offsets or windows to break up the vertical plane.
l. No storage shall be visible from the exterior of the Neighborhood Storage Facility. If the Neighborhood Storage Facility contains windows, only finished construction including, but not limited to walls, doors, etc., shall be visible through the windows. No Neighborhood Storage Facility window that is visible from any adjoining property or from any public right-of-way shall have paint or any other substance or material applied directly to the surface of such window so as to prevent visibility through such window. This restriction shall not, however, prevent a Neighborhood Storage Facility from utilizing "solar window tinting" or interior window treatments such as blinds, shutters, or draperies.
6. Multi-family residential use is permitted only on property located within the confines
of the Downtown Community Redevelopment Area (CRA) or on property with a Mixed Use Future Land Use designation that is outside the confines of the Downtown CRA. (Ord. 40-03, 5/12/03; Ord. 60-04, 6/14/04)
7. A compound use building that contains not more than two (2) multi-family dwelling
units located on the second floor or higher is not required to be approved through the PDP process. No multi-family residential use shall occur within the Downtown CRA unless such use has first been approved as part of an approved Planned Development Project (PDP). If a multi-family residential use is approved within the Downtown CRA as part of an approved PDP, such multi-family residential use shall comply not only with the conditions, if any, imposed pursuant to the development order for the PDP, but also shall comply with the following special regulations: a. Multi-family residential use is permitted only in conjunction with another use
on the same property. b. Multi-family residential uses are allowed only on the second floor or higher;
Multi-family residential use are prohibited on the ground floor of any structure. (Ord. 118-02, 1/21/02; Ord. 40-03, 5/12/03; Ord. 60-04, 6/14/04)
8. No multi-family residential use shall occur on property with a Mixed Use Future Land
Use designation outside of the confines of the Downtown CRA unless such use has first been approved as part of an approved Planned Development Project (PDP) consisting of three (3) acres or more in land area, regardless of size or number of subdivided parcels, if any.
Addenda
136
If a multi-family residential use is approved on property with a Mixed Use Future Land Use designation outside of the confines of the Downtown CRA as part of an approved PDP, such multi-family residential use shall comply not only with the conditions, if any, imposed pursuant to the development order for the PDP, but also shall comply with the following special regulations: a. Multi-family residential use is permitted only in conjunction with another use
on the same property; and b. The property, as well as any structures containing both non-residential
use(s) and multi-family residential use(s), shall be designed and maintained so as to ensure and protect the compatibility of the non-residential and multi-family residential uses through the provision of features that include, but are not limited to, features that serve to minimize the transmission of noise associated with or resulting from the non-residential use(s); the direction away from the multi-family residential use(s); and features that serve to maximize the separation of all non-residential pedestrian and vehicular access ways and/or parking areas from residential pedestrian and vehicular access ways and parking areas; and
c. A minimum of ten (10%) of the area of the site on which the mixed use (residential and non-residential) development is located shall be maintained by the property as open space. The following may be used to satisfy the open space requirements; areas used to satisfy water management requirements, landscape areas, recreation areas, and/or the areas of minimum yard(s) that are not covered with impervious surface or used for parking. The area of parking lot islands shall not be considered to be open space for purposes of satisfying the minimum open space requirements for such a development. (Ord. 40-03, 5/12/03; Ord. 60-04, 6/14/04)
9. Storm water Retention located within the Downtown CRA shall adhere to the
following criteria: a. Water retention and water quality facilities shall be concealed wherever
possible. b. Open storm water retention shall not be permitted to be located in front of
the principal structure. c. Storm water retention areas are prohibited in utility easements except as
follows: (1) Storm water retention areas may be located in utility easements so
long as the utility easement is located at least ten (10) feet from the centerline of a platted alley; or
(2) Storm water retention areas may be located in utility easements so long as the utility easement abuts neither a street nor a platted alley.
d. Retention areas shall not be visible from any street, sidewalk, public plaza or courtyard. If retention areas are used in side yards, they shall be located behind the front building line and completely screened from view with fencing, walls or approved landscaping.
e. Retention and water treatment areas may be located under paved parking lots and along unpaved edges of off-street parking and circulation facilities. Retention and water treatment areas may also be concealed under parking structures, patios, porches, courtyards, and paved areas for commercial type trash receptacles, parking lot landscaped islands, and other green areas.(Ord. 60-04, 6/14/04)
Addenda
137
10. Automotive & Equipment Dealers – Group I is available as a special exception use in the C-1 Pedestrian Commercial District only on sites that have frontage on Del Prado Boulevard, that are at least two (2) acres in size, and that are located south of Viscaya Parkway and north of Coronado Parkway. Any site that does not meet the foregoing criteria is not eligible for consideration for use as an Automotive & Equipment Dealers – Group I special exception use. If an Automotive & Equipment Dealers – Group I use is approved for a site that meets the foregoing criteria, such Automotive & Equipment Dealers – Group I use shall comply not only with the conditions, if any, imposed by the Board of Zoning Adjustment and Appeals, but also shall comply with the following special regulations: a. Vehicles offered for sale or lease shall not:
1. display pricing or financing information beyond that required by state or federal law;
2. be displayed raised above the finished grade of the site; or 3. be displayed with raised hoods for time periods longer than that
required for an inspection of the engine compartment; b. No vehicles, including but not limited to, inventory vehicles, customer
vehicles, and/or employee vehicles, shall be allowed to park on adjacent rights-of-way;
c. No vehicle service shall be performed on-site; d. No banners, balloons, streamers, or pennants shall be utilized on-site; e. The hours of operation shall be restricted to between 8:00 a.m. and 8:00
p.m.; and f. No public address systems shall be used. (Ord. 16-05, 2/28/05)
TABLE C-1
DIMENSIONAL REGULATIONS (C-1 District)
Minimum Lot Size None Minimum Lot Width (at building line) 25 ft. Minimum Frontage None Minimum Yards Front 25 ft. (a)(b)(f)(g) Side (a)(b)(c)(d)(f)(g) Rear 10 ft. (a)(b)(c)(d)(g)(m) Maximum Building Height 85 ft. and 6 stories (h) Minimum Building Height (Downtown CRA only) 20 ft. and 2 stories (n) Maximum Density 20 du/acre (i)(j)(k) Minimum Living Area(l) Efficiency and one bedroom units 750 s.f. Each additional bedroom 150 s.f.
(Ord. 118-02, 1/21/02; Ord. 60-04, 6/14/04)
(a) The Board of Zoning Adjustment and Appeals may, upon request by the applicant, reduce or waive the minimum setback requirements within a commercial district provided the following determinations are made: (1) The required setbacks would prevent the continuous development of a compact and
coordinated row of commercial and professional buildings, commercial block or shopping area, or dedicated parking area.

Addenda
138
(2) The required setback would severely limit the overall utilization of the property and would detract from the overall shopping desirability of the adjoining buildings and premises.
(b) (See Article III, Sec. 3.7 and 3.8 for corner lot setbacks.)
(c) All non-residential uses in all non-residential districts which are located on lots abutting a residential future land use classification shall maintain a minimum setback requirement for all structures of 25 feet in the side or rear yard abutting the residential future land use classification. All Commercial, Professional, Places of Worship and Industrial land uses shall be permanently buffered from abutting and adjacent Residential future land use classifications with a properly maintained 15 foot minimum landscaped buffer yard on the rear or side(s) of the use which actually abuts or is adjacent to the Residential future land use classification. In addition, commercial, professional, places of worship, and industrial land uses which are separated at the front, side or rear lines from a residential future land use classification by only a street containing not more than two lanes for motor vehicle traffic also shall be permanently buffered with a properly maintained 15 foot minimum landscaped buffer yard on such front, side and rear lot lines. For purposes of this Ordinance, a bicycle "lane" shall not be considered to be a lane for motor vehicle traffic. (See Article V, Sec. 5.2. for landscaping requirements.) (Ord. 51-97, 8/15/97)
(d) All buildings erected by the owners of only one building lot must be built flush to both of its
side lot lines but must then observe all Fire Underwriters Standards including a minimum of a two hour fire wall. All buildings erected by owners of two or more contiguous lots must be built with at least one of the sides flush with an end lot side line, and if it is not built flush to the side lot lines of both end lots, the minimum width that can be left vacant must be at least ten feet to permit the erection of another acceptable building at a later date.
A structure built on the lot line shall be designed to the following standards:
1. Water runoff shall be diverted to an approved retention area; 2. The structure shall be built so that there shall be no open compartments or cavities
between structures on the property line; and, 3. The roof shall be designed and built in such a manner as to prohibit water runoff to
the adjacent site. For properties with a driveway type side alley, a ten (10) foot side setback is required. A single row of parallel parking spaces may be permitted adjacent to the side alley. Properties with walkway type side alleys may be built to the property line. (Ord. 54-91, 7/22/91)
(e) If a property owner opts to provide a thirty (30) foot rear setback, a single row of parking may be allowed in the setback, providing, however, that the parking is placed directly to the rear of the structure. (Ord. 54-91, 7/22/91; Ord. 35-99, §1, 6/3/99)
(f) Within the confines of the Downtown Community Redevelopment Area (Downtown CRA)
District only, a six (6) foot minimum front yard shall be required, but no front yard shall exceed a maximum of ten (10) feet. (Ord. 118-02, 1/21/02; Ord. 60-04, 6/14/04)
On corner properties located within the confines of the Downtown Community Redevelopment Area (Downtown CRA) District, any side yard that abuts a street shall be not less than six (6) feet and not more than ten (10) feet. (Ord. 40-03, 5/12/03; Ord. 60-04, 6/14/04) The front of any building located within the confines of the Downtown Community Redevelopment Area (Downtown CRA) shall face a public street. (Ord. 60-04, 6/14/04)

Addenda
139
(g) Multi-family residential uses located in the Downtown Community Redevelopment Area (Downtown CRA) District may have swimming pools located on the roof of the building in which the multi-family use is located. For other swimming pools associated with multi-family residential uses located in the Downtown Community Redevelopment Area (Downtown CRA) District, the following shall apply: Open or enclosed pools or screen enclosures are subject to the limitations and regulations specified for structures in this section. The minimum distance requirement from a lot line shall be measured from the exterior of the screen enclosure for a screen enclosure or an enclosed pool and from the water line of an unenclosed pool. In no instance shall any pool, pool enclosure, or screen enclosure be placed within a utility or drainage easement. No swimming pool shall be located in the front yard of any structure containing a multi-family residential use located in the Downtown Community Redevelopment Area (Downtown CRA) District. All swimming pools associated with multifamily residential uses located in the Downtown Community Redevelopment Area (Downtown CRA) District shall comply with all requirements for swimming pools located in residential zoning districts. (Ord. 118-02, 1/21/02; Ord. 60-04, 6/14/04)
(h) This maximum building height shall be applied only within the Downtown Community
Redevelopment Area (Downtown CRA) District. (Ord. 118-02, 1/21/02; Ord. 60-04, 6/14/04) (i) This density regulation shall be applied only to multi-family residential uses. (j) The following table shall be used to determine the maximum number of dwelling units
permitted for parcels that are located within the Downtown Community Redevelopment Area (Downtown CRA) District and that are less than one (1) acre in size:
PARCEL SIZE MAXIMUM NUMBER OF UNITS
15,000 s.f. – less than 20,000 s.f. 10 units 20,000 s.f. – less than 25,000 s.f. 12 units 25,000 s.f. – less than 30,000 s.f. 14 units 30,000 s.f. – less than 35,000 s.f. 16 units 35,000 s.f. – less than 40,000 s.f. 18 units 40,000 s.f. – less than 43,560 s.f. 20 units
The following calculation shall be used to determine the maximum number of dwelling units (DU) permitted on a parcel that is located within the Downtown Community Redevelopment Area: (Ord. 60-04, 6/14/04)
(Parcel Area/43,560) x 20 = Maximum DU Permitted
In applying the foregoing calculation, the maximum dwelling units permitted shall be rounded to the nearest whole unit. No more than two thousand twenty-seven (2,027) dwelling units shall be permitted in the Downtown Community Redevelopment Area (Downtown CRA) District. The Coastal High Hazard Area of the Downtown Community Redevelopment Area (Downtown CRA) shall be limited to two hundred (200) dwelling units. (Ord. 118-02, 1/21/02; Ord. 40-03, 5/12/03; Ord. 60-04, 6/14/04) Within the Downtown Community Redevelopment Area (Downtown CRA) only, an additional density of twenty dwelling units (for a maximum of 40 dwelling units) shall be allowed as an incentive to provide parking lots or garages. This additional density shall be permitted only when a mixed use or compound use with a residential component as the primary use is utilized. If additional density is permitted, the following calculation shall be used to determine the allowable density per parcel:

Addenda
140
(Parcel Area/43,560) x up to 40 = Maximum DU permitted Non-residential uses located in the Downtown Community Redevelopment Area (Downtown CRA) shall be allowed a maximum floor to lot area ratio (FAR) of 4.0 regardless of whether residential use(s) are located on the same property. Such FAR shall neither affect nor be affected by the density allowed for any residential uses located on the same property in the Downtown CRA under this Section. (Ord. 60-04, 6/14/04)
(k) The following calculation shall be used to determine the maximum number of dwelling units (DU) permitted on a parcel with a Mixed Use Land Use Designation that is outside the confines of the Downtown CRA: (Ord. 60-04, 6/14/04)
(Parcel Area/43,560) x 20 = Maximum DU Permitted
In applying the foregoing calculation, the maximum dwelling units permitted shall be rounded to the nearest whole unit. Because multi-family residential use is permitted only in conjunction with a non-residential use on the same property within a Mixed Use Land Use Designation that is outside the confines of the Downtown CRA, however, such a property that contains both residential use(s) and non-residential use(s) shall be allowed either: 1. a maximum floor to lot area ratio (FAR) of 1.0 for the non-residential use(s) together
with a density that is equivalent to one-half (1/2) the maximum density that would otherwise be allowed under this Section for the residential use(s); or (Ord. 60-04; 6/14/04)
2. the maximum density that would be allowed under this Section for the residential use(s) together with a maximum floor to lot area ration (FAR) that is equivalent to one-half (1/2) the maximum FAR that would otherwise be allowed under this Section for the non-residential use(s).
The property owner shall have the option of whether to apply the full density/intensity to the residential use(s) or to the non-residential use(s). (Ord. 40-03, 5/12/03)
(l) The minimum living area requirement shall apply only for multi-family residential uses. (Ord.
118-02, 1/21/02; Ord. 40-03, 5/12/03) (m) Multi-family residential uses located on property with a Mixed Use Land Use Designation that
are outside the confines of the Downtown CRA may have swimming pools located on the roof of the building in which the multi-family use is located. For other swimming pools associated with multi-family residential uses located on property with a Mixed Use Land Use Designation that are outside of the Downtown CRA, the following shall apply: Open or enclosed swimming pools or screen enclosure are permitted no closer than ten (10) feet from any rear lot line. Swimming pools or screen enclosures located elsewhere on property containing multi-family residential use(s) located on property with a Mixed Use Land Use Designation that are outside the confines of the Downtown CRA are subject to the limitations and regulations specified for structures in this section. The minimum distance requirement from a lot line shall be measured from the exterior of the screen enclosure for a screen enclosure or an enclosed swimming pool and from the water line of an unenclosed swimming pool. In no event shall any swimming pool, pool enclosure, or screen enclosure be placed within a utility or drainage easement. For other recreational facilities, such as tennis courts, racquetball courts, basketball courts, volleyball courts, etc., associated with multifamily residential uses located on property with a Mixed Use Land Use Designation that are outside the Downtown CRA, the following shall apply: Such recreational facilities are permitted as accessory structures provided that the court area meets all setback requirements of the zoning district. Recreational facility fencing must also conform to the zoning district setback requirements for structures (Ord. 40-03, 5/12/03; Ord. 60-04, 6/14/04)

Addenda
141
(n) The minimum height for a building in the Downtown Community Redevelopment Area (Downtown CRA) shall be twenty (20) feet and two (2) stories. For buildings with frontage along Cape Coral Parkway, including corner buildings with Cape Coral Parkway frontage, the facade along Cape Coral Parkway shall be a minimum of thirty-five (35) feet in height and shall have the appearance of a three (3) story building. (Ord. 60-04, 6/14/04)

142
Addenda
143
ASSUMPTIONS AND LIMITING CONDITIONS This appraisal is to be used in whole and not in part. No part of it shall be used in conjunction with any other appraisal. Marketable title, but not responsibility as to legal matters, is assumed. It is assumed that the legal descriptions as provided are correct, that the improvements are entirely and correctly located on the property described, and that there are no encroachments or overlapping boundaries. Unless stated otherwise, legal access to the property is assumed. An inspection, but no survey, has been made. The property has been appraised as if free and clear, unencumbered by mortgages, liens, delinquent taxes, assessments, special or unusual deed conditions or restrictions, but subject to zoning regulations. An investigation, but no record search, has been made. The data used in compiling this report was secured from sources considered reliable and authentic and, so far as possible, was verified. However, no responsibility is assumed for its accuracy or correctness. It is assumed that there is full compliance with all applicable federal, state, and local environmental regulations and laws unless noncompliance is stated, defined, and considered in the appraisal report and it is further assumed that all applicable zoning, land use regulations and restrictions have been complied with, unless a nonconformity has been stated, defined and considered in the appraisal report. This report is also subject to the receipt of all necessary building permits and approvals (where applicable) to allow for the construction of the project being appraised. This report is subject to all growth management ordinances (i.e. concurrency) both local and state. The appraisers have relied upon representations made by the developer, client or authorities considered to be knowledgeable in this regard. A determination was not made by the appraisers as to the development potential for the project unless otherwise stated. This appraisal report has been prepared at a specified point in time as indicated by the date of valuation. Therefore, this report cannot be used prior to or subsequent to the effective appraisal date. Market values and conditions change significantly with the passage of time. This report cannot be viewed subsequent to the appraisal date and then reliance placed on values, opinions, and analysis made by the appraisers or other consultants in the report. No environmental impact studies were either requested or made in conjunction with this appraisal, and the appraisers hereby reserve the right to alter, amend, revise, or rescind any of the value opinions based upon any subsequent environmental impact studies, research, or investigation. The appraisers herein, by reason of this report, are not required to give testimony or attendance in court or any governmental hearing with reference to the property appraised, unless arranged previously therefore. The consideration for the preparation of this appraisal report is the payment by the employer of all charges due the appraiser in connection therewith. Any responsibility of the appraisers for any part of the report is conditioned upon full payment.

Addenda
144
In this appraisal assignment, the existence of potentially hazardous material used in the construction or maintenance of the building, such as the presence of urea formaldehyde foam insulation and/or existence of toxic waste, has not been considered. The appraisers are not qualified to detect such substances. The value estimate is predicated upon the assumption that there is no such material on or in the property that would cause a loss in value. We urge the client to retain an expert in this field, if desired. The forecasts or projections included in this report are used to assist in the valuation process and are based on current market conditions, anticipated short-term supply and demand factors, and a continued stable economy. These forecasts are therefore subject to changes in future conditions, which cannot be accurately predicted by the appraisers and could affect the future income and/or value forecasts. Radon is a naturally occurring radioactive gas which, when it has accumulated in a building in sufficient quantities, may present health risks to persons who are exposed to it over time. Levels of radon that exceed federal and state guidelines have been found in buildings in Florida. Additional information regarding radon and radon testing may be obtained from your county public health unit. No structural or component problems are known to exist on the property (improvements), although the appraisers do not warrant against same. The appraisers are not qualified to detect covert deficiencies in a property or structure and recommend that a professional property inspector and/or engineer be consulted with regard to these possible defects. The zoning code, unless otherwise stated, has not been verified by the appraiser. The appraisers have relied upon maps as provided by the Zoning Department of the respective county in which the property is located. Neither all nor any part of the contents of this report shall be conveyed to the public through advertising, public relations, news, sales or other media without the written consent and approval of the author, particularly as the valuation conclusion, the identity of the appraisers or firm with which he/she is connected, or any reference to any professional organization of which the appraisers may be a member. The appraisal report has been made in conformity with and is subject to the requirements of the Code of Professional Ethics and Standards of Professional Conduct of the Appraisal Institute, as well as with the Uniform Standards of Professional Appraisal Practice (USPAP) as per Standards Rule 2-3. The Americans with Disabilities Act (ADA) became effective on 26 January 1992. The appraisers have not made a specific compliance survey and analysis of this property to determine whether or not it is in conformity with the various detailed requirements of the ADA. It is possible that a compliance survey of the property, together with a detailed analysis of the requirements of the ADA, could reveal that the property is not in compliance with one or more of the requirements of the Act. If so, this fact could have a negative effect upon the value of the property. Since the appraisers have no direct evidence relating to this issue, possible noncompliance with the requirements of ADA in estimating the value of the property has not been considered. The appraisers have no present or contemplated future interest in the property appraised, and compensation for making this appraisal is in no manner contingent on the value reported.

Addenda
145
We hereby certify that, to the best of our knowledge and belief, the statements and opinions contained in this appraisal report are correct, subject to the assumptions and limiting conditions above set forth and subject to modifications and changes of conditions as stated in the body of the appraisal report. No one aside from those signing the report provided professional assistance with this appraisal. HYPOTHETICAL CONDITION: There is a Hypothetical Condition associated with this appraisal. Hypothetical Condition is defined by the Uniform Standards of Professional Appraisal Practice (USPAP), 2006 Edition (page 3), as:
That which is contrary to what exists but is supposed for the purposes of analysis.
Accordingly, the Hypothetical Condition associated with this appraisal is:
• For the purpose of this analysis it is assumed the proposed improvements exist in the estimation of the prospective Upon Stabilized and Upon Completion values.
EXTRAORDINARY ASSUMPTIONS: There are several Extraordinary Assumptions associated with this appraisal. Extraordinary Assumption is defined by the Uniform Standards of Professional Appraisal Practice (USPAP), 2006 Edition (page 3), as:
An assumption, directly related to a specific assignment, which, if found to be false, could alter the appraiser’s opinions or conclusions.
Accordingly, this appraisal is subject to:
• Completion of the proposed facility as illustrated on the architectural and engineering plans that were provided. The construction plans were prepared by: International Architecture Division of Archimetrics, Inc. 1415 Dean Street Suite 116 Fort Myers, Florida 33901 Telephone number – 1-239-476-8822 Dated - 9 April 2007 (latest revision dated 10 May 2007) The site plan was prepared by: Source, Inc. Engineers - Planners 1334 Lafayette Street Cape Coral, Florida Telephone number – 1-239-549-2345 Dated 21 August 2006

Addenda
146
• The values, Upon Completion and Upon Stabilization are prospective future values. These prospective future values are based on current market evidence and trends. We assume there will be no significant changes to take place in the market prior to these future dates.
• A portion of this assignment involves estimating insurable value, in terms of
the property owner’s building insurance responsibility. This insurable value is based on the building improvements only. This insurable value does not include: any depreciation or obsolescence; site improvements; impact fees; architectural and site engineering fee; land values; foundation or rent/income loss that may be incurred by the property owner during reconstruction; or equipment. This is assumed to be the typical methodology of the insurance industry to develop insurance value and this assignment is subject to same.
• The insurance companies in the State of Florida are currently experiencing
changes in the industry including high premium increases and non-renewals due to the recent hurricanes. We assume insurance would be available for the subject. This assignment is subject to same.
If any of these assumptions are found to be false, it could alter our opinions or conclusions.

Addenda
147
QUALIFICATIONS OF GERALD A. HENDRY, MAI, CCIM
EDUCATIONAL BACKGROUND AND TRAINING: Masters of Arts in Business Administration, with a major in Real Estate and Urban Analysis, University of Florida, 1995, Gainesville, Florida. Bachelor of Science in Business Administration, with a major in Finance, 1991, University of Florida, Gainesville, Florida. Principles and Practices of Real Estate, Brokers Course, Florida Real Estate Academy, 1995, Fort Myers, Florida. Case Studies in Valuation and Report Writing, University of Florida, 1994. Real Estate Market Analysis, University of Florida, 1993. Preview of Urban Planning and Regional Planning, University of Florida, 1993. Seminar in Real Estate Valuation, University of Florida, 1994. Seminar in Real Estate Financial Analysis, University of Florida, 1995. Land Use Economics, University of Florida, 1995. Principles and Practices of Real Estate, Salesman Course, Florida Real Estate Academy, 1990, Fort Myers, Florida. Demonstration Report Writing, seminar sponsored by the Appraisal Institute, Dallas, Texas, May 1999. Comprehensive Appraisal Workshop, Dallas, Texas, August 2000. AAppraising and Analysis of Proposed Subdivisions and Condominiums@, seminar sponsored by The Appraisal Institute, Boca Raton, Florida, August 2002. CCIM CI 101 - Financial Analysis for Commercial Investment Real Estate, CCIM Institute, Naples, Florida, October 2002. The Valuation of Wetlands, seminar sponsored by The Appraisal Institute, Fort Myers, Florida, September 2004. Case Studies in Commercial Highest and Best Use, Appraisal Institute, September 2005. CCIM CI 102 - Market Analysis for Commercial Investment Real Estate, May 2006. CCIM CI 103 - User Decision Analysis for Commercial Real Estate, September 2006. CCIM CI 104 - Investment Analysis for Commercial Real Estate, August 2006.

Addenda
148
EXPERIENCE: Currently an owner/partner with Maxwell & Hendry Valuation Services, Inc., Fort Myers, Florida. Associate Appraiser with W. Michael Maxwell & Associates, Inc., Fort Myers, Florida, 1995-2003. Commercial Credit Analyst with Barnett Bank of Lee County/First Florida Bank, Fort Myers, Florida, 1991-1993. PROFESSIONAL AFFILIATIONS: Appraisal Institute - MAI CCIM Institute - CCIM State-Certified General Real Estate Appraiser, RZ 2245 State-Licensed Real Estate Broker, BK #0567939 Real Estate Investment Society - Board of Governors 2002 - 2007, President 2007 Appraisal Institute - West Coast Florida Chapter Board of Directors 2003 - 2007 Appraisal Institute - West Coast Florida Chapter Treasurer 2005, Secretary 2006, Vice President 2007 OTHER: Qualified as an expert witness in the Circuit Court of Lee County RE-CERTIFICATION: As of the date of this report, Gerald Hendry has completed the requirements under the continuing education program of the Appraisal Institute.

Addenda
149
QUALIFICATIONS OF TIMOTHY D. RIECKHOFF
EDUCATIONAL BACKGROUND AND TRAINING: Associates Arts Degree, 1973, Edison Community College, Fort Myers, Florida. Bachelor of Arts Degree in Interpersonal Communication, 1975, University of Florida, Gainesville, Florida. Principles and Practices of Real Estate, Salesman Course, Bert Rogers School of Real Estate, 1977, Orlando, Florida. Graduate Real Estate Institute, Course I, Florida Association of Realtors, 1978, Tampa, Florida. Principles and Practices of Real Estate Brokers Course, Bert Rogers School of Real Estate, 1979, Orlando, Florida. Real Estate Appraisal Course 101, Society of Real Estate Appraisers, Edison Community College, 1984, Fort Myers, Florida. Real Estate Appraisal Course 102, Society of Real Estate Appraisers, Edison Community College, 1985, Fort Myers, Florida. "The Underwriter's Guide to Real Property Appraisal", seminar sponsored by the Society of Real Estate Appraisers, January 1987, Fort Myers, Florida. "The Appraiser's Guide to the Uniform Residential Appraisal Report" seminar sponsored by the Society of Real Estate Appraisers, March 1987, Fort Myers, Florida. "Depreciation Analysis", seminar sponsored by the Society of Real Estate Appraisers, March 1988, Punta Gorda, Florida. "The Appraiser's Legal Liabilities", seminar sponsored by the Society of Real Estate Appraisers, January 1989, Fort Myers, Florida. "FNMA Appraisal Standards", seminar sponsored by the Society of Real Estate Appraisers, March 1989, Fort Myers, Florida. "Appraiser Certification Seminar," seminar sponsored by the Society of Real Estate Appraisers, September 1989, Fort Myers, Florida. "Florida Residential Certification Exam Preparation," seminar sponsored by the Society of Real Estate Appraisers, February 1990, Fort Myers, Florida. "Standards of Professional Practice, Part A", seminar sponsored by the Appraisal Institute, Southwest Florida Chapter, June 1991. "Standards of Professional Practice, Part B", seminar sponsored by the Appraisal Institute, Southwest Florida Chapter, November 1991.
Addenda
150
"Appraisal Regulations of the Federal Banking Agencies", seminar sponsored by the Appraisal Institute, Southwest Florida Chapter, March 1992. "Appraising Troubled Properties", seminar sponsored by the Appraisal Institute, Southwest Florida Chapter, May 1992. "Capitalization Theory and Techniques", Part A, Course 1BA, by the Appraisal Institute, University of Central Florida, October 1992. "Advanced Income Capitalization", Course 510, by the Appraisal Institute, Tampa, Florida, October-November 1993. "Discounted Cash Flow Analysis", seminar sponsored by the Appraisal Institute, West Coast Florida Chapter, November 1993. "Uniform Standards of Professional Appraisal Practice: An Update", seminar by Lee and Grant Company, Sarasota, Florida, September 1994. "Core Law for Appraisers", seminar sponsored by the Appraisal Institute, West Coast Florida Chapter, November 1995. "State-Certified Real Estate Appraiser Exam Preparation Seminar", sponsored by Real Estate Education Specialists, Orlando, Florida, September 1996. "Uniform Standards of Professional Appraisal Practice/Law Update", sponsored by Real Estate Education Specialists, Fort Myers, Florida, July 1998. "Case Studies in Uniform Standards", sponsored by Real Estate Education Specialists, Fort Myers, Florida, July 1998. "Everglades/Big Cypress Market Study Seminar", sponsored by the U. S. Department of Justice, Environment and Natural Resources Division, Naples, Florida, October 1999. "Uniform Standards of Professional Appraisal Practice", continuing education by Academy of Real Estate Education, Inc., Ft. Myers, Florida, August 2000. "Techniques of Income Property Appraisal", continuing education by Academy of Real Estate Education, Inc., Fort Myers, Florida, November 2000. "Wetland Mitigation Bank - Functional Assessment Workshop", sponsored by Little Pine Island Wetland Restoration & Mitigation Bank, Lee County, Florida, February 2001. "How to Screen any Property for Apparent Environmental Hazards", continuing education by Academy of Real Estate Education, Inc., Fort Myers, Florida, July 2002. "Uniform Standards of Professional Appraisal Practice", continuing education by McKissock, Inc., Fort. Myers, Florida, October 2002. "Rates and Ratios: Making Sense of GIMs, OARs, and DCF", continuing education sponsored by

Addenda
151
the West Coast Florida Chapter of the Appraisal Institute, September 2003. "Does My Report Comply with USPAP", continuing education by McKissock, Inc., Naples, Florida, June 2004. "The Valuation of Wetlands", continuing education sponsored by the West Coast Florida Chapter of the Appraisal Institute, September 2004. "National USPAP Update Equivalent", continuing education by McKissock, Inc., Fort. Myers, Florida, October 2004. "Florida Laws and Regulations", continuing education by McKissock, Inc., Fort. Myers, Florida, October 2004. "Analyzing Operating Expenses", online continuing education by the Appraisal Institute, Fort Myers, Florida. May 2005. "Case Studies in Commercial Highest and Best Use", continuing education sponsored by the West Coast Florida Chapter of the Appraisal Institute, Fort Myers, Florida, September 2005. “Appraising from Blueprints and Specifications”, online continuing education by the Appraisal Institute, Fort Myers, Florida. March 2006. “Florida Appraisal Laws and Regulations”, online continuing education by McKissock Real Estate and Appraisal School, Fort Myers, Florida. August 2006. “FL National USPAP Update Equivalent 2006”, online continuing education by McKissock Real Estate and Appraisal School, Fort Myers, Florida. September 2006. “FL Dirty Dozen”, The Essential Steps to Completing a USPAP Compliant Appraisal Report, online continuing education by McKissock Real Estate and Appraisal School, Fort Myers, Florida. June 2007. “FL Disclosures and Disclaimers”, online continuing education by McKissock Real Estate and Appraisal School, Fort Myers, Florida. June 2007. EXPERIENCE: Currently associated with Maxwell & Hendry Valuation Services, Inc., Fort Myers, Florida, 2004. Associate Appraiser with W. Michael Maxwell & Associates, Inc., Fort Myers, Florida, 1983-2003. Associate Appraiser with Calhoun and Maxwell & Associates, Inc., Fort Myers, Florida, 1983. Owner/Broker ICM Properties, Realtor, Cape Coral, Florida, 1981-1982. Real Estate Salesman, VIP Realty, Fort Myers, Florida, 1980-1981. Real Estate Salesman, Century 21 Nolan Realty, Fort Myers, Florida, 1978-1980.

Addenda
152
CLIENTS SERVED: Lee County Government, Lee County Port Authority, School District of Lee County, Hendry County Government, Lee Memorial Health System, Lee County Electric Cooperative, Sprint, City of Bonita Springs, various local and regional lending Institutions, as well as attorneys representing various entities and individuals. PROFESSIONAL AFFILIATIONS: State-Certified General Real Estate Appraiser, RZ 2261 State-Licensed Real Estate Broker Associate, Bk185071 Commercial Investment Professionals of Southwest Florida RE-CERTIFICATION: As of the date of this report, I, Timothy D. Rieckhoff, have completed the requirements under the continuing education program for State Certification.