sumawa: sustainable management of watersheds - …crsps.net/wp-content/downloads/global...
TRANSCRIPT

SUMAWA: Sustainable Management of Watersheds - River Njoro Project

The River Njoro WatershedThe River Njoro Watershed
KENYA
Nairobi
Njoro

Collaborating Institutions & Research Team
► Univ. of WyomingS. Miller (Lead US PI)S. Mooney
► Egerton UniversityW. Shivoga (Lead Kenya PI)F. Lelo (co-PI)C. Gichaba (co-PI)D. Ouma (co-PI)B. OnyandoS. OumaN. MuhiaL. ChiuriS. Inoti
• Univ. of Calif. – DavisM. Jenkins (co-PI)
► Moi UniversityM. Muchiri (co-PI)D. Liti
► Dep’t of FisheriesN. Gitonga
► Kenya Wildlife ServiceD. Ndetei
► Utah State University

Presentation Outline
1.1. IntroductionIntroduction2.2. Research ComponentsResearch Components
StakeholderStakeholderHydrologyHydrologySocioSocio--EconomicEconomicEcologyEcology
3.3. Summary and Future DirectionSummary and Future Direction

General Conceptual Response Model of River Njoro Watershed
Baseline condition
Settlement & urban growth
Change in watershed system response
Decreased water quality and quantity
Decreased Watershed Sustainability

Long-Term (5+ years) Goals
►►Two Identifiable Indicators:Two Identifiable Indicators:
(Research): Improve the understanding of (Research): Improve the understanding of biophysical and social dynamics governing biophysical and social dynamics governing watershed health in rural areaswatershed health in rural areas
(Development): Improve the health of (Development): Improve the health of threatened/degraded upland watershed threatened/degraded upland watershed systems in East Africa on a productive and systems in East Africa on a productive and sustainable basis.sustainable basis.

Research ComponentsSTAKEHOLDER
SOCIO- ECONOMICS
WATERSHEDHYDROLOGY
ECOLOGY

Remote Sensing
GIS
Def
initi
on o
f obj
ectiv
esData Collection Research Synthesis Decision
Components Support
Field Data
Mod
el C
ompo
nent
Out
puts
Watershed Model
Scenario developmentAlternative futures
Re-define problemAdditional data needs
Alternative rankings
Ecology
WatershedHydrology
Socio- Economics
Visualization
Management /Decision support
Problemidentification
StakeholderInvolvement
Historical Data
Stakeholder

Expected Impacts►► At the end of the project, we hope that…At the end of the project, we hope that…
Ecological and biological health Ecological and biological health indicators/trends are improved and sustainable indicators/trends are improved and sustainable in the Njoro in the Njoro Productive and beneficial uses of water Productive and beneficial uses of water increased and sustained equitably increased and sustained equitably Stakeholder willingness to protect and sustain Stakeholder willingness to protect and sustain critical aquatic and terrestrial habitats is critical aquatic and terrestrial habitats is increasedincreasedIncomes increase for the poorest households Incomes increase for the poorest households and livelihoods perform better (resilience, time and livelihoods perform better (resilience, time in poverty) under conditions of shockin poverty) under conditions of shock

River Njoro WatershedRiver Njoro Watershedoo Originates from the Eastern Mau Originates from the Eastern Mau
Escarpment of the Rift Valley Escarpment of the Rift Valley and and empties into Lake Nakuruempties into Lake Nakuru
oo Mau is the biggest & one of the five Mau is the biggest & one of the five major water towers of Kenya major water towers of Kenya –– a a critical water resource.critical water resource.
oo The river is about 50 km long and its The river is about 50 km long and its watershed covers about 276 kmwatershed covers about 276 km2 2 with with 250,000+ people250,000+ people

Western Kenya: Population Density (1999 Census)

Why River Njoro Watershed?►► Test case for integrated Test case for integrated
approachapproachDemonstration watershedDemonstration watershedTypical of regional watershed Typical of regional watershed issuesissues
►► LongLong--term research site term research site Extensive historical dataExtensive historical data
►► Accelerated degradationAccelerated degradationImminent need to address Imminent need to address local concernslocal concerns
►► Opportunity for integrated Opportunity for integrated assessmentassessment
Longitudinal study in both Longitudinal study in both spatial and temporal spatial and temporal dimensionsdimensions

Land Use in the Watershed
►►Upland forestsUpland forests►►GrazingGrazing►►AgricultureAgriculture►►SettlementsSettlements►►Urban growthUrban growth►►IndustryIndustry►►Nakuru National Park Nakuru National Park
Nessuit (1)
Njoro (2)
Ngata (1)
Kaptembwa (1)
Baruti (1)
KWS Lake Nakuru NP
Dow
nstre
am u
ses
Communities along the Njoro
Egerton Univ.

1
2
3
45
Virtual Field Trip Through the Watershed
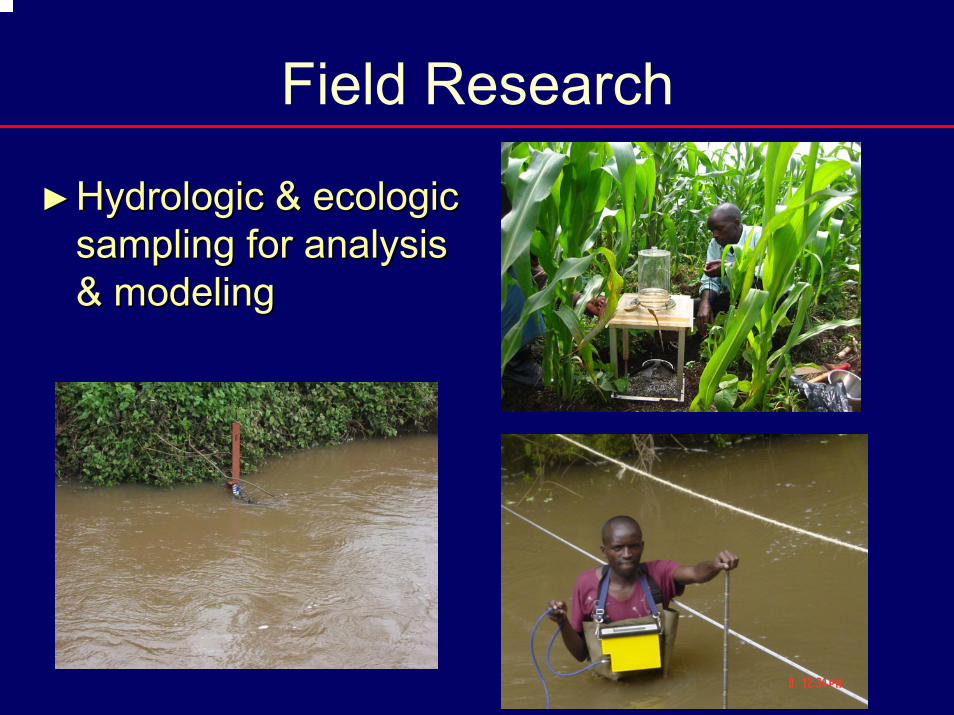
Field Research
►►Hydrologic & ecologic Hydrologic & ecologic sampling for analysis sampling for analysis & modeling& modeling

STAKEHOLDER/OUTREACH STAKEHOLDER/OUTREACH COMPONENTCOMPONENT
F.K. Lelo & L.W. ChiuriF.K. Lelo & L.W. Chiuri
Egerton UniversityEgerton University

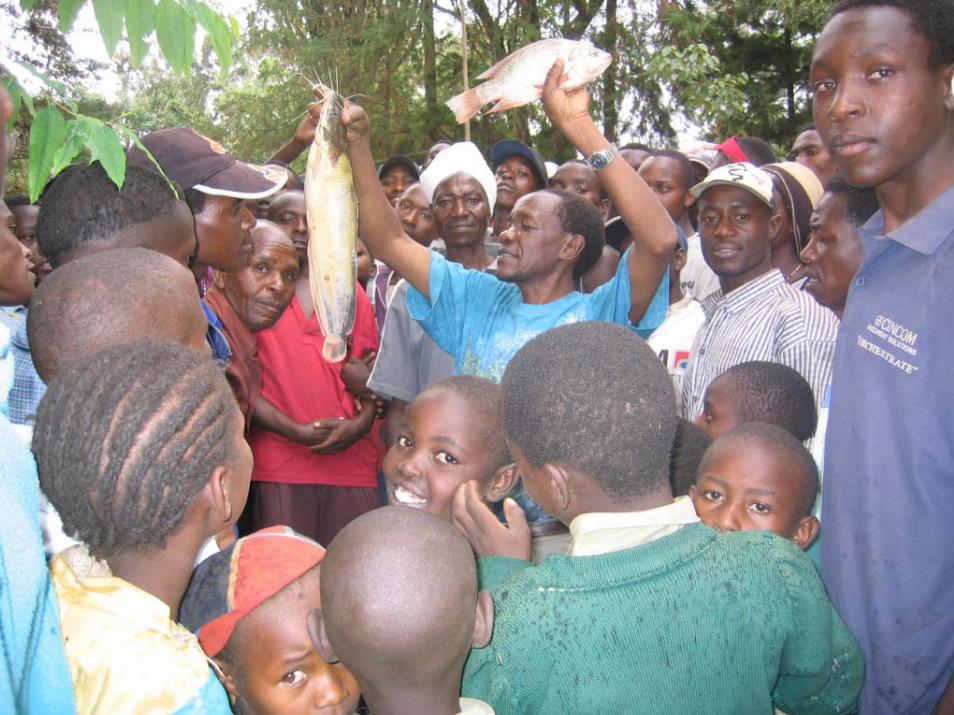
Awareness Creation
►► Stakeholder Stakeholder WorkshopWorkshop
►► BarasasBarasas in in Nessiut, Nessiut, Njoro, Njoro, Ngata & Ngata & Baruti Baruti LocationsLocations
►► Sensitizing Sensitizing Egerton Egerton Community Community

COMMUINITYPRIORITY
PROBLEMS&
ACTION OPPORTUNITIES
PARTICIPATORYDATA GATHERING
TOOLS
INTEGRATION &SYNTHESIS OF
LOCAL ASPIRATIONSAND SCIENCE
TIERED WORKSHOPS
SYNTHESISOF SCIENCE
LOCAL ASPIRATIONS
&POLICY
OUTREACH PRODUCTS
WAPs
IMPLEMEN TATION


COMMUINITYPRIORITY
PROBLEMS&
ACTION OPPORTUNITIES
PARTICIPATORYDATA GATHERING
TOOLS
INTEGRATION &SYNTHESIS OF
LOCAL ASPIRATIONSAND SCIENCE
TIERED WORKSHOPS
SYNTHESISOF SCIENCE
LOCAL ASPIRATIONS
&POLICY
OUTREACH PRODUCTS
WAPs
IMPLEMEN TATION

1. Poor roads and inadequate infrastructure
2. Water scarcity & water-borne disease
1. Low income2. Poor community
cooperation
1. Water scarcity & water-borne disease
2. Siltation & flooding#
#
##
#
1. Water scarcity2. Fuelwood scarcity
TOP TWO COMMUNITY IDENTIFIED PROBLEMSTOP TWO COMMUNITY IDENTIFIED PROBLEMS

Common Themes for Community Common Themes for Community ActionAction
1.1. Restoring and protecting the riparian buffer zoneRestoring and protecting the riparian buffer zone2.2. Local enforcement of river pollution laws (e.g. community Local enforcement of river pollution laws (e.g. community
patrols)patrols)3.3. Education and awareness raising on rules, policies and Education and awareness raising on rules, policies and
regulationsregulations4.4. Rehabilitation and new construction of supply & Rehabilitation and new construction of supply &
sanitation infrastructuresanitation infrastructure5.5. AgroAgro--forestry and riparian tree planting programsforestry and riparian tree planting programs6.6. Development of a riparian management planDevelopment of a riparian management plan7.7. Clarification and enforcement of laws governing water Clarification and enforcement of laws governing water
abstraction abstraction

COMMUINITYPRIORITY
PROBLEMS&
ACTION OPPORTUNITIES
PARTICIPATORYDATA GATHERING
TOOLS
INTEGRATION &SYNTHESIS OF
LOCAL ASPIRATIONSAND SCIENCE
TIERED WORKSHOPS
SYNTHESISOF SCIENCE
LOCAL ASPIRATIONS
&POLICY
OUTREACH PRODUCTS
WAPs
IMPLEMEN TATION

Ecology of River Njoro Ecology of River Njoro WatershedWatershed
Mucai Mucai MuchiriMuchiri

INTRODUCTIONINTRODUCTION
►►To establish ecological health and potential To establish ecological health and potential of aquatic and terrestrial ecosystems in the of aquatic and terrestrial ecosystems in the River Njoro watershedRiver Njoro watershed
►►To develop approaches to bioTo develop approaches to bio--monitoring of monitoring of ecological health of the watershedecological health of the watershed
►►To develop recommendations for To develop recommendations for rehabilitation of impaired ecosystemsrehabilitation of impaired ecosystems
Primary Goals:

Research ActivitiesResearch ActivitiesResearch ActivityResearch Activity►►Characterize ecological health of River NjoroCharacterize ecological health of River Njoro►►Characterize ecological health of Lake Characterize ecological health of Lake
NakuruNakuru►►Establish a fish farming demonstration unitEstablish a fish farming demonstration unit►►Assess suitability of ecological models for Assess suitability of ecological models for
development of a biological monitoring and development of a biological monitoring and assessment tool (BioMAT)assessment tool (BioMAT)

Summary of Research OutputsSummary of Research Outputs
►►Data on spatial and temporal distribution of Data on spatial and temporal distribution of benthic macroinvertebrates in River Njoro benthic macroinvertebrates in River Njoro and Lake Nakuruand Lake Nakuru
►►Data on spatial and temporal distribution of Data on spatial and temporal distribution of nutrients (P and N) in River Njoro and Lake nutrients (P and N) in River Njoro and Lake NakuruNakuru
►►Substantial historical data sets collectedSubstantial historical data sets collected►►3 3 MScMSc. theses drafts . theses drafts –– one submitted for one submitted for
examinationexamination
Characterization of watershed health

-100
-50
0
50
100
150
200
250
1 2 3 4 5 6 7 8 9 10
Sampling site (downstream )
% U
pstr
eam
nut
rien
t con
trib
utio
nTOC Nitrates Phosphates
Human settlement aroundEgerton University
Vegetable canningfactory
Dense riparianvegetation

R2 = 0 .560 2
0
0 .05
0 .1
0 .15
0 .2
0 .25
0 10 20 30 40
p ercen tag e m ix ed sm all-scale ag ricu ltu re
phos
phat
e co
ncen
tratio
n (m
g/l)
R2 = 0 .560 2
0
0 .05
0 .1
0 .15
0 .2
0 .25
0 10 20 30 40
p ercen tag e m ix ed sm all-scale ag ricu ltu re
phos
phat
e co
ncen
tratio
n (m
g/l)
Relationship between phosphate concentration & proportion of land cover areas of small scale mixed agriculture.

Taxa Upper forested stretch
Agricultural stretch
Stretch receiving effluent from Egerton and Njoro `Canning factory
INSECTABeetles (Coleoptera)
Coleoptera (Beetles)HelodidaeScirtes hemisphaericusHydrocyphon deflexicollisHelodes hausmanniHelodes minutus?
Hydroscaphidae Hydroscaphidae
Mayflies (Ephemeroptera) Leptophlebia sp.
Heptagenia sp.Baetis sp.CaenisICloeon sp.
Caenis spII
Trueflies (Diptera) Tipulidae I (craneflies)
Tanypodinae I (midges)Chironomini (midges)
Simuliidae (bloodsuckingmidges)
Tanypodinae II (midges)
Benthic macroinvertebrate taxa characteristic of 3 reaches

Summary of Research OutputsSummary of Research Outputs
►►Construction of 4 ponds of 15 X 20 M at Construction of 4 ponds of 15 X 20 M at Egerton UniversityEgerton University
►►One test pond complete, awaits stocking with One test pond complete, awaits stocking with fishfish
►►Three ponds near completionThree ponds near completion►►Training of CBO members during Training of CBO members during
constructionconstruction►►Mukeu Community Organisation constructed Mukeu Community Organisation constructed
their own fish pondtheir own fish pond
Aquaculture Demonstration Unit


Summary of Research OutputsSummary of Research Outputs
►►Collection of reference materials is deposited Collection of reference materials is deposited at the SUMAWA officeat the SUMAWA office
►►A synthesis of the collected material has A synthesis of the collected material has been donebeen done
►►Review of ecological literature continuingReview of ecological literature continuing►►Review of ecological models leading to Review of ecological models leading to
development of BioMATdevelopment of BioMAT►►Draft preparedDraft prepared
Development of BioMAT


SUMAWASUMAWASOCIOSOCIO--ECONOMICS ECONOMICS
COMPONENTCOMPONENT
River Njoro Watershed, KenyaRiver Njoro Watershed, Kenya

Household Survey
►► Economic surveyEconomic survey►► 353 households353 households►► Analyzed by 5 zonesAnalyzed by 5 zones►► Baseline dataBaseline data►► LongLong--term: term:
longitudinal studieslongitudinal studies

#
#
##
#
MAIN ECONOMIC ACTIVITIESMAIN ECONOMIC ACTIVITIESNgata
80%
9%
0%
0%
0%
6%
0%
3%
0%
1%
1%
0%
0%
Njoro
55%
9%
1%
2%
1%
9%
10%
6%0%
4%
2%
1%
0%
Kaptembwa
35%
9%
0%6%0%
23%
6%
9%
6%
0%
0%
0%
6%
94%
6% 0%0%0%0%0%0%0%0%0%0%0%
Baruti
69%
10%
0%
2%
0%
8%
2%
2% 2%3%
0%
0%
2%
Crop
Livestock
Formal employment
Vending crops
Casual employment

Relative importance of livestock Relative importance of livestock species in the River species in the River NjoroNjoro watershedwatershed
12%
16%
2%
65%
1%4%
cattle
sheep
goats
poultry
donkeys
beehives

Gender participation in household surveysGender participation in household surveys
0
20
40
60
80
100
120
Nessuit Njoro Ngata Kaptembwo barutiLocations
Num
ber o
f peo
ple
inte
rvie
wed Men
Women

Variations in household incomesVariations in household incomes
0
1000
2000
3000
4000
5000
6000
7000
8000
Nessuit Njoro Ngata Kaptembwa Baruti
Location
Inco
me
(Ksh
s)

Data Collection and Analysis Data Collection and Analysis ChallengesChallenges
►► Logistic and bureaucratic delays encountered at the Logistic and bureaucratic delays encountered at the archival points during review of historical recordsarchival points during review of historical records
►► The ethnic mix of households within the watershed The ethnic mix of households within the watershed and the associated language barrier and the associated language barrier
►► Strong cultural beliefs and sensitivity to land Strong cultural beliefs and sensitivity to land ownership in Nessuit Locationownership in Nessuit Location
►► Difficulty in accessing some households in some Difficulty in accessing some households in some locations within the watershed. locations within the watershed.

►► Challenges in Livestock AreaChallenges in Livestock AreaRising incidences of livestock diseasesRising incidences of livestock diseasesDeclining trend in crop production Declining trend in crop production Limited range of productsLimited range of productsInadequate animal feedsInadequate animal feedsInadequate watering points for livestockInadequate watering points for livestock
►► Challenges in Human HealthChallenges in Human HealthIncrease of waterborne diseasesIncrease of waterborne diseasesDeteriorating quality and quantity of waterDeteriorating quality and quantity of water
►► Challenges in Challenges in AgroforestryAgroforestryDeforestation and inadequate forest products within Deforestation and inadequate forest products within the watershedthe watershed

SUMAWA SUMAWA -- HYDROLOGY HYDROLOGY COMPONENTCOMPONENT
““WATER OUR COMMON INHERITANCE”WATER OUR COMMON INHERITANCE”

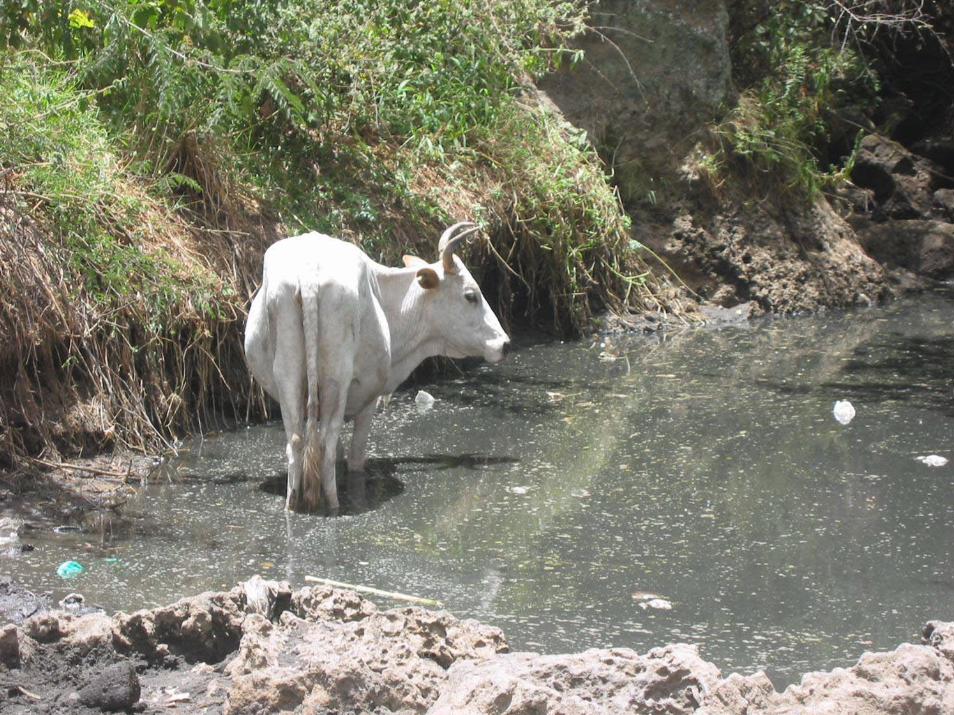
WATER CRISISWATER CRISIS : QUALITY LINKS TO : QUALITY LINKS TO HUMAN HEALTHHUMAN HEALTH
Waterborne diseasesWaterborne diseasesTyphoidTyphoidDiarrheaDiarrheaMalariaMalariaAmoebeosisAmoebeosis
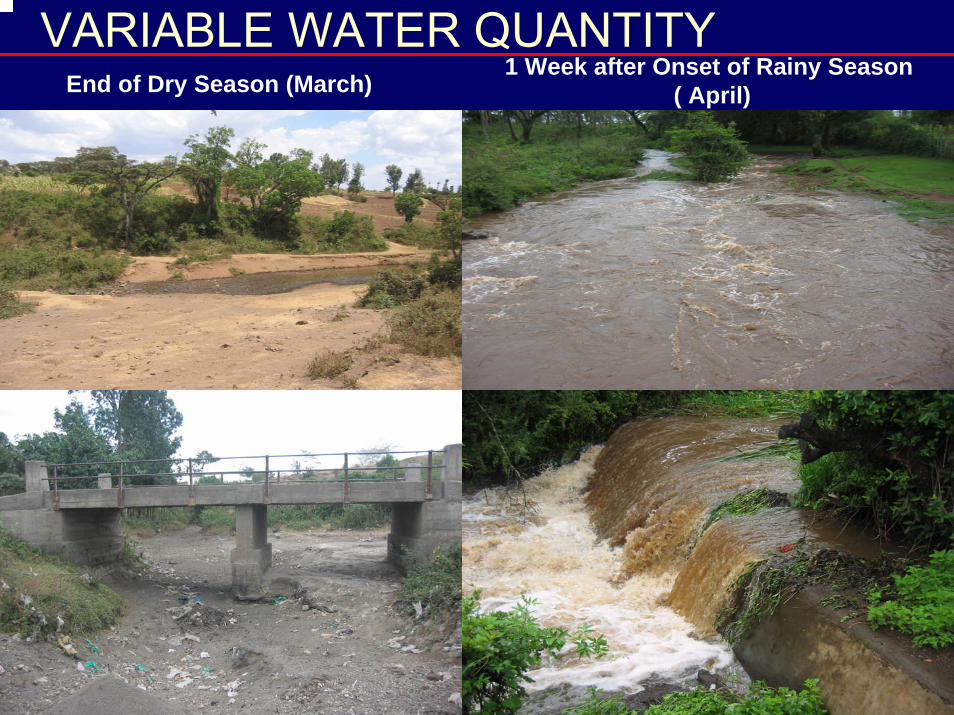
End of Dry Season (March)1 Week after Onset of Rainy Season
( April)
VARIABLE WATER QUANTITY

Soil Erosion and SedimentationSoil Erosion and Sedimentation
►► Soil slumping in upper Soil slumping in upper watershedwatershed
►► Overgrazing Overgrazing -- poor poor management and management and controlcontrol
►► Lack of soil control Lack of soil control measures & loss of measures & loss of riparian zonesriparian zones

Groundwater Issues►►Borehole water Borehole water
quality & quantityquality & quantityEgerton University Egerton University rationing water rationing water Local reliance on Local reliance on boreholesboreholes
►►Water balanceWater balance
BoreholeBoreholeOutputOutput
(m(m33/Day)/Day) StatusStatus
BH1BH1BH2BH2BH3BH3BH4BH4BH5BH5BH6ABH6ABH6BBH6BBH7BH7BH8BH8BH9BH9BH10BH10BH11BH11BH12BH12BH13BH13BH14BH14BH15BH15
3636336336--
384384--
360360408408--------
16816896966060----
OperationalOperationalOperationalOperationalDried in 2000Dried in 2000OperationalOperationalServiceableServiceableOperationalOperationalOperationalOperationalDried up in 1987Dried up in 1987Dried up in 1994Dried up in 1994Dried upDried upDried up in 1994Dried up in 1994OperationalOperationalOperationalOperationalOperationalOperationalUnoperationalUnoperationalServiceableServiceable
TotalTotalyield/yield/dada
1,8481,848

Land Cover in the Njoro WatershedLand Cover in the Njoro Watershed
0 5 10 15 202.5
Kilometers
Large AgricultureSmall Agriculture
Barren / DegradedUrbanRiparianPlantation ForestryForest / Dense VegGrassWater
Land Cover Legend
Large AgricultureSmall Agriculture
Barren / DegradedUrbanRiparianPlantation ForestryForest / Dense VegGrassWater
Land Cover Legend
Remote sensing classificationLandsat TM & ETM+ dataTime series 1986-2003
2003 Classification

Land Cover Change in Upper River Njoro Watershed (1986-2003))
Land Land Cover Cover ClassClass
1986 1986 (ha)(ha)
1995 1995 (ha)(ha)
2003 2003 (ha)(ha)
Change Change 1986 1986 –– 2003 2003
(ha)(ha)
Open Open WaterWater 00 00 11 11
UrbanUrban 275275 438438 502502 227227
AgricultureAgriculture 1020810208 99029902 1150411504 12961296
76767676
44374437
ForestForest 1124311243 1011010110 --35673567
GrasslandGrassland 45384538 30173017 --101101

Percentage Change in Annual Runoff in River Njoro Percentage Change in Annual Runoff in River Njoro Watershed from 1961Watershed from 1961--19851985
►► Increase in runoff volume, Increase in runoff volume, BUTBUT loss in access to loss in access to water (e.g. increases water scarcity)water (e.g. increases water scarcity)
►► We hypothesize that this is due to land cover We hypothesize that this is due to land cover change from midchange from mid--1990’s resulting in:1990’s resulting in:
Loss of infiltration in upper watershed Loss of infiltration in upper watershed Increased flashiness in runoff Increased flashiness in runoff –– downstream losses in downstream losses in water resourceswater resources
19861986--19891989 19891989--20002000 20002000--20032003
--0.850.85 +31.34+31.34 +108.11+108.11

LS Variability - Rainfall SimulatorLanduse; LS Means
Current effect: F(4, 8)=32.550, p=.00005Effective hypothesis decomposition
Vertical bars denote 0.95 confidence intervals
Agric Grazing Exotic Deforest Indeg
Landuse
-400-200
0200400600800
1000120014001600
Runoff (m
l)
Bulk density Bulk density (g/cm3)(g/cm3)
Organic matter Organic matter (%)(%) Soil pHSoil pH Mean soil loss Mean soil loss
(g/0.1 m2)(g/0.1 m2)
AgricultureAgriculture 0.850.85 5.75.7 6.26.2 8686
GrazingGrazing 1.051.05 55 5.95.9 1818
ExoticExotic 0.950.95 6.26.2 6.46.4 22
DeforestedDeforested 0.780.78 10.110.1 5.85.8 3131
Indigenous Indigenous forestforest 0.740.74 9.49.4 6.26.2 00

Ongoing Field Research
►►Hydrologic & Ecologic Hydrologic & Ecologic sampling for Analysis sampling for Analysis & modeling& modeling

Hydrologic Monitoring►► River flowRiver flow
2 automatic recorders (2 automatic recorders (SPTsSPTs))2 stage recorders (2x daily 2 stage recorders (2x daily measurement)measurement)Opportunistic measurement w/ Opportunistic measurement w/ Current meterCurrent meter
►► Small watershedSmall watershed2 H2 H--flumes w/ PT, rain gaugeflumes w/ PT, rain gauge
►► RainfallRainfall2 daily sites2 daily sites2 tipping bucket2 tipping bucket
►► GroundwaterGroundwaterWells (boreholes)Wells (boreholes)

Community Managed Community Managed RaingaugeRaingauge at a at a SigaonSigaon Primary SchoolPrimary School
Summary“You see… you people just make things more complex than they really are”
- A Kenyan NGO Director
Reality: there are layers of complexity in:• livelihoods and choices• biophysical processes• climate• policy, law and governance• decision making and priorities
This is a complex system that requires nuance and inter/ multidisciplinary work

Long-Term (5+ years) Goals
►►Two Identifiable Indicators:Two Identifiable Indicators:
(Research): Improve the understanding of (Research): Improve the understanding of biophysical and social dynamics governing biophysical and social dynamics governing watershed health in rural areaswatershed health in rural areas
(Development): Improve the health of (Development): Improve the health of threatened/degraded upland watershed threatened/degraded upland watershed systems in East Africa on a productive and systems in East Africa on a productive and sustainable basis.sustainable basis.

Ongoing Efforts►► Ongoing training and capacity buildingOngoing training and capacity building
Infrastructure (computers, Infrastructure (computers, communications)communications)Technical knowledge (Modeling, GIS, Technical knowledge (Modeling, GIS, statistics)statistics)Project & Program ManagementProject & Program Management
►► Long term experimental watershedLong term experimental watershedMonitoring and testingMonitoring and testingField data collection; permanent Field data collection; permanent installationsinstallations
►► Linkages among componentsLinkages among components►► Knowledge disseminationKnowledge dissemination

Capacity Building((Degree Training))
Research Research AssistantAssistant
MenMen
22
22
7 have completed thesis or nearing graduation7 have completed thesis or nearing graduation
KenyaKenya
USUS
MSMS PhDPhD
WomenWomen MenMen WomenWomen MenMen WomenWomen
22 1212 22 -- --
33 -- 11 11 11

Capacity Building(Non-Degree Training)
►► GISGIS►► ModelingModeling
Water Evaluation And PlanningWater Evaluation And PlanningTradeTrade--Off Analysis (Soil CRSP) Off Analysis (Soil CRSP)
►► WorkshopsWorkshopsWomen Leaders’Women Leaders’Stakeholders’ Stakeholders’
►► Fish Pond Construction TechniquesFish Pond Construction TechniquesMukeuMukeu Community GroupCommunity Group

Linkages►Ministry of Water & Irrigation►Ministry of Environment & Natural
Resources►Department of Meteorology►ICRAF ►PARIMA►Soil – and Aquaculture CRSPs► KARI►Friends of Mau (FOMAWA)►MAWOO
Outreach Presentations
►Foreign Missions – Egyptian, German Exchange Service (DAAD)
►Ministry of Water & Irrigation►Ministry of Water Resources Development►World Bank►UNDP/GEF►East African-Austrian Water Association►Egerton University Council►Universities in US & Kenya

Publications
►►6 Technical Reports6 Technical Reports►►20 Draft Research Briefs20 Draft Research Briefs►►5 poster presentations5 poster presentations►►20 Workshops/Conferences attended and 20 Workshops/Conferences attended and
preliminary SUMAWA results presentedpreliminary SUMAWA results presented

Emerging Issues
►► Policy and legal changesPolicy and legal changesWater Act of 2002Water Act of 2002Removal of people from Removal of people from gazettedgazetted areasareas
►► Uncertainty in climateUncertainty in climate►► Role of groundwater & Role of groundwater &
interesting hydrologyinteresting hydrology►► High variability in landscape High variability in landscape
and economic dynamicsand economic dynamicsObserved through remote Observed through remote sensing & GIS and linked to sensing & GIS and linked to PRA outcomesPRA outcomes
Timing of Njoro Rainy Seasons
1
3
5
7
9
11
1949 1959 1969 1979 1989 1999
year
mon
th long rainswest rainsshort rains
0
20
40
60
80
100
120
140
160
0 5 10 15 20 25 30 35 40
Runoff Day
Dis
char
ge (c
ms)
#
#

Next steps
►► Transform scientific findings into nonTransform scientific findings into non--technical technical materialsmaterials
►► Revisit science objectives to ensure alignment with Revisit science objectives to ensure alignment with biophysical and human observationsbiophysical and human observations
►► Longitudinal and tiered workshopsLongitudinal and tiered workshops►► Integrated modeling and decision supportIntegrated modeling and decision support
Linked outputs Linked outputs watershed model (conceptual watershed model (conceptual and quantitative)and quantitative)

Overview
►► MultiMulti--disciplinary research effort aimed at disciplinary research effort aimed at integrating stakeholder involvement with basic and integrating stakeholder involvement with basic and applied research for sustainable watershed applied research for sustainable watershed managementmanagement
►► LongLong--term: term: (A) regional center of excellence in spatial analysis and (A) regional center of excellence in spatial analysis and watershed characterization to support stakeholderswatershed characterization to support stakeholders(B) Njoro will serve as a demonstration of effective (B) Njoro will serve as a demonstration of effective integrative solutions in East & Central Africa. integrative solutions in East & Central Africa.

Visit us on the web:www.sumawa.orgsumawa.photosite.com