sulogtra final report - europa - trimis
TRANSCRIPT

Supply ChainManagementLogisticsand their effects onTransport
SULOGTRATRA
LOG
SU
Final Publishable Report
SULOGTRA - Effects on Transport of Trends in
Logistics and Supply Chain Management -
Project funded by the EuropeanCommunity under the ‘Competitiveand Sustainable Growth’ Programme(1998-2002)
Project Co-ordinator: Technical University of Berlin, Logistics Department, Germany
Project Partners:Heriot-Watt University, United KingdomCranfield University, United Kingdom Louis Berger S.A., FranceNetherlands Economic Institute, The NetherlandsResearch Centre of Athens University of Economics and Business, Greece Templeton College, United KingdomTIS.pt – Consultores em Transportes Inovação e Sistemas, PortugalZentrum für Logistik und Unternehmensplanung GmbH, Germany

Effects on Transport of Trends in Logistics and Supply Chain Management Supply ChainManagementLogisticsand their effects onTransport
SULOGTRATRA
LOG
SU
2
1. Table of Contents 1. Table of Contents ............................................................................................................... 2 2. Executive Publishable Summary........................................................................................ 4 3. Scientific and technical Description of the Results ............................................................ 5
3.1. Introduction.................................................................................................................... 5 3.2. Transport-related Aspects of SULOGTRA .................................................................... 5
3.2.1. Analysis of Trends in Logistics and Supply Chain Management .......................... 5 3.2.2. Analysis of Impacts on Freight Transport ............................................................ 11 3.2.3. Analysis of Decision-making Process.................................................................. 22 3.2.4. Conclusions .......................................................................................................... 25
3.3. Supply Chain-related Section, resulting in Case Studies ............................................. 25 3.3.1. Supply Chain Metrics, Mapping Tools, and Benchmarking................................ 25 3.3.2. Supply Chain Optimisation and Best Practice ..................................................... 27 3.3.3. Analysis of Value Creation in Supply Chains ...................................................... 29 3.3.4. Supply Chain Case Studies................................................................................... 31 3.3.5. Conclusions .......................................................................................................... 37
3.4. Policy Implications and Advice ................................................................................... 37 3.4.1. Background .......................................................................................................... 37 3.4.2. EU-Policy Analysis .............................................................................................. 38 3.4.3. Conclusions .......................................................................................................... 41
4. Exploitation and Dissemination of Results ...................................................................... 42 4.1. SULOGTRA Website................................................................................................... 42 4.2. Consortium Activities................................................................................................... 42
5. Project Result and Conclusions ........................................................................................ 46 6. Acknowledgements .......................................................................................................... 47
Effects on Transport of Trends in Logistics and Supply Chain Management Supply ChainManagementLogisticsand their effects onTransport
SULOGTRATRA
LOG
SU
3
Figures and Tables
Figure 1: Overview of the structure of SULOGTRA Figure 2: Interrelation among drivers, trends and the freight transport systems operations Figure 3: Methodological framework for the development and assessment of supply chain
management / logistics systems future development scenarios Figure 4: Hierarchical decomposition of the evaluation problem Figure 5: Standard supply chain scheme Figure 6: Sources of best practice dissemination Figure 7: A typical location decision process Figure 8: Degree of integration in supply chains on a European level Figure 9: Collaboration in supply chains on a European level Figure 10: Communication with supply chain partners Figure 11: Transport optimisation in European supply chains Figure 12: Collaborative product development Figure 13: Configuration of contract relations in supply chains Figure 14: Joint SULOGTRA - PROTRANS web site - project introduction page and navigation
bar Table 1: The STEEP drivers Table 2: Logistics trends Table 3: Development of the SCM / logistics trends within the various industrial sectors Table 4: SCM trends influencing the development of the Load Factor within the different
sectors, transport modes and types of movement Table 5: SCM trends influencing the development of the Average Length of Haul within the
different sectors, transport modes and types of movement Table 6: SCM trends influencing the development of the Handling Factor within the different
sectors, transport modes and types of movement Table 7: SCM trends influencing the development of Lead Time within the different sectors,
transport modes and types of movement Table 8: SCM trends influencing the development of Empty Runs within the different sectors,
transport modes and types of movement Table 9: SCM trends influencing the development of Mode Share within the different sectors,
transport modes and types of movement Table 10: Future Development of FTS Indicators for Road Transport Table 11: Future Development of FTS Indicators for Road Transport Table 12: Future Development of FTS Indicators for Rail Transport Table 13: Future Development of FTS Indicators for Water Transport Table 14: Future Development of FTS Indicators for Air Transport Table 15: Interrelationship between key business decisions and freight transport variables

Effects on Transport of Trends in Logistics and Supply Chain Management Supply ChainManagementLogisticsand their effects onTransport
SULOGTRATRA
LOG
SU
4
2. Executive Publishable Summary SULOGTRA is one of the projects belonging to the research programme “Competitive and Sustainable Growth” set up by the European Community. The project was concerned with societal needs and improving methods for the efficiency of logistics operations and transport systems. The project supports efforts to raise the competitiveness of the European industry by examining ways to promote supply chain integration. The SULOGTRA project lasted two years, from January 2000 to December 2001. In that time it accomplished its two main objectives. One was the analysis of the effects of supply chain and logistics trends on the transport system. The other was the assessment of opportunities for improving supply chain performance. These objectives were achieved in nine Work Packages. The achievements of the first three Work Packages are the identification of logistics and supply chain trends and the examination of the decision making process. These included the investigation of underlying drivers of the trends and the development of scenarios within the different sectors for the following ten years. To draw a comparison of experiences in logistics and supply chain management the situation in Asia and the US was analysed. The examination of the decision-making process showed possibilities of moving the transport decision upstream in the production cycle to the design phase. Different parameters such as supply chain metrics, mapping tools and benchmarking techniques have been developed as the basis for possible improvement of supply chains. A basic requirement of that step was the identification of key performance indicators. Work Packages four, five and six achieved the final preparations for the supply chain case studies performed in Work Package seven. The fourth Work Package developed supply chain management metrics, mapping tools and benchmarking procedures. Market research was performed on existing supply chain management studies and software tools. Then an individual set of supply chain indicators was developed and presented in a data base model which allows the collection, analysis and mapping of logistics data for the planned case studies. The goals of Work Package five are to establish and disseminate of best practice. The optimisation goals in logistics and supply chain management were reviewed from private company and public policy perspectives, based on the key performance indicators developed in Work Package four. The currently used quantitative optimising techniques were critically evaluated, and a method was developed for assessing the potential for supply chain improvement for application and testing in the case studies. Work Package six investigated the process of value creation in supply chains and the relationship between logistical activities and economic development. The work of all previous Work Packages culminated in Work Package seven, which comprised the supply chain case studies. The data collection for the case studies was performed in a multiple loop process, which involved finding an Original Equipment Manufacturer and the companies both up and downstream in the chain and interviewing each company. Companies were questioned on such subjects as supply chain integration and collaboration, the application of information and communication technologies, network optimisation and transport optimisation. The companies examined in Work Package seven receive the benchmarking results and some advice on optimisation potentials. The purpose of Work Package nine was the dissemination of information, which was accomplished through the installation of a web site and internal information flow. Can be accessed via the joint PROTRANS and SULOGTRA web presence at www.logistik.tu-berlin.de/sulogtra+protrans.

Effects on Transport of Trends in Logistics and Supply Chain Management Supply ChainManagementLogisticsand their effects onTransport
SULOGTRATRA
LOG
SU
5
3. Scientific and technical Description of the Results
3.1. Introduction The SULOGTRA project began in January 2000 and lasted two years. Its objectives were to analyse the effects of current trends in logistics and supply chain management on the transport system and to assess opportunities to improve supply chain performance. To achieve those objectives, the project was divided into three parts. The first section comprised the first three Work Packages and dealt with transport. Work Packages four through seven made up the second section, which handles the examination of supply chains, culminating in the case studies in Work Package seven. The final section assessed and exploited the results of the project and comprised Work Packages eight and nine. An overview of the structure is shown in Figure 1.
Figure 1: Overview of the structure of SULOGTRA (WP = Work Package)
3.2. Transport-related Aspects of SULOGTRA
3.2.1. Analysis of Trends in Logistics and Supply Chain Management One of the major objectives of the SULOGTRA project was to analyse the trends in supply chain management and logistics in Europe and their underlying drivers. This analysis builds the foundation for an assessment of the changes in the European logistics system over the next ten to fifteen years with a special emphasis on matters relevant to transport. In order to identify the major drivers and enablers of logistics and supply chain management trends within a variety of different sectors, the environment of the existing logistics systems was examined, whereby the interrelation among these trends and between the trends and their underlying drivers was analysed. In the result, sector-specific scenarios were constructed to forecast the future shape of logistics systems in Europe. The scenario construction was supported by case studies showing the experiences of leading edge companies.
4WP 1: Analysis of trends in logistics and supply chain management4WP 2: Analysis of decision-making processes4WP 3: Analysis of impacts on freight transport
4WP 4: Supply chain metrics, mapping tools andbenchmarking
4WP 5: Supply chain optimisation and best-practice4WP 6: Analysis of value creation in the supply chain4WP 7: Supply chain case studies
4WP 8: Policy implications and advice4WP 9: Exploitation and dissemination

Effects on Transport of Trends in Logistics and Supply Chain Management Supply ChainManagementLogisticsand their effects onTransport
SULOGTRATRA
LOG
SU
6
Figure 2 shows the interrelation among drivers, trends and the freight transport system operations, as they were examined in the first three Work Packages of the project.
DRIVERSLOGISTICS/
SCM
TRENDS
FREIGHTTRANSPORT
SYSTEMSOPERATIONS
DIRECT IMPACT
FEEDBACK
Figure 2: Interrelation among drivers, trends and the freight transport systems operations
As a starting point existing results from previous research projects such as REDEFINE and TRILOG were reviewed. In both projects logistics trends were part of the research objectives. The way in which the results should be used in the SULOGTRA project was outlined, and the differences between the aims of the projects were shown. Based on this literature review a systematisation was undertaken in order to structure the system of trends and their underlying drivers reshaping the logistics system. In this context it was decided first to define a number of categories of drivers and later on to fill these categories with developments observed and considered as impacting logistics trends in terms of their direction and intensity. So, these drivers were considered to be external factors affecting logistics practices. Here, the categories of social, technological, economic, environmental and political drivers (STEEP) were established. As previously mentioned, the logistics trends were adopted from the results of the REDEFINE and the TRILOG projects. But there were still differences to those listed in the previous results. They represented a consolidation of key logistics trends in Europe, the US and Asia. Since it became obvious that some management trends of these lists should rather be interpreted as drivers, a distinction was made between logistics and management trends to get a clear structure for the driver analysis and the subsequent scenario development. The logistics trends considered were those that change the geographical and temporal scale of logistics systems and the management trends those that change management structures within and between companies. So, those management trends that were considered as drivers were included in the STEEP approach in the economical driver section. The drivers described here serve as a basis for the examination of the causes of logistics and supply chain management trends. Table 1 shows a list of the STEEP drivers.

Effects on Transport of Trends in Logistics and Supply Chain Management Supply ChainManagementLogisticsand their effects onTransport
SULOGTRATRA
LOG
SU
7
STEEP - level Drivers Economic, industrial, management Changes in GDP Interest rates Intra and extra European trade levels Concentration of industry / services Globalisation of industry / services Shift from industrial to service sector Proliferation of product types Organisational re-structuring Supply chain integration Mass customisation and customer integration Outsourcing of non-core activities Increased use of information and communication technology Technological Information technology advancement ICT integration and development of logistics decision
supporting software Evolution of data transmitting technologies Network infrastructures Data interchange standards Identification systems Telematics Standardisation of loading units Increase of capacities in intercontinental transport Drive and vehicle technologies Automation of warehouses Automation of in-house transport Political Privatisation of tasks and financing Growth of an agreement culture Harmonisation and regulations of laws Introduction of circular flow economy acts Transport industry deregulation Social Increase in the total population in the EU15 Changes in working hours and leisure time Changes within and between social hierarchies Increase in ICT use in the society Environmental Increased number of vehicle kilometres Increased attention for re-using (raw) materials
Table 1: The STEEP drivers
The trends affected by the variety of underlying drivers shown above are given here in Table 2, which is followed by a brief description in the subsequent paragraphs. Their major drivers are highlighted respectively. These trends form the major input for the scenario development undertaken in SULOGTRA and thus are the starting point of the assessment of the changes in European transport system:

Effects on Transport of Trends in Logistics and Supply Chain Management Supply ChainManagementLogisticsand their effects onTransport
SULOGTRATRA
LOG
SU
8
Level of logistics decision making Trend Restructuring of logistics systems Spatial concentration of production Spatial concentration of inventory Creation of hub-satellite networks Development of break-bulk / transhipment
systems Realignment of supply chains Vertical disintegration of production Rationalisation of the supply base Postponement / local customisation Increased direct delivery Wider distribution of finished products Wider geographical sourcing of supplies Concentration of international trade on hub ports Rescheduling of product flows Time-compression principles applied in retail and
manufacturing Growth of 'nominated day' deliveries and timed
delivery systems Reverse logistics Management of transport resources Changes in freight modal split Reduction in international transport cost Changes in product design Modularity
Table 2: Logistics trends
The spatial concentration of production has resulted in a reduction of the total number of factories or involved greater specialisation. The focus in many sectors was moved from nationally-based production to single locations producing a particular product for the whole of the continent or even for the world market. Transport costs have a big impact on the optimal number of production sites. Therefore drivers lowering them are influencing this trend, e.g. the deregulation of transport industries as well as the automation of in-house transport. The spatial concentration of inventory has been one of the most pronounced trends in logistics over the last decades. A reduced number of stockholding points can yield a large financial benefit much bigger than the additional transport cost they have to handle. The most important drivers enabling companies to operate central warehouses are the advances in information technologies and supply chain integration. Both of them tremendously increase the speed of the transport process and therefore shorten the time of storage. This trend can be observed in the US and Asia as well. The development of break-bulk and transhipment systems is closely related to the other two. When centralising inventory a network of non-stockholding, break-bulk facilities are needed to maintain the efficiency of transport. In this way companies can profit from the cost savings. Standardised loading units and the automation of in-house transport are drivers which keep the speed of the break-bulk systems on a high level and improve the operation processes within them. The harmonisation of regulations and laws gives companies more opportunities to take advantage of special areas. The creation of hub-satellite systems has mainly occurred in parcel and mail delivery systems. The sorting operations in particular are being improved since the freight has to be collected from and delivered to numerous, widely-spread sources. Technologies providing efficient goods and information flows are driving this trend, which can also be seen in other parts of the world. It has also been adopted within other sectors and carriers. Other drivers are customer-focussed integration and the use of internet, which are enlarging the number of sources and goods being transported. The vertical disintegration of production is a result of the concentration of core competencies of many firms. The vertical disintegration of production allows companies to reduce the risks of sector-specific instabilities in demand. Its implementation into the process of production is supported by attempts at

Effects on Transport of Trends in Logistics and Supply Chain Management Supply ChainManagementLogisticsand their effects onTransport
SULOGTRATRA
LOG
SU
9
improved supply chain integration and therefore re-organisation. Technologies supporting this trend are logistics decision software and data interchange standards allowing respective data flows. By rationalising the supply base companies are lowering their transaction cost. Therefore suppliers are delivering the logistics and transport services needed to operate the material flow on a higher level. This trend can especially be observed in the automotive industry and the chemical / fertilisers sector. Postponement or deferred customisation helps the companies achieve the flexibility they need to respond to the fast-changing demands of the market. Especially tasks being performed at the end of the production process such as labelling or wrapping are being moved to manufacturing and logistics sub-contractors. Inventory costs are being reduced. Drivers encouraging this trend speed up the handling of products between the different locations, for example identification systems or homogeneous products. An increase in direct delivery is related to the concentration of production and inventory. It enables manufacturers to bypass wholesale and retail channels and therefore reduce cost. Telematics support this trend as well, as do supply chain integration and identification systems. The wider geographical sourcing of supplies and wider distribution of finished products is extending the companies' supply lines upstream and downstream. Differences in purchasing and manufacturing or labour cost are the main reason for global sourcing strategies. Drivers influencing this trend support the cost savings such as information technologies or supply chain integration. The wider distribution is caused by the globalisation of culture, e.g. via the internet. The concentration of international trade on hub ports and airports can be observed in the US and Asia but not in Europe. These hub ports hold a higher share of total transhipment. The hub and spoke systems are the main drivers of this trend. An increased transport demand is also caused by outsourcing trends and deregulation. Even though fewer transports are needed because of the concentration those main routes can only be efficient through the use of high capacity handling equipment. The application of time compression principles in retailing and manufacturing includes management principles such as JIT, lean production and efficient consumer response. Their objective is not only to reduce delivery times and therefore transport and inventory cost but also the time to market of new products. The drivers influencing this trend are speeding up the flow of material. These are, for example, the automation of warehouses, identification systems and network infrastructures. Nominated day deliveries and timed deliveries help firms achieve much higher levels of transport efficiency. Therefore they are introduced by more and more firms. The concentration of deliveries could result in significant reductions of traffic levels and transport cost. It becomes more and more important in the industrial sectors. Drivers supporting this process are telematics and the automation of in-house transport. The fast delivery is brought about by the increase in individualisation and the purchase via the internet. Reverse logistics manage the return of products back along the supply chain. These products can be used consumer products, refused new products or packaging waste. These products or their materials may be re-used, recycled or disposed of. The establishment of reverse logistics is driven by an increase in attention to the environment and resources and the problems resulting from mass customisation. The basic direction of the changes in freight modal split have favoured road transport. This is reflected in its increasing share of the freight market. Changing cost structures due to trucking deregulation supported this trend, as did the standardisation of loading units. The railway sector has been penalised by the different technological systems within European countries. International transport costs have been declining because carrying capacities have expanded and transport operators could take advantage of larger economies of scale. Telematics and the
Effects on Transport of Trends in Logistics and Supply Chain Management Supply ChainManagementLogisticsand their effects onTransport
SULOGTRATRA
LOG
SU
10
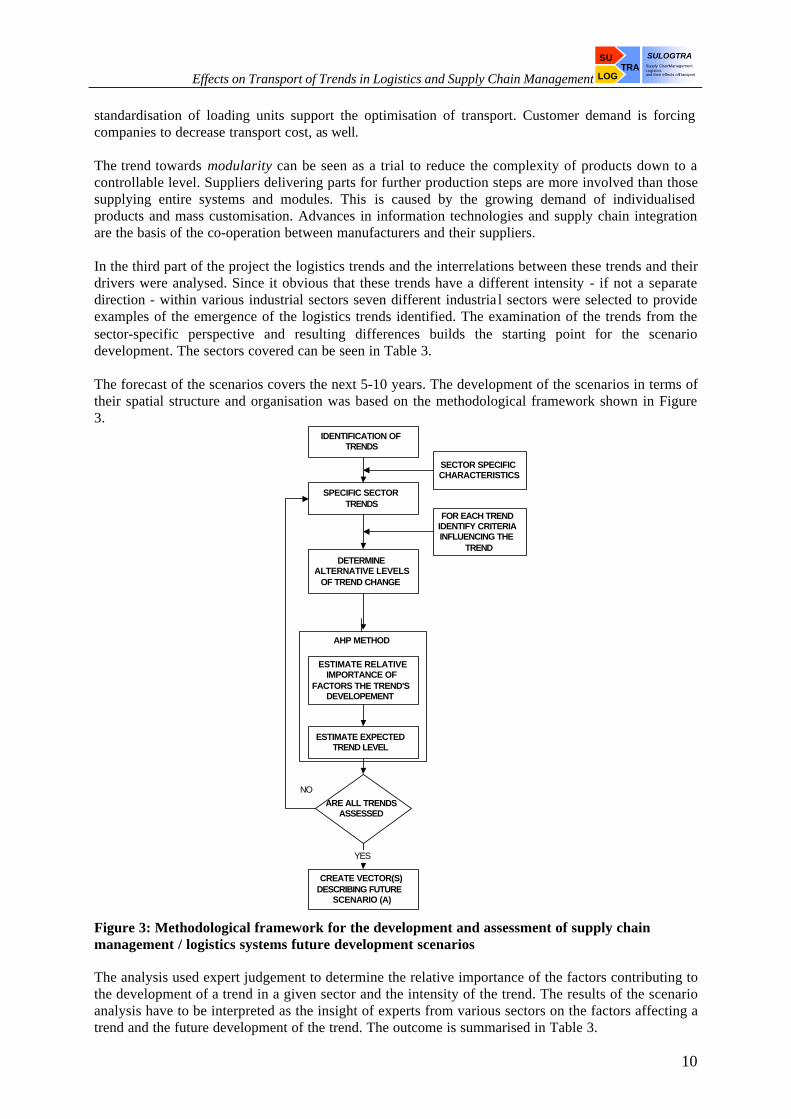
standardisation of loading units support the optimisation of transport. Customer demand is forcing companies to decrease transport cost, as well. The trend towards modularity can be seen as a trial to reduce the complexity of products down to a controllable level. Suppliers delivering parts for further production steps are more involved than those supplying entire systems and modules. This is caused by the growing demand of individualised products and mass customisation. Advances in information technologies and supply chain integration are the basis of the co-operation between manufacturers and their suppliers. In the third part of the project the logistics trends and the interrelations between these trends and their drivers were analysed. Since it obvious that these trends have a different intensity - if not a separate direction - within various industrial sectors seven different industria l sectors were selected to provide examples of the emergence of the logistics trends identified. The examination of the trends from the sector-specific perspective and resulting differences builds the starting point for the scenario development. The sectors covered can be seen in Table 3. The forecast of the scenarios covers the next 5-10 years. The development of the scenarios in terms of their spatial structure and organisation was based on the methodological framework shown in Figure 3.
IDENTIFICATION OFTRENDS
SPECIFIC SECTORTRENDS
DETERMINEALTERNATIVE LEVELS
OF TREND CHANGE
ESTIMATE EXPECTEDTREND LEVEL
CREATE VECTOR(S)DESCRIBING FUTURE
SCENARIO (A)
ARE ALL TRENDSASSESSED
SECTOR SPECIFICCHARACTERISTICS
FOR EACH TRENDIDENTIFY CRITERIAINFLUENCING THE
TREND
YES
NO
ESTIMATE RELATIVEIMPORTANCE OF
FACTORS THE TREND'SDEVELOPEMENT
AHP METHOD
Figure 3: Methodological framework for the development and assessment of supply chain management / logistics systems future development scenarios
The analysis used expert judgement to determine the relative importance of the factors contributing to the development of a trend in a given sector and the intensity of the trend. The results of the scenario analysis have to be interpreted as the insight of experts from various sectors on the factors affecting a trend and the future development of the trend. The outcome is summarised in Table 3.

Effects on Transport of Trends in Logistics and Supply Chain Management Supply ChainManagementLogisticsand their effects onTransport
SULOGTRATRA
LOG
SU
11
Expected Level of Change of SCM / Logistics Trends within the Various Industrial Sectors Trends Building
Materials Waste Chemicals &
Fertilisers Machinery Food &
Beverage Petrol & Petrol Products
Parcel
L M H L M H L M H L M H L M H L M H L M H Spatial concentration of production
√ √ √ √
Spatial concentration of inventory
√ √ √ √ √
Development of break-bulk systems
√ √ √ √
Development of hub-satellite systems
√ √ √
Vertical disintegration of production
√*
Postponement √ √ √ Rationalisation of the supply base
√ √ √
Increase in direct deliveries
√ √ √* √
Wider geographical sourcing and distribution
√ √ √ √ √
Concentration of international trade on hub ports and airports
√
√
Application of time compression principles
√ √ √
Nominated day deliveries & time delivery systems
√
√
√
√
√
Changes in freight modal split
√ √ √ √ √
Reverse logistics √ √ √ √ √ L: Low Increase, M: Medium Increase, H: high Increase * There is a decrease of the trend within the sector. The alternative levels of decrease considered are respective to those of increase
Table 3: Development of the SCM / logistics trends within the various industrial sectors
3.2.2. Analysis of Impacts on Freight Transport The SULOGTRA project team used the information attained through the analysis of the logistical and supply chain trends to investigate the effects of those trends on the European freight transport system and the market for third-party logistics services and to predict the future development of the freight transport system. The effects of the supply chain management and logistics trends on the freight transport utilisation characteristics were examined, and with the help of that information freight transport indicators were found. Those indicators were then evaluated to identify the most appropriate freight transport system indicators. These indicators are: • Average length of haul, • Handling factor, • Lead-time, • Load factor, • Percentage of kilometres driven empty, • Mode share and • Loading capacity. Then the interrelations between the supply chain management and logistics trends and the freight transport indicators were examined, and applied to several industrial sectors. Each sector was assigned to one or more experts who were responsible for providing all necessary information for the performance of the assessment. It was necessary to identify the applicable indicators for each

Effects on Transport of Trends in Logistics and Supply Chain Management Supply ChainManagementLogisticsand their effects onTransport
SULOGTRATRA
LOG
SU
12
combination to forecast their development. The experts identified the expected direction of change for each indicator. A qualitative evaluation process was chosen as a model, since it is very difficult to obtain data for the measurement of the supply chain management and logistics trends. Three scenarios were constructed for each indicator, i.e. a low, a medium and a high change scenario. A final conclusion of the development was reached by a hierarchical decomposition of the problem. This procedure is explained in Figure 4.
ESTIMATION OFTHE INCREASE OF
INDICATOR I
10% INCREASE OFTREND X
15% INCREASE OFTREND Y
10% INCREASE OFTREND V. . .
HIGH INCREASEOF INDICATOR I
MEDIUM INCREASEOF INDICATOR I
LOW INCREASE OFINDICATOR I
Figure 4: Hierarchical decomposition of the evaluation problem
This allowed the effects of several criteria to be examined on a variety of sectors. Table 4 presents the Supply Chain Management trends that most heavily influence the development of the load factor in the different sectors for the different types of movement and transport modes. The trends are ranked according to their relative importance to the development of the indicator, i.e. the first trend is the one with the highest contribution to the development of the indicator, the second is the second most important, etc.
Trans-port
Load Factor
Modes Food & Beverages
Machinery Petrol Building Materials
Waste Parcels
PD SD PD SD N IN N/IN SH LH N IN Road-way
SCI SCP RSB
SCI SCPDBBTS
DBBTS TCP DHSS
DBBTS TCP DHSS
DD SCI WGSD
SCI WGSD
RSB DD NDD
NDD DBBTS DHSS SCI
NDD NDD
Railway N/A N/A N/A N/A DD SCI WGSD
WGSD SCI
N/A N/A DBBTS DHSS WGSD SCI
N/A N/A
Water-way
N/A N/A N/A N/A SCI DD WGSD
SCI WGSD
N/A N/A DBBTS DHSS WGSD SCI
N/A N/A
Air N/A N/A DHSS TCP POST
TCP DHSS POST
N/A N/A N/A N/A N/A NDD NDD
Pipeline N/A N/A N/A N/A N/A N/A N/A N/A N/A N/A N/A
SCI: Spatial Concentration of Inventory, SCP: Spatial Concentration of Production, WGSD: Wider geographical Sourcing of supplies and Distribution of finished goods, DBBTS: Development of Break-Bulk/Transshipment Systems, DHSS: Development of Hub Satellite Systems, RSB: Rationalization of the Supply Base, RL: Reverse Logistics, POST: Postponement, DD: Direct Deliveries, NDD: Growth of Nominate Day Deliveries and Time Delivery Systems, TCP: Application of Time Compression Principles in Retailing and Manufacturing, CHPA: Concentration of International trade in Hub Ports and Airports, VDP: Vertical Disintegration of production, N/A: Not Applicable, N/C: Not changed, N/S: Not specified
Table 4: SCM trends influencing the development of the Load Factor within the different sectors, transport modes and types of movement

Effects on Transport of Trends in Logistics and Supply Chain Management Supply ChainManagementLogisticsand their effects onTransport
SULOGTRATRA
LOG
SU
13
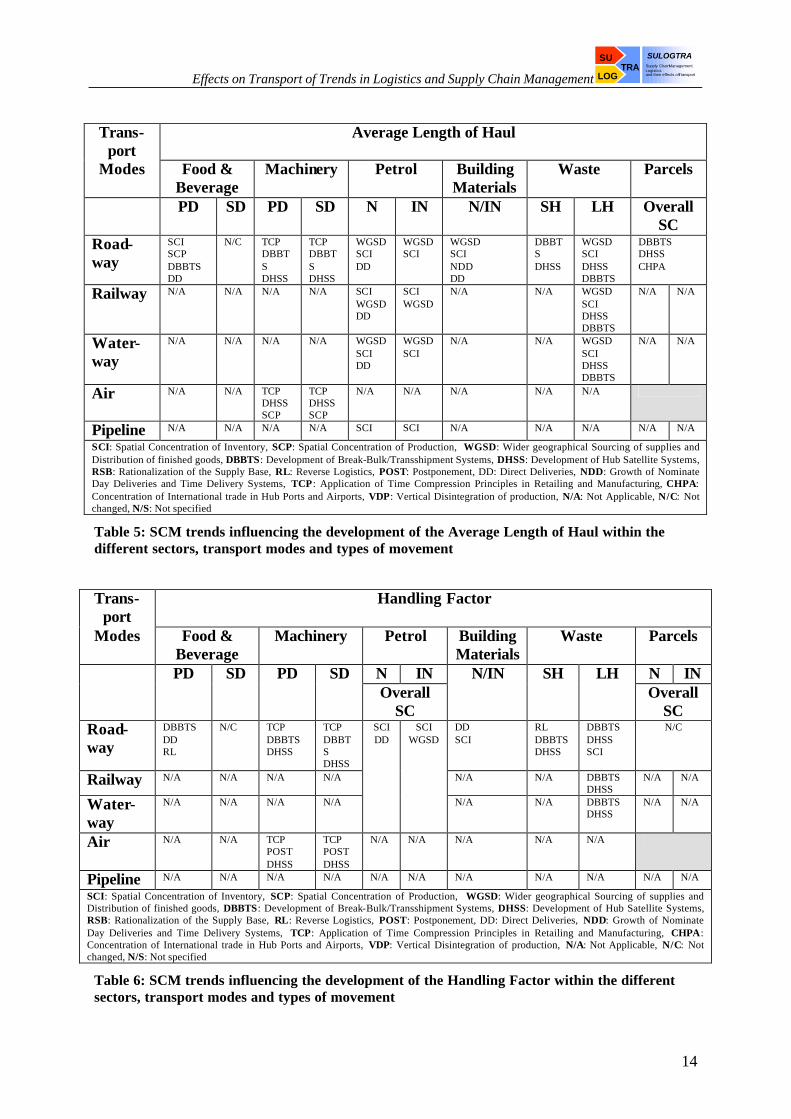
The trends influencing the development of the indicator belong to two broad categories: i) trends that influence the pattern of distribution i.e. direct deliveries, and ii) trends that influence the transport/distribution system network configuration, i.e. the development of break-bulk transhipment systems, the spatial concentration of inventory, postponement, etc. The extent and the direction that these two categories of trends influence the development of an indicator is highly dependent on the industrial sector it refers to. For example Nominated Day Deliveries and Time Delivery systems contribute substantially to the development of the load factor in the Parcel sector since they allow the scheduling of distribution in both directions of movement, such as to have economies of scale to vehicles, while the same trend in the Building Materials sector tends to decrease the Load Factor since firstly, backhauling is not applicable in this sector, and secondly, it is very difficult to combine distribution to different locations due to the size and shape of goods. The Development of Break-Bulk Systems highly influences the load factor in the Waste sector, since it allows the transport of larger quantities of waste to / from them, while it has no influence at all in the Building Materials sector. Another example is the Spatial Concentration of Inventory or of Production which highly encourages the development of economies of scale in vehicle use due to either: i) the increased distance that they have to be transported, or ii) the development of consolidation centres in between. In sectors of fast-moving high-value products with special characteristics, like office equipment (Machinery sector), Load factor is influenced by trends like Postponement and Time Compression principles that lead to the frequent movement of smaller quantities of goods, i.e. a lower load factor. The Supply Chain Management trends that influence the development of the Average Length of Haul within the different sectors is presented below in Table 6-2. The Average Length of Haul is influenced mainly by trends that affect the configuration of the transport/distribution network like the Development of Break-Bulk/Transhipment Systems, the Wider Geographical Sourcing and Distribution, etc., as well as trends that lead to the reconfiguration of the supply chain network, like Postponement, which usually leads to extra intermediate nodes in the network, or Time Compression Principles which may have either the same result as Postponement or they may lead to Direct Deliveries, etc. The way that the Supply Chain Management trends influence the development of the Average Length of Haul is subject to the sector and the characteristics of the product. However in reviewing Table 5 the dominant role of the Spatial Concentration of Production and Inventory as well as the Wider Geographical Sourcing of Supplies and Distribution of Finished Goods is apparent.
Effects on Transport of Trends in Logistics and Supply Chain Management Supply ChainManagementLogisticsand their effects onTransport
SULOGTRATRA
LOG
SU
14
Trans-
port Average Length of Haul
Modes Food & Beverage
Machinery Petrol Building Materials
Waste Parcels
PD SD PD SD N IN N/IN SH LH Overall SC
Road-way
SCI SCP DBBTS DD
N/C TCP DBBTS DHSS
TCP DBBTS DHSS
WGSD SCI DD
WGSD SCI
WGSD SCI NDD DD
DBBTS DHSS
WGSD SCI DHSS DBBTS
DBBTS DHSS CHPA
Railway N/A N/A N/A N/A SCI WGSD DD
SCI WGSD
N/A N/A WGSD SCI DHSS DBBTS
N/A N/A
Water-way
N/A N/A N/A N/A WGSD SCI DD
WGSD SCI
N/A N/A WGSD SCI DHSS DBBTS
N/A N/A
Air N/A N/A TCP DHSS SCP
TCP DHSS SCP
N/A N/A N/A N/A N/A
Pipeline N/A N/A N/A N/A SCI SCI N/A N/A N/A N/A N/A
SCI: Spatial Concentration of Inventory, SCP: Spatial Concentration of Production, WGSD: Wider geographical Sourcing of supplies and Distribution of finished goods, DBBTS: Development of Break-Bulk/Transshipment Systems, DHSS: Development of Hub Satellite Systems, RSB: Rationalization of the Supply Base, RL: Reverse Logistics, POST: Postponement, DD: Direct Deliveries, NDD: Growth of Nominate Day Deliveries and Time Delivery Systems, TCP: Application of Time Compression Principles in Retailing and Manufacturing, CHPA: Concentration of International trade in Hub Ports and Airports, VDP: Vertical Disintegration of production, N/A: Not Applicable, N/C: Not changed, N/S: Not specified
Table 5: SCM trends influencing the development of the Average Length of Haul within the different sectors, transport modes and types of movement
Trans-
port Handling Factor
Modes Food & Beverage
Machinery Petrol Building Materials
Waste Parcels
PD SD PD SD N IN N/IN SH LH N IN Overall
SC Overall
SC
Road-way
DBBTS DD RL
N/C TCP DBBTS DHSS
TCP DBBTS DHSS
DD SCI
RL DBBTS DHSS
DBBTS DHSS SCI
N/C
Railway N/A N/A N/A N/A N/A N/A DBBTS DHSS
N/A N/A
Water-way
N/A N/A N/A N/A
SCI DD
SCI WGSD
N/A N/A DBBTS DHSS
N/A N/A
Air N/A N/A TCP POST DHSS
TCP POST DHSS
N/A N/A N/A N/A N/A
Pipeline N/A N/A N/A N/A N/A N/A N/A N/A N/A N/A N/A
SCI: Spatial Concentration of Inventory, SCP: Spatial Concentration of Production, WGSD: Wider geographical Sourcing of supplies and Distribution of finished goods, DBBTS: Development of Break-Bulk/Transshipment Systems, DHSS: Development of Hub Satellite Systems, RSB: Rationalization of the Supply Base, RL: Reverse Logistics, POST: Postponement, DD: Direct Deliveries, NDD: Growth of Nominate Day Deliveries and Time Delivery Systems, TCP: Application of Time Compression Principles in Retailing and Manufacturing, CHPA: Concentration of International trade in Hub Ports and Airports, VDP: Vertical Disintegration of production, N/A: Not Applicable, N/C: Not changed, N/S: Not specified
Table 6: SCM trends influencing the development of the Handling Factor within the different sectors, transport modes and types of movement

Effects on Transport of Trends in Logistics and Supply Chain Management Supply ChainManagementLogisticsand their effects onTransport
SULOGTRATRA
LOG
SU
15
The trends contributing to the development of the Handling Factor are presented in Table 6 for all sectors, transport modes and types of movement considered in the project. The trends that led to the development of intermediate nodes within the transport / distribution network have the dominant role in the development of the Handling Factor. The Development of Break-Bulk/Transshipment Systems and Hub Satellite Systems are of major importance in most sectors involved either directly or indirectly since these two trends are also supported by / derived from the development of other trends like Spatial Concentration of Production/Inventory, Wider Geographical Sourcing and Distribution, or Postponement. An important contribution to the development of the indicator is also provided by the increase in Direct Deliveries which tends to decrease the Handling Factor. The trends contributing to the development of Lead Time are presented in Table 7. The development of the Lead Time is a rather complex process since lead time is the outcome of three time components the order processing time, the order execution time, and the order transport / distribution time. In this analysis the emphasis is on the last time interval which can be influenced by the Supply Chain Management trends considered. According to Table 7 Lead Time is influenced by those trends that increase the distances and the number of intermediate nodes of the transport / distribution network, i.e. Spatial Concentration of Production/Inventory, Development of Break Bulk Systems, etc., and trends that tend to speed up the total production-distribution process, like Postponement, the application of Time Compression principles in retailing and manufacturing, etc. Trans-
port Lead Time
Modes Food & Beverage
Machinery Petrol Building Materials
Waste Parcels
PD SD PD SD N IN N/IN SH LH N IN Road-way
TCP TCP TCP DBBTS DHSS
DBBTS TCP DHSS
DD SCI
SCI N/S RL DHSS DBBTS
WGSD SCI DBBTS DHSS
N/C N/C
Railway N/A N/A N/A N/A DD SCI
SCI N/A N/A WGSD SCI DBBTS DHSS
N/A N/A
Water-way
N/A N/A N/A N/A DD SCI
SCI WGSD
N/A N/A N/S N/A N/A
Air N/A N/A TCP DHSS WGSD
TCP DHSS WGSD
N/A N/A N/A N/A N/A N/C N/C
Pipeline N/A N/A N/A N/A N/A N/A N/A N/A N/A N/A N/A
SCI: Spatial Concentration of Inventory, SCP: Spatial Concentration of Production, WGSD: Wider geographical Sourcing of supplies and Distribution of finished goods, DBBTS: Development of Break-Bulk/Transshipment Systems, DHSS: Development of Hub Satellite Systems, RSB: Rationalization of the Supply Base, RL: Reverse Logistics, POST: Postponement, DD: Direct Deliveries, NDD: Growth of Nominate Day Deliveries and Time Delivery Systems, TCP: Application of Time Compression Principles in Retailing and Manufacturing, CHPA: Concentration of International trade in Hub Ports and Airports, VDP: Vertical Disintegration of production, N/A: Not Applicable, N/C: Not changed, N/S: Not specified
Table 7: SCM trends influencing the development of Lead Time within the different sectors, transport modes and types of movement
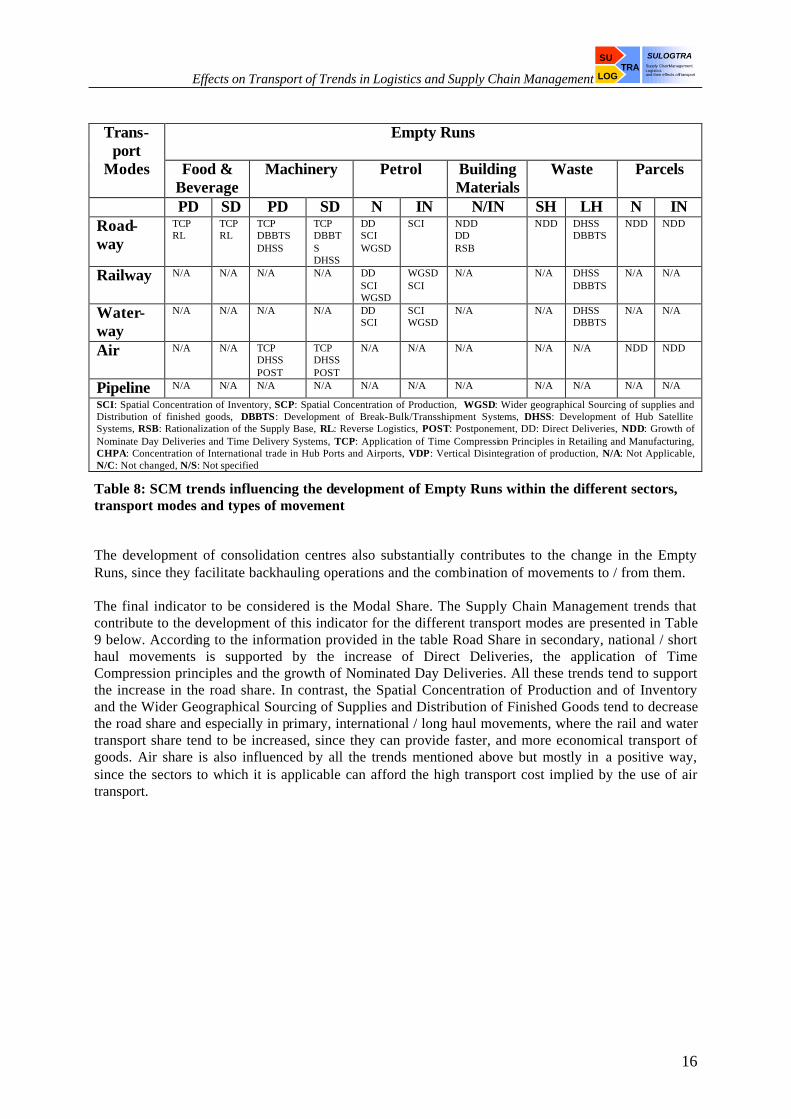
Table 8 presents the SCM trends that most heavily influence the development of the Empty Runs in the various sectors for different transport modes. Reverse Logistics has a dominant role in the applicable sectors, as well as trends that are related to patterns of distribution like Direct Deliveries or Nominated Day deliveries. In the case of Empty Runs as in the case of the Load Factor, the way that such trends impact the development of the indicator depends highly on the sector and on the characteristics of the goods transported. Substantial impact on the development of the Empty Runs is also generated by the application of Time Compression Princip les, which increases the frequency of movements.
Effects on Transport of Trends in Logistics and Supply Chain Management Supply ChainManagementLogisticsand their effects onTransport
SULOGTRATRA
LOG
SU
16
Trans-
port Empty Runs
Modes Food & Beverage
Machinery Petrol Building Materials
Waste Parcels
PD SD PD SD N IN N/IN SH LH N IN Road-way
TCP RL
TCP RL
TCP DBBTS DHSS
TCP DBBTS DHSS
DD SCI WGSD
SCI NDD DD RSB
NDD DHSS DBBTS
NDD NDD
Railway N/A N/A N/A N/A DD SCI WGSD
WGSD SCI
N/A N/A DHSS DBBTS
N/A N/A
Water-way
N/A N/A N/A N/A DD SCI
SCI WGSD
N/A N/A DHSS DBBTS
N/A N/A
Air N/A N/A TCP DHSS POST
TCP DHSS POST
N/A N/A N/A N/A N/A NDD NDD
Pipeline N/A N/A N/A N/A N/A N/A N/A N/A N/A N/A N/A
SCI: Spatial Concentration of Inventory, SCP: Spatial Concentration of Production, WGSD: Wider geographical Sourcing of supplies and Distribution of finished goods, DBBTS: Development of Break-Bulk/Transshipment Systems, DHSS: Development of Hub Satellite Systems, RSB: Rationalization of the Supply Base, RL: Reverse Logistics, POST: Postponement, DD: Direct Deliveries, NDD: Growth of Nominate Day Deliveries and Time Delivery Systems, TCP: Application of Time Compression Principles in Retailing and Manufacturing, CHPA: Concentration of International trade in Hub Ports and Airports, VDP: Vertical Disintegration of production, N/A: Not Applicable, N/C: Not changed, N/S: Not specified
Table 8: SCM trends influencing the development of Empty Runs within the different sectors, transport modes and types of movement
The development of consolidation centres also substantially contributes to the change in the Empty Runs, since they facilitate backhauling operations and the combination of movements to / from them. The final indicator to be considered is the Modal Share. The Supply Chain Management trends that contribute to the development of this indicator for the different transport modes are presented in Table 9 below. According to the information provided in the table Road Share in secondary, national / short haul movements is supported by the increase of Direct Deliveries, the application of Time Compression principles and the growth of Nominated Day Deliveries. All these trends tend to support the increase in the road share. In contrast, the Spatial Concentration of Production and of Inventory and the Wider Geographical Sourcing of Supplies and Distribution of Finished Goods tend to decrease the road share and especially in primary, international / long haul movements, where the rail and water transport share tend to be increased, since they can provide faster, and more economical transport of goods. Air share is also influenced by all the trends mentioned above but mostly in a positive way, since the sectors to which it is applicable can afford the high transport cost implied by the use of air transport.

Effects on Transport of Trends in Logistics and Supply Chain Management Supply ChainManagementLogisticsand their effects onTransport
SULOGTRATRA
LOG
SU
17
Trans-
port Mode Share
Modes Food & Beverage
Machinery Petrol Building Materials
Waste Parcels
PD SD PD SD N IN N/IN SH LH N/IN Road-way
N/C N/C DBBTS DHSS WGSD
DBBTS DHSS WGSD
DD WGSD SCI
DD WGSD NDD
N/C WGSD DHSS DBBTS SCI
CHPA NDD
Railway N/A N/A N/A N/A N/C SCI WGSD
N/A N/A WGSD DHSS DBBTS SCI
N/A
Water-way
N/A N/A N/A N/A N/C WGSD SCI
N/A N/A DHSS DBBTS SCI WGSD
N/A
Air N/A N/A DHSS WGSD TCP
DHSS WGSD TCP
N/A N/A N/A N/A N/A NDD CHPA
Pipeline N/A N/A N/A N/A SCI DD WGSD
SCI WGSD
N/A N/A N/A N/A
SCI: Spatial Concentration of Inventory, SCP: Spatial Concentration of Production, WGSD: Wider geographical Sourcing of supplies and Distribution of finished goods, DBBTS: Development of Break-Bulk/Transshipment Systems, DHSS: Development of Hub Satellite Systems, RSB: Rationalization of the Supply Base, RL: Reverse Logistics, POST: Postponement, DD: Direct Deliveries, NDD: Growth of Nominate Day Deliveries and Time Delivery Systems, TCP: Application of Time Compression Principles in Retailing and Manufacturing, CHPA: Concentration of International trade in Hub Ports and Airports, VDP: Vertical Disintegration of production, N/A: Not Applicable, N/C: Not changed, N/S: Not specified
Table 9: SCM trends influencing the development of Mode Share within the different sectors, transport modes and types of movement
The future development scenarios for the transport and distribution system on a sectoral basis provide information necessary for building scenarios for the future development of the various transport modes. Table 10 illustrates the expected scenarios for the development of the modal split within the different sectors for the different types of movement. The scenarios indicated in bold blue letters correspond to results that are not very consistent. To provide the reader with a complete picture of the analysis performed and of the derived results, however, it was considered appropriate to include these results. Please note that they are not being used to draw conclusions but just to reconfirm those that have been derived by the rest of the analysis. As can been seen from the table, the road share in all cases but Parcels tends to be increased for national movements. Even in Chemicals and Fertilisers the trend in the use of roadway transport in national movements is increasing. In general it can be said that there is a tendency to develop hub and spoke systems, which mainly combine road transport with air, rail and water in order to increase efficiency in distribution, leading to an increase in intermodal transport. Furthermore, for international movements of products like petrol, other more economical modes of transport are used, i.e. rail or ship. Therefore, the rail share for those applicable sectors, i.e. Wastes, Petrol and Chemicals is expected to increase for international / long haul movements of products.

Effects on Transport of Trends in Logistics and Supply Chain Management Supply ChainManagementLogisticsand their effects onTransport
SULOGTRATRA
LOG
SU
18
Future Development of the Modal Split Indica-
tors Food & Beverage
Parcels Building Materials
Waste Machi-nery
Petrol
Type of Movementts
PD SD N IN N IN SH LH PD SD N IN
Road Share
N/C N/C MDS MDS LIS LIS N/C MIS HIS HIS HIS MDS
Rail Share
N/A N/A N/A N/A N/A N/A N/A HIS N/A N/A N/C LIS
Air Share N/A N/A LIS LIS N/A N/A N/A N/A MIS HIS N/A N/A
Water Share
N/A N/A N/A N/A N/A N/A N/A LIS N/A N/A N/C LIS
Pipeline Share
N/A N/A N/A N/A N/A N/A N/A N/A N/A N/A LIS LIS
Acro-nyms
PD: Primary Distribution, SD : Secondary Distribution, N: National, IN: International, SH : Short Haul, LH : Long Haul, LIS: Low Increase Scenario, MIS: Medium Increase Scenario, HIS: High Increase Scenario, LDS : Low Decrease Scenario, MDS: Medium Decrease Scenario, HDS: High Decrease Scenario, N/C: Not Change, N/A: Not Applicable, N/S: Not Specified
Table 10: Future Development of FTS Indicators for Road Transport
Air share is also expected to increase in sectors where either high value products are being transported or high value services are being offered, i.e. office equipment sector, parcel sector, etc. Water transport share is also expected to increase in those sectors for which it is applicable, but only for long haul / international movements, i.e. petrol, wastes, chemicals, etc. Finally, pipeline share is expected to have only a low increase by the year 2010 due to the high-cost infrastructure required and its applicability only to certain goods, i.e. petrol. The expected development of the indicators for roadway transport within the different sectors involved in the analysis are presented in Table 11.

Effects on Transport of Trends in Logistics and Supply Chain Management Supply ChainManagementLogisticsand their effects onTransport
SULOGTRATRA
LOG
SU
19
Indicators Road Transport Future Development Scenarios
Food & Beverage
Parcels Building Materials
Waste Machinery Petrol
Type of Movemen
ts
PD SD N IN N IN SH LH PD SD N IN
Handling Factor
LIS N/C N/C2 MDS MDS MIS LIS LIS LIS LDS1
LIS1
Average Length of
Haul
LIS N/C LIS2 HIS HIS Missing HIS LDS LDS LIS MIS
Percen-tage km Driven Empty
LDS LDS LDS LDS HIS HIS N/C LIS LDS LDS LDS LDS
Load factor
LIS LIS LIS LIS MDS MDS N/C MIS LIS LIS LIS LIS
Lead Time
MDS LDS N/C N/C N/C N/C N/A MIS HDS HDS LDS LDS
Acronyms PD: Primary Distribution, SD : Secondary Distribution, N: National, IN: International, SH : Short Haul, LH: Long Haul, LIS: Low Increase Scenario, MIS: Medium Increase Scenario, HIS: High Increase Scenario, LDS: Low Decrease Scenario, MDS: Medium Decrease Scenario, HDS: High Decrease Scenario, N/C: Not Change, N/A : not Applicable, N/S: Not Specified
1 Handling factor is referred to the petrol supply chain in total and not only for road transport 2 Handling factor and Average Length of Haul are referred to the parcel supply chain in total and not only for road transport
Table 11: Future Development of FTS Indicators for Road Transport
Road transport is the dominant transport mode and it will remain as such. As revealed in the above analysis there are sectors in which road transport is practically the only mode used, i.e. Food and Beverage sector and Building Materials sector. Furthermore, secondary distribution of goods, i.e. the transport of goods from wholesalers to customers, is also performed mainly by road transport, or even in the case of multimodal transport, road is usually the mode interfacing with the customer. However, the geographical widening of markets, the rationalisation of the supply base and the concentration of production and inventory will, as a result, increase the distance and the size of the consignments. These characteristics result in an increase in the need for more cost-effective transport modes for long movements. This fact, in conjunction with the changes in the legal and institutional framework of rail and water transport which had as an effect the increase of performance and competitiveness of these modes, will lead to an increase in their share in long haul / primary distribution / international movements. The degree of the reduction of road transport and of the increase in the rest of the modes depends on the type of goods transported. Generally speaking one can claim that a low level of decrease is expected in road transport (i.e. 0-5%), while a low increase (i.e. around 5%) is expected in the share of each of the other transport modes. The handling factor is expected to increase in the sense that in most sectors there is going to be an increase of the use of Break-Bulk / Consolidation Systems and Hub Satellite Systems. In certain sectors (i.e. Building Materials and Petrol), and basically in domestic movements, the handling factor is expected to decrease due to the development of Direct Deliveries. The average length of haul is also expected to increase in all sectors and types of movements. Trends like spatial concentration of production and inventory are developing in almost all sectors. Furthermore, there is a wider geographical sourcing and distribution, an increase in direct deliveries, an increase in concentration in hub terminals, and an increase in the development of hub satellite systems, which inevitably lead to an increase in the average length of haul.

Effects on Transport of Trends in Logistics and Supply Chain Management Supply ChainManagementLogisticsand their effects onTransport
SULOGTRATRA
LOG
SU
20
An increase in vehicle utilisation is expected due to an increase in the load factor (see Table 5) in almost all sectors, and the decrease in the empty running of vehicles in most of the sectors. This increased utilisation and management of the vehicle fleet is being highly supported by the concentration of the freight transport network nodes, the development of break-bulk/consolidation systems, and the development of reverse logistics, which support the decrease of the empty runs. One can say according to Table 5 that a low decrease can be expected in empty running vehicles as well a low increase can be expected in the load factor by the year 2010. Table 12 presents the results of the assessment performed in order to identify the expected development of the various indicators for railway movements of goods within the different sectors.
Rail Transport Future Development Scenarios
Indicators Waste Petrol
Type of Movements SH LH N IN
Handling Factor N/A LIS LDS1 LIS1
Average Length of Haul
N/A HIS LIS MIS
Percentage km Driven Empty
N/A LIS LDS LDS
Load factor N/A MIS LIS LIS
Lead Time N/A MIS LDS LDS
Acronyms PD: Primary Distribution, SD : Secondary Distribution, N: National, IN: International, SH : Short Haul, LH: Long Haul, LIS: Low Increase Scenario, MIS: Medium Increase Scenario, HIS: High Increase Scenario, LDS: Low Decrease Scenario, MDS: Medium Decrease Scenario, HDS: High Decrease Scenario, N/C: Not Change, N/A: not Applicable
1 Handling factor is referred to the petrol supply chain in total and not only for road transport
Table 12: Future Development of FTS Indicators for Rail Transport
The performance and services provided by the freight railway transport system have increased in recent years. This reorganisation and development of the railway system in Europe is due to changes in the legal and institutional framework that govern the system. These changes support the privatisation of the railway system operation, the development of infrastructure facilities, and the provision of advanced services and are expected to increase the efficiency and effectiveness of the railway system, decrease the transport cost and therefore, increase its competitiveness. Table 13 presents the results of the assessment performed in order to identify the expected development of the various indicators for waterway movements of goods within the different sectors.

Effects on Transport of Trends in Logistics and Supply Chain Management Supply ChainManagementLogisticsand their effects onTransport
SULOGTRATRA
LOG
SU
21
Water Transport Future Development Scenaria
Indicators Waste Petrol
Type of Movements SH LH N IN
Handling Factor N/A MIS LDS1 LIS1
Average Length of Haul
N/A HIS LIS LIS
Percentage km Driven Empty
N/A LIS LIS LIS
Load factor N/A LIS MIS MIS
Lead Time N/A N/S LDS LDS
Acronyms PD: Primary Distribution, SD : Secondary Distribution, N: National, IN: International, SH : Short Haul, LH: Long Haul, LIS: Low Increase Scenario, MIS: Medium Increase Scenario, HIS: High Increase Scenario, LDS: Low Decrease Scenario, MDS: Medium Decrease Scenario, HDS: High Decrease Scenario, N/C: Not Change, N/A: not Applicable
1 Handling factor is referred to the petrol supply chain in total and not only for road transport
Table 13: Future Development of FTS Indicators for Water Transport
According to the information available from the SULOGTRA project analysis, the waterways share is expected to increase within the next years. The increase is expected to be low and only for long haul / international movements, but valid for all different categories of waterway transport. By the year 2010 the water freight transport system is expected to face an increase of the water transport share for transport effort for both short-sea shipping and deep sea shipping, the development of economies of scale in vehicle utilisation, a reconfiguration of the water transport system in terms of its links and nodes in order to meet the requirements of the demand, and provision of new services. Table 14 presents the results of the assessment performed in order to identify the expected development of the various indicators for air transport movements of goods within the different sectors.

Effects on Transport of Trends in Logistics and Supply Chain Management Supply ChainManagementLogisticsand their effects onTransport
SULOGTRATRA
LOG
SU
22
Air Transport Future Development
Scenaria Indicators
Parcels Machinery Type of Movements N IN PD SD
Handling Factor N/C2 LIS LIS
Average Length of Haul
LIS2 HIS HIS
Percentage km Driven Empty
MDS MDS LDS LDS
Load factor LIS LIS LIS LIS
Lead Time N/C N/C HDS HDS
Acronyms PD: Primary Distribution, SD : Secondary Distribution, N: National, IN: International, LIS: Low Increase Scenario, MIS: Medium Increase Scenario, HIS: High Increase Scenario, LDS: Low Decrease Scenario, MDS: Medium Decrease Scenario, HDS: High Decrease Scenario, N/C: Not Change, N/A: not Applicable
2 Handling factor and Average Length of Haul are referred to the parcel supply chain in total and not only for road transport
Table 14 Future Development of FTS Indicators for Air Transport
The share of the air transport is expected to increase. The increase in the distance between adjacent nodes of the distribution network, the application of time compression principles and the increased customisation of services requested lead to this increase. By the year 2010 the air freight transport system is expected to face an increase of the water transport share for transport effort for both short-sea shipping and deep sea shipping, the development of economies of scale in vehicle utilisation and a reconfiguration of the water transport system in terms of its links and nodes in order to meet the requirements of the demand.
3.2.3. Analysis of Decision-making Process Reflection upon the trends already mentioned in the previous two sections suggests that a reconsideration of the transport decision-making process within corporate structure is of crucial interest. This part of the project had three goals. The first was to discover how transport decisions are made within a logistical and broader corporate framework. The second was to review the effect of management restructuring on the transport decision-making process and particularly the move from functional to process-based management. The third objective was to establish what could be done to place greater priority on transport in strategic decisions on new product development and the system design and to move this decision upstream in the decision-making process. The first step in achieving these goals was examining the changes over the last forty years within the management of logistics activities. The major developments were explained and described. They included: • Physical distribution management, • Integrated logistics management, • Business process re-engineering and • Supply chain management. The next step was the identification of the main transport parameters that were assumed to be of interest to public-policy makers. These were: • Volume of freight movement, measured in tonne-kilometres or unit load-kilometres, • Choice of mode and carrier,
Effects on Transport of Trends in Logistics and Supply Chain Management Supply ChainManagementLogisticsand their effects onTransport
SULOGTRATRA
LOG
SU
23
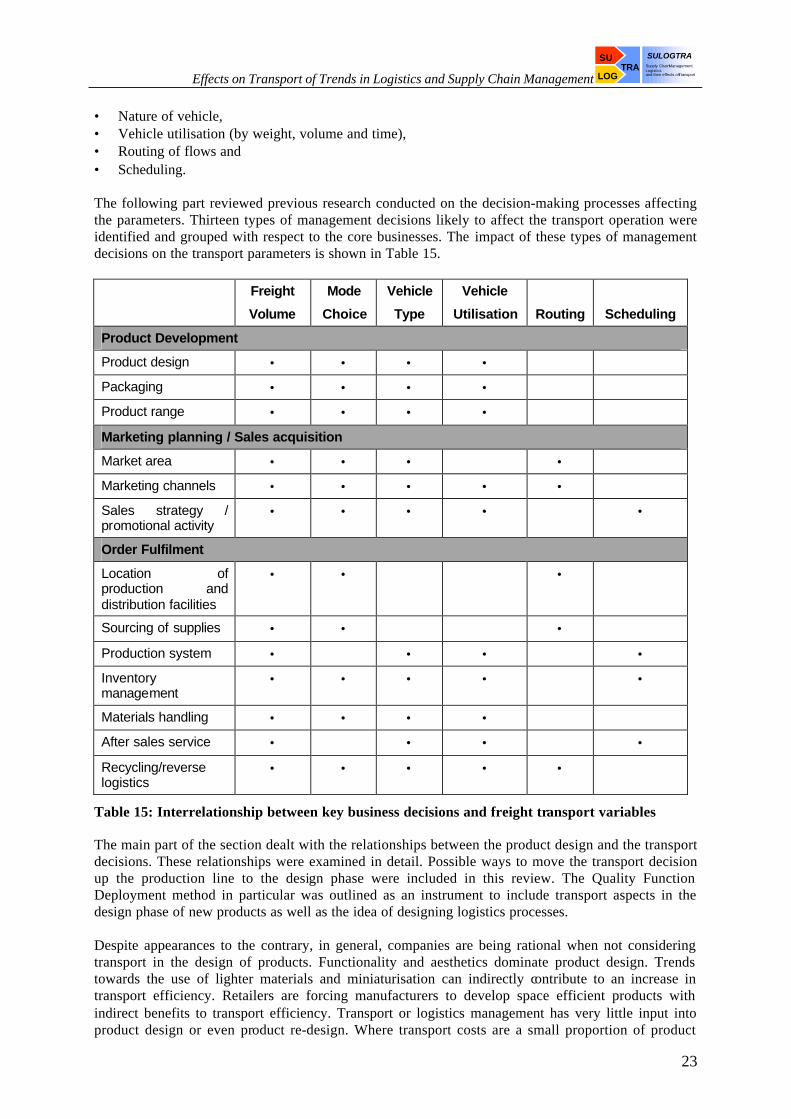
• Nature of vehicle, • Vehicle utilisation (by weight, volume and time), • Routing of flows and • Scheduling. The following part reviewed previous research conducted on the decision-making processes affecting the parameters. Thirteen types of management decisions likely to affect the transport operation were identified and grouped with respect to the core businesses. The impact of these types of management decisions on the transport parameters is shown in Table 15. Freight
Volume
Mode
Choice
Vehicle
Type
Vehicle
Utilisation
Routing
Scheduling
Product Development
Product design • • • •
Packaging • • • •
Product range • • • •
Marketing planning / Sales acquisition
Market area • • • •
Marketing channels • • • • •
Sales strategy / promotional activity
• • • • •
Order Fulfilment
Location of production and distribution facilities
• • •
Sourcing of supplies • • •
Production system • • • •
Inventory management
• • • • •
Materials handling • • • •
After sales service • • • •
Recycling/reverse logistics
• • • • •
Table 15: Interrelationship between key business decisions and freight transport variables
The main part of the section dealt with the relationships between the product design and the transport decisions. These relationships were examined in detail. Possible ways to move the transport decision up the production line to the design phase were included in this review. The Quality Function Deployment method in particular was outlined as an instrument to include transport aspects in the design phase of new products as well as the idea of designing logistics processes. Despite appearances to the contrary, in general, companies are being rational when not considering transport in the design of products. Functionality and aesthetics dominate product design. Trends towards the use of lighter materials and miniaturisation can indirectly contribute to an increase in transport efficiency. Retailers are forcing manufacturers to develop space efficient products with indirect benefits to transport efficiency. Transport or logistics management has very little input into product design or even product re-design. Where transport costs are a small proportion of product
Effects on Transport of Trends in Logistics and Supply Chain Management Supply ChainManagementLogisticsand their effects onTransport
SULOGTRATRA
LOG
SU
24
sales price it is unlikely that manufacturers will take them into consideration when designing new products. The exceptions to this are where some attribute of the product, such as its fragility, value or hazardous nature, forces manufacturers to consider how the product will be transported. Perhaps because of this rational behaviour there are few examples of manufacturers adopting the principles of ‘design for logistics’. While there are numerous models of new product development in the management literature in practice the processes are informally, or poorly, defined in many companies. The increasing interest in logistics since the 1960s has been stimulated by a desire to reduce inventory and reduce ‘time-to-market’. This has continued with the adoption of supply chain management techniques. The consequence of these developments is that service has become the dominant issue for transport management, even in those companies where transport is a relatively high proportion of final sales price. Against this background logistics management is ‘adapting’ to change rather than ‘driving’ it. The design, or re-design of packaging appears to include a much greater role for logistics management. There is a greater potential to improve vehicle utilisation through the effective design of packaging. This requires the adoption of a holistic view of packaging to consider the ways in which partial efficiencies can be improved at each level of the packaging hierarchy. However, sales and marketing considerations are still paramount, particularly in consumer products. Sales promotions can have a high transport and handling penalty that is rarely subject to a rigourous trade-off against actual sales. There are conflicting trends within the design of packaging which may have both benefits and penalties for transport efficiency. Attempts to reduce the weight of packaging may decrease tonne-kms but it may also make loads less stable and hence decrease vehicle utilisation. Transport management is therefore operating within a hierarchy of constraints, some of which are technical but many of which are organisational. Attempts to make general assumptions about strategies for managing these constraints must face the enormous variability between companies. These constraints are dependent on a wide variety of factors such as value density, product cube, position in the supply chain, geographical location with respect to markets, etc.. Although there appears to be an average decline in the average density of freight this is a ‘net’ effect of the interaction of many trends. External influences also exert an influence on these constraints. The underlying increase in road freight costs can encourage efficiency by forcing companies to focus on their strategies for reducing cost. However where this encourages outsourcing of transport it may be a double-edged sword. Transport costs may be reduced but at the same time it reduces awareness of, and interest in, vehicle fill. This reduces the likelihood that product or packaging can be designed, or re-designed, to promote transport efficiency. Faced with these conclusions what options are available for policy makers? It is possible to split the possible options into four areas: 1. Advice on packaging design. There has been much effort put into persuading companies to reduce or eliminate packaging waste, either through regulation or education. It may be possible to complement this work with an understanding of the way in which the hierarchy of packaging affects freight transport volumes and vehicle utilisation. 2. Education and the promotion of best practice. Many companies do not have an explicit policy on vehicle utilisation. Vehicle load factors are the outcome of a range of inter-related decisions made in different functional areas. Transport managers are given the job of maximising vehicle productivity within the constraints imposed by the production, marketing and sales departments. Firms producing and distributing low value, bulky products often insist that vehicles be despatched full. Some set

Effects on Transport of Trends in Logistics and Supply Chain Management Supply ChainManagementLogisticsand their effects onTransport
SULOGTRATRA
LOG
SU
25
minimum threshold levels of loading that can only be breached under certain circumstances. Many other firms, however, have not systematically measured or compared vehicle utilisation and therefore had no yardstick against which to set management targets. This situation now appears to be changing, with increasing numbers of companies assessing the efficiency of their transport operation against standard KPIs. Industry-wide initiatives, such as that of ECR-Europe (2000), are providing advice and encouragement to companies on transport optimisation. Full implementation of the recommended measures will, however, require a change in management culture and structure in many businesses. 3. Promote use of technical tools for examining loading efficiency. In the course of the interviews it became clear that there are a number of software tools available that help companies optimise packaging, particularly at the unit load level. The widespread promotion of these tools might encourage more companies to examine the trade-offs that are being made at this level. 4. Legislation. Given the complexity of interacting trends it appears to be impossible to work out the effects of any form of direct regulation. Policy-makers should consider the effects of other policy initiatives on product design and packaging, and hence vehicle utilisation, for example the effects of packaging regulations and health and safety regulations. Policy-makers should also consider the impact of internalising the environmental costs of road freight transport. For the average manufactured product the increase in transport costs would be unlikely to induce much product re-design. However, it might have a greater effect on packaging and handling and hence a significant impact on vehicle utilisation.
3.2.4. Conclusions An integrated methodological framework for examining the impact of emerging Supply Chain Management trends on the utilisation and operation of the freight transportation system was developed. The proposed methodological framework was applied to assess the impacts of Supply Chain Management trends on the freight transport system for a number of industrial sectors, for all transportation modes and types of movement. The analysis performed can provide broad guidelines for strategic decision-making to both private and public sector officials. The trends in the expected utilisation of the freight transport system induced by changes in Supply Chain Management can provide to public sector decision makers with the necessary background information of Fright Transport Policies. This information formed the basis of later work in the project, which involved providing advice to companies and policy makers. The emerging trends in the utilisation of the freight transport system, and the configuration of the supply / distribution networks provide private sector decision makers with the necessary input information for developing alternative scenarios for the organisation and management of the transport function of their companies, and the identification of best-practice in Supply Chain Optimisation, which took place in the next part of the SULOGTRA project. The information produced in this part of the SULOGTRA project was then used to help construct the case studies that compose the most important work of SULOGTRA.
3.3. Supply Chain-related Section, resulting in Case Studies
3.3.1. Supply Chain Metrics, Mapping Tools, and Benchmarking This part of the project dealt with the development of supply chain management metrics, mapping tools and benchmarking procedures. To accomplish this, market research was performed on existing supply chain management studies and software tools. Then an individual set of supply chain indicators was developed and presented in a software tool which built the basis for the second part of the project. The first step was the collection of performance measurements in logistics and supply chain management. The results were selected using three criteria. The focus of the study had to lie on external logistics, the concept of supply chain management had to be used and the supply chains had to have an international character. Another criterion was the reflection of optimisation methods at

Effects on Transport of Trends in Logistics and Supply Chain Management Supply ChainManagementLogisticsand their effects onTransport
SULOGTRATRA
LOG
SU
26
supply chain level. All of the examined studies covered different subjects to SULOGTRA. Therefore, they did not provide a measure of the potentials for supply chain improvement. Another objective of the market research was to evaluate existing supply chain management software in order to get information on the functionality of those programs. The existing market surveys gave an overview that allowed the identification of the most important software tools to be examined. Then the software companies were approached to answer open questions. The programs were grouped by supply chain planning and supply chain execution software. A collaborative inter-company planning tool was missing from all of the examined software models. The analysis of whole supply chains was not yet reflected by a special software application that is currently available to be operated in terms of SULOGTRA. For further work in SULOGTRA it was necessary to define a standard supply chain model in order to develop supply chain metrics as is shown in Figure 5.
SS CS OEMlink link link
CClink
SS: supplier’s supplierS: supplierOEM: original equipment manufacturerC: customerCC: customer’s customer
Figure 5: Standard supply chain scheme
The focus of this part of the project lay on the optimisation of one single supply chain within an existing supply chain network. Therefore, a simplified supply chain model was developed. It formed the basis for the subsequent work in the project. The next step included the identification of a set of indicators that was suited to describing the appropriate supply chain matters and made supply chain comparison and benchmarking possible. The framework conditions and background for the drivers were described according to the STEEP approach from Work Package one. The key performance indicators that have been developed measure those drivers and make it possible to compare them across different companies and sectors. The relevant metrics were selected, and the final set was selected using brainstorming techniques and group discussion including the involved SULOGTRA partners as well as external experts. In the next step the practical relevance of the set of indicators was reviewed. This was accomplished by asking two different groups of logistics experts, one of which was the Advisory Board of the SULOGTRA and PROTRANS projects. The other group consisted of the participants in a survey for the EC funded study “European Database on Logistics”. The results of this review formed the final set of indicators. It builds a mixture of qualitative and quantitative metrics, all of which are either primary or secondary data. The qualitative data mainly allows interpretations of the quantitative data. One set of the indicators describes framework conditions in European countries. The other set involves data at company level in fields of technology, economics and environment which was collected in Work Package seven. The last task in the section was the development of a software tool for collecting, analysing and mapping supply chain data. The structure of the database reflects the one of the indicator set. The layout of the database was made suitable for any person filling in the data. Three methods were provided for illustrating the results of the data analysis: tables, diagrams and the graphical presentation of whole supply chains. Because an anonymous presentation of the results is necessary in order to guarantee confidentiality to the contributing external participants a public and an internal version of the database was developed.
Effects on Transport of Trends in Logistics and Supply Chain Management Supply ChainManagementLogisticsand their effects onTransport
SULOGTRATRA
LOG
SU
27
3.3.2. Supply Chain Optimisation and Best Practice This part of the project concentrated on best practice and the establishment and dissemination thereof. The accomplishment of this required the completion of many tasks. The optimisation goals in logistics and supply chain management were reviewed from private company and public policy perspectives, based on the Key Performance Indicators described in the previous section, and key components and critical trade-offs in definitions of optimisation were examined. The quantitative optimising techniques currently available were critically evaluated and current deficiencies were identified. The results of surveys of logistical / supply chain best practice in Europe and elsewhere were reviewed and the current usage of optimising techniques by sector and country was assessed. Through interviews and focus group discussions, the constraints on supply chain optimisation were analysed, as were the channels through which new ideas, practices and tools are disseminated. Techniques for facilitating best practice were explored and a method for assessing the potential for supply chain improvement for application and testing in the case studies was devised. The phrase ‘best practice’ is widely used in management literature. Determining what constitutes best practice is the driving force behind a lot of management literature, which recognises that best practice is context-driven and there is no simple generic answer to the search. The complexity and wide ranging nature of the problem is illustrated by the different approaches to describing best practice. • Technical excellence in decision-making. In some cases decision-making may be in the hands of
individuals manipulating information and evaluating options. In these instances the capabilities of the individuals is critical. By contrast, in the case of logistics decisions concerning network design and product scheduling, decisions emanate from software packages, often with limited human intervention. Excellence in performance clearly requires that the procedures these software packages use find the optimal solutions.
• The best design. Benchmarking refers to measures of business performance. Some
recommendations for best practice can refer to key design parameters of the supply chain. A number of key awards are given out each year to celebrate what are considered to be best practices and use such parameters to set industry benchmarks.
The researchers verified that best practice does not come from a single source. Members of various groups collaborate on a project-by-project basis. Though these interactions new models and new processes can be developed. The first task dealt with the definition of supply chain optimisation from a public perspective and a private perspective, to examine the conflicts that arise and try to find a way to reconcile them. The objectives of the private entities mainly relate to short-term or long-term financial success, while the interests of the public bodies include environmental, economic and social factors. This means that the public and private goals of supply chain optimisation can vary widely, especially in the higher strategic decision-making level, which regards network design problems. Network design is particularly concerned with the location of supply chain nodes, which can have far-reaching implications for environmental objectives and social impacts concerning peripheral regions. The SULOGTRA project partners involved in the research discovered that network design tools had previously been used hesitantly, due to the cost and complexity of their use, the programming skills necessary, and the high skills level required to interpret the output from these tools, but advances in computer technology have allowed optimisation tools in general to become far more accessible, with programs that run on relatively inexpensive PCs and with vastly increased user-friendliness. Several software packages were examined. For the evaluation of the best software packages for network design, the following issues were considered: • Level of decision-making – the level of interaction between the network design decision and
tactical and operational planning. It is desirable to have frameworks available to study the interactions between planning levels.

Effects on Transport of Trends in Logistics and Supply Chain Management Supply ChainManagementLogisticsand their effects onTransport
SULOGTRATRA
LOG
SU
28
• Types of decision – the best software packages include functions to decide the network design in terms of physical layout, inventory flow and location within the network, and the choice of modes available.
• Extent of the supply chain coverage – the number of supply chain nodes that can be included within the optimisation process.
• Relationship between stakeholders – the package should provide the user with the ability to study trade-offs between potentially conflicting objectives.
• The number of objectives – future strategic decisions regarding Supply Chain / logistics network optimisation will be based on the consideration of multiple objectives even at the level of an individual supply chain node.
• Technological requirements – that the package have high computational performance, easy integration with other packages, and is user friendly.
Through interviews with users and providers of software, six software packages were evaluated in detail. All these packages offer powerful computational tools that are at the forefront of optimisation models for network design. User friendliness and their ability to cope with large systems are also high. They provide essential input into the overall management process of choosing strategies. They cannot, by themselves, construct a set of relationships between customers and suppliers that is dictated by the modern canons of supply chain management. Examination of the difficulties in achieving best practice identifies the following barriers: resistance to change, turnover of personnel, culture, trust and competition, co-ordination and project leadership, funding, and the availability of enabling technology. Seven metrics were developed to measure how far supply chain members are from best practice and the opportunity remaining for improvement. The metrics have also been applied in the case studies carried out at the end of the SULOGTRA project. The metrics measure best practice in the following areas: • Network Design Optimisation • Transport Optimisation • Integration with Customers • Integration with Suppliers • Adoption of e-Business • New Product Development with Suppliers • New Product Development with Customers Within supply chain management, a number of different dissemination facilitators can be identified. They are portrayed in Figure 6.

Effects on Transport of Trends in Logistics and Supply Chain Management Supply ChainManagementLogisticsand their effects onTransport
SULOGTRATRA
LOG
SU
29
Industryassociations
Consulting firm
Academia
Government
Applicationsproviders
Betterpractice in
the firm
Other firms in thesupply chain
Figure 6: Sources of best practice dissemination
In most of the best-practice dissemination examples reviewed in this section, facilitators do not tend to act in isolation. Industry associations, consulting firms, academic institutions, governments and supply chain members collaborate on a project-by-project basis. These multilateral interactions contribute to the dissemination and development of new models and new processes. Best-practice does not come from a unique source. It is a joint effort enterprise. Facilitating the adoption of best practice may benefit an industry as a whole or it may be considered competitive. Two firms may co-operate at the industry association level whilst competing within the same market. An academic institution may be competing for funding with consulting firms. It may not be in the interest of a firm or a group of firms to share information with competitors on new ways of working, innovative processes or best practice thinking that may be regarded as a commercial asset. The dissemination of innovations and ideas remains an open issue not limited to supply chain practitioners. Best-practice solutions proposed by these firms are often oriented toward large multinational companies. What is considered as best practice may be economically inefficient and inappropriate for medium or small firms. The return derived from the implementation of a best-practice process may not compensate from the investments required. Analysis tools, such as the Glosup Key Performance Indicators, help to address this issue. The overall return of a specific investment in the supply chain process for a specific company is assessed. This puts the emphasis on the necessary filtering and prioritisation of best-practice information. In all cases firms need to be carefully select solutions from those that other firms propose to them whilst keeping up-to-date with best practice in their profession.
3.3.3. Analysis of Value Creation in Supply Chains This part of the project focused on the process of internal value creation in supply chains and its external effects on local and regional economies. It investigated the process of value creation in supply chains and the relationship between logistical activities and economic development. This was the last work in the preparation for the case studies and established a theoretical basis for them. The first step was to review previous research on the configuration of supply chains and the spatial distribution of logistical activity. The partners performed geographical research on industrial location
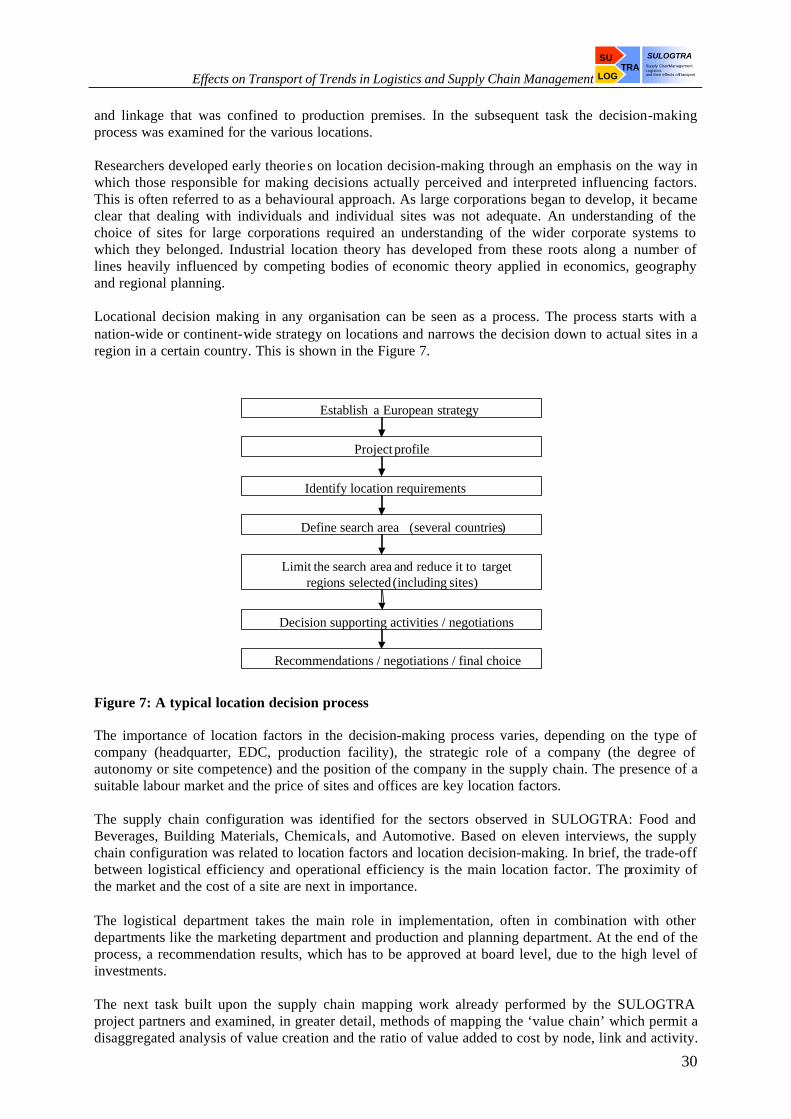
Effects on Transport of Trends in Logistics and Supply Chain Management Supply ChainManagementLogisticsand their effects onTransport
SULOGTRATRA
LOG
SU
30
and linkage that was confined to production premises. In the subsequent task the decision-making process was examined for the various locations. Researchers developed early theories on location decision-making through an emphasis on the way in which those responsible for making decisions actually perceived and interpreted influencing factors. This is often referred to as a behavioural approach. As large corporations began to develop, it became clear that dealing with individuals and individual sites was not adequate. An understanding of the choice of sites for large corporations required an understanding of the wider corporate systems to which they belonged. Industrial location theory has developed from these roots along a number of lines heavily influenced by competing bodies of economic theory applied in economics, geography and regional planning. Locational decision making in any organisation can be seen as a process. The process starts with a nation-wide or continent-wide strategy on locations and narrows the decision down to actual sites in a region in a certain country. This is shown in the Figure 7.
Project profile
Establish a European strategy
Identify location requirements
Define search area (several countries)
Recommendations / negotiations / final choice
Decision supporting activities / negotiations
Limit the search area and reduce it to targetregions selected(including sites)
Figure 7: A typical location decision process
The importance of location factors in the decision-making process varies, depending on the type of company (headquarter, EDC, production facility), the strategic role of a company (the degree of autonomy or site competence) and the position of the company in the supply chain. The presence of a suitable labour market and the price of sites and offices are key location factors. The supply chain configuration was identified for the sectors observed in SULOGTRA: Food and Beverages, Building Materials, Chemicals, and Automotive. Based on eleven interviews, the supply chain configuration was related to location factors and location decision-making. In brief, the trade-off between logistical efficiency and operational efficiency is the main location factor. The proximity of the market and the cost of a site are next in importance. The logistical department takes the main role in implementation, often in combination with other departments like the marketing department and production and planning department. At the end of the process, a recommendation results, which has to be approved at board level, due to the high level of investments. The next task built upon the supply chain mapping work already performed by the SULOGTRA project partners and examined, in greater detail, methods of mapping the ‘value chain’ which permit a disaggregated analysis of value creation and the ratio of value added to cost by node, link and activity.
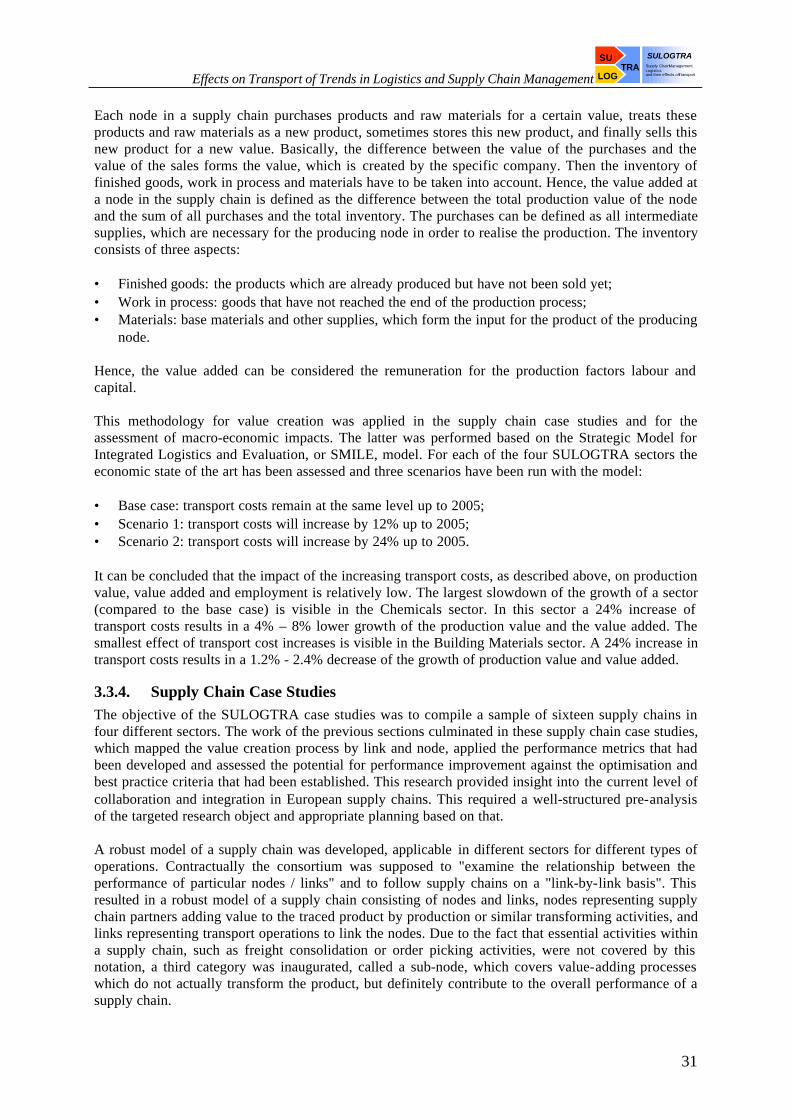
Effects on Transport of Trends in Logistics and Supply Chain Management Supply ChainManagementLogisticsand their effects onTransport
SULOGTRATRA
LOG
SU
31
Each node in a supply chain purchases products and raw materials for a certain value, treats these products and raw materials as a new product, sometimes stores this new product, and finally sells this new product for a new value. Basically, the difference between the value of the purchases and the value of the sales forms the value, which is created by the specific company. Then the inventory of finished goods, work in process and materials have to be taken into account. Hence, the value added at a node in the supply chain is defined as the difference between the total production value of the node and the sum of all purchases and the total inventory. The purchases can be defined as all intermediate supplies, which are necessary for the producing node in order to realise the production. The inventory consists of three aspects: • Finished goods: the products which are already produced but have not been sold yet; • Work in process: goods that have not reached the end of the production process; • Materials: base materials and other supplies, which form the input for the product of the producing
node. Hence, the value added can be considered the remuneration for the production factors labour and capital. This methodology for value creation was applied in the supply chain case studies and for the assessment of macro-economic impacts. The latter was performed based on the Strategic Model for Integrated Logistics and Evaluation, or SMILE, model. For each of the four SULOGTRA sectors the economic state of the art has been assessed and three scenarios have been run with the model: • Base case: transport costs remain at the same level up to 2005; • Scenario 1: transport costs will increase by 12% up to 2005; • Scenario 2: transport costs will increase by 24% up to 2005. It can be concluded that the impact of the increasing transport costs, as described above, on production value, value added and employment is relatively low. The largest slowdown of the growth of a sector (compared to the base case) is visible in the Chemicals sector. In this sector a 24% increase of transport costs results in a 4% – 8% lower growth of the production value and the value added. The smallest effect of transport cost increases is visible in the Building Materials sector. A 24% increase in transport costs results in a 1.2% - 2.4% decrease of the growth of production value and value added.
3.3.4. Supply Chain Case Studies The objective of the SULOGTRA case studies was to compile a sample of sixteen supply chains in four different sectors. The work of the previous sections culminated in these supply chain case studies, which mapped the value creation process by link and node, applied the performance metrics that had been developed and assessed the potential for performance improvement against the optimisation and best practice criteria that had been established. This research provided insight into the current level of collaboration and integration in European supply chains. This required a well-structured pre-analysis of the targeted research object and appropriate planning based on that. A robust model of a supply chain was developed, applicable in different sectors for different types of operations. Contractually the consortium was supposed to "examine the relationship between the performance of particular nodes / links" and to follow supply chains on a "link-by-link basis". This resulted in a robust model of a supply chain consisting of nodes and links, nodes representing supply chain partners adding value to the traced product by production or similar transforming activities, and links representing transport operations to link the nodes. Due to the fact that essential activities within a supply chain, such as freight consolidation or order picking activities, were not covered by this notation, a third category was inaugurated, called a sub-node, which covers value-adding processes which do not actually transform the product, but definitely contribute to the overall performance of a supply chain.

Effects on Transport of Trends in Logistics and Supply Chain Management Supply ChainManagementLogisticsand their effects onTransport
SULOGTRATRA
LOG
SU
32
To accomplish the difficult task of observing individual supply chains it was important to chose products that were specifically produced to be built into other, sector-specific products downstream in the supply chain. Since in most cases the decision on the affiliation of a certain supply chain to a certain sector was made by focussing on the original equipment manufacturer (OEM), the standard supply chain was defined around the OEM. The model resulting from this work provides the opportunity to cover supply chain cases of a theoretical length of up to 5 nodes, 8 sub-nodes and with up to 12 transport relations. This standard supply chain offers the flexibility to map real supply chains of all conceivable lengths within a specified sector. The assurance that the companies providing data to the consortium would benefit from their participation was the underlying assumption for the elaboration of the selection procedure. Since benchmarking is considered as one of the major objectives of the SULOGTRA case studies, and benchmarking generally is often appreciated as an opportunity for performance improvement, the procedure was elaborated around the core idea of allowing the participating companies to benchmark themselves with other chains in the same sector respectively with other sectors in general. Thus, it was agreed to leave as much decision competency as possible with the participating companies to incorporate their specific needs and objectives on a supply chain benchmarking. Thus, the premier company approached and successfully participating in a supply chain case study was supposed to have the decision on the next party supply chain upstream and downstream, preconditioned remaining in the same sector. The interview partners had to agree in advance on the product to be traced and subsequently on the specific next entity in a chain to be followed. By means of this approach the premier company (key access company) had the opportunity also to make the choice on the second tier level upstream and downstream in the supply chain if desired or to leave the choice to the next party in the chain in the same manner as it was on the first tier level. This multi-loop approach seemed to be the most promising way to convince companies to participate. A meaningful assessment of the amount of data related to the case studies required the construction of a database capable of performing queries on certain aspects of interest and visualising result patterns, which was called Database on European Supply Chains. A lot of individual information about the different companies in each supply chain was necessary for the benchmarking process, which is described below. Based on the standard supply chain defined, a theoretical maximum of interviews of 25 companies per chain had to be expected, so the database was created to have the capability to handle this amount of information. Due to the fact that the majority of information describing the degree of collaboration and integration in supply chains is of a qualitative nature, a procedure had to be defined which would provide the opportunity first to rate and subsequently to compare and benchmark the surveyed companies within each chain and the chains with each other. Thus, for the following aspects a nomenclature was elaborated in SULOGTRA: • Degree of integration with direct customers and the customer's customer as well as with the direct
supplier and the supplier's supplier. • Degree of collaboration in new product development with direct customers and the customer's
customer as well as with the direct supplier and the supplier's supplier. • Degree of transport operations optimisation. • Degree of network design optimisation. To meet the objectives for SULOGTRA supply chain case studies, the functional benchmarking method, also call generic benchmarking, was used, because it allows for a comparison irrespective of industrial branch or product. The objective of this type of benchmarking is to identify the world class and branch leaders. The examination includes competitors and other market participants. This method facilitates the discovery of innovative processes and practices. The idea is to search for top performances that might serve as a benchmark. Since benchmarking was considered to be one of the major objectives of the SULOGTRA case studies, and benchmarking is generally appreciated as an opportunity for performance improvement, the procedure was elaborated around the core idea of

Effects on Transport of Trends in Logistics and Supply Chain Management Supply ChainManagementLogisticsand their effects onTransport
SULOGTRATRA
LOG
SU
33
allowing the participating companies to benchmark themselves with other chains in the same sector as well as with other sectors in general. The sectors chosen were Automotive, Building Materials, Chemical, and Consumer Goods. The consortium gathered information on sixteen supply chains in these four sectors, represented by information received about the roles of 83 companies in the various chains. Including unknown companies, such as variable transport service providers contracted on a move-by-move basis, the number increased to 97 companies, encompassing the sub-nodes and links. The data analysis and the benchmarking in the SULOGTRA supply chain case studies had two objectives: first to achieve an overview of the state-of-the-art in Supply Chain Management in the selected sectors with a macroeconomic perspective, and second to allow individual companies to compare or benchmark their performance and the degree of development in their own and joint activities with partners in their supply chains against sectoral values. The database gives users the opportunity to compare their supply chain performance to others within their industrial sector or even across the whole of the industry. In addition, advice can be derived for the participating companies for supply chain improvements. An important factor of supply chain optimisation is the ability to forecast requirements. Small demand fluctuations at the end-customer's level are intensified by the cyclic order behaviour along the logistic chain. They cause big fluctuations within the production and logistics systems of upstream nodes, which presents a need for safety stocks to be held along the supply chain. Early demand information from each participating company could reduce those safety stocks. This stresses the importance of integration and collaboration. Figures 8 and 9 below show the findings on the degree of integration and collaboration in the assessed supply chains.
Automotive
Chemicals
Building Materials
Consumer Goods
Scope of Influence on theexample of the OEM:
4The perception of the degree of integration between two
companies in a supply chain can vary greatly in
some cases.
4The integration of logistics service providers fluctuates
even in the automotive industry.
4The degree of integration correlates to regional
conditions.
SS CS OEMlink link link
CClink
Figure 8: Degree of integration in supply chains on a European level

Effects on Transport of Trends in Logistics and Supply Chain Management Supply ChainManagementLogisticsand their effects onTransport
SULOGTRATRA
LOG
SU
34
Phase 1: Integration of the functions of the internal supply chain
Phase 2: Information exchange between customers, suppliers and 3PL
Phase 3: Collaboration Management in the supply chain
Phase 4: Synchronisation and reduction of the internal and external supply chain
Vision
Status:IndividualProducers
Status:Producers
and System-suppliers
Status:Sub-
suppliers
“0815 - Markt ”your best buy!
open
AutomotiveChemicalsBuilding MaterialsConsumer Goods
Figure 9: Collaboration in supply chains on a European level
A basic requirement for any kind of integration of processes is an adequate communication infrastructure. Thus, it was questioned to which extent classic information exchange technologies, which basically are based on paper (fax, letter etc.), or electronic data interchange technologies are applied. Here the distinction was made between the communication methods used via dedicated networks, such as classic EDIFACT applications and use of open networks such as the internet. The results are presented in Figure 10.
Automotive
Chemicals
Building Materials
Consumer Goods
SS CS OEMlink link link
CClink
Exchange of information performedthrough:
Closed Network
Open Network
Paper-based and telephone
ca. 75 %
ca. 85%
ca. 90%
ca. 45%ca. 25%
Figure 10: Communication with supply chain partners
Regarding the transport modes used, the sixteen supply chains surveyed reflect the general picture very well. The far most used mode in all four sectors is road. In automotive and building materials the road share even reached 100% of all links surveyed. The two exceptions, water and combined transport by water have to be seen in relation to the actual supply chains, which are in one case crossing the channel between UK and continental Europe and in the other case involved water transport from overseas sources. The only case of use of pipeline transport can not be seen from an environmentally driven perspective, either, rather operational efficiency contributed to the decision. In
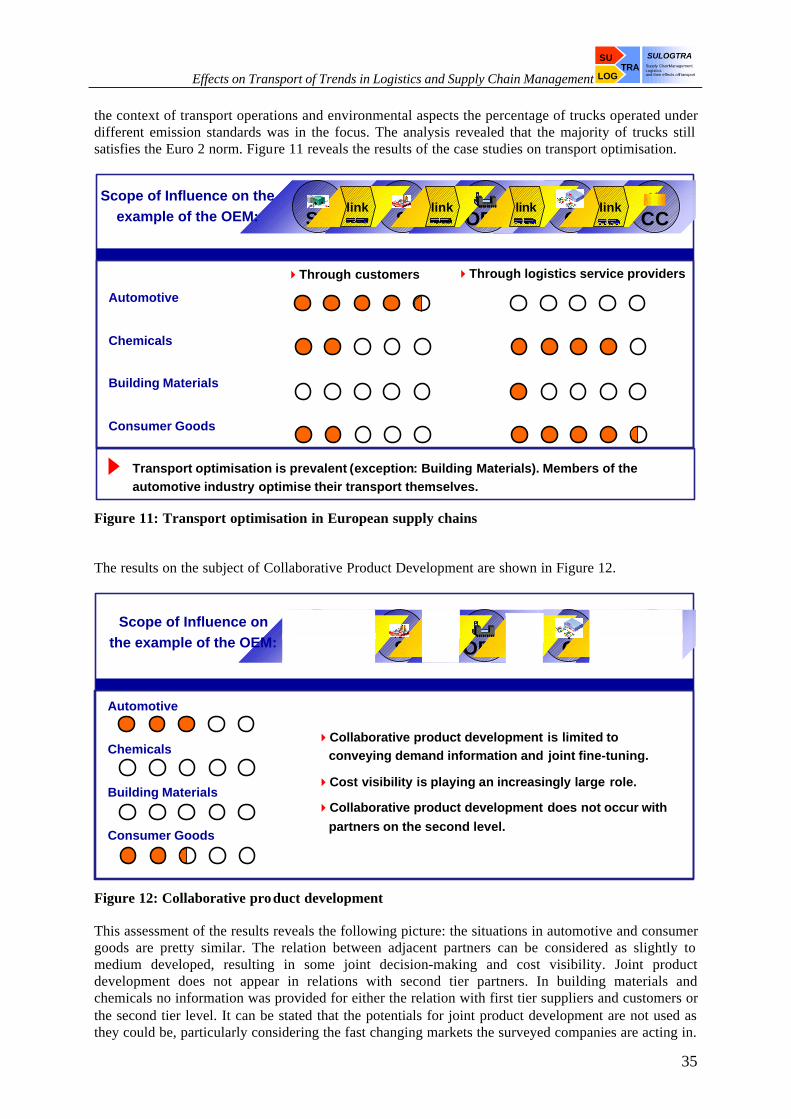
Effects on Transport of Trends in Logistics and Supply Chain Management Supply ChainManagementLogisticsand their effects onTransport
SULOGTRATRA
LOG
SU
35
the context of transport operations and environmental aspects the percentage of trucks operated under different emission standards was in the focus. The analysis revealed that the majority of trucks still satisfies the Euro 2 norm. Figure 11 reveals the results of the case studies on transport optimisation.
Automotive
Chemicals
Building Materials
Consumer Goods
SS CS OEMlink link link
CClink
Scope of Influence on theexample of the OEM:
Transport optimisation is prevalent (exception: Building Materials). Members of theautomotive industry optimise their transport themselves.
4Through customers 4Through logistics service providers
Figure 11: Transport optimisation in European supply chains
The results on the subject of Collaborative Product Development are shown in Figure 12.
Automotive
Chemicals
Building Materials
Consumer Goods
SS CS OEMlink link link
CClink
Scope of Influence onthe example of the OEM:
4Collaborative product development is limited to conveying demand information and joint fine-tuning.
4Cost visibility is playing an increasingly large role.
4Collaborative product development does not occur withpartners on the second level.
Figure 12: Collaborative product development
This assessment of the results reveals the following picture: the situations in automotive and consumer goods are pretty similar. The relation between adjacent partners can be considered as slightly to medium developed, resulting in some joint decision-making and cost visibility. Joint product development does not appear in relations with second tier partners. In building materials and chemicals no information was provided for either the relation with first tier suppliers and customers or the second tier level. It can be stated that the potentials for joint product development are not used as they could be, particularly considering the fast changing markets the surveyed companies are acting in.

Effects on Transport of Trends in Logistics and Supply Chain Management Supply ChainManagementLogisticsand their effects onTransport
SULOGTRATRA
LOG
SU
36
The question of network optimisation constantly emerges in the discussion of the subject of supply chain optimisation. From a public perspective one of the major fields of interest is the number and location of nodes as well as the number and length of links in the supply network. Thus, the degree of consideration of those aspects has been part of the survey for the SULOGTRA supply chain database. Essential decisions connected with the network design are: • Where facilities should be sited • How much and where inventory should be held • What transport services should be offered between facilities • Which customer should be served from each facility In addition it might be asked whether certain manufacturing processes might be postponed and carried out at a point nearer the final consumer. The analysis revealed that network optimisation is in many cases not considered to be very important and thus no or only minor activities in this respect have been carried out in the recent past. In terms of the different degrees no clear picture could be drawn, so the patterns are briefly introduced and explained as far as possible in front of their context. In the surveyed chains of the automotive sector almost 40% (38%) of companies stated that "no recent evidence on network costs or tests of alternatives" actually would reflect their activities respectively inactivaties most suitably. 23% have the medium and 23% again have a substantial degree, standing for studies recently completed or currently under way concerning 2-3 and 4 node (sub-node) levels depot locations, cross-docking, inventory locations or mode choice, whereby partners and their objective have been partly involved in the design process. Companies considering their network design as completely optimised based on recent evidence account for 15%. In the surveyed supply chains in the chemical industry the majority of companies do not consider network optimisation at all. The remainder of around 40% considers their activities as medium, covering 2-3 node (sub-node) levels. In the building materials sector network optimisation almost does not take place at all. Almost 80% of all statements indicated no recent evidence on network optimisation. A major reason might be the static location of the resources and the long-term relation between nodes in upper parts of the supply chain. Although, the consumer goods industry appears to be the leading sector in the SULOGTRA survey, it has to be mentioned that in the retail industry in lower parts of the chain supply networks cannot be optimised like in the manufacturing industry. The location of the stores is determined by the distribution of the population and the authorisations to open a store provided by the authorities. The low average degree of network optimisation in general is reflected by the very limited use of respective software packages as it has been observed in the ICT application section above. In the context of trust, willingness to co-operate and cost visibility along the supply chain the types of contractual relations are of special interest. Here, the use of open-book contracts and the application of master contracts and their duration are questioned. Figure 13 below reveals the results.

Effects on Transport of Trends in Logistics and Supply Chain Management Supply ChainManagementLogisticsand their effects onTransport
SULOGTRATRA
LOG
SU
37
Automotive
Chemicals
Building Materials
Consumer Goods
Scope of Influence on theexample of the OEM:
Length of Contract
with SC-Partners: with Logistics Service Providers:
SS CS OEMlink link link
CClink
456%
440%
4No informationprovided
412%
Portion of contractsthat are Open Book:
4flexible,depending on the duration of a model
4≥ 36 Months
4~ 12 Months
4~ 12 Months
4≥ 12 Months
4≥ 12 Months
4~ 12 Months
4~ 36 Months
Figure 13: Configuration of contract relations in supply chains
3.3.5. Conclusions The major conclusion which can be drawn from the supply chain-oriented part of SULOGTRA and in particular from the case studies is the apparent existence of a gap between the surveyed reality and the generally publicised level of the application of advanced supply chain management concepts. The literature and trade press on supply chain management provide a picture of a series of promising concepts which in most cases could not be found applied in general practice. In this context it needs to be stated that with a selection of sixteen supply chains the critical mass for statistical validity still might not have been reached, nevertheless, the picture derived reflects the impressions from consultancy experience within the consortium very well. The scale of the identified gap differs among the sectors, whereby here the general picture is reflected insofar that the automotive sector can be considered as the leading edge and the seemingly more traditional building materials industry is identified as the least developed. The importance of a powerful driver must be underlined, which can usually be found in the automotive sector. The differences among the sectors were reflected by almost all indicators used. Companies in supply chains of a sector considered as advanced in terms of one specific indicator are usually advanced in the general picture as well. The gap identified might be caused by an underestimation of pragmatic barriers which limit the wide diffusion of advanced software and management tools. The perception and the actual demand of respective applications seem to differ. On the other hand the perception of the potentials of collaborative processes for the chain as a whole is underdeveloped for a variety of reasons. A lack of transparency in internal processes definitely limits this perception, traditions and habits can be additional barriers. The behavioural changes necessary for intensified collaborative processes seem to be the biggest hurdle for the adoption of disseminated best practice. The objectives of the various partners still differ and are focused on their own advantages, which prevents the achievement of a supply chain optimum.
3.4. Policy Implications and Advice
3.4.1. Background The objective of Work Package eight, Policy Implications and Advice, was the assessment of the compatibility of the identified trends and developments in logistics and Supply Chain Management according to EU political policy orientations and subsequently to the available set of policy interments
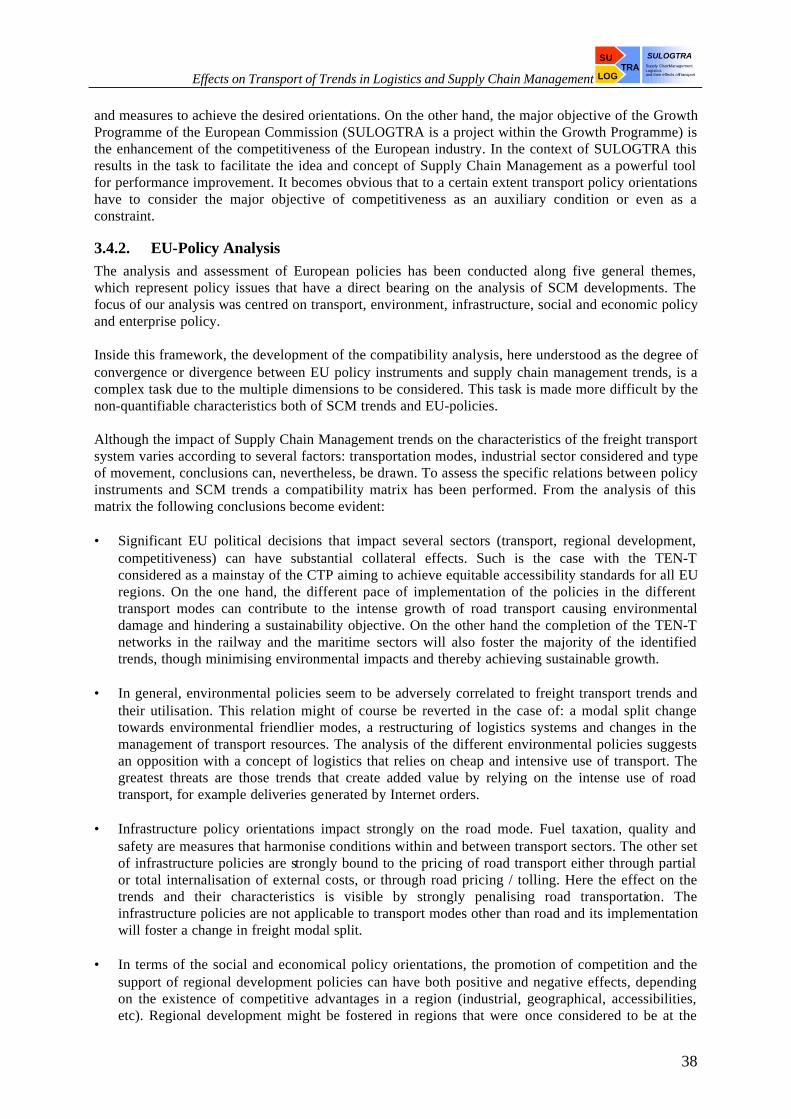
Effects on Transport of Trends in Logistics and Supply Chain Management Supply ChainManagementLogisticsand their effects onTransport
SULOGTRATRA
LOG
SU
38
and measures to achieve the desired orientations. On the other hand, the major objective of the Growth Programme of the European Commission (SULOGTRA is a project within the Growth Programme) is the enhancement of the competitiveness of the European industry. In the context of SULOGTRA this results in the task to facilitate the idea and concept of Supply Chain Management as a powerful tool for performance improvement. It becomes obvious that to a certain extent transport policy orientations have to consider the major objective of competitiveness as an auxiliary condition or even as a constraint.
3.4.2. EU-Policy Analysis The analysis and assessment of European policies has been conducted along five general themes, which represent policy issues that have a direct bearing on the analysis of SCM developments. The focus of our analysis was centred on transport, environment, infrastructure, social and economic policy and enterprise policy. Inside this framework, the development of the compatibility analysis, here understood as the degree of convergence or divergence between EU policy instruments and supply chain management trends, is a complex task due to the multiple dimensions to be considered. This task is made more difficult by the non-quantifiable characteristics both of SCM trends and EU-policies. Although the impact of Supply Chain Management trends on the characteristics of the freight transport system varies according to several factors: transportation modes, industrial sector considered and type of movement, conclusions can, nevertheless, be drawn. To assess the specific relations between policy instruments and SCM trends a compatibility matrix has been performed. From the analysis of this matrix the following conclusions become evident: • Significant EU political decisions that impact several sectors (transport, regional development,
competitiveness) can have substantial collateral effects. Such is the case with the TEN-T considered as a mainstay of the CTP aiming to achieve equitable accessibility standards for all EU regions. On the one hand, the different pace of implementation of the policies in the different transport modes can contribute to the intense growth of road transport causing environmental damage and hindering a sustainability objective. On the other hand the completion of the TEN-T networks in the railway and the maritime sectors will also foster the majority of the identified trends, though minimising environmental impacts and thereby achieving sustainable growth.
• In general, environmental policies seem to be adversely correlated to freight transport trends and
their utilisation. This relation might of course be reverted in the case of: a modal split change towards environmental friendlier modes, a restructuring of logistics systems and changes in the management of transport resources. The analysis of the different environmental policies suggests an opposition with a concept of logistics that relies on cheap and intensive use of transport. The greatest threats are those trends that create added value by relying on the intense use of road transport, for example deliveries generated by Internet orders.
• Infrastructure policy orientations impact strongly on the road mode. Fuel taxation, quality and
safety are measures that harmonise conditions within and between transport sectors. The other set of infrastructure policies are strongly bound to the pricing of road transport either through partial or total internalisation of external costs, or through road pricing / tolling. Here the effect on the trends and their characteristics is visible by strongly penalising road transportation. The infrastructure policies are not applicable to transport modes other than road and its implementation will foster a change in freight modal split.
• In terms of the social and economical policy orientations, the promotion of competition and the
support of regional development policies can have both positive and negative effects, depending on the existence of competitive advantages in a region (industrial, geographical, accessibilities, etc). Regional development might be fostered in regions that were once considered to be at the

Effects on Transport of Trends in Logistics and Supply Chain Management Supply ChainManagementLogisticsand their effects onTransport
SULOGTRATRA
LOG
SU
39
margin of the European market due to their poor accessibilites and can now become an alternative in attracting new logistic-related investment.
• Finally, the continuation of a research and technology development policy in the supply chain
management and in the transport sector will foster technology intensive trends and contribute to the overall optimisation of the management of the supply chain.
One of the main concerns of the Commission is related to the acceptability and effectiveness of measures to be implemented. In fact, a number of sound political and economic measures have failed the implementation phase due to the public acceptability trap. Every policy measure produces winners and losers and the perceptions and attitudes of stakeholders have a major part to play in gaining acceptance and thus, in gaining successful implementation. In order to assess the acceptability of likely policy orientations a questionnaire was conducted among the relevant stakeholder’s representatives (i.e. stakeholders associations) in the logistic and SCM sector. Likely policy orientations were obtained from: the extensive analysis of past and current policy orientations, of short, medium and long term goals set by the EU, by different Member States and by international organisations; the results obtained in previous Work Packages of SULOGTRA, as well as other projects such as TRILOG and REDEFINE.
3.4.2.1. Policy Orientations Every policy orientation: transport, economic, environmental, infrastructure and social policies can all potentially directly or indirectly impact the supply chain management and freight transport. Three groups of policy measures can be distinguished according to their aim: • External measures, • Taxes and charges, • Measures aimed at the transport sector: transport systems (vehicles, fuels), transport technologies
and transport infrastructure. External measures are those measures that impact the management of the supply chain and, indirectly, freight transport. Their effect is felt by inducing changes in the market. The following policies can be classified as being external: macroeconomic policy (liberalisation and deregulation), social and labour legislation, EU integration policy, environmental policies, introduction and development of new technologies and R&D policies. The one, which can be proactively addressed by the Commission, is benchmarking. This new ‘attitude’ is supported in three principles: • Benchmarking best practices in logistics will contribute to a more efficient transport activity and,
in ultimate analysis contribute to reduce the impact of freight transport through gains in efficiency, • Benchmarking logistics by disseminating logistics and Supply Chain Management best practices
will certainly benefit SME’s most. The increased accessibility to knowledge will make SME´s more competitive,
• Benchmarking logistics through the EC will change the position from passive to interventive, thus
legitimating EC role as a moderator in the sector. Taxes and charges change the level and structure of the costs, which transport users have to bear. These in turn influence the transport users’ decision-making with respect to vehicle purchase, modal choice, vehicle utilisation and transport planning. The effectiveness of general taxes and charges on changing undesirable behaviour can be increased via differentiation according to: • Fuel efficiency or emissions, • Traffic conditions (congestion hours or off-peak), • Axle load (for road surface damage),

Effects on Transport of Trends in Logistics and Supply Chain Management Supply ChainManagementLogisticsand their effects onTransport
SULOGTRATRA
LOG
SU
40
• Type / distance of transport (short distance transport for pre or end hauls of combined transport). Among the measures basic strategies to reduce the impact of freight transport can be identified, namely: • Reduction of road freight transport intensity, • Modal shift, • Increased efficiency of transport, • Use of better vehicles and/or fuels, • Better use of vehicles.
3.4.2.2. Recommended Policy Measures From the analysis performed in SULOGTRA recommended policy options can be clustered according to their acceptability and effectiveness: • High effectiveness, positive acceptability:
- Introduce logistics ‘Eco-label’, - Introduce on-board measuring and debiting for emissions, - Introduce tradable emission permits.
• Moderate effectiveness, positive acceptability: - Standardisation of loading units.
• High effectiveness, negative acceptability: - Increase fuel tax generally.
The Eco-label, as the only non-coercive measure in this group, is very different from the other measures. Its effectiveness is estimated to be so high because it is considered to incorporate a whole range of sub-measures which show companies: how to make their logistics activities more environmentally-friendly using the best available technologies and best practice and to give them non-financial incentives to change. Given the fact that it is a non-coercive measure, it is not unexpected that this measure has a positive acceptability, even though it might be considered very moderate in this context. On the vehicle technology level a general fuel tax does only give an incentive to reduce the fuel consumption per km and not the amount of emissions per litre of fuel burned. Measures that impose costs based on the emissions caused by vehicles are more versatile and are likely to be perceived to be more just, which is evidenced by the higher acceptability of the measure. As predicted, an increase in fuel is strongly opposed by all the stakeholders except the environmental associations. The on-board measuring of emissions, although opposed by those stakeholders who directly perform transport activities, does not receive a strong opposition. The implementation of emission-based charges, however, is more costly than an increase in fuel tax. The on-board measuring and debiting for emissions is the fairest measure because it also takes into account individual driver behaviour; but it is very costly, increasing the purchase prices of vehicles and requiring the fitting of devices in old -vehicles or a general high levy for non-equipped vehicles. The tradable emission permits can only be based on average per-km emission values of each type of vehicle, driving conditions cannot be taken into account. This makes the measure the least effective among the top transactional measures. The measure would, however, be much cheaper to implement and also incorporates a ceiling on pollution (a potential quantitative policy objective!) in the form of a maximum number of tradable permits. The standardisation of intermodal load units is the most widely accepted measure among the stakeholders and has simultaneously a high effectiveness. Nevertheless, the current level of standardisation does not create the major barrier for wider use of intermodal transport concepts, rather

Effects on Transport of Trends in Logistics and Supply Chain Management Supply ChainManagementLogisticsand their effects onTransport
SULOGTRATRA
LOG
SU
41
the current railroad practice and strange and inhomogeneous national interpretation and realisation of European law forms the major obstacle for effective and customer-oriented intermodal transport concepts. Road pricing and congestion pricing measures are transactional and increase the costs of transport in a way that, the higher the vehicle-km, the more costs accrue. Those more or less distance-based costs do however not give incentives to improve the fuel efficiency or to reduce the emissions per litre of consumed fuel. They are therefore inferior to the emission or fuel consumption related charges in the first group of measures. These are however strongly opposed measures, the implementation of which must be carefully considered.
3.4.3. Conclusions One of the objectives of SULOGTRA, after the identification and characterisation of the logistical trends was to answer the question of: ‘Who is promoting trends in logistics?’ The answer was obtained through the analysis of diverse elements throughout the project, including case studies and questionnaires. The conclusion that can be drawn is that logistics trends are promoted more strongly by entities that already rely heavily on technology, that have a complex supply chain and thus, search to maximise productivity gains. Two kinds of companies fit in this characterisation: Third Party Logistics Providers (3PLP’s) and the companies related to automotive production. One of the shortcomings identified in SULOGTRA is the difficulty of characterisation of the logistics sector as a statistical entity. This fact, added to the conclusion that there is no common definition of the activities performed within the logistic sector, leads to a shortage of statistical data that is evident either at national or at European level. Within logistics, the sector with greatest data availability is the freight transport sector, which has a well-defined scope of actuation. Logistical activities other than warehousing are either aggregated to other data or are not considered for statistical purposes. The definition of logistical activities varies from company to company and activities that might be considered to be ‘logistical’ in one company might not be considered as such in another one. Even the importance of logistics may vary between an autonomous department in a company or being subordinated to another one, especially in smaller companies. To overcome this problem, a common definition of the concept of logistics for statistical purposes is needed and the identification of the associated activities must be performed. At company level this identification may be more difficult to achieve, but it can be made, for example, in process-oriented companies where logistical activities can be defined and identified. The skills shortages in the logistics sector are another issue that might become relevant in the near future. Logistics is a sector, which has been undergoing deep changes related to the introduction of information and communication technology of which telematics, internet and specific software are but a few examples. Given the fact that logistics markets are dominated by small and medium-sized companies there is little room for immediate problem solving due to the limited financial resources of its players. The continuation of this situation will eventually lead to a dichotomy: large companies will invest in technology and in highly skilled manpower, further promoting logistical trends, while small companies will rely on inexpensive services based in a cheap workforce. The impacts of this situation in transport (especially road transport) are negative. Small companies vehicle fleets will be intensively used and will age due to fewer replacement by new vehicles caused by diminishing profits. Those vehicles will be responsible for more pollution with lower safety standards. In the result SULOGTRA focused on the acceptability and effectiveness of political measures and identified factors that exert their influence in the logistics sector. SULOGTRA has helped to identify key drivers of the most recent logistics trends and has comprehensively characterised them and evaluated their impact in freight transport. Furthermore it presented concrete measures aimed at curbing the growth of road freight transport and achieving medium and long-term EU policy objectives in transport, environment, infrastructure-related and social and economical areas.

Effects on Transport of Trends in Logistics and Supply Chain Management Supply ChainManagementLogisticsand their effects onTransport
SULOGTRATRA
LOG
SU
42
4. Exploitation and Dissemination of Results
4.1. SULOGTRA Website The major dissemination outlet of SULOGTRA is the joint web-site with PROTRANS - the complementary project to SULOGTRA dealing with role of Third Party Logistics Providers (3PL) and their impact on transport. This comprehensive web site was created to provide the opportunity to the public to gather information, first of all on the results, but also on the consortium structure, the objectives and the resulting methodologies etc., the sites can be accessed via
<www.logistik.tu-berlin.de/sulogtra+protrans>. The following figures give an impression of the basic design and the fields covered.
Figure 14: Joint SULOGTRA - PROTRANS web site - project introduction page and navigation bar
4.2. Consortium Activities In addition to the outlet established with the web site an number of dissemination activities have been undertaken by the consortium members.The major objective of the special Work Package - Dissemination and Exploitation of Results - comprised, first the stimulation and then second, the co-ordination of these dissemination activities of all consortium members. Following is a list of activities, as they have been carried out during the project and are planned on short term after its finalisation, which may serve as a reference list on SULOGTRA:
Effects on Transport of Trends in Logistics and Supply Chain Management Supply ChainManagementLogisticsand their effects onTransport
SULOGTRATRA
LOG
SU
43
1. Journal Articles Cuthbertson, R.W. and Collet, F. (2001) 'The Collaboration Network' European Retail Digest, December McKinnon, A.C. (2000) 'Sustainable Distribution: Opportunities to Improve Vehicle Loading' Industry and Environment (United Nations Environment Programme), vol.23, no. 4. Baumgarten, H, Kasiske, F. and Zadek, H (2002) 'Logistik-Dienstleister - Quo Vadis?' Logistik Management 1/2002, forthcoming in March 2002 (in German) Baumgarten, H.and Zadek, H. (2002) 'Netzwerksteuerung durch Fourth-Party-Logistics-Provider (4PL)' - in: Hossner, R. (Hrsg.): Jahrbuch der Logistik 2002; Verlagsgruppe Handelsblatt; Düsseldorf 2002; S. 14-20 (in German) Zografos, K.G., I.M. Giannouli (2001) 'Development and Application of a Methodological Framework for Assessing Supply Chain Management Trends' International Journal of Logistics: Research and Applications, vol.4 no.2. Zografos, K.G., I.M. Giannouli (2002) 'Emerging Supply Chain Management Trends' Logistics and Management, (forthcoming) (in Greek) 2. Conference Presentations and Proceedings Black, I. (2001) 'Transeuropean Networks and the Logistic National System', 5th International Transport Conference, Lisbon June 2001. Black, I. (2001) 'A Demand Driven Freight Transport System for the Supply Chain', IEEE 2001 Conference Proceedings, Oakland, August 2001. Bozuwa, J. and Piers, R. (2001) 'Het lokatiekeuzeproces en waardetoevoeging in supply chains' (Location Choice Proces and Value Adding in Supply Chains). Paper presented to Vervoerslogistieke werkdagen conference Corsendonck, Belgium. 8 and 9 November 2001 Kasiske, F. and Tufinkgi, P. (2002) 'Supply Chain Collaboration im europäischen Kontext' paper presented at ‘Logistik-Praxisseminar 2002 - Supply Chain Steuerung & Services - Vision, Realität, Perspektiven" ,Berlin January 2002. McKinnon, A.C. (2000) Series of four workshops on Freight Transport Developments within the EU at the Logistics 2000 Conference (on board the P&O Aurora) (October 2000) McKinnon, A.C. and Foster, M. (2001) ' Effects of Product Design and Packaging on Freight Vehicle Utilisation' in Proceedings of the Logistics Research Network Conference 2001, Institute of Logistics and Transport, Corby. Templeton College (2002) Session on SULOGTRA at conference to be hosted at the University of Oxford in Spring 2002 TUB / ZLU (2002) Presentation of WP 7 results to 2002 German BVL-Logistics Conference (BVL Kongress) in Berlin. (forthcoming) ZLU (PixelPark) - Member of panel discussion on SCM at e-Supply Chain Summit, Cannes, Sept. 2001

Effects on Transport of Trends in Logistics and Supply Chain Management Supply ChainManagementLogisticsand their effects onTransport
SULOGTRATRA
LOG
SU
44
ZLU (PixelPark) - presentation of SULOGTRA results and methodologies for all European logistics managers of BASF Zografos K.G., I.M.Giannouli (2000) 'Impacts of Supply Chain Management Organisation on Freight Transportation System Utilization'. Proceedings of the 13th National Conference of Hellenic Operational Research Society, University Of Piraeus, 30/11-1/12 2000 (in Greek) Zografos K.G., I.M.Giannouli (2000) 'Outsourcing Logistical Operations: Assessment of the Existing Situation and Industry Perspectiveness', Proceedings of the 5th national Conference of SOLE, Athens, 29-30 September 2000 (in Greek) Zografos, K.G., I.M. Giannouli, 2001, “Impacts of Logistical Trends on freight Transport in Europe”, Presented at the 80st Transportation Research Board Meeting (TRB), Washington, D.C. 7-11 January 2001, U.S. Zografos, K.G., I.M. Giannouli (2001) 'Emerging Trends of Logistics in the e-Commerce Environment', E-Commerce Show, 6-7, June 2001, Athens Zografos, K.G., I.M. Giannouli (2001) 'Impact of SCM Trends on the Spatial Organization of Logistical Networks', Proceedings of the 17th International Logistics Conference, pp. 623-641, Thessalonoki 18-20 October 2001, Greece Zografos, K.G., I.M. Giannouli (2002) 'Emerging trends in Logistics and their Impact on Freight Transportation System: A European Perspective', Proceedings of the 81st Transportation Research Board Meeting (TRB), Washington, D.C. 13-17 January 2002, U.S. 3. Book Chapters McKinnon, A.C. (2001) 'Integrated Logistics Strategies' in Brewer, A.M. Button, K.J. and Hensher, D. A. 'Handbook of Logistics and Supply Chain Management' Pergamon, London, pp 157-170. McKinnon, A.C. (2002) 'Sustainable Freight Distribution' in Preston, J. and Hine, J. (eds) ' Integrated Futures and Transport Choices' Ashgate, Aldershot, 2002 (forthcoming) 4. Dissertations related to SULOGTRA Giannouli M.I, 2001, Development and Implementation of a Model for Strategic Supply Chain System Management, Ph.D. Dissertation. Athens University of Economics and Business, Department of Management Science and Marketing, 2001 5. Reference to SULOGTRA results in Teaching and Short Courses • Athens University of Economics and Business: (i) post-graduate and graduate level courses of the 1. Supply Chain Management 2. Intermodal Terminal Operations
Effects on Transport of Trends in Logistics and Supply Chain Management Supply ChainManagementLogisticsand their effects onTransport
SULOGTRATRA
LOG
SU
45
(ii) short courses: Emerging Supply Chain Management Trends in the e-Economy Environment, 2001, Seminar on Digital Economy and e-Management, Athens University of Economics and Business, Athens, Greece, 9-10 April 2001 • Centre for Logistics and Transportation, Cranfield University (i) post-graduate courses: MSc courses in Logistics and Supply Chain Management (full-time and executive) (ii) short courses: Executive Development Short Course Programme Executive Development Company Programme (Heineken) • School of Management, Heriot-Watt University (i) undergraduate programme: MA Management (Logistics and Supply Chain Management final year elective) (ii) postgraduate course: MSc in Logistics and Supply Chain Management • Logistics Department, Technical University of Berlin post graduate courses (Diplom) - Verkehrslogistik (transport logistics) and - Logistik Management - Logistik-Praxisseminar 6. Press releases A joint PROTRANS-SULOGTRA press release has bee n distributed in fall 2002, which has resulted in an increase of the traffic on the joint web presence and requests for reports. A second press release is planned for late spring 2002 to announce the finalisation of the project and the availability of all results. 7. Advisory Board Another very important activity of the consortium has been the continuous reporting to the Advisory Βoard. The Advisory Board for SULOGTRA functions as a focus group and has helped the SULOGTRA project partners in many ways. Its functions are to obtain advice on the design of the research and feedback on main findings, secure industrial co-operation for SULOGTRA and on the other hand to encourage the European industry to improve logistical and supply chain performance. During the SULOGTRA project there were three meetings with the Advisory Board. A fourth meeting is planned for September 2002 with the participation of SULOGTRA personnel.

Effects on Transport of Trends in Logistics and Supply Chain Management Supply ChainManagementLogisticsand their effects onTransport
SULOGTRATRA
LOG
SU
46
5. Project Result and Conclusions In view of the achieved results the project can be considered as successful. The project work plan technically was built on the experiences and identified lacks in previous research projects, which have not been filled by other resources yet. Some interpretation of the Description of Work was necessary, i.e. due to lacks of available data but always undertaken focussing on the objectives of the project. The objectives have been met, the tasks defined in the technical Annex - Description of Work were fulfilled. The recommendations given by the Advisory Board were incorporated properly, the results have been appreciated and discussed and enriched during the Advisory Board Meetings and workshops. The results of the Work Packages one to seven formed the basis for the elaboration of policy implications and advise derived in Work Package eight, resulting into an assessment of the lessons learned and to be disseminated for the facilitation of an efficient supply chain management and network configuration in terms of relevant policy implications. The project met the objectives set by the European Commission. The establishment of the Commission’s new unit, “Intermodality and Logistics”, underlines the importance on the one hand of process-focussed cross-border and cross-sectoral approaches, as they are the core focus of logistical thinking and problem solving, and on the other hand of its recognition not only in business but also in policy-making.

Effects on Transport of Trends in Logistics and Supply Chain Management Supply ChainManagementLogisticsand their effects onTransport
SULOGTRATRA
LOG
SU
47
6. Acknowledgements The success of this project would not have been possible without the help of the following people and groups: The members of the Advisory Board, who provided advice and support throughout the entire process, here in particular:
Mr Claes Berglund, Schenker Sverige, S Mrs Silvia Diedrichsmeier, DaimlerChrysler, D Mr Simon Dijkstra, IJmond Transport Groep, NL Mr Mick Jackson, Freight Transport Association, UK Mr Bjorn Hondelink, Dutch Ministry of Spatial Planning; NL Mrs Irene Moonen, NOVEM Mr Joachim Prengel, BASF Mrs Venja Slots, Dutch Ministry of Spatial Planning; NL Mr Anders Tennby, Schenker Sverige, S Mr Herman A. Vos, International Road Union Mr Peter Wolters, European Intermodal Association Mr Matthias Ziege, DaimlerChrysler, D
The companies who permitted the data collection, who receive our hearty thanks, but for reasons of confidentiality cannot be listed here individually. The Commission, who made this project possible in the first place, especially the three project officers: Karel Vanroye, Patrick Mercier-Handisyde, and particularly Mark Major, who was always available for help to the project consortium and to answer any kind of questions.