sulfur determination in food by the flashsmart elemental ... · pdf filethermo scientific...
TRANSCRIPT
Sulfur determination in food by the Thermo Scientific FlashSmart Elemental Analyzer coupled with FPD Detector
APPLICATION NOTE 42186
AuthorsDr. Liliana Krotz, and Dr. Guido Giazzi Thermo Fisher Scientific, Milan, Italy
KeywordsCombustion, Food Quality, Labeling, Pasta, Protein, Trace Sulfur Analysis
IntroductionSulfur is an essential component of living matter. Sulfur deficiency has a negative influence on the quality of proteins through the synthesis of amino acids such as cysteine, cystine and methionine and the synthesis of vitamins. There is also a link between sulfur intake and some pathologies such as ulcerative colitis.
The importance of sulfur testing in foods has grown in the last years and many of the classical methods are now no longer suitable for routine analysis.
Analytical instruments based on the combustion of samples improve the reliability of the data, without the use of hazardous chemicals.
Total sulfur content can be accurately determined by using the Thermo Scientific™ FlashSmart™ Elemental Analyzer coupled with a Flame Photometric Detector (FPD). The method combines the advantages of an elemental analyzer with the sensitivity, selectivity and robustness of a FPD. The coupling is simple and it allows the determination of total sulfur at low concentrations (5-10 ppm) in the same instrument without matrix effect.
GoalThis application note shows the reproducibility of the Thermo Scientific FlashSmart EA coupled with FPD Detector for the analysis of low concentration of sulfur in foods.
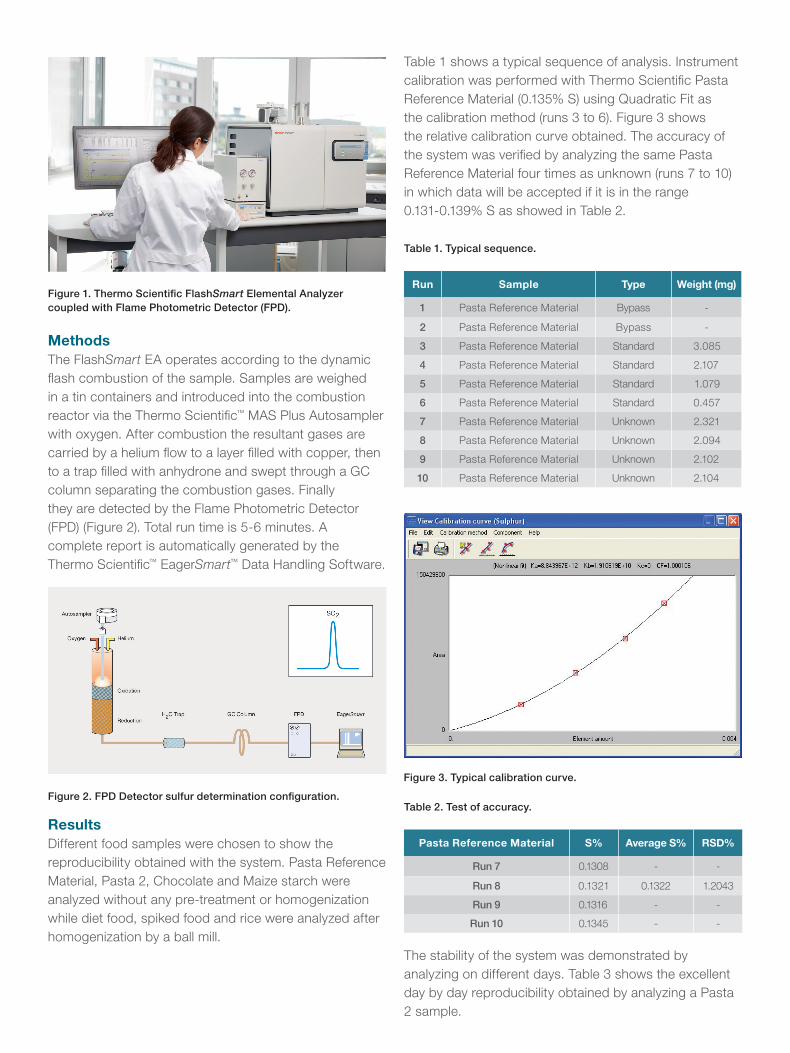
Figure 1. Thermo Scientific FlashSmart Elemental Analyzer coupled with Flame Photometric Detector (FPD).
Figure 2. FPD Detector sulfur determination configuration.
MethodsThe FlashSmart EA operates according to the dynamic flash combustion of the sample. Samples are weighed in a tin containers and introduced into the combustion reactor via the Thermo Scientific™ MAS Plus Autosampler with oxygen. After combustion the resultant gases are carried by a helium flow to a layer filled with copper, then to a trap filled with anhydrone and swept through a GC column separating the combustion gases. Finally they are detected by the Flame Photometric Detector (FPD) (Figure 2). Total run time is 5-6 minutes. A complete report is automatically generated by the Thermo Scientific™ EagerSmart™ Data Handling Software.
ResultsDifferent food samples were chosen to show the reproducibility obtained with the system. Pasta Reference Material, Pasta 2, Chocolate and Maize starch were analyzed without any pre-treatment or homogenization while diet food, spiked food and rice were analyzed after homogenization by a ball mill.
Table 1 shows a typical sequence of analysis. Instrument calibration was performed with Thermo Scientific Pasta Reference Material (0.135% S) using Quadratic Fit as the calibration method (runs 3 to 6). Figure 3 shows the relative calibration curve obtained. The accuracy of the system was verified by analyzing the same Pasta Reference Material four times as unknown (runs 7 to 10) in which data will be accepted if it is in the range 0.131-0.139% S as showed in Table 2.
Table 1. Typical sequence.
Table 2. Test of accuracy.
Run Sample Type Weight (mg)
1 Pasta Reference Material Bypass -
2 Pasta Reference Material Bypass -
3 Pasta Reference Material Standard 3.085
4 Pasta Reference Material Standard 2.107
5 Pasta Reference Material Standard 1.079
6 Pasta Reference Material Standard 0.457
7 Pasta Reference Material Unknown 2.321
8 Pasta Reference Material Unknown 2.094
9 Pasta Reference Material Unknown 2.102
10 Pasta Reference Material Unknown 2.104
Pasta Reference Material S% Average S% RSD%
Run 7 0.1308 - -
Run 8 0.1321 0.1322 1.2043
Run 9 0.1316 - -
Run 10 0.1345 - -
Figure 3. Typical calibration curve.
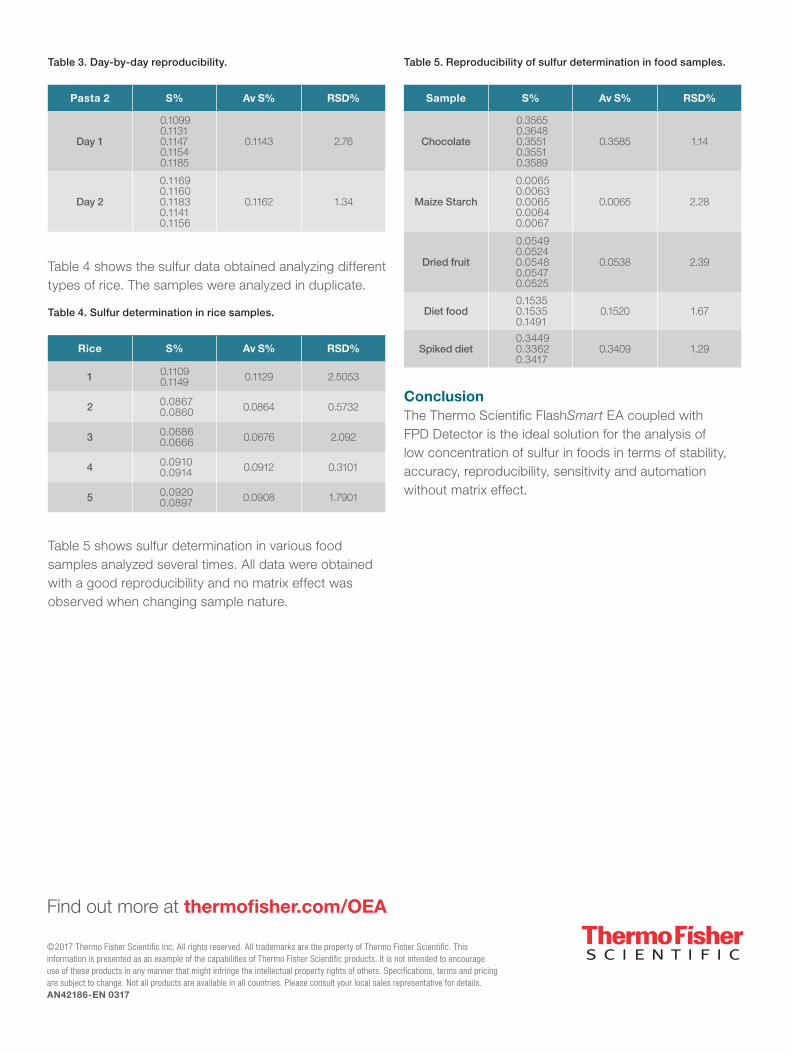
The stability of the system was demonstrated by analyzing on different days. Table 3 shows the excellent day by day reproducibility obtained by analyzing a Pasta 2 sample.
©2017 Thermo Fisher Scientific Inc. All rights reserved. All trademarks are the property of Thermo Fisher Scientific. This information is presented as an example of the capabilities of Thermo Fisher Scientific products. It is not intended to encourage use of these products in any manner that might infringe the intellectual property rights of others. Specifications, terms and pricing are subject to change. Not all products are available in all countries. Please consult your local sales representative for details. AN42186-EN 0317
Find out more at thermofisher.com/OEA
Table 3. Day-by-day reproducibility. Table 5. Reproducibility of sulfur determination in food samples.
Table 4. Sulfur determination in rice samples.
Pasta 2 S% Av S% RSD%
Day 1
0.10990.11310.11470.11540.1185
0.1143 2.76
Day 2
0.11690.11600.11830.11410.1156
0.1162 1.34
Rice S% Av S% RSD%
1 0.11090.1149 0.1129 2.5053
2 0.08670.0860 0.0864 0.5732
3 0.06860.0666 0.0676 2.092
4 0.09100.0914 0.0912 0.3101
5 0.09200.0897 0.0908 1.7901
Sample S% Av S% RSD%
Chocolate
0.35650.36480.35510.35510.3589
0.3585 1.14
Maize Starch
0.00650.00630.00650.00640.0067
0.0065 2.28
Dried fruit
0.05490.05240.05480.05470.0525
0.0538 2.39
Diet food0.15350.15350.1491
0.1520 1.67
Spiked diet0.34490.33620.3417
0.3409 1.29
Table 4 shows the sulfur data obtained analyzing different types of rice. The samples were analyzed in duplicate.
Table 5 shows sulfur determination in various food samples analyzed several times. All data were obtained with a good reproducibility and no matrix effect was observed when changing sample nature.
ConclusionThe Thermo Scientific FlashSmart EA coupled with FPD Detector is the ideal solution for the analysis of low concentration of sulfur in foods in terms of stability, accuracy, reproducibility, sensitivity and automation without matrix effect.