sulfide stress cqrrosion cracking welded joints welded
TRANSCRIPT
ISIJ International, Vol. 34 (1 994), No. 2, pp, 217-223
Sulfide Stress CQrrosion Cracking in Welded Joints of WeldedLine pi pes
Shigeru ENDO.Moriyasu NAGAE.YasuoKOBAYASHIand Kazuyoshi UME1)
FukuyamaResearch Department, Materials and Processing Research Center, NKKCorporation, Kokan-cho. Fukuyama,Hiroshima-ken, 721 Japan. 1)FukuyamaWorks, NKKCorporation. Kokan-cho. Fukuyama,Hiroshima-ken, 721 Japan.
(Received on ;lugust 18. l993; accepted in final form on October 22. l993)
The sulfide stress cracking (SSC) behavior of welded linepipes has been studied using someSSCtests,
such as tensile SSCtest (NACE-TM0177-90 MethodA), full thickness SSCtests, four points bendingSSCtests and full scale SSCtests. Detailed metallographic examinations have been performed in order toundeTstand the influences of steel chemistries and heat inputs in welding on the SSCresistance of the heataffected zone. The effects of the geometry of the SSCspecimen and hydrogen concentration on the SSChave also been investigated. The resu[ts have indicated that homogenizedbainitic ferrite microstructure,
which can be attained by reducing carbon content and by applying accelerated cooling after controlledrolling in plate rolling process, improves the resistance of steel plates to the SSC.Meanwhile, mostspecimensfrom submergedarc welding welded joints fai] at the heat affected zone, regardless of differences in
the rr'icrostructures of base materials, and they tend to shownearly the samelevel of the ratio of thresholdstress to yield strength in the tensile SSCtests. Specimengeometry and the quantity of hydrogen con-centration in stee[ affect on the threshold stress, and hence reducing the hydrogen concentration improvesthe SSCresistance of the welded joints especially in lower hardness heat affected zone. Relations betweenthe resu[ts of the laboratory tests and full scale tests are also discussed.
KEYWORDS:sulfide stress cracking; hydrogen induced cracking; welds; heat affected zone, Iinepipes;
bainitic ferrite; ferrite-pearlite.
1. Introduction
Sulfide stress cracking (SSC) resistance as well ashydrogen-induced cracking (HIC) resistance should beconsidered important to linepipes for sour oillgas service
because the pipes are highly stressed by internal pres-sure. In fact, a numberof reports have indicated that
somefailures in sour gas pipelines could be caused bydevelopment of SSCnear welds.1~3) The hardnessdependency of SSCsusceptibility could not explaincracking in such low or mediumstrength steels of weldedlinepipes. Since those failures were reported, metallo-graphic investigation of welds has indicated that mi-crostructural changes, including secondary precipita-
tions during welding as well as hardness and residual
stress distributions, have a significant influence of the
SSCresistance of the welds.4~8)
In this paper, SSCbehavior in welded linepipes is
metallographically investigated focussing on the relation-
ship between microstructures and SSCresistance of theweld. Full thickness specimens with reinforcements
as well as NACETMO177-90 MethodAspecimenswereused to determine the effects of geometry and hydrogenconcentration of the specimenson the SSC.Using results
obtained from a variety of laboratory tests and full scale
SSCtests, a correlation betweenthe small scale SSCtest
results and the SSCoccurring in sour gas pipelines is
also discussed.
2. SSCResistance Obtained by Tensile SSCTest (NACETM0177-90 MethodA)
2.1. Experimental Procedures
Tensile SSCtests set forth in NACETM0177-90MethodAwere carried out with the base material andwelded joints of welded linepipes. A11 test specimens for
the welds were sampled such that their axes wereparallel to the circumferential direction and perpendicu-lar to the straight seamwelds. The test specimens for
welded joints were cut from internal welds of thelinepipes. The test material used were API 5L X42-X70steel plates and welded linepipes with various micro-structures. These steel plates were produced by thecontrolled rolling (CR) and accelerated cooling (AcC)following the CR, The microstructure of the plate
manufactured by CRprocess consisted of ferrite andpearlite, and that of additional AcCresulted in fine grainbainitic ferrite. Thechemistry range of all materials testedis shownin Table 1.
2.2. Test Results
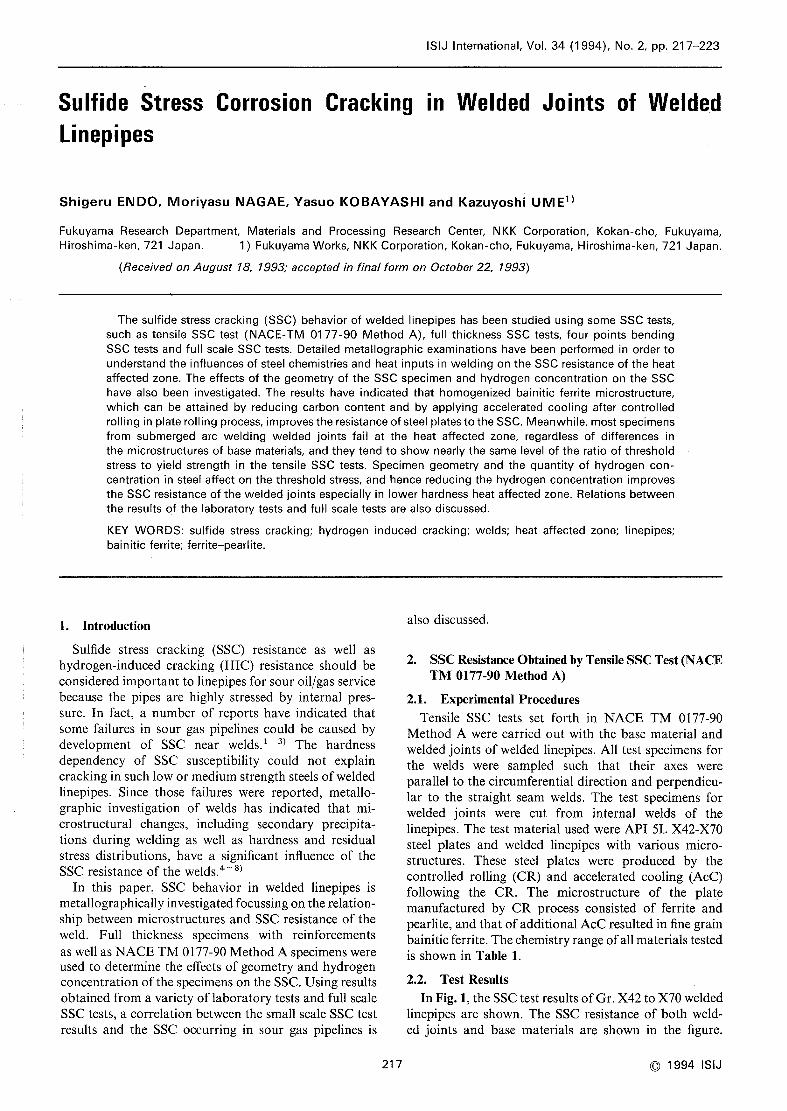
In Fig. l, the SSCtest results of Gr. X42to X70weldedlinepipes are shown. The SSCresistance of both weld-ed joints and base materials are shown in the figure.
21 7 C 1994 ISIJ
ISIJ International, Vol.
The vertical axis of the figure represents the ratioof threshold stress to yield strength (crth/(Ty). The ratiosfluctuated in the range from 0.6 to O.9 for base materialsand no strength dependencywas seen in the steels ofthese grade. Fromthe SSCresistance of the basematerialswith yield strength of about 500N/mm2,it is clear thatthe base material specimens with bainitic ferrite micro-structure (BF-) which can be obtained by the AcCproc-ess, tends to showbetter SSCresistance than that withferrite and pearlite microstructure (F-P-). The ratios
Table 1. Chemical composition of the tested steels. ('/.)
Grade t (mm) C Si Mn P S Others
34 (1 994).
X42
X70
16
25
0.02
0.17
0.19 0.89 0.004 0.001
0.30 1,9 1 O.021 0.004
Cu, Ni, Cr, Nb
V, Ti, B, Ca
No. 2
of cr,,,/ay of the base materials with bainitic ferrite
microstructure lay between 0.8 and 0.9 and those withferrite/pearlite microstructure are 0.5 to 0.7. On thecontrary, the a,hl(Ty ratios of the weldedjoints lay between0.5 and 0.9 regardless of strength and microstructures ofbase materials. TheSSCin the welded joints wasalwaysobserved in the intercritical HAZthat was reheated too( +y temperature by welding thermal cycle.
This indicates that fine and homogenized bainiticferrite microstructures free from pearlite lead to a higherresistance of the base material to the SSC,but the SSCresistance of the welds seemsto be influenced by othermetallurgical factors rather than the microstructure ofthe base materials.
J:a,
O,,,
11(D
>,n,,,
(D
,O
~O,:,,,
C,
=h
0~
~o
1.o
0.9
0.8
0.7
o.6
o.5
0.4
O
D
F-P•Bas
F*P*Weld
BF•Base
BF-Weld
oe oOpen;BasemetalSolid; Weldedjoint
D
EIIDalle
elo(l
DE]
l
Fig. 1.
300 4OO 700500 600
Yield strength,YSINlmm2
SSCproperties of base material and welded joints oflinepipe steels,
3. The Governing Factors of the SSCin WeldedJoints
3. 1. Experimental ProcedureIn order to makeclear metallurgical factors influencing
the SSCof the welded joints of linepipes, full thicknessspecimens of the 38mmwide and 50mmlon~ gaugelengths with welded joints of four linepipe steels werealso used for SSCtests. Their chemistries are shownin
Table 2. Steel A is' API Gr. X52and its microstructureconsists offerrite andpearlite. TheSteels B, CandDareAPI Gr. X65, X70andX80, respectively. Microstructureof the Steels B, Cand Dis composedof fine grain bain-itic ferrite, therefore, the ratios of athl(Ty of their basematerials are 0.8. Simulation straight seamSAWwelding
wascarried out on these materials in the laboratory. Theratios of athl(Ty of their welded joints in NACETM0177-90 MethodA are also shown in the Table. Fullthickness with weld reinforcement SSCtest as well as
Table 2. NACE-SSCtest results.
SteelMicro-
structureGrade C
(mm) ("/')
Si
("/.)Mn(o/')
P(ppm)
S(ppm)
Othersathla
yay* Base'Tthl(ry
(N/mm2)metal SAW
ABCD
F-PF-BFBFBF
X52X65X70x80
19
2519
19
0.09
o,040.020,05
O.29
0.28
0.25O. 19
0.85
l .55
l.91
l .90
7040210110
lO
lO
lO
lO
Nb, V, CaCu, Ni, Nb, V, Ca
Nb, B, CaMo, Nb, B, Ca
404
502566612
o.60 0.600.80 0.60o.80 0.55
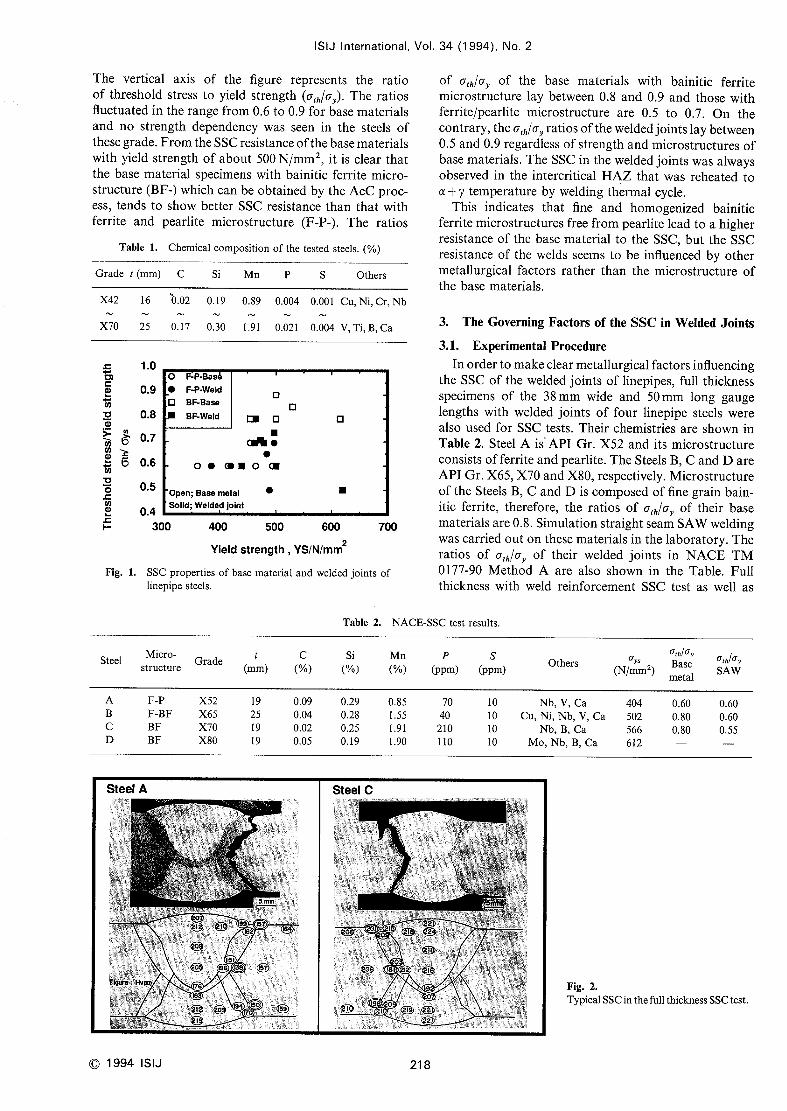
Fig. 2.
Typical SSCin the full thickness SSCtest.
C 1994 ISIJ 218
ISIJ International, Vol.
NACEstandard tensile SSCtests were performed toinvestigate geometrical effects of the specimen on the
SSCoccurrence.Different microstructures in the HAZof Steel Awere
simulated by using the Gleeble Tester and examinedfor
the SSCresistance by the NACEstandard tensile SSCtest. In this test 70 "/, of the yield strength of the original
basematerial and 80 '/* of each simulated HAZspecimen
were employedas applied stresses for the SSCtest.
3.2. Observation of SSCin Full Thickness SSCTest
Typical SSCobserved in the full thickness SSCtests
are indicated in Fig. 2. SSCmorphologyof Steels AandC in their welded joints are shown in the figure. Thehardness of weld metal and HAZare also shownin thefigure. SSCwasobserved to propagate in the intercritical
HAZ(reheated to c( +y temperature) of Steel A, but nocrack developed near the fusion line that indicated the
maximumhardness and stress concentration in the HAZ.As shown in the Fig. 3, a numberof planner-orientedfine cracks were also found in the intercritical HAZ.Supercritical tensile stress is considered responsible for
the generation of these cracks because the weld showedno cracks in the sameregion during a test without stress.
Similar SSCmorphology to Steel A was observed in
the full thickness SSCtest of Steel B. In the SSCtest ofwelded joints of Steel C, SSCpropagated along withfusion line and intergranular fracture surface wasobserved by SEM.Similar cracking were observed in
HIC test and occurrence of these cracks were caused bydecreasing in the strength of the grain boundary ascompared to that of the matrix of the fusion line
associated with reduced carbon content in Nbbearingsteels.8) The weld of Steel D, in which the maximumhardness wasmore than Hv260, developed SSCacross
34 (1 994), No. 2
the weld metal and the HAZshowing the maximumhardness.
Therefore, the configurations of the cracks observedin HAZwere classified into three different morphologiesdepending on steel chemistry and HAZhardness.
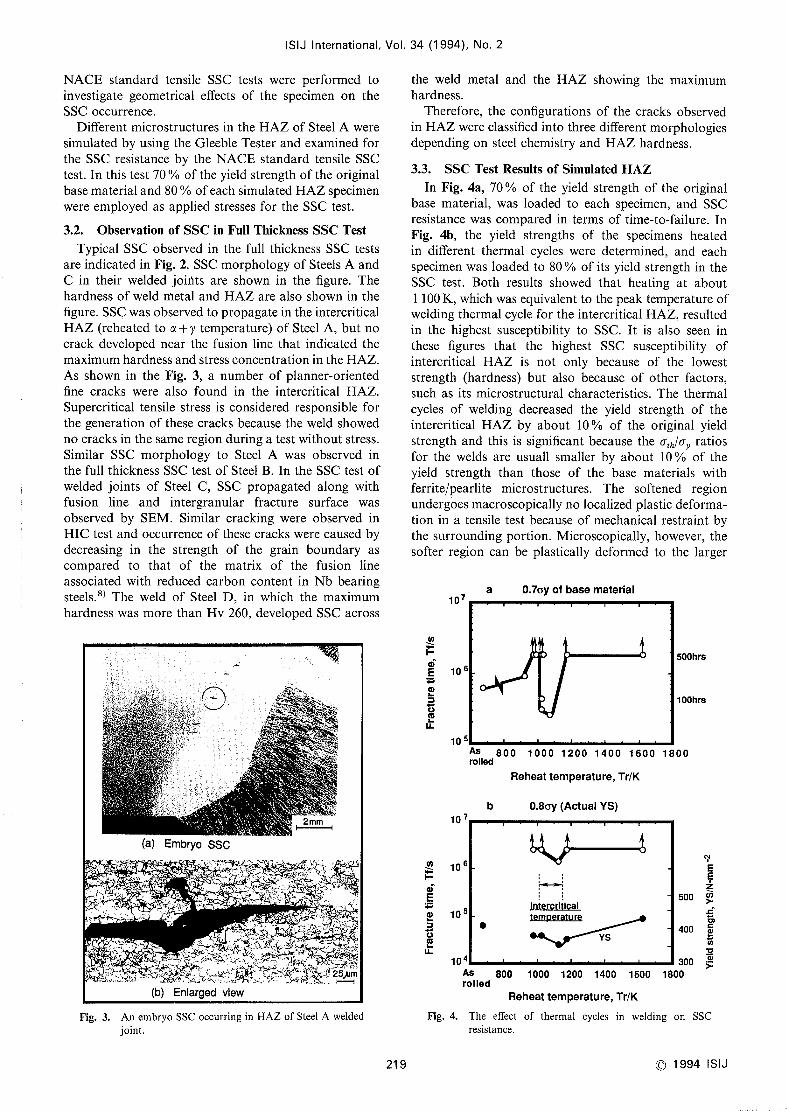
3.3. SSCTest Results of Simulated HAZIn Fig. 4a, 70 o/o of the yield strength of the original
base material, was loaded to each specimen, and SSCresistance wascomparedin terms of time-to-failure. InFig. 4b, the yield strengths of the specimens heatedin different thermal cycles were determined, and eachspecimenwas loaded to 800/0 of its yield strength in the
SSCtest. Both results showed that heating at aboutl 100K, which wasequivalent to the peak temperature ofwelding thermal cycle for the intercritical HAZ,resultedin the highest susceptibility to SSC. It is also seen in
these figures that the highest SSCsusceptibility ofintercritical HAZis not only because of the loweststrength (hardness) but also because of other factors,
such as its microstructural characteristics. The thermalcycles of welding decreased the yield strength of theintercritical HAZby about 100/0 of the original yield
strength and this is significant because the (Tthl(Ty ratios
for the welds are usuall smaller by about 100/0 of theyield strength than those of the base materials withferrite/pearlite microstructures. The softened regionundergoesmacroscopically no localized plastic deforma-tion in a tensile test because of mechanical restraint bythe surrounding portion. Microscopically, however, thesofter region can be plastically deformed to the larger
107
/~i':~l
a 0.7oy of base material
o,
F,S
E 106
o:,
o,5LL
105
50Ohrs
1OOhrs
co
ha'
Eo5o,cLL
107
Asrolled
b
8OO 100O 1200 1400 1600 1800
Reheattemperature, TrlK
0.8oy (Actual YS)
106
105
lod
e
}~~){
!nS~:Gr!i~~Lsemp~~~~~~:
YS
500
400
Fig. 3. AnembryoSSCoccurring in HAZof Steel Aweldedjoint.
21 9
300
E~~_
U)>ia,*d,
~5
1'~;
>As 800 100O 1200 1400 1600 1800rolled
Reheattemperature, TrlK
Fig. 4. The effect of thermal cycles in welding on SSCresistance.
C 1994 ISIJ

ISIJ Internationa], Vol. 34 (1994), No, 2
extent whenthe welds is stressed to near yielding, which stressed to either 80 or 85 o/. of spccific minimumyield
maylead to a high possibility of developing SSCin the strength (SMYS)by pressurizing with a test solution.intercritical HAZ. The test solution wasprepared in a tank and circulated
Figure 5 shows cracks and their surrounding mi- to keep the solution chemistry constant in the pipe. 5olo
crostructure in the intercritical HAZof Steel A. The NaCl+0.50/* acetic acid saturated with I atm H2Sgas,intercritical HAZcan be characterized by ahigh tendency which is set forth in the NACETMOl 77-90 Methodtowards formation of Martensite-Austenite constituent A, wasemployed.(MA). In the case ofSteel A, Gr. X52ferrite and pearlite
4.2. The Effect of Hydrogen Concentration on the athsteel, the MAconstituent wasrarely found, andcrackingappeared at retained pearlite rather than at the MA. of SSCTests
Increasing in the alloy content increases the tendency Figure 7showsstress vs. time-to-failure curves obtainedtowards formation of the MAin the intercritical HAZ.For this reason, cracking at the MAis more likely to
appear in the intercritical HAZof Gr. X65 or higherstrength steefs. The HAZof the Steel B showed aconsiderable amountof the MA.However, cracks here
were developing along pearlite rather than the MA.These observations suggest that the presence of the
MAis not always a primary factor for the SSCsuscep-tibility of the intercritical HAZ.Adecrease in the yieldstrength combined with the metallographical featuresdescribed above can be responsible for the rupture ofthe intercritical HAZin the SSCtests, with slightly
smaller a,hl(Ty ratio than those of base materials.
4. The Effects of Testing Condition on the SSC4.1. Experimental Procedure
In order to examine the effect of hydrogen concen-tration in steels on the a,,, of the SSCtests, four typesof SSCtest specimenswere employed. Twoor three sur-face coated full thickness SSCspecimens as well asbare full thickness SSCspecimenwere used for the SSCtest to vary entered hydrogen concentration. NACEstandard tensile SSCtest specimenswere also tested forthe sake of comparison. Gr. X52 Iinepipe wasused forthis test.
Furthermore, 800/*C02-200/.H2S gas as well as 100~/o Flg. 5. EarlystageofcrackinginintercriticaIHAZ(steelA).H2Sgas were used for the NACEstandard tensile SSCtest and four point bending SSCtest to examinethe effect
of hydrogen concentration on the SSCsusceptibility.
Schematic drawing of the four point bending SSCtest
specimen and apparatus are shown in Fig. 6. Threemillimeter thick rectangular specimenswere stressed by 'oo*~
30 40bending to either 50, 100 or 130 o/o of the yield strength L1L2
of the base material and immersed in the NACETMOl 77-90 MethodAtest solution for 720hr. Gr. X46and X65 Iine pipe steels whose chemistries andmechanical properties are summarizedin Table 3wereused for these tests. In order to vary the hardness, SAWwelding with 5kJ/mmheat input and MAGweldingwith 0.3 to I.5kJ/mm heat inputs were performed on st**ss l*~'1 =
s=12.D.E.t/(3L1'-4L2')
the steels. t=3~~In the full scale SSCtest, two meter long pipes were Fig• 6. 4point bending SSCtest.
Table 3. Chemical composition and mechanical properties of the tested steels.
Grade C Si Mn P S Cv Ni Nb Ca YS TS a./af El 50"/. FATT("/.) ("/.) (*/.) (ppm) (ppm) ('/.) ('/.) ('/.) (ppm) (N/mm') (N/mm') ('/.) ('/.) (K)
X46 0.09 0.3 0.8 70X65 0.04 O.3 1.3 70
1O 0.23 O, IOlO 0.26 O, 16
0.01
O.052325
415522
500587
83
884857
178168
C 1994 ISIJ 220

ISIJ International, Vol. 34 (1 994), No. 2
,,,
>
o
~s
sa
EE
1.21OOhrs 720hrs
1.o
0.8
0.6
o.4
e.o
~~~3~
104
ORoundbar
OFull thlckness,
sidesurface coated
OFull thlckness,slde surface
and outslde weld coated
e Full thickness, noncoated
Fig. 7.
Table
105 1071OG
Timeto failure, Tfls
Theeffect of H2Sconcentration on the SSCproperties
of welded joints.
4. The effect of H2S concentrationproperties :of welded joints.
on the SSC
(1,
>,5:;
OO'O
~~~,l~OO~
1.o
SAW1OOhrs 720hrs
0.9
0.8
0.7
0.6
oe
1no'/.*H 2S
80e/.CO2-20e/QH2S
0.5104
Max.Hv (98N)
crth
o t~
Q~
Steel
(1)
>
~C9
O
~~aOO~
1.o
MAG
105 1Oe
Timeto failure, Tls
100hrs 720hrs
107
lOOo/o H2S800/0C02-200/~H2S
~OO"/. H2S800/*C0220"/oH2S
0.9
X46(F-P)
Basemetal
SAW(5 kJ/mm)
l57
l92(21 l)
0.6ay0.8aJ,
0.6ay
O.8ay
X65(BF)
Basemetal
SAW(5 kJ/mm)
MAG(0.5 kJ/mm)
i93
200(226)
262(397)
0.8(Ty
0.9a),
0.6a.
O.8ay
0.6~y
0.7ay
1000/0 H2S80"/oC02200/0H2S
lOOo/o H2S800/0C02-20"/oH2S
lOO"/o H2S800/*C02-200/0H2S
0.8
0.7
0.6
0.5
oo
1OO'Ie-H2S
80'1eC02-2OeloH2S
IPec~
104
Fig. 8.
( ): Maxmaumhardness of weld metal
for the bare specimen, the coated specimensand NACEstandard tensile SSCspecimens. The ratios of a,h to cry
were similar in the NACETMO1 77-90 MethodAandthe full thickness SSCtest with the bare specimens. Larger(Tthl(Ty ratios were observed in the full thickness coatedspecimens as comparedwith the former two tests, andratio was between 0.8 and 0.9. The ratio was approxi-
mately 40 o/o larger than those of the bare specimens,
whenonly one surface wasexposed to the environment.The ratios of ath to ay of X46and X65welded joints
under 100o/o H2S and 800/0C02-200/0H2S saturated
conditions are shownin Table 4. Themaximumhardnessofthe HAZare also indicated in the table. Themaximumhardness of SAWwelded joints and MAGwelded joint
is approximately Hv200and Hv260, respectively. Therelationship between the applied stress and the time tofailure of the SAWand that of MAGwelded joints of
X65 are shown in Fig. 8. The SSCtest results underO. I MPaof 100o/o H2Sand 800/0C02-20"/oH2Ssaturated
conditions are shown in the figure. Increasing ratio ofcr,h/ay With reducing H2Sconcentration wasobserved in
all the tested welded joints. The incremental increase in
the ratio is larger in the low hardness HAZthan in the
high hardness HAZ, for the ratio of the SAWweldedjoint of both the X46and the X65increases from 0.6 to
0.8 or more, while the ratio became0.7 in the MAGwelded joint of the X65by reducing H2Sconcentration.
Thesesituations coincide well with the test results of full
thickness SSCtest with and without coated specimens.
TheSSCmorphologyof the SAWwelded joint of X46
105 107106
Time to failure, Tls
The SSCproperty of welded joints.
Fig. 9. The SSCmorphology of the SAWand MAGweldedjoint of X65.
and that of the MAGwelded joint of X65are shownin
Fig. 9. TheSSCpropagation behavior changesdepending
on hardness of the HAZ. SSCappeared at the fusionline, that showedapproximately Hv260, the HAZof
MAGwelded joint. Onthe contrary, SSCappeared andpropagated along the intercritical HAZin SAWweldedjoints that showedlower hardness.
Table 5 shows diffusible hydrogen content in the
NACEstandard tensile SSCtest specimens after 8.6 x
221 C 1994 ISIJ
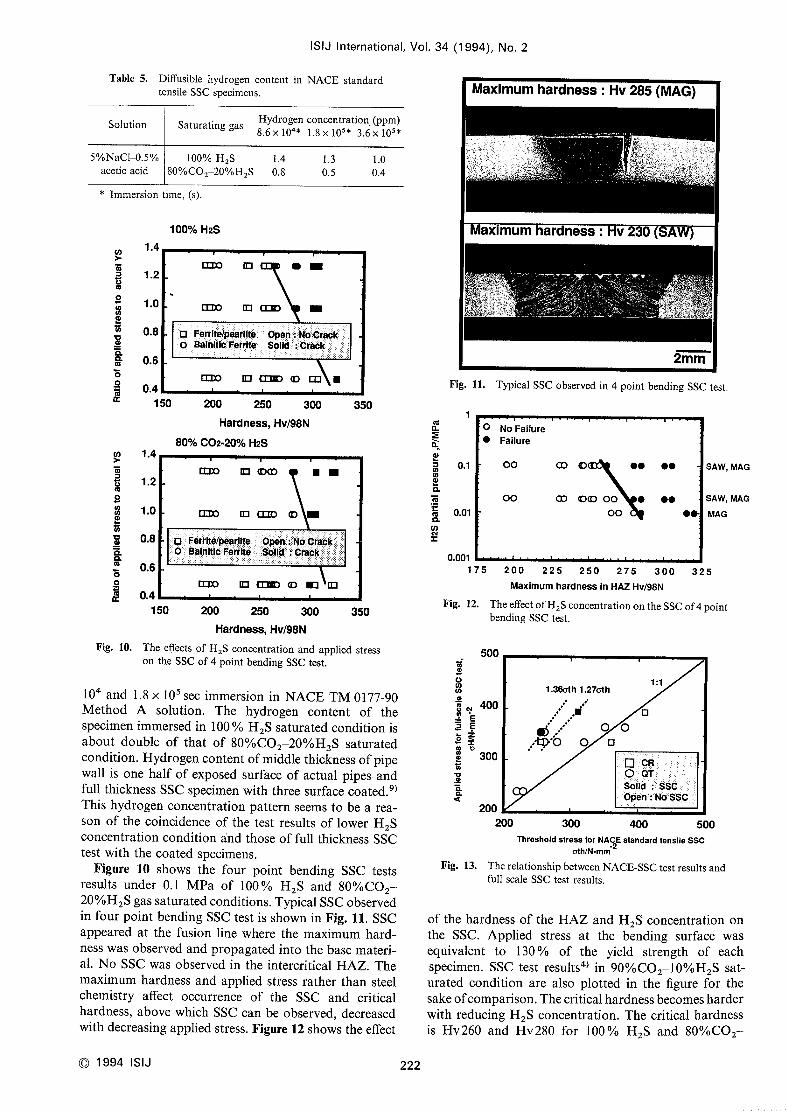
Table 5.
ISIJ International, Vol.
Diffusible hydrogen content in NACEstandardtensile SSCspecimens.
Hydrogenconcentration. (ppm)8.6x 104* 1.8x lOs* 3.6x 105*
34 (1 994), No. 2
Solution Saturating gas
50/0NaCI~).50/0 1000/0 H2Sacetic acid 800/0C02-200/0H2S
* Immersion time, (s).
100'10 H2S
1.4
0.8
1.3
0.5
1.4
a:Do O:l e I1.2
1.o D:DO U:9cDD Io.8 D=
oF,c,rrtte, ~ljbea,! ti,itj'e, i+=
Bal hl'ti,c,:F,idFr,,ie : Sd,k,lif
::::,N,o,=jC,= 'raek+:::
==::C;rae,1'kj+ l, =:::
o.6
D:DO u!a~ o DD I0.4
1.O
0.4
C')
>
~O~~~CL~OO~a:
Maximumhardness : Hv285 (MAG)
Fig, 11. Typical SSCobserved in 4point bending SSCtest.
lco 2OO 25D 300
Hardness*Hvl98N
80'/• C02-20•/• H2S
350
1.4
a:Do O:! oao I I1.2
1.O D:OO U:l a:~D o I0.8
::Q;+:=Ferrl ft, e:/peer,1~te*~=:+:O.
.
'= =n=: :,:I
*=+e ::=B~i~Inii'~ic_'i~d=r,rjit,' ei==:1;,:::S,;Si,id,' :;:,;::1
o.6
o:Bo u: a:lD o I:! U:l
o.4
~=~
*a
E'5a
U,
r
1
co>
~
?;
~~~aE
150 2OO 25O eoO 350Hardness, Hvl98N
The e~ects of H.S concentration and applied stress
on the SSCof 4point bending SSCtest.
0.1
0.01
0,001
175
Fig. 10.
Fig. 12.
NoFallureFailure
OO O ee
O(D oo eOo
SAW,MAG
SAW,MAGMAG
l04 and 1.8 x 10⁵ sec immersion in NACETM0177-90Method A solution. The hydrogen content of thespecimen immersedin 100o/o H2Ssaturated condition is
about double of that of 800/0C02-200/0H2Ssaturatedcondition. Hydrogencontent of middle thickness of pipewall is one half of exposed surface of actual pipes andfull thickness SSCspecimenwith three surface coated.9)This hydrogen concentration pattern seemsto be a rea-son of the coincidence of the test results of lower H2Sconcentration condition atnd those of full thickness SSCtest with the coated specimens.
Figure 10 shows the four point bending SSCtestsresults under 0.1 MPaof 1000/0 H2Sand 8001.C02-200/0H2Sgas saturated conditions. Typical SSCobservedin four point bending SSCtest is shownin Fig. 11. SSCappeared at the fusion line where the maximumhard-ness wasobserved and propagated into the base materi-al. NoSSCwas observed in the intercritical HAZ.Themaximumhardness and applied stress rather than steel
chemistry affect occurrence of the SSCand critical
hardness, above which SSCcan be observed, decreasedwith decreasing applied stress. Figure 12 showsthe effect
C 1994 ISIJ
ti;a'
O'O,,,
~,cl
~LE~E.~Z~~~~,pt)
~va'
aa.,
2OO 225 25O 275 30O 325Maxlmumhardness in HAZHvl98N
Theeffect of H2Sconcentration on the SSCof 4pointbending SSCtest.
500
4oO
30o
200
1.36cth I .27~th
.,~•6
•l
OOO D
D
1:1
iDj C.R:j
SSC:NbsSC
222
Fig.
200 3OO 400 500Thresho'd stress for NAc2Estandard tensile ssc
ath/N•mm13. Therelationship betweenNACE-SSCtest results and
full scale SSCtest results.
of the hardness of the HAZand H2Sconcentration onthe SSC. Applied stress at the bending surface wasequivalent to 1300/, of the yield strength of eachspecimen. SSCtest results4) in 900/,C02-lO"/,H2S sat-
urated condition are also plotted in the figure for thesakeof comparison. Thecritical hardness becomesharderwith reducing H2Sconcentration. The critical hardnessis Hv260and Hv280 for 1000/0 H2Sand 80010C02-
ISIJ International, Vol. 34 (1994), No. 2
oo
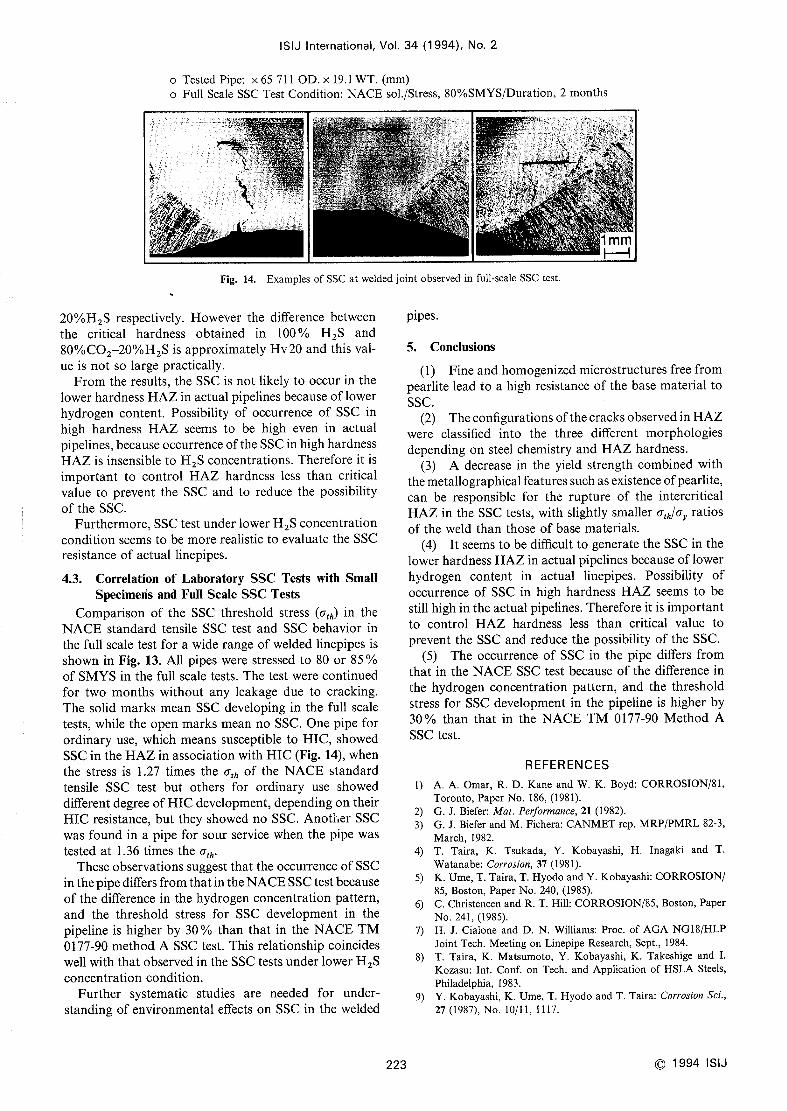
Tested Pipe: x 65 71 1OD.x 19,1 WT.(mm)Full Scale SSCTest Condition: NACEsol./Stress, 80*/.SMYS/Duration, 2months
1mm
Fig. 14. Examplesof SSCat welded jomt observed mfull scale SSCtest
200/0H2S respectively. Howeverthe difference betweenthe critical hardness obtained in 100 "/* H2S and80"/*C02-20"/oH2S is approximately Hv20and this val-
ue is not so large practically.
Fromthe results, the SSCis not likely to occur in the
10werhardness HAZin actual pipelines becauseof lowerhydrogen content. Possibility of occurrence of SSCin
high hardness HAZseems to be high even in actual
pipelines, becauseoccurrence of the SSCin high hardness
HAZis insensible to H2Sconcentrations. Therefore it is
important to control HAZhardness less than critical
value to prevent the SSCand to reduce the possibility
of the SSC.Furthermore, SSCtest under lower H2Sconcentration
condition seemsto be morerealistic to evaluate the SSCresistance of actual linepipes.
4.3. Correlation of Laboratory SSCTests with SmallSpecimeris and Full Scale SSCTests
Comparisonof the SSCthreshold stress ((Tth) in the
NACEstandard tensile SSCtest and SSCbehavior in
the full scale test for a wide range of welded linepipes is
shownin Fig. 13. All pipes were stressed to 80 or 85 "/o
of SMYSin the full scale tests. The test were continuedfor two months without any leakage due to cracking.
The solid marks meanSSCdeveloping in the full scale
tests, while the openmarksmeanno SSC.Onepipe for
ordinary use, which meanssusceptible to HIC, showedSSCin the HAZin association with HIC(Fig. 14), whenthe stress is I .27 times the cr*h of the NACEstandardtensile SSCtest but others for ordinary use showeddifferent degree of HICdevelopment, dependingon their
HIC resistance, but they showedno SSC.Another SSCwas found in a pipe for sour service whenthe pipe wastested at 1.36 times the (T*h.
Theseobservations suggest that the occurrence of SSCin the pipe differs from that in the NACESSCtest becauseof the difference in the hydrogen concentration pattern,
and the threshold stress for SSCdevelopment in the
pipeline is higher by 30'/o than that in the NACETM0177-90 methodASSCtest. This relationship coincides
well with that observed in the SSCtests under lower H2Sconcentration condition
.
Further systematic studies are needed for under-standing of environmental effects on SSCin the welded
pi pes.
5. Conclusions
(1) Fine and homogenizedmicrostructures free frompearlite lead to a high resistance of the base material to
SSC.(2) Theconfigurationsofthe cracks observed i.n HAZ
were classified into the three different morphologiesdepending on steel chemistry and HAZhardness.
(3) A decrease in the yield strength combinedwiththe metallographical features such as existence of pearlite,
can be responsible for the rupture of the intercritical
HAZin the SSCtests, with slightly smaller athlcry ratios
of the weld than those of base materials.
(4) It seemsto be difficult to generate the SSCin the
10werhardness HAZin actual pipelines becauseof lowerhydrogen content in actual linepipes. Possibility of
occurrence of SSCin high hardness HAZseemsto bestill high in the actual pipelines. Therefore it is importantto control HAZhardness less than critical value to
prevent the SSCand reduce the possibility of the SSC.(5) The occurrence of SSCin the pipe differs from
that in the NACESSCtest because of the difference in
the hydrogen concentration pattern, and the threshold
stress for SSCdevelopment in the pipeline is higher by300/0 than that in the NACETM0177-90 MethodASSCtest.
REFERENCESl) A. A. Omar, R. D. Kaneand W. K. Boyd: CORROSION/81,
Toronto, Paper No. 186, (1981).
2) G. J. Biefer: Mat. Performance, 21 (1982).
3) G. J. Biefer and M.Fichera: CANMETrep. MRP/PMRL82-3,
March, 1982.
4) T. Taira, K. Tsukada, Y. Kobayashi, H. Inagaki and T.
watanabe: Corrosion, 37 (1981).
5) K. Ume,T. Taira. T. HyodoandY. Kobayashi: CORROSION/85, Boston. Paper No. 240, (1985).
6) C. Christencen and R. T. Hill: CORROSroN/85,Boston, PaperNo. 241, (1985).
7) H. J. Cialone and D. N. Williams: Proc. of AGANG18/HLPJoint Tech. Meeting on Linepipe Research, Sept., 1984.
8) T. Taira, K. Matsumoto, Y. Kobayashi, K. Takeshige and I.
Kozasu: Int. Conf. on Tech. and Application of HSLAsteels,
Phnadelphia, 1983.
9) Y. Kobayashi, K. Ume,T. Hyodoand T. Taira: Corrosion Sci.,
27 (1987), No. I0/11, II17.
223 C 1994 iSiJ