sulawesi development diagnostic - aof · management hasanuddin university (unhas pskmp) and the...
TRANSCRIPT

Sulawesi Development Diagnostic: Achieving Shared Prosperity
Pub
lic D
iscl
osur
e A
utho
rized
Pub
lic D
iscl
osur
e A
utho
rized
Pub
lic D
iscl
osur
e A
utho
rized
Pub
lic D
iscl
osur
e A
utho
rized

Sulawesi Development Diagnostic: Achieving Shared Prosperity
June 2015
2
Contents Foreword ....................................................................................................................................................................... 5 Acknowledgement ......................................................................................................................................................... 6 Executive Summary ....................................................................................................................................................... 7 Chapter 1: Introduction ............................................................................................................................................... 13
1.1. Context ....................................................................................................................................................... 14 1.2. Analytical framework ................................................................................................................................. 16 1.3. Organization of the report ......................................................................................................................... 17
Part 1: Challenges to inclusive economic growth in Sulawesi ..................................................................................... 19 Chapter 2: Sulawesi’s economic growth drivers .......................................................................................................... 21 Chapter 3: Economic growth in Sulawesi has not been unconvincingly inclusive ....................................................... 25
3.1. Although poverty is reducing, income inequality is rising ......................................................................... 27 3.2. The poor mostly live in rural areas ............................................................................................................. 30 3.3. Most of the poorest 40 have education below secondary school and working in agriculture .................. 30 3.4. Households in the poorest 40 percent come from a variety of backgrounds ............................................ 32
Chapter 4: Challenges to inclusive growth in Sulawesi ............................................................................................... 35 4.1. Slower growth in the agricultural sector .................................................................................................... 37 4.2. Transition to rural non‐agricultural sectors have been slow ..................................................................... 38 4.3. Growth in the extractive industries has not been inclusive ....................................................................... 39 4.4. Low levels education and training limits workers’ mobility ....................................................................... 39 4.5. Poor infrastructure constrains sustainable economic growth ................................................................... 40
Part 2: Addressing the challenge to inclusive economic growth in Sulawesi .............................................................. 42 Chapter 5: Improve Agricultural Sector Productivity .................................................................................................. 43
5.1. Rice ............................................................................................................................................................. 45 5.1.1. Constraints and Opportunities for Smallholder Farming in Rice ....................................................... 45 5.1.2. Policy Implications and Recommendations for Rice ......................................................................... 47
5.2. Maize .......................................................................................................................................................... 48 5.2.1. Constraints and Opportunities for Smallholder Farming in Maize .................................................... 48 5.2.2. Policy Implications and Recommendations for Maize ...................................................................... 50
5.3. Cocoa .......................................................................................................................................................... 50 5.3.1. Constraints and Opportunities for Smallholder Farming in Cocoa .................................................... 50 5.3.2. Policy Implication and Recommendations for Cocoa ........................................................................ 52
5.4. Conclusion .................................................................................................................................................. 54 Chapter 6: Create More Opportunities in the Rural Non‐Agricultural Sector ............................................................. 56
6.1. The Contribution of the Rural Economy in Sulawesi .................................................................................. 58 6.2. Rural Non‐Agricultural Work ...................................................................................................................... 59 6.3. Profile of Rural Non‐Agricultural Workers ................................................................................................. 60 6.4. The Relationship between Rural Non‐Agricultural Employment and Poverty and Inequality ................... 62 6.5. Profile of Rural Non‐Agriculture Enterprises in Sulawesi ........................................................................... 64 6.6. Constraints to Rural Non‐Agriculture Micro and Small Industries Operation ............................................ 65 6.7. Potential Policy Options ............................................................................................................................. 66
Chapter 7: Promote greater inclusiveness in the extractive industries in Sulawesi .................................................... 68 7.1. Description of Extractive Industries in Sulawesi ........................................................................................ 70 7.2. The Opportunities and Dangers of Resource Growth ................................................................................ 72 7.3. Economic Contribution of Extractive Industries ......................................................................................... 73 7.4. Fiscal Contribution of Extractive Industries ............................................................................................... 76 7.5. Extractive Industries and Human Development ........................................................................................ 78 7.6. The Political Economy of Resource Growth and Governance Challenges ................................................. 79 7.7. Potential Policy Options ............................................................................................................................. 81
Chapter 8: Improving Access to Basic Services for the Poor ....................................................................................... 83 8.1. Service Delivery Performance in Sulawesi ................................................................................................. 85 8.2. Demand‐side Constraints ........................................................................................................................... 88 8.3. Supply‐side Constraints .............................................................................................................................. 90 8.4. Financing for Service Delivery .................................................................................................................... 94 8.5. Potential Policy Recommendations ........................................................................................................... 96

3
Chapter 9: Improve infrastructure in Sulawesi ............................................................................................................ 98 9.1. Urbanization and Economic Development .............................................................................................. 100 9.2. Access to Infrastructure and Impact of infrastructure on Economic Growth .......................................... 102 9.3. Infrastructure Spending and finance ........................................................................................................ 105 9.4. Potential Policy Options ........................................................................................................................... 109
Chapter 10: Conclusion .............................................................................................................................................. 111 References ................................................................................................................................................................. 117
List of tables Table 2.1. Decomposition of change in total value‐added per worker, 2001‐10 ........................................................ 24 Table 3.1. Poverty gap index (p1) and poverty gap squared index (p2) in provinces in Sulawesi ............................... 28 Table 3.2. Rural vs. urban within the poorest 40 percent ........................................................................................... 30 Table 3.3. Characteristics of the poorest 40 percent in Sulawesi, 2012 ...................................................................... 31 Table 3.4. Characteristics utilized to construct poverty clusters in Sulawesi, 2012 ....... Error! Bookmark not defined. Table 3.5. The poorest 40 percent clustering group in Sulawesi, 2012 ....................................................................... 34 Tabel 5.1. Estimated Average Income from Rice Farming in Sulawesi and its proportion to average agriculture household expenditures .............................................................................................................................................. 46 Table 5.2. Estimated Average Income from Maize Farming in Sulawesi and its proportion to average agriculture household expenditures ............................................................................................................................ 49 Table 6.1. Results of Gini decomposition by income source in rural Sulawesi, 2011 .................................................. 62 Table 7.1. Extractive industry production and revenue estimates, 2011 .................................................................... 71 Table 7.2. Dutch Disease Panel Regression ................................................................................................................. 73 Table 7.3. Employment in the extractive sector in Sulawesi, 2012 ............................................................................. 75 Table 7.4. Demographic characteristics of EI workers, 2012 ....................................................................................... 75 Table 8.1. Service delivery performance indicators .................................................................................................... 86 Table 8.2. Education supply‐readiness indicators ....................................................................................................... 90 Table 8.3. Health supply‐readiness indicators ............................................................................................................. 91 Table 9.1. Population, urbanization, and migration in Indonesia, by island grouping .............................................. 100 Table 9.2. Population, urbanization, and migration in Sulawesi by province ............................................................ 101 Table 9.3 Road length and electricity use by island ................................................................................................... 104 Table 9.4 Provincial and district revenues in Indonesia, per capita by island group ................................................. 106 Table 9.5. Per capita borrowing across islands, 1975‐2005 ...................................................................................... 109
List of figures Figure 1.1. Map of Sulawesi ......................................................................................................................................... 14 Figure 2.1. Annual growth rate, Indonesia and Sulawesi, 1986‐2013 ......................................................................... 22 Figure 2.2. Sectoral contribution to economic growth in Sulawesi, 2001‐13 .............................................................. 23 Figure 2.3. Sectoral allocation of credit in Sulawesi, 2001‐07* ................................................................................... 23 Figure 2.4. Growth accounting decomposition of major Indonesian islands, 2001‐10 ............................................... 24 Figure 2.5. Value‐added per worker, Sulawesi and Indonesia, 2010 ........................................................................... 24 Figure 3.1. Sulawesi’s poverty reduction and GDP per capita over the last decade ................................................... 27 Figure 3.2. Poverty headcount by island, 1999 & 2012 ............................................................................................... 27 Figure 3.3. The vulnerable in Sulawesi ........................................................................................................................ 29 Figure 3.4. The cumulative distribution of Sulawesi .................................................................................................... 29 Figure 3.5. The expenditure growth incidence curve of Sulawesi ............................................................................... 29 Figure 3.6. Education attainment of the poorest 40 percent, 2012 ............................................................................ 32 Figure 3.7. Sector and status of employment in the poorest 40 percent, 2012 .......................................................... 32 Figure 4.1. General population ‐ Key service delivery indicators, Sulawesi and other regions, 2012 ......................... 40 Figure 6.1. Share of employment in low‐ and high‐productivity work by sector, 2011 .............................................. 60 Figure 6.2. GIC of per capita consumption for non‐agricultural workers in rural Sulawesi, by percentile, 2001‐11 .. 63 Figure 6.3. CDF of per capita consumption across rural employment types in rural Sulawesi, 2011 ......................... 64 Figure 6.4. Distribution of MSIs in rural Sulawesi by age of enterprise, 2011 ............................................................. 65

4
Figure 6.5. Gender breakdown of rural MSI owner in Sulawesi, by province, 2011 ................................................... 65 Figure 6.6. Breakdown of main constraints faced by MSIs in rural Sulawesi, by province, 2011 ................................ 66 Figure 6.7. Breakdown of main constraints faced by MSIs in rural Sulawesi, by scale, 2011 ...................................... 66 Figure 7.1. Nickel production, 2011 ............................................................................................................................. 71 Figure 7.2. Share of workers in the extractive sector .................................................................................................. 74 Figure 7.3. Inter‐regional economic multipliers by economic sector, 2005 ............................................................... 76 Figure 7.4. Per capita revenue (in Rp) of subnational governments (province and districts), 2011 ........................... 77 Figure 7.5. Natural resources revenue‐sharing of subnational governments in Sulawesi, percentage of total revenue, 2005‐11......................................................................................................................................................... 78 Figure 8.1. General population ‐ Key service delivery indicators, Sulawesi and other regions, 2012 ......................... 86 Figure 8.2. Vulnerable population ‐ Key service delivery indicators, Sulawesi and other regions, 2012 .................... 87 Figure 8.3. Education services, most important dimension to improve according to users, 2006 ............................. 89 Figure 8.4. Health services, most important dimension to improve according to users, 2006 ................................... 89 Figure 8.5. Education and health supply readiness index and per capita GRDP, Sulawesi districts, 2012 .................. 92 Figure 8.6. Education and health supply readiness index and share of vulnerable, Sulawesi districts, 2012 ............. 92 Figure 8.7. Education and health supply readiness index and share of urban population, Sulawesi districts, 2011 .. 92 Figure 8.8 Average share of education spending, 2001‐11 ......................................................................................... 95 Figure 8.9. Average share of health spending, 2001‐11 .............................................................................................. 95 Figure 8.10. Input and Output Technical Efficiency Analysis for Education and Health .............................................. 95 Figure 8.11. The poorests 40 (vulnerable) and public spending in Sulawesi’s Districts .............................................. 96 Figure 9.1 Average infrastructure access Sulawesi, 2001‐10 .................................................................................... 103 Figure 9.2 Primary constraints on business activity, 2007 ........................................................................................ 105 Figure 9.3 Primary constraints on business activity, 2011 ........................................................................................ 105 Figure 9.4. Average provincial, district, and central infrastructure spending per capita, 2001‐09 ........................... 105 Figure 9.5. Provincial and district average infrastructure budget shares, 2001‐09 ................................................... 107 Figure 9.6. Provincial and district average infrastructure budget shares, 2001‐009 ................................................. 107 Figure 9.7. District marginal budget shares, 2001‐09 ................................................................................................ 108 Figure 9.8. District marginal budget shares, 2001‐09 ................................................................................................ 108

5
Foreword
With an average annual economic growth rate of 6.8 percent, Sulawesi was recorded as the Island
with the fastest growing economy in Indonesia during 2001 to 2013. The economic growth was
largely contributed by the natural resources sector and the service sector. It is also driven by the
expansion of capital accumulation. The high economic growth is also accompanied by rapid poverty
reduction in the island. Nevertheless, concern remains over the low productivity and large income
inequality. Inequality of income distribution have largely occurred due to the fact that many of the
poor live in the rural and work in agriculture and informal sector. Under such circumstances, they do
not have sufficient capacity to take advantage of new sectors that promote growth (such as
construction and services) as these sectors are mostly found in urban areas and require skilled labor.
In the future, Sulawesi need to maintain economic growth by raising labor productivity and make
growth more inclusive by expanding opportunities for poor people to access more stable and
productive employment. The report recommends a number of policy priorities in order to achieve
these objectives. First, given the importance of the agricultural sector and rural areas in Sulawesi,
the government needs to improve the performance of the agricultural sector. At the same time,
employment in non-agricultural sectors in rural areas need to be more created. Other priorities are
investing in human resources by improving access for the poor to obtain basic services, particularly
in health and education. Improving the quality of human resources will not only facilitate the
reallocation of labor to leave the agricultural sector which has low productivity, but will also
facilitate the movement of workers to work in the secondary or tertiary sectors in urban areas.
Finally, the government needs to manage the infrastructure investment which aims at raising
productivity in order to sustain economic growth.
We hope that this report can be of benefit for the government and people in Sulawesi. We also
invite all stakeholders to work together to implement the policy recommendations contained in this
report for the achievement of equitable development and welfare in Sulawesi.
Secretary General, Sector Manager/Lead Economist,
Sulawesi Regional Development Cooperation Agency World Bank Jakarta
Prof. Dr. Aminudin Ilmar, SH., MH. James Brumby

6
Acknowledgement
This report was prepared in collaboration between the Centre for Policy Studies and Development
Management Hasanuddin University (UNHAS PSKMP) and the World Bank Office Jakarta. The
research team from UNHAS PSKMP is led by Agus Salim, Sultan Suhab, and Nursini Mahmud. The
team of the World Bank is led by Ahmad Zaki Fahmi and Cut Dian Agustina, together with Blane
Lewis, David Elmaleh, Dhanie Nugroho, Alika Dibyanti Tuwo, Bastian Zaini, and Nalini
Shanmukanathan.
The Sulawesi Development Diagnostic report is supported by the Sulawesi Regional Development
Cooperation Agency (BKPRS). Therefore, we would like to thank in particular the Chairman of the
Board of Trustees BKPRS, Mr. Anwar Adnan Saleh, along with the Secretary General BKPRS, Prof. Dr.
Ilmar Aminuddin and his staff for their continuous support during the overall process. We would also
like to express our gratitude to the Head of the Regions as well as the official staffs in various Dinas
within the Province and Districts in Sulawesi that has assisted the data collection and contributed to
the consultation workshops that were held in several cities in Sulawesi.
The team is also grateful for the valuable input from various parties, particularly from the peer
reviewers of the report: Jasmin Chakeri (Senior Economist, OPSPQ), Hans Anand Beck (Senior
Economist, GMFDR), and Kiyoshi Taniguchi (Senior Economist, ADB). Valuable comments and
feedback were also received from: Alex Sienaert, Ashley Taylor, Mariam Rikhana, Matthew Grant
Wai Poi, Jon Jellema, and Saiful Bahri all from the World Bank and William Wallace from AIPEG
(Australia Indonesia Partnership for Economic Governance). Appreciations are also extended to
members of the research team UNHAS, among others: Mahyudin, Ibnu Hajar, Wahyudin, Syamsul
Alam, and other team members who cannot be named, one by one.
Thanks also go to Ariza Nurana, Nola Safitri for logistical support, Husnul Rizal on data processing
assistance, Maulina Cahyaningrum which helps the whole process of production of this report, as
well as Peter Milne, Liana Lim Hinch, and Diane Zhang on editorial assistance.
Finally, the team would like to thank Gregory D.V. Pattinasarany (Senior Economist, World Bank
Jakarta) and James Brumby (Director of Governance Global Practice, World Bank Jakarta) for
providing overall guidance and supervision to the work. These activities are carried out with the
financial support of the Government of Canada through the Department of Foreign Affairs, Trade
and Development Canada (DFATD).
7
Executive Summary
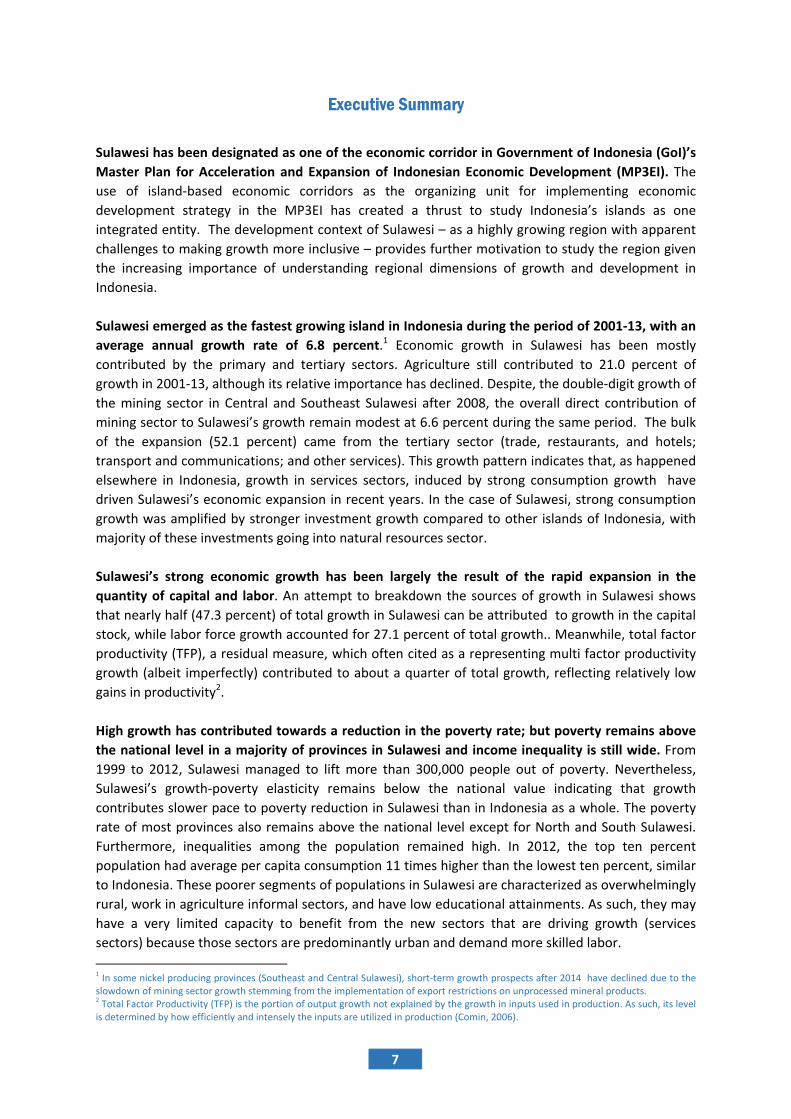
Sulawesi has been designated as one of the economic corridor in Government of Indonesia (GoI)’s
Master Plan for Acceleration and Expansion of Indonesian Economic Development (MP3EI). The
use of island‐based economic corridors as the organizing unit for implementing economic
development strategy in the MP3EI has created a thrust to study Indonesia’s islands as one
integrated entity. The development context of Sulawesi – as a highly growing region with apparent
challenges to making growth more inclusive – provides further motivation to study the region given
the increasing importance of understanding regional dimensions of growth and development in
Indonesia.
Sulawesi emerged as the fastest growing island in Indonesia during the period of 2001‐13, with an
average annual growth rate of 6.8 percent.1 Economic growth in Sulawesi has been mostly
contributed by the primary and tertiary sectors. Agriculture still contributed to 21.0 percent of
growth in 2001‐13, although its relative importance has declined. Despite, the double‐digit growth of
the mining sector in Central and Southeast Sulawesi after 2008, the overall direct contribution of
mining sector to Sulawesi’s growth remain modest at 6.6 percent during the same period. The bulk
of the expansion (52.1 percent) came from the tertiary sector (trade, restaurants, and hotels;
transport and communications; and other services). This growth pattern indicates that, as happened
elsewhere in Indonesia, growth in services sectors, induced by strong consumption growth have
driven Sulawesi’s economic expansion in recent years. In the case of Sulawesi, strong consumption
growth was amplified by stronger investment growth compared to other islands of Indonesia, with
majority of these investments going into natural resources sector.
Sulawesi’s strong economic growth has been largely the result of the rapid expansion in the
quantity of capital and labor. An attempt to breakdown the sources of growth in Sulawesi shows
that nearly half (47.3 percent) of total growth in Sulawesi can be attributed to growth in the capital
stock, while labor force growth accounted for 27.1 percent of total growth.. Meanwhile, total factor
productivity (TFP), a residual measure, which often cited as a representing multi factor productivity
growth (albeit imperfectly) contributed to about a quarter of total growth, reflecting relatively low
gains in productivity2.
High growth has contributed towards a reduction in the poverty rate; but poverty remains above
the national level in a majority of provinces in Sulawesi and income inequality is still wide. From
1999 to 2012, Sulawesi managed to lift more than 300,000 people out of poverty. Nevertheless,
Sulawesi’s growth‐poverty elasticity remains below the national value indicating that growth
contributes slower pace to poverty reduction in Sulawesi than in Indonesia as a whole. The poverty
rate of most provinces also remains above the national level except for North and South Sulawesi.
Furthermore, inequalities among the population remained high. In 2012, the top ten percent
population had average per capita consumption 11 times higher than the lowest ten percent, similar
to Indonesia. These poorer segments of populations in Sulawesi are characterized as overwhelmingly
rural, work in agriculture informal sectors, and have low educational attainments. As such, they may
have a very limited capacity to benefit from the new sectors that are driving growth (services
sectors) because those sectors are predominantly urban and demand more skilled labor.
1 In some nickel producing provinces (Southeast and Central Sulawesi), short‐term growth prospects after 2014 have declined due to the slowdown of mining sector growth stemming from the implementation of export restrictions on unprocessed mineral products. 2 Total Factor Productivity (TFP) is the portion of output growth not explained by the growth in inputs used in production. As such, its level is determined by how efficiently and intensely the inputs are utilized in production (Comin, 2006).

8
Sulawesi’s challenges are also observed in other development dimensions such as lack of access to
infrastructure and basic services. The island is characterized by complicated infrastructure
challenges due to the island geographical layout and a potentially difficult governance environment
with its dependence on commodities. The challenges becomes augmented with the existence of
widening gap between the lowest and the highest income group not only on the income dimension
but also on the non‐income dimension of welfare. Lack of access to some basic services is still
experienced by the poorer segments of the population in Sulawesi, including access to sanitation,
safe water, health services (births attended by skilled worker), and school enrollments. Sulawesi also
still lags behind in some of these basic services compared with Java and Sumatera. The overall
situation calls for necessary policy actions to overcome the problems, and hence broadening the
ability to share the prosperity to all population.
A number of policy priorities are worth considering in view of the underlying challenges facing
Sulawesi. Based on the trends highlighted above, the overarching objectives should aim at
sustaining growth by improving overall productivity and also making growth more inclusive by
providing opportunities for the poor to access more stable and productive jobs, or failing that by
providing a social safety net. The strategies to achieve these goals shall be based on three policy
priorities. First, due to the importance of the agriculture and rural sector in Sulawesi, increasing
agricultural sector performance and creating more opportunities in rural non‐farm sectors should
become top priorities for both the central and local governments. Second, investing in human capital
by improving access to basic services for the poor will help to make growth more inclusive. Improved
human capital will facilitate labor re‐allocation out of the low productivity agriculture sector and
facilitate workers’ mobility to work in urban areas in the secondary or tertiary sectors. Lastly, local
governments should make use of their instrumental role in leveraging urbanization and providing
productivity enhancing investments by focusing on infrastructure investments that link rural areas to
smaller urban centers first and then to larger places second.
The first policy priority is to sustain the improvements in agriculture and the rural sector by
making it more productive and competitive. The agriculture sector in Sulawesi still looms so large in
the region’s economy that it remains a crucial component in achieving shared prosperity. A closer
look at the performance of the three main commodities of Sulawesi – rice, maize, and cocoa –
indicates that opportunities exist for sustaining agriculture growth in Sulawesi that can be achieved
by closing the yield gap between Sulawesi and the best performing regions in Indonesia. Given the
limited resources that the provincial and district governments possess, priority should be given to
increasing the productivity of maize and cocoa. These commodities are relatively competitive in the
international and domestic markets. Meanwhile, the existing domestic production deficit implies
that increasing output of these commodities will not lead to a sharp decline in the prices of these
commodities. Improving yield for maize and cocoa requires improving access to finance and the
provision of supporting services provided by the government. As for rice, due to Sulawesi’s relatively
lower cost of rice production compare to other regions in Indonesia, and high rice production
surplus, Sulawesi has the potential to be Indonesia’s “rice barn”. But, to stay competitive with
cheaper rice import, Sulawesi’s rice farmers need to increase their efficiency and productivity. The
public sector could help by investing in infrastructure and other supporting services, especially by
rehabilitating irrigation networks, revamping agriculture R&D, and revitalizing extension services.
Improving irrigation coverage would require massive investment and thus requires a concerted
effort with the participation of the central government; rehabilitating irrigation networks requires
less investment and should have been able to be addressed through the local budget. Revitalizing

9
extension services requires the provision of adequate resources by the local government, as well as
the use of alternative delivery models. The “train and visit by the extension workers (LAKU/(Latihan
dan Kunjungan)” model need to be combined with the model that empower farmers organization to
act as “knowledge broker”, by actively seeking and disseminating agriculture knowledge and
technology.
In addition to sustaining growth in agriculture sector, increasing productivity in agriculture
requires labor reallocation to non‐agricultural sectors.. The majority of Sulawesi’s poorest
population lives in rural areas and works in agriculture sector which has the lowest labor
productivity. Although agricultural‐based income remains very important for rural households,
income from rural non‐agricultural activities also contributes significantly to total household income
in rural areas. If only considering income from primary employment, income from non‐agricultural
sectors makes up more than half of total income in rural Sulawesi. The shift of employment to more
productive sectors can provide more opportunities for the poor to diversify their income and
improve their welfare. While in the past, the rural employment shift to non‐agricultural work came
largely from those in wealthier income groups and mostly involved young workers between 15‐44
years old, now the objective is to have those in the poorer group to enter the more productive
sectors, which in turn would reduce the labor surplus in agriculture, therefore increasing the sector
productivity.
Participation in rural non‐agricultural employment shows positive relationship with welfare,
however, since the existing employment are mostly in social services, there is a need for a more
diversified rural employment supported through the enabling factors provided by the
government. Greater participation in the rural non‐agricultural sector is linked with higher per capita
consumption and a lower poverty rate, which suggest a strong pathway out of poverty. A large
proportion of the rural non‐agricultural employment comprises of wage and self‐employment. From
the sector wise, around one‐third works in social services, followed by trade, hotel and restaurants
(19 percent), transport (13 percent), and manufacturing (13 percent). Since currently most of the
social services employment consists largely of public administration types of work; there is a need to
create a more diversified rural employment through the creation of rural small industrial clusters
that can connect to larger market in urban areas and outside the region. For this to happen, it is
important for the government to provide enabling factors for participation in rural non‐agricultural
employment which includes education or skill, health, access to financial services, better
infrastructure to support goods and services logistics and mobility of workers. Empirically, these
factors are significantly and positively associated with greater participation in rural non‐agricultural
employment.
In provinces where extractive industries are significant, particularly Central and Southeast
Sulawesi, sharing prosperity in rural areas more widely means making extractive industries more
inclusive. Employment in the extractive sector is low and dominated by informality and low levels of
education, while few local people have access to senior positions in the formal sector. While
households working in the formal extractive sector are financially better off, this is not the case for
the majority of households whose members work in the informal extractive sector. In addition,
small‐scale mining practices present risks for miners, the surrounding communities, and the wider
environment. There are several ways to expand the economic opportunities so that the EI sector can
contribute more to improving people’s livelihoods in the short term, this includes: (i) providing
targeted professional training that could help local communities acquire the professional skills
needed by the EI sector and help them access better jobs, and (ii) promoting best industry’s

10
Corporate Social Responsibilities practices with small‐ and medium‐scale players, for instance, by
encouraging them to provide training or health facilities to communities. Trainings could be offered
to people engaging in ASM (artisanal and small‐scale mining) so that they could limit environmental
degradation, as well as health and safety risks downstream processing requirements issued by the
GoI.
The second priority is to invest in the human capital necessary to improve the overall labor
productivity, and this needs to be supported – as highlighted above – with sufficient provision of
basic services. In terms of access to education, enrollment rates showed a marked improvement in
2001‐2012, while disparities between districts and between the most vulnerable and the rest of the
population have narrowed. However, the picture is rather less positive for health. Health indicators
are low, and have even decreased in some cases, while inter‐regional inequalities have increased.
One of the most serious issues is the proportion of births that are not attended by a skilled health
worker. Also of major concern, the gap between the most vulnerable and the rest has also failed to
narrow over the same period.
In access to basic services, there are still weaknesses related to several indicators of supply
readiness in Sulawesi. In education the main gap in supply readiness is found in the quality of school
facilities. There is also limited access to senior high schools and properly qualified SMP teachers.
Supply readiness in health highlights the unequal access to secondary health care and midwives are
not available in many villages. The shortcomings in education should be addressed by providing
properly qualified teachers through a review of staffing policy to allow a better distribution of qualify
teachers between junior high schools and by improving the school facilities such as through the
provision of laboratories for SMP and generators for electricity matters. Meanwhile to address the
shortcoming in health, regions lacking a widespread presence of midwives in villages should be
systematically identified. Training and incentives programs should then be set up to address this gap.
The incentive could include experimenting with non‐monetary incentives for all providers, especially
midwives, including better career opportunities, merit‐based career management, and improved in‐
kind benefits (such as housing and education) to encourage more deployment to remote areas.
Appropriate resources to address the gap in both education and health should be allocated by sub‐
national governments.
Third and finally, local governments need to make the most of urbanization and provide
productivity enhancing infrastructure investments that link rural areas to smaller urban centers
first and then to larger places second. The increase in Sulawesi’s urban population has been very
rapid relative to the rest of Indonesia. Urbanization has positively affected economic development in
Sulawesi just as it has elsewhere across the country. Greater levels of population density and
attendant agglomeration economies found in urban places are associated with a higher level of
economic output and faster growth. However, the constraints imposed by the rapid pace of
urbanization are more severe in Sulawesi than they are elsewhere. In addition, the spillover effects
of urban economic growth on rural development are weaker in Sulawesi than in the rest of the
country.
Adequate infrastructure plays an important role in the mobilization of people to urban areas and
for overall economic growth, yet Sulawesi scores below average in the main infrastructure types.
Access to the major types of infrastructure, including electricity, sanitation, water, and roads, is
below average in Sulawesi, and significantly worse than Java/Bali, although somewhat better than
Kalimantan and eastern Indonesia, and about the same as in Sumatra. Sulawesi spends less on

11
infrastructure per capita than other islands in Indonesia partly because it has lower per capita
revenue than other islands. The potential for Sulawesi to use fiscal reserves to finance infrastructure
appears to be limited since it has significantly fewer savings than any other islands. Sulawesi’s
repayment record is also worse than all other islands, which makes borrowing a less viable
alternative. Meanwhile, the central government has only provided moderate support for
infrastructure development in Sulawesi.
Sulawesi needs to better prioritize its infrastructure investment if it wants to create and sustain
equitable service delivery and economic growth. Sectoral priorities include sanitation and roads,
both of which are below national standards. Geographic priorities include infrastructure investments
within the jurisdiction of fast growing urban areas, as well as those linking urban and rural areas.
Such investments would help to reduce urban congestion, which constrained economic growth, and
enhance urban economic spillovers to rural areas, which are currently weak by national standards.
Investing in infrastructure that connects urban and rural areas will make it easier to supply input for
agriculture and rural non‐farm activities as well as facilitate the marketing of agricultural and rural
products. As for expanding the access to electricity in Sulawesi, it will require improvement in the
nationwide policy and regulatory framework. Electricity production costs far exceed sales prices in
many provinces and PLN argues that available funding is insufficient to cover the implied subsidies,
hence limit the PLN’s ability to invest more on electricity supply. Particularly for Sulawesi, additional
investment will also be needed to replace the outdated transmission equipment and overcoming
difficult geographic terrain.
Financing the needed infrastructure improvements will require the Sulawesi’s government to
spend much more than it does now as well as making more effort in lending. Sulawesi should at
the very least spend more of its own‐source and transfer revenues on infrastructure than the
current level. Sulawesi’s sub‐nationals should also consider increasing their borrowing from the
central government, via the Government Investment Agency (PIP) and more aggressively explore
borrowing opportunities from private financial institutions, as well as bond issuances. Given the
current lack of appetite among commercial banks for lending to subnational governments and weak
administrative capacity, the latter two will not be easy. Finally, the central government might
consider increasing its own direct investment in subnational public assets, even though this runs
counter to the spirit of decentralization.


Chapter 1Introdution

1.1. Con
Sulawes
island is
part of t
other. A
Goronta
Sulawes
Sulawes
Master P
Sulawes
the islan
average
to Rp 7.
compare
the nati
the natio
percent
Sulawes
levels. S
resulting
achieved
3 Other maj
ntext
si is one of
s shaped like
the island is
Administrativ
alo, South S
si. The large
si has been d
Plan for Acce
si has grown
nd has grown
of 5.5 perce
1 million in
ed to the oth
onal GDP in
onal GDP. Su
of the natio
si’s fast eco
Sulawesi’s p
g in more t
d the largest
jor islands are Jav
the five ma
e a lower cas
ruggedly m
vely, the isla
Sulawesi, Ce
st cities on
designated a
eleration and
Source
n the fastest
n by an aver
ent. Sulawes
2013. Despi
her major is
n 2013, while
ulawesi’s eco
nal GDP, des
onomic grow
poverty rate
than 300,00
t reduction
va, Sumatera, Ka
ajor islands i
se “k” spread
ountainous,
and is divide
entral Sulaw
the island a
as one of th
d Expansion
Figure
e: Wikipedia (ht
t of Indones
rage of 6.8 p
si’s real per c
te the speed
lands Java a
e Java gener
onomy is eve
spite having
wth has con
has reduce
0 people be
in poverty ra
limantan and Pap
14
in Indonesia
d over four i
the island's
ed into 6 pro
wesi, Southe
are Makassa
e economic
of Indonesia
1.1. Map of S
ttp://en.wikipe
sia’s five ma
percent per a
capita GDP m
d of growth,
nd Sumatera
rates 60 per
en smaller th
a smaller po
ntributed to
ed from 21.1
eing lifted o
ate of Sulaw
pua.
a and is hom
nterconnect
peninsulas
ovinces and
east Sulawe
ar, Manado,
corridors in
an Economic
Sulawesi
dia.org/wiki/Su
ajor islands s
annum, signi
more than tr
, Sulawesi’s
a. Sulawesi,
cent and Su
han Kalimant
opulation tha
wards a red
1 percent in
out of pove
wesi’s six pro
me to 17.4 m
ting peninsul
are not easi
73 districts
esi, North S
Palu, and K
n the Govern
Developme
ulawesi)
since 2001.
ificantly high
ipled from R
economy re
only account
matera gene
tan Island w
an Sulawesi.
duction in t
n 1999 to 1
rty over thi
ovinces. In fa
million peop
las. Since th
ly accessible
. The provi
Sulawesi, an
Kendari. Sin
nment of Ind
nt (MP3EI).
Between 20
her than the
Rp 1.9 million
main relativ
ts for five pe
erates 21 pe
hich contrib
the island’s
1.8 percent
is period. G
act, three of
ple.3 The
e central
e to each
inces are
nd West
ce 2009,
donesia’s
01‐2013,
national
n in 1985
ely small
ercent of
ercent of
utes to 8
poverty
in 2012
Gorontalo
f the five

15
provinces that achieved the greatest decline in poverty rate were from Sulawesi (Gorontalo, Central
Sulawesi and Southeast Sulawesi).
Despite fast economic growth and reducing poverty, many challenges remain. These challenges
include:
Sulawesi’s poverty rate remains higher than the national average and the availability of basic
services on the island still lags behind Indonesia’s other major islands Java and Sumatera. Five
of the six provinces in Sulawesi have low human development indicators (exception is North
Sulawesi). Moreover, people in poor communities have limited access to basic services such as
sanitation, safe drinking water, and basic health services. School enrollment rate in many parts
of Sulawesi remains low.
The gap in consumption – which reflects income – between the poor and non‐poor is growing.
Between 2003‐2012, the annual per capita consumption growth rate for the poorest 40% of the
population was only 1.4 percent, significantly lower than the overall per capita consumption
growth rate of 5.2 percent and real per capita GDP growth of 6.1 percent. The cumulative
distribution of real per capita expenditure in Sulawesi between 2003 and 2012 also shows that
expenditure is accelerating faster for the higher income groups.
High GDP growth rate in Sulawesi has yet to translate into an increase in productive jobs. In
2012, the agriculture sector contributes to 28.5 percent of Sulawesi’s GDP, absorbs 44.4 percent
of total employment, and 57.5 percent of the poorest 40 percent are working in this sector.
Meanwhile, the agriculture sector has the lowest labor productivity (value added per worker),
and the lowest average wage of all economic sectors, indicating that the sector is in a labor
surplus situation. However, the transition of employment to non‐agriculture sectors has been
slower than the decline in agriculture’s share in Sulawesi’s GDP, leaving behind a large number
of workers in the agriculture sector.
Sulawesi’s high dependency on the primary sectors (agriculture and mining). About 33.7
percent of Sulawesi’s GDP are contributed by the primary sector. Although some provinces in
Sulawesi, such as Southeast and West Sulawesi are the main beneficiaries of the recent
commodity boom and do not appear to be in urgent need to diversify their economy, some
provinces, particularly South and North Sulawesi are getting more urbanized, and already facing
issues regarding their capacity to rely on the primary sector to sustain their economic growth. In
recent years, the government has stepped up the effort to make Sulawesi not only the center for
production but also for processing for agriculture, plantations, fisheries, oil, gas and mining
commodities. To achieve this goal, the government has introduced several policies such as an
export tax and an export ban for raw produce of cocoa and rattan, and has introduced the
designation of integrated economic development area (KAPET) and special economic zone (KEK)
in Sulawesi. However, up until now, Sulawesi does not seem to have benefited from these new
initiatives. New processing plants that emerged after the introduction of the export tax policy
are mostly located in Java. A discussion with major manufacturer indicates that they are still
reluctant to locate their plants in Sulawesi due to infrastructure concerns.
Sulawesi faces infrastructure challenges. In 2009, 47.2 percent of district roads in Sulawesi were
in poor condition, significantly worse than Java where 27.7 percent of roads were rated as poor.
The private sector reports that electricity supply is poor, although may improve as several

16
planned power plants become operational Intra‐Sulawesi transport links are still weak. The
mountainous central part of the island means that there is no single axis that connects the
various the corners of Sulawesi. As a result, land transportation remains difficult and
fragmented. Exporters from Gorontalo or Central Sulawesi still use Surabaya port as their main
cargo consolidation hub instead of the nearer port of Bitung in North Sulawesi or Makassar, due
to the presence of better infrastructures in Surabaya.
New natural resource projects may cause governance, wealth management, and
environmental problems. Sulawesi’s natural resource sectors is growing with the initiation of
several huge mining explorations projects including gas exploration in Central Sulawesi and
South Sulawesi; and gold mining in North Sulawesi and Gorontalo. Based on experience in other
regions, natural resources sector growth has not always been inclusive to create benefits for the
local community and the same time produced environmental and governance costs. Hence, it is
important for the island to prepare for the potential governance and wealth management issues
could emerge.
Sulawesi’s development context as a fast growing region but with growth is not always inclusive
makes it an important region to study. Indonesia’s decentralization means that policies that
influence growth and development are increasingly defined at the regional and local levels. A one
size fits all approach analysis may produce policy recommendations that are not appropriate for all
regions in Indonesia. Understanding the factors driving Sulawesi’s growth, and its impact on poverty
reduction and livelihood improvement, as well as identifying actions that could make growth
sustainable and inclusive is vital not only to inform development policy and programming in Sulawesi
but also to draw broader conclusions relevant to other regions in Indonesia.
1.2. Analytical framework
The Sulawesi development diagnostic aims to examine the island’s growth drivers and constraints,
analyze why growth is not inclusive and what segment of the population is lagging. This report
looks into the pace and pattern of growth and examines benefits different segments of the
population derived from Sulawesi’s economic growth, for example, poor versus non‐poor. The
report also analyzes why growth has not been unconvincingly inclusive, particularly in terms of
equality of opportunity, poverty reduction and employment creation. The analysis also identifies
constraints to sustained and inclusive development such as education and health outcomes. The
analysis will focus on the agriculture, extractive industries and infrastructure in its examination of
drivers and constraints of growth.
This report matches the development challenges identified with a discussion of the current
policies and propose potential solutions for Sulawesi. This analysis treats Sulawesi as a single
economic entity to promote an integrated view of the island’s economy. An island‐based approach
consistent with the central government’s regional plans used in its medium term planning
framework (RPJM) and in the Master Plan for Acceleration and Expansion of Indonesia Economic
Development (MP3EI) where Sulawesi Island is designated as an economic corridor. A regional
approach fosters more coordinated and integrative policy responses across provinces in Sulawesi.
This analysis also recognizes the variation between provinces in Sulawesi. The mapping of Sulawesi’s
challenges with the relevant policy discussion is presented in Figure 1.2 below.

The res
extensiv
central s
labor su
Extensiv
Figu
1.3. Org
The rep
chapter,
inclusive
growth d
increase
Sulawes
detail an
how to
in the se
commod
farm sec
Chapter
improve
educatio
delivery
search in th
ve set of dat
statistics age
urvey (Sake
ve consultati
ure 1.2. Mapp
ganization of
port is orga
, Part one of
e growth in
drivers; Chap
ed; Chapter
si faces. Part
nd proposes
make agricu
ector. This c
dities: rice, c
ctor so that
7 discusse
ement so tha
on outcome
, particularly
his report is
tabases and
ency (BPS) d
rnas) and h
ons with rele
ping between
f the report
nized into
f this report c
Sulawesi. C
pter 3 prese
4 identifies
t two of the
s policy mea
ultural sector
hapter analy
cocoa, and m
it can gene
es why Sula
at more com
s are low in
y for the vul
s based on
secondary m
atabases inc
households
evant local st
n identified ch
ten chapter
comprises of
Chapter 2 p
nts analysis
s why grow
report com
asures for ea
r more prod
yzes the agri
maize. Chapt
rate alterna
awesi’s extr
munities ben
n Sulawesi a
nerable and
17
with local
materials. Se
cluding natio
surveys (Su
takeholders
hallenges in S
rs broken i
f three chapt
provides an
showing tha
wth has not
prising of Ch
ach challeng
uctive in ord
culture sect
ter 6 analyze
tive and hig
ractive indus
nefit from it
and identifie
d marginalise
stakeholde
econdary dat
onal income,
usenas), and
were also co
ulawesi’s eco
nto two pa
ters that ana
overview of
at despite red
been more
hapter 5‐9 d
ge. Chapter 5
der to increa
or through t
es the challe
gher income
stry is not
s growth. Ch
es the main
ed populatio
er interview
ta were sourc
population
d the villag
onducted.
onomy and its
arts. Followi
alyze the cha
f Sulawesi’
duction in po
inclusive a
discusses eac
5 analyzes t
ase income f
the lens of S
nge of devel
employmen
inclusive a
hapter 8 ana
constraints
n. Chapter 9
ws and analy
ced from Ind
census, the
ges’ census
s policy discus
ng the intr
allenges for a
growth patt
overty inequ
and what ch
ch challenge
the first cha
for labor par
ulawesi’s th
loping the ru
nt for the ru
nd offers i
lyzes why he
for effective
9 assesses Su
ysing an
donesia’s
national
(Podes).
ssion
oductory
achieving
tern and
uality has
hallenges
in more
llenge of
rticipants
ree main
ural non‐
ral poor.
deas for
ealth and
e service
ulawesi’s

18
infrastructure challenges and how increased access to public infrastructure is crucial for ensuring
Sulawesi achieves sustained economic growth. Chapter 10 will conclude with a conclusion of the key
priorities for Sulawesi and a discussion on the future prospects of the region.

Part 1: Challenges to inclusive economic growth in Sulawesi
Since 2001, Sulawesi has been one of the
fastest growing regions in Indonesia. Part 1
consists of three chapters: Chapter 2 sets out
the drivers responsible for that growth but in
Chapter 3 this report argues that growth has
not been unconvincingly inclusive. Chapter 4
then identifies why growth has not been
inclusive in Sulawesi.


Chapter 2Sulawesi’s Economic
Growth Drivers

22
Since 2001, Sulawesi’s economy has been growing faster than any other island region in
Indonesia. Sulawesi has outperformed the rest of Indonesia achieving an average growth
rate of 6.8 percent per year over the period 2001‐13, significantly higher than the national
average annual growth rate of 5.5 percent. Moreover Sulawesi has been the fastest growing
island region in Indonesia since 20064.
Figure 2.1. Annual growth rate, Indonesia and Sulawesi, 1986‐2013
Note: Figures for 2000 have been adjusted using 1993 constant.
Source: World Bank staff calculations based on BPS data
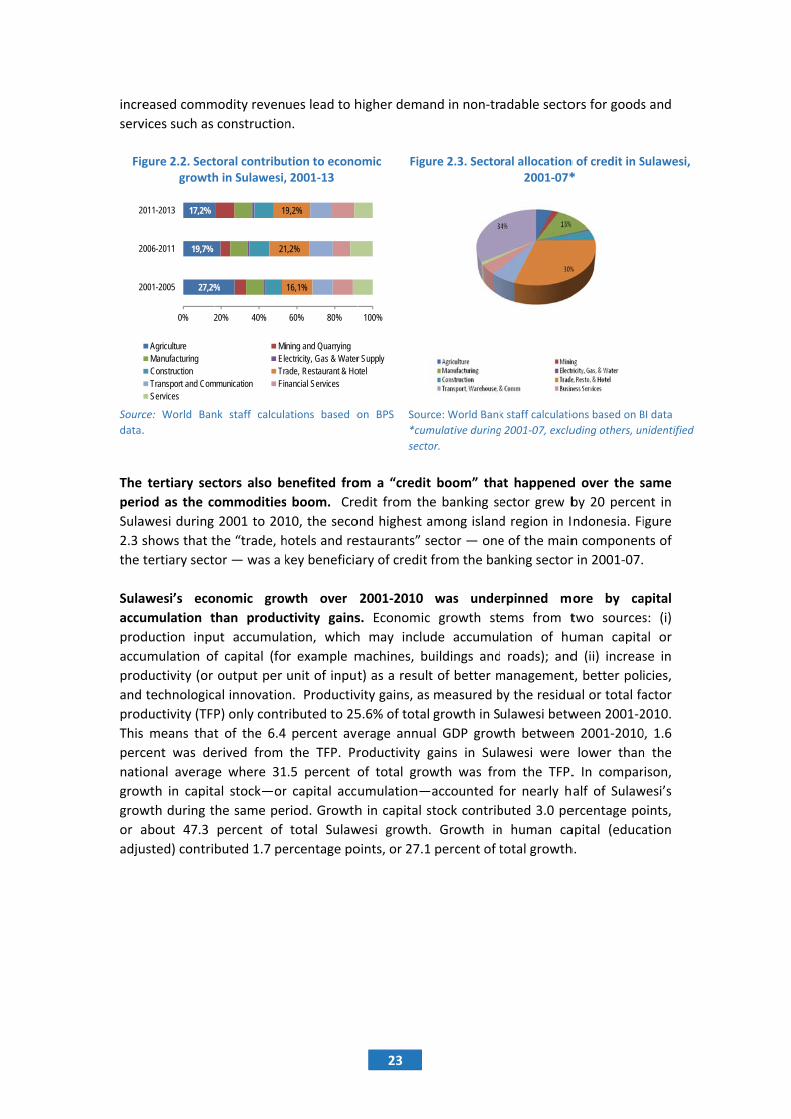
The contribution of tertiary sectors, including, trade, restaurant, hotel, transport,
communication, and services to Sulawesi economic growth has been increasing. Tertiary
sectors contribute to 52 percent of economic growth during 2001‐2013 period, its
contribution increased from 47.9 percent of the growth in 2001‐2005 period to 53.5 percent
in 2006‐2013. The trade, hotel, and restaurant sector is the sector that showed the largest
increase in its contribution to growth, from 16.1% during 2001‐2005 to 19.2% during 2011‐
2013 (Figure 2.2).
The agricultural sector remains one of the largest contributor to GDP growth in Sulawesi,
but its influence is declining. In 2013, agriculture represented 16.1 percent to Sulawesi’s
total growth rate and is the largest sector in the region. Its contribution to GDP growth has
been decreasing, falling from 27.2 percent of the total growth rate in 2001‐05, to 19.7
percent in 2006‐10, and just 17.2 percent in 2011‐13. This is because the agriculture sector
experienced the slowest average annual growth rate of only 4.6 percent between 2001‐
2013.
The tertiary sectors may have benefited from spillovers from the commodity boom.
Sulawesi experienced a local “commodities boom” between 2006‐2010. During this period,
Sulawesi’s terms of trade with the rest of Indonesia increased by 2.5 percent.5 The positive
terms of trade reflect the relative increase in the price of Sulawesi’s products ‐ mainly
consisting of natural resource‐based commodities – in comparison with the prices of goods
in the rest of Indonesia. According to the literature, the increased capital inflows from
4 Except in 2009, when growth in Papua outpaced Sulawesi’s growth 5 Terms of Trade gain is measured by subtracting the rate of growth of real RGDP (deflated by regional GDP deflator) from nominal RGDP deflated by national CPI (reflecting the general price index of product produced all over Indonesia), if national CPI deflated RGDP is higher than real RGDP than terms of trade gain is positive. This procedure is used by Coulombe (2011) for estimating terms of trade changes in Canadian provinces.
‐15,0%
‐10,0%
‐5,0%
0,0%
5,0%
10,0%
15,0%
1986
1987
1988
1989
1990
1991
1992
1993
1994
1995
1996
1997
1998
1999
2000
2001
2002
2003
2004
2005
2006
2007
2008
2009
2010
2011
2012
2013
Sulawesi Indonesia
incre
serv
Fig
Sourc
data.
The
peri
Sula
2.3 s
the t
Sula
accu
prod
accu
prod
and
prod
This
perc
nati
grow
grow
or a
adju
2
2
2
eased comm
vices such as
gure 2.2. Sectgrowth
ce: World Ban
.
tertiary sec
od as the c
awesi during
shows that t
tertiary sect
awesi’s eco
umulation t
duction inpu
umulation of
ductivity (or
technologic
ductivity (TFP
s means that
cent was de
onal averag
wth in capita
wth during t
about 47.3
usted) contri
27,2%
19,7%
17,2%
0% 2
001-2005
006-2011
011-2013
AgricultureManufacturingConstructionTransport and ComServices
modity reven
construction
toral contribuh in Sulawesi,
nk staff calcula
ctors also be
ommodities
2001 to 201
the “trade, h
or — was a k
onomic grow
than produc
ut accumula
f capital (fo
output per
al innovation
P) only contr
t of the 6.4
erived from
e where 31
al stock—or
he same pe
percent of
buted 1.7 pe
%
21
19
20% 40%
MiEleTra
mmunication Fin
ues lead to h
n.
ution to econo, 2001‐13
ations based o
enefited fro
s boom. Cre
10, the seco
hotels and re
key beneficia
wth over
ctivity gains
ation, which
r example m
unit of input
n. Productiv
ributed to 25
percent ave
the TFP. Pr
.5 percent o
r capital acc
riod. Growth
total Sulaw
ercentage po
16,1%
,2%
9,2%
60% 80%
ning and Quarryingectricity, Gas & Waterade, Restaurant & Honancial Services
23
higher dema
omic Figu
on BPS Sour
*cum
secto
om a “credit
edit from th
ond highest a
estaurants” s
ary of credit
2001‐2010
s. Economic
h may inclu
machines, b
t) as a result
vity gains, as
5.6% of total
erage annua
roductivity g
of total gro
umulation—
h in capital s
wesi growth
oints, or 27.1
100%
r Supplyotel
nd in non‐tr
ure 2.3. Secto
rce: World Bank
mulative during
or.
t boom” tha
e banking se
among island
sector — one
from the ba
was unde
c growth st
de accumul
uildings and
t of better m
measured b
growth in S
al GDP grow
gains in Sula
wth was fro
—accounted f
stock contrib
. Growth in
1 percent of t
adable secto
ral allocation2001‐07*
k staff calculatio
g 2001‐07, exclu
at happened
ector grew b
d region in I
e of the main
nking sector
rpinned m
ems from t
lation of hu
roads); and
management
by the residu
ulawesi betw
wth between
awesi were
om the TFP.
for nearly h
buted 3.0 pe
n human ca
total growth
ors for goods
n of credit in S*
ons based on B
uding others, un
d over the s
by 20 perce
ndonesia. Fi
n componen
r in 2001‐07.
ore by ca
two sources
uman capita
d (ii) increas
t, better poli
ual or total fa
ween 2001‐2
n 2001‐2010
lower than
. In compar
alf of Sulaw
ercentage po
apital (educa
h.
s and
Sulawesi,
BI data
nidentified
same
nt in
igure
nts of
apital
s: (i)
al or
se in
icies,
actor
2010.
0, 1.6
n the
ison,
wesi’s
oints,
ation
24
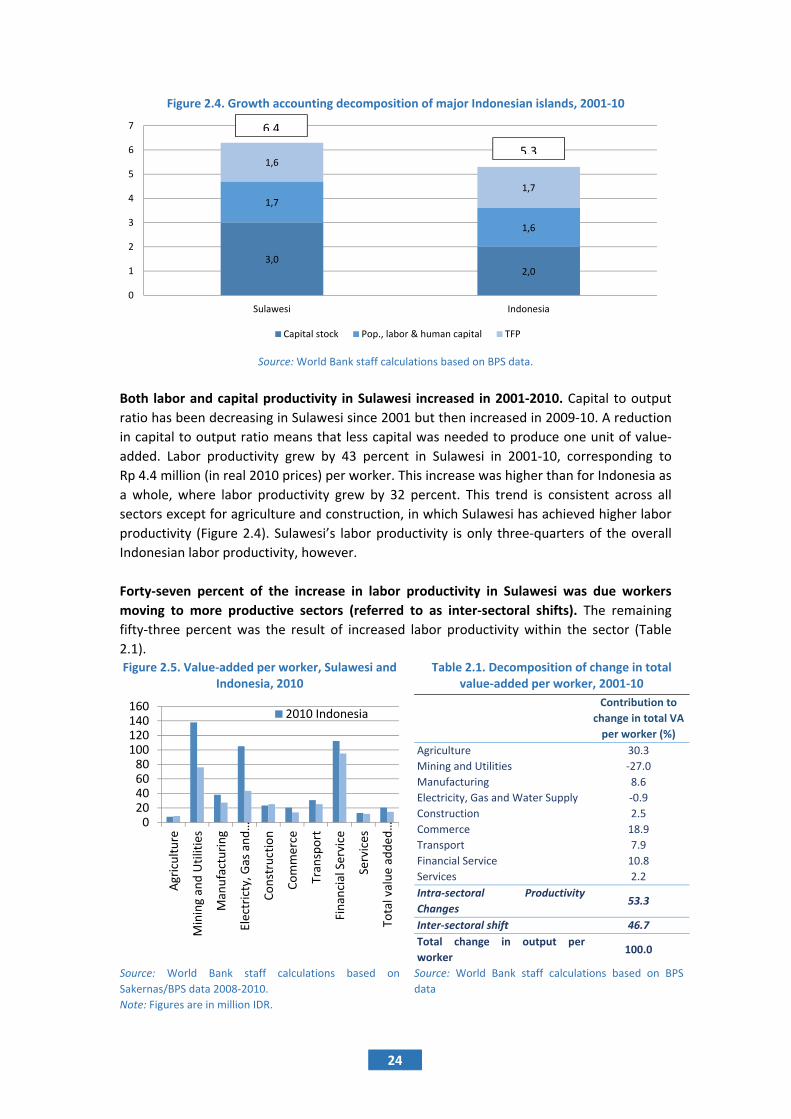
Figure 2.4. Growth accounting decomposition of major Indonesian islands, 2001‐10
Source: World Bank staff calculations based on BPS data.
Both labor and capital productivity in Sulawesi increased in 2001‐2010. Capital to output
ratio has been decreasing in Sulawesi since 2001 but then increased in 2009‐10. A reduction
in capital to output ratio means that less capital was needed to produce one unit of value‐
added. Labor productivity grew by 43 percent in Sulawesi in 2001‐10, corresponding to
Rp 4.4 million (in real 2010 prices) per worker. This increase was higher than for Indonesia as
a whole, where labor productivity grew by 32 percent. This trend is consistent across all
sectors except for agriculture and construction, in which Sulawesi has achieved higher labor
productivity (Figure 2.4). Sulawesi’s labor productivity is only three‐quarters of the overall
Indonesian labor productivity, however.
Forty‐seven percent of the increase in labor productivity in Sulawesi was due workers
moving to more productive sectors (referred to as inter‐sectoral shifts). The remaining
fifty‐three percent was the result of increased labor productivity within the sector (Table
2.1). Figure 2.5. Value‐added per worker, Sulawesi and
Indonesia, 2010 Table 2.1. Decomposition of change in total
value‐added per worker, 2001‐10
Contribution to
change in total VA
per worker (%)
Agriculture 30.3
Mining and Utilities ‐27.0
Manufacturing 8.6
Electricity, Gas and Water Supply ‐0.9
Construction 2.5
Commerce 18.9
Transport 7.9
Financial Service 10.8
Services 2.2
Intra‐sectoral Productivity
Changes 53.3
Inter‐sectoral shift 46.7
Total change in output per
worker 100.0
Source: World Bank staff calculations based on
Sakernas/BPS data 2008‐2010.
Note: Figures are in million IDR.
Source: World Bank staff calculations based on BPS
data
3,02,0
1,7
1,6
1,6
1,7
0
1
2
3
4
5
6
7
Sulawesi Indonesia
Capital stock Pop., labor & human capital TFP
020406080
100120140160
Agriculture
Mining and Utilities
Manufacturing
Electricty, G
as and…
Construction
Commerce
Transport
Financial Service
Services
Total value added
…
2010 Indonesia
6.4
5.3


Chapter 3Economic growth in Sulawesi has not been unconvincingly
inclusive

27
Not all segments of society benefited equally from Sulawesi’s economic growth. This section
discusses how inequality has actually increased during Sulawesi’s decade of boom and
identify who was left behind.
3.1. Although poverty is reducing, income inequality is rising
Sulawesi has achieved significant poverty reduction during the period of high economic
growth (Figure 3.1). From 1999 to 2012, Sulawesi’s real per capita GDP increased from
Rp 3.4 million to Rp 6.9 million. Over the same period, Sulawesi’s poverty rate reduced from
21.2 percent to 11.8 percent, lifting more than 300,000 people out of poverty. The pace of
poverty reduction in Sulawesi was slightly slower than the national average (Figure 3.2).
Across Indonesia, poverty declined by 11.5 percentage points over 1999‐2012, compared to
9.3 percent in Sulawesi. Poverty reduction has also not been even across provinces in
Sulawesi. Within Sulawesi, Gorontalo achieved the largest reduction in poverty amongst
Sulawesi’s six provinces.
The depth of poverty has drastically decreased across Sulawesi. The Poverty Gap Index (P1)
estimates the depth of poverty by considering how far, on average, the poor are from the
poverty line. The higher the P1, the further the poor is away which reduces the likelihood
that they will be lifted out of poverty quickly. Table 3.1 shows that similar to the national
trend P1 has reduced in all six Sulawesi provinces. Southeast Sulawesi’s P1 fell below the
national average for the first time in 2013. Although the largest reduction in P1 took place in
Gorontalo, the depth of poverty in the province remains the highest in Sulawesi.
The severity of poverty also declined dramatically in Sulawesi. The Squared Poverty Gap
Index (P2) measures the severity of poverty by providing more weight to the poorest of the
poor. Similar to the depth of poverty trend, the severity of poverty in all Sulawesi provinces
decreased significantly; Southeast Sulawesi’s P2 fell below the national average for the first
time in 2013; and although Gorontalo’s P2 decreased by 65% between 2004‐2013, the
largest reduction in Sulawesi, the province’s severity of poverty remains the highest in
Sulawesi and is significantly higher than the national average.
Figure 3.1. Sulawesi’s poverty reduction and GDP per capita over the last decade
Figure 3.2. Poverty headcount by island, 1999 & 2012
Source: World Bank staff estimates based on BPS data. Source: World Bank staff estimates based on BPS
data.
0
2
4
6
8
10
0
5
10
15
20
25
1999 2001 2003 2005 2007 2009 2011
GDP per cap
ita constan
t 2000
(IDR m
illion)
Poverty head
count (%
)
Poverty headcount GDP per capita
0%
10%
20%
30%
40%
50%Jawa+Bali
Kalim
antan
Sulawesi
Sumatra
Eastern
Indonesia
1999 2012

28
Table 3.1. Poverty gap index (p1) and poverty gap squared index (p2) in provinces in Sulawesi
2004 2007 2009 2011 2012 2013
Poverty gap index (p1)
North Sulawesi 1.80 1.88 1.55 1.1 1.18 1.16
Central
Sulawesi
4.03 4.46 4.09 2.76 2.82 2.28
South Sulawesi 2.42 2.6 2.08 1.65 1.68 1.65
Southeast
Sulawesi
3.80 4.33 3.44 2.61 1.92 1.83
Gorontalo 7.00 5.57 4.59 3.72 3.21 3.22
West Sulawesi 2.59 2.47 2.32 1.74 1.30
National 2.89 2.99 2.50 2.08 1.90 1.89
Squared poverty gap index (p2)
North Sulawesi 0.54 0.47 0.36 0.24 0.30 0.28
Central
Sulawesi
1.14 1.38 1.37 0.75 0.82 0.53
South Sulawesi 0.63 0.68 0.55 0.40 0.42 0.40
Southeast
Sulawesi
0.98 1.21 0.98 0.69 0.49 0.43
Gorontalo 2.30 1.68 1.27 1.00 0.84 0.85
West Sulawesi 0.57 0.60 0.61 0.40 0.27
National 0.78 0.84 0.68 0.55 0.49 0.48 Source: BPS.
Note: Poverty gap index (p1) estimates the depth of poverty by considering how far, on the average, the poor are
from the poverty line. Squared poverty gap index (p2) measures the severity of poverty by providing more weight
to the poorest of the poor.
Sulawesi’s population remains extremely vulnerable with 22.5 percent of the population
experienced falling into poverty at least once in 2008‐10.6 Nationally, 21.9 percent of the
population has fallen at least once into poverty over the same period (Figure 3.3). This
means that a significant proportion of Sulawesi’s population is susceptible to falling back
into poverty, particularly if an unforeseen shock such as a natural disaster or a financial
disaster occurs. Moreover, 3.5 percent of Sulawesi’s population was considered persistently
poor in 2008‐10 because they never “fell out” of poverty during those three years. The
highest share of persistent poor was in Gorontalo (8 percent) and in two provinces, North
Sulawesi and West Sulawesi, the proportion of persistent poor population actually increased
in 2008‐2010.
6 The estimation used the Susenas panel data of 2008‐2010.

29
Figure 3.3. The vulnerable in Sulawesi
Source: World Bank staff estimates based on Susenas panel/BPS data 2008‐10.
Note: *West Sulawesi figure is estimated using the districts that were previously located under South Sulawesi
Province.
Inequality in Sulawesi has been increasing. Although real monthly per capita consumption
in Sulawesi has increased from Rp 245,996 to Rp 387,750 between 2003 and 2012, the
distribution of consumption patterns has been uneven. The wealthiest 1 percent of the
population had a real per capita consumption level almost 37 times higher than the poorest
one percent in 2012. Growth in per capita expenditure for the poorest 40 percent of the
population in Sulawesi is only 1.4 percent, lower than the overall average of 5.2 percent and
significantly lower than the per capita expenditure growth rate of the richest 1% of 15.7
percent. The cumulative distribution of real per capita expenditures in Sulawesi between
2003 and 2012 shows that per capita expenditures increased faster for higher percentiles
(Figure 3.4). The growth of per capita consumption between 2003 and 2012 also shows that
the gap between the lower and higher percentiles of the population has widened
The poorest 40% of the population (from herein referred to as the “poorest 40”), of which
33.9 percent are poor, is lagging behind other groups in Sulawesi. The 7.1 million people
part of the poorest 40 is the focus of the overall analysis. The rest of this Chapter describes
this population: where they live, age, education level and employment.
Figure 3.4. The cumulative distribution of
Sulawesi Figure 3.5. The expenditure growth incidence
curve of Sulawesi
Source: World Bank staff estimated based on
Susenas/BPS data.
Source: WB staff estimated based on Susenas/BPS
data.
6 4 6 4 1 7 5 5 314
516 8 3
8 7 10 86 4
11 10 9 6
13
9
1512
17 10
15 1519
1513 14
2516 18
13
17
18
26
20 32
14
71 7465
74 81 80
5768 68
78
5768
4360
51
74
0%
20%
40%
60%
80%
100%
2002 ‐ 2004
2008 ‐ 2010
2002 ‐ 2004
2008 ‐ 2010
2002 ‐ 2004
2008 ‐ 2010
2002 ‐ 2004
2008 ‐ 2010
2002 ‐ 2004
2008 ‐ 2010
2002 ‐ 2004
2008 ‐ 2010
2002 ‐ 2004
2008 ‐ 2010
2002 ‐ 2004
2008 ‐ 2010
Idn Sul N Sul C Sul S Sul SE Sul Gor W Sul*Always poor Twice in poverty Once in poverty Never be the poor
0
.2
.4
.6
.8
1
CD
F
0 1,000,000 2,000,000 3,000,000 4,000,000 5,000,000 6,000,000
2003 2012
Real Per Capita Expenditure in Sulawesi
0
2
4
6
8
10
0 20 40 60 80 100Per capita growth rate in
mean
(%)
Percentile
Sulawesi 1993 ‐ 1996 Sulawesi 1999 ‐ 2002
Sulawesi 2003 ‐ 2012 Indonesia 2003 ‐ 2012

30
3.2. The poor mostly live in rural areas
The majority of the poorest 40 in Sulawesi reside in rural areas and is urbanizing at a
slightly slower pace than the overall population. In 2012, of the 7.1 million people in the
poorest 40, 81.4 percent lived in rural areas, reduced from 85.5 percent in 2003 (Table 3.2).
In comparison the overall share of the population living in rural areas is 66.3 percent in
2012, reduced from 72 percent in 2003. The decline of the rural population in the poorest 40
was slower (4.1 percentage points) than the overall population (5.7 percentage points). The
relatively small number of urban people in the poorest 40 percent was mostly located in
provincial or district capitals.
Table 3.2. Rural vs. urban within the poorest 40 percent
Source: World Bank staff estimates based on Susenas/BPS data.
A large number of the poorest 40 population lives in South Sulawesi. South Sulawesi is the
most populated province within the island, with 46 percent of the poorest 40 lives in this
province. A large numbers of the poorest 40 also live in Central Sulawesi and Southeast
Sulawesi. These three provinces account for 73 percent of the total poorest 40 population.
Nevertheless, in terms of the prevalence of the poorest 40 to each province population, the
highest prevalence was found in Gorontalo, with almost 50 percent of population in this
province fell under this group. Both high incidence and prevalence of the poorest 40 are
equally relevant for policy discussions: high incidence locations may call for more
sophisticated targeting as they are likely to be better‐off regions with better public services
and facilities, while high prevalence locations are likely to be lagging behind on most
development dimensions.
3.3. Most of the poorest 40 are at a productive age, with education below secondary
school and working in agriculture
The poorest 40 are generally in a medium‐sized household with a man as a head of the
household. Around 87 percent of the poorest 40 had a man as the head of the household.
The poorest 40 were almost always in medium to large households. Around 60% of this
group was in households with 3‐5 people and 33 percent was in households with more than
6 people (Table 3.3). Large household size is usually because of the household’s choice to
have many children; dependents in large households, may also include parents‐in‐law,
grandchildren and other family relatives.
Half of the population in the poorest 40 is of productive age with almost similar ratios of
women and men. Table 3.3 shows that 55 percent of the poorest 40 were within the
productive age of 15‐60 years old, 39 percent were below the age of 15, with only a small
share or 7 percent in the elderly group (Table 3.3). With such a large proportion of the
Share of population Share of lowest 40
percent
Mean per capita
consumption of lowest
40 percent (Rp/month)
2003 2012 2003 2012 2003 2012
Rural 72.0 66.3 85.5 81.4 426,141 459,893
Urban 28.0 33.7 14.5 18.6 447,723 526,413

31
poorest 40 in the productive and young age group, Sulawesi could benefit from a
demographic dividend if there is an increase in the availability of employment in Sulawesi.
Table 3.3. Characteristics of the poorest 40 percent in Sulawesi, 2012
Percentile <= 40
40 ‐ 100 Overall population
Numbers (%) Numbers (%) Numbers (%)
Gender of household head
Male 1,251,899 86.7 2,345,666 84.1 3,597,565 85.0
Female 191,238 13.3 444,694 15.9 635,932 15.0
Household Size
<3 persons 96,730 6.7 604,581 21.7 701,311 16.6
3‐5 persons 870,257 60.3 1,756,337 62.9 2,626,594 62.0
>= 6 persons 476,150 33.0 429,442 15.4 905,592 21.4
Demographic group
< 15 yrs old 2,765,660 38.6 3,036,176 28.2 5,801,836 32.4
Male 1,437,324 20.0 1,549,498 14.4 2,986,822 16.7
Female 1,328,336 18.5 1,486,678 13.8 2,815,014 15.7
15 ‐ 30 years old 1,636,813 22.8 2,806,438 26.1 4,443,251 24.8
Male 800,873 11.2 1,402,119 13.0 2,202,992 12.3
Female 835,940 11.7 1,404,319 13.1 2,240,259 12.5
30 ‐ 45 years old 1,514,292 21.1 2,506,720 23.3 4,021,012 22.4
Male 749,099 10.4 1,247,498 11.6 1,996,597 11.1
Female 765,193 10.7 1,259,222 11.7 2,024,415 11.3
45 ‐ 60 years old 756,167 10.5 1,589,314 14.8 2,345,481 13.1
Male 372,374 5.2 789,393 7.3 1,161,767 6.5
Female 383,793 5.4 799,921 7.4 1,183,714 6.6
>60 years old 500,052 7.0 820,281 7.6 1,320,333 7.4
Male 221,754 3.1 371,926 3.5 593,680 3.3
Female 278,298 3.9 448,355 4.2 726,653 4.1Source: World Bank staff estimates based on Susenas/BPS data.
The work force in the poorest 40 in Sulawesi is poorly educated, and on average only had 7
years of schooling. Figure 3.5 shows that 23 percent of the total labor force in the poorest
40 (4.4 million people) had, on average, less than 6 years of schooling and did not complete
primary school. Around 45 percent were in school for an average of 6‐9 years (it typically
takes 9 years of schooling to complete junior secondary school). Only about 10 percent of
the labor force in the poorest 40 went to school for an average of more than 12 years.
Moreover, 32 percent of head of households’ highest education attainment is primary
school and a further 30 percent had never even completed primary school. More shockingly,
a further 12 percent of the poorest 40 work force have never been to school.
Almost 39 percent of the work force in the poorest 40 is unemployed and the majority of
those with employment work in agriculture. Almost 58 percent of the employed labor force
in the poorest 40 are working in agriculture, with another 11.7 percent working in trade,
hotel, and restaurant, 7.2 percent employed in the construction sector and 6.3 percent
working in the construction sector (Figure 3.6).
The majority of poorest 40 are employed in the informal sector. Over two‐thirds of the
employed work force in the poorest 40 was either self‐employed (22.8 percent), employers
assisted by temporary/unpaid workers (21.9 percent) or working with family in a

32
temporary/unpaid arrangement (21.0 percent). The large proportion of the poorest 40 with
employment working in the informal sector under conditions of uncertainty is potentially
one of the key reasons for the low per capita consumption growth rate for the poorest 40
percent of Sulawesi’s population.
3.4. Households in the poorest 40 percent come from a variety of backgrounds
The underlying characteristics of households that are in the poorest 40 vary. Some
households are poor because of insufficient employment opportunities, perhaps because of
low education levels. Other households are poor because income generated through their
employment is insufficient. This section analyzes household profiles by grouping them into
clusters based on six characteristics: level of education, employment sector, access to health
services, unemployment level, reside in rural or urban area and whether work in the formal
or informal sector. The analysis is conducted using data from the national household survey
(Susenas) (Table 3.4).
Figure 3.6. Education attainment of the poorest 40 percent, 2012
Figure 3.7. Sector and status of employment in the poorest 40 percent, 2012
Mean years schooling of the labor force
Education background of the household head
Source: World Bank staff estimates based on Susenas/BPS data.
17 21 23 17
3930 23
3951 45
43
4043
45
3120 21
28
1518 22
12 9 11 11 5 9 10
0
20
40
60
80
100
<6 6 ‐ 9 9 ‐ 12 >12
Perc
ent
0 20 40 60 80 100
N Sulawesi
C Sulawesi
S Sulawesi
SE Sulawesi
Gorontalo
W Sulawesi
Sulawesi
Primary Mining & Quarrying
Manufacturing Utilities
Percent
1 718 12
412 12
2827
2925
52 31 30
3341
3032
3034 32
18
14 1316
710 13
2011 9 14
6 11 111 1 1 1 1 1 1
0
20
40
60
80
100
No Schooling <SD
SD SMP
Perc
ent
Self‐employed;
22,6
Employer assisted by temporary/u
npaid worker; 22,8
Employer assisted by permanent worker; 2,0
Labor/employee; 18,6
Casual worker; 11,9
Family worker/unpaid worker;
22,0

33
Table 3.4. Characteristics utilized to construct poverty clusters in Sulawesi, 2012
Characteristic Description Mean value of
the poorest 40
percent
Mean value
of the
population
Low education of labor Maximum education level attained by any labor member of a household is junior high school level.
40.62 34.77
Working in agriculture sector
Household has at least one labor member whose primary employment is in agriculture sector.
48.98 36.31
Birth attended by professional paramedics
Household has access to professional paramedics (health)
60.59 68.70
Unemployed household members
Ratio of unemployed members in the household to total household members (excluding those in schools)
37.83 35.24
Lives in rural area Percentage of households living in rural area. 76.78 72.28
Informal worker Share of employed workers working without receiving income or assisting a family business and entrepreneurs assisted by temporary worker
40.57 35.71
Source: World Bank staff estimates based on Susenas/BPS data.
Households in Sulawesi’s poorest 40 can be grouped into three different clusters (Table
3.5). The characteristics of each group differ quite significantly:
Cluster 1 (higher unemployment, non‐agriculture, good access to health services, more
urban, formal sector): This cluster represents 41 percent of the population of the
poorest 40. Almost half of this group lives in urban areas with the remaining residing in
areas close to urban centers. Probably due to their proximity to urban areas, the
majority of people in this cluster have good access to health services. Almost half of the
population is unemployed, much higher than the other two clusters. Those with
employment predominantly work in non‐agriculture sectors (37 percent) and with
formal employment (78 percent). Around 40 percent of this cluster has a low level of
education, similar to other clusters.
Cluster 2 (mixture of agriculture and non‐agriculture based employment, average access
to health services, informal sector, rural): 48 percent of the poorest 40 are in this
cluster. They largely live in rural areas with a relatively equal proportion of people
working in agriculture and non‐agriculture sector. Only 34 percent is unemployed, which
is less than cluster 1. This group’s employment profile suggests that many people are
transitioning from agriculture sector to non‐agriculture sectors. Around half of the
people in this cluster have access to health services.
Cluster 3 (agriculture, informal, limited access to public service, rural): only 11 percent
of the poorest 40 are in this cluster. People in this cluster mostly reside in rural areas
and work in the agriculture sector. This cluster has the lowest unemployment rate but
also the worst access to health services.

34
Table 3.5. The poorest 40 percent clustering group in Sulawesi, 2012 Cluster Low Level of
Education Work in
Agriculture Access to Health
Unemployment Rate
People Lives in Rural Area
Informal Worker
% poorest 40 percent
1 40.24 36.78 77.65 44.68 56.30 22.06 41.26%
2 41.63 53.69 52.60 34.25 91.06 50.23 47.52%
3 38.72 70.23 35.09 28.68 93.34 65.26 11.22%
Source: World Bank staff estimates based on Susenas/BPS data.
Despite the variation across clusters, a commonality emerges which is low education
levels. The deficiency in education is evident as clusters that have a higher proportion of the
work force in the formal sector also have significantly higher unemployment levels.
Moreover, even those who are employed in the non‐agriculture sector are likely to be
working in low skilled jobs because of the low education attainment.


Chapter 4Challenges to inclusive growth
in Sulawesi

37
This chapter identifies five key reasons to explain why fast growth in Sulawesi has taken
place at the same time as increasing inequality.
4.1. Slower growth in the agricultural sector
Growth in the agricultural sector is key to reducing poverty in Sulawesi. Between 2001‐
2011, agriculture sector GDP growth in Sulawesi was positively correlated with a reduction
in poverty. That is, a one percent growth in the agricultural sector is associated with a 0.04
percentage point reduction in the poverty rate. The impact of agriculture GDP growth is not
as strong as service sectors whereby a one percent growth in the service sector is positively
correlated with a 0.07 percent reduction in the poverty rate. This report’s analysis is
consistent with several existing studies, for example by Suryahadi, Sumarto, and
Suryadharma (2009) and Suryahadi and Hadiwijaya (2011)), that also concluded the major
role the agriculture sector growth played in reducing poverty in rural areas and concurred
with the finding that service sector growth has a bigger impact to poverty reduction.
Agricultural sector performance is important for reducing poverty because the majority of
the poor are employed in the sector. Although it only contributed 28.5 percent to the
region’s GDP, the agricultural sector provided 44.4 percent of Sulawesi’s employment in
2012. Agriculture is the main source of livelihood for the poor in Sulawesi – 67.4 percent of
the poor earned their income from this sector, according to data from the 2012 household
survey (Susenas). The poverty rate of the population working in the agricultural sector is
14.7 percent, which is 25 percent higher than the poverty rate for Sulawesi (11.8 percent)
Agricultural sector income is low because labor productivity in the sector remains low. The
challenge for those working in agriculture is that labor productivity, as measured by the
average value‐added per worker, is a major determinant of income. The correlation
between income and labor is particularly strong if the farms are smallholdings and are labor
intensive, as is the case in Sulawesi7 (De Janvry and Sadoulet, 2010).
The surplus of agriculture labor is another reason for low productivity and income in the
sector. The share of agricultural workers in Sulawesi’s total employment is 1.5 times higher
than agriculture’s share in the region’s GDP in 2012, suggesting that an employment surplus
exists. Thus, improving labor productivity can be achieved through either increasing value‐
added or reducing the number of workers. To illustrate the significance of re‐allocation of
labor out of the agriculture sector for improving agriculture labor productivity, we could
compare agriculture labor productivity growth if there is a change in the share of agriculture
labor in total employment or if the share of labor remains the same. In total, agriculture
labor productivity growth was increased by 64.6 percent between 2001 and 2012. However,
if the share of agriculture labor in total employment remains the same as in 2001, the
growth in agriculture labor productivity would only be 27.9 percent.
7 Smallholder farmer is defined as those that have the landholding of less than 2 ha, and depend on family members to fulfill the need of their labor force (IFAD, 2009). Majority of Sulawesi’s farmers can be considered as smallholder farmers, average land holding in the provinces of Sulawesi, according to agriculture census of 2013, is between 1.06 ha (Gorontalo) and 1.56 (Southeast Sulawesi), whereas 84 percent of farmers are either self‐employed, assisted by temporary workers, or themselves are family and temporary workers.

38
Sulawesi needs to improve the income of those working in the agriculture sector through
improving productivity and reducing the sector’s labor surplus. Chapter 5 analyzes
Sulawesi’s agricultural sector and proposes policy solutions to improve productivity.
4.2. Transition to rural non‐agricultural sectors have been slow
The majority of those working in agriculture reside in rural areas. Most of Sulawesi’s
poorest population lives in rural areas. In 2012, 5.7 million people or 80.7 percent of the
population in the poorest 40 resided in rural areas, which was equivalent to almost half of
Sulawesi’s rural population. Seventy percent of the rural poorest 40 are employed in the
agriculture sector. Of this figure, around 85 percent is employed in the food crops and estate
crops sub‐sectors8. Only 15 percent works in the fishery, livestock, and forestry sub‐sectors.
Most of them are informal workers who work as family/unpaid workers or as an employers
assisted by temporary labor. Less than 6 percent is employed as wage employees or as
employers who are assisted by permanent labor. In addition, about half of them work less
than 35 hours per week. Since an agricultural labor surplus is one of the reasons for
Sulawesi’s low average agricultural income, more workers need to shift to non‐agricultural
sector employment so that the poorest 40 can diversify their income sources.
Shifting rural agricultural workers to non‐agricultural sectors has been slow, while many
rural households rely on income from non‐agricultural sector. Though rural employment is
concentrated in agriculture, an increase in the share of non‐agricultural sector employment
is observed over time. In 2011, 40 percent of the labor force was involved in the non‐
agricultural sector as the first job. Meanwhile, 31 percent was involved in non‐agricultural
activities as a second job. The share of rural employment in non‐agricultural sector
increased by 13 percent between 2001 and 2011, compensating for the decline in
agriculture employment. Meanwhile, the contribution of non‐agricultural income is
relatively high for rural households. If only considering income from primary employment,
income from non‐agricultural sectors makes up 55 percent of total income in rural Sulawesi,
and on average contributes 42 percent to individual household income (Susenas, 2011).
Taking into account a whole range of income a household receives, however, income from
non‐agricultural sources contributes 67 percent of total rural income in South Sulawesi,
while the average proportion of non‐agricultural income a household receives is 54 percent
(IFLS, 2007).
More rural non‐agricultural sector employment opportunities are needed in order to
successfully reduce the agricultural labor surplus. Chapter 6 of this report analyzes the
economic contribution of rural non‐agricultural sectors and how governments can create
additional employment opportunities in the sectors. This report uses Davis’s (2007)
definition of ‘non‐agricultural’ as comprising non‐agricultural income generating activities,
either through wage employment or self‐employment. The rural non‐agricultural income
sources can come from rural service, rural trade, rural manufacturing, as well as income
originating from transfers and other non‐labor sources.9
8 The estate crops sub‐sector includes those that work primarily in horticulture. 9 As a comparison, Junior Davis (2004) defines the ‘rural non‐farm economy’ as comprising “all those non‐agricultural activities which generate income to rural households (including income in‐kind and remittances), either through waged work or in self‐employment,” while Elbers & Lanjouw (2001) uses the term ‘non‐farm’ and ‘non‐agricultural’ interchangeably. The latter, however, defines ‘non‐farm income’ as comprising income derived from home businesses and wage employment, while defining ‘non‐agricultural employment’ as only including “those individuals with wage employment in the non‐agricultural

39
4.3. Growth in the extractive industries has not been inclusive
The extractive industries’s role in driving growth in Sulawesi appears to mainly come
through the “indirect effect” resulting from the injection of capital through investment in
natural resources sectors. The extractive industry direct GDP growth themselves are
relatively small, contributing to only 6.6 percent of the total economic growth during 2001‐
2013. However, this sector contribute to a significant share of Sulawesi’s investment growth
which drives higher GDP growth in the island. For example, in 2011, 96 percent of foreign
direct investment in South Sulawesi was for nickel mining.
The economic multiplier effect on other sectors of the economy, however, is low. The
extractive industries in Sulawesi have few links to backward or forward industries. Instead,
they tend to be highly localized by dominating the local economy in a small number of
districts.
Employment in the sector is relatively low and dominated by informal work. Senior
positions in the formal sector were mostly held by outsiders. Only 1.76 percent of
Sulawesi’s labor force is employed in the extractive industries with 55% working in the
informal sector. Moreover, only 7.1 percent of those working in the extractive industries are
women. The limited employment opportunities means that the extractive industries often
fail to bring significant benefits to local communities. Conversely, reports of risks to workers’
safety, health dangers to nearby communities, and hazards to the wider environment means
the potential costs of the extractive industries may be significant, if not properly managed.
Sulawesi needs to ensure that the extractive industries play a more inclusive role in
region’s economy. With Sulawesi already considered Indonesia’s main nickel producing
region, the extractive industries have the potential to grow further and become more
significant to Sulawesi’s economy. Moreover, the risks associated with a growing extractive
industry are considerable: environmental damage and potential conflict between industry
and local communities over resource management, for example, means that it is crucial that
the extractive industries are properly managed and monitored. Chapter 7 assesses the less‐
than‐inclusive role of the extractive industries in Sulawesi, and proposes possible solutions
to how it can provide more benefits to the region and its communities in the future.
4.4. Low levels education and training limits workers’ mobility
Limited skills and education is a key challenge facing the poorest 40 because it constrains
their ability to find higher income employment. A key obstacle for worker mobility is that
many in the poorest 40 do not have the relevant skills to work in the secondary and tertiary
sectors. The extractive industries, for example, tend to employ skilled labor from outside of
Sulawesi for their more senior positions. Limited human capital also constrains Sulawesi
from diversifying its economy. Hence, improving skills and education of the poorest 40 and
shifting them to more productive sectors is the main way to improve their income.
sector as a primary occupation.” Araujo, et al. (2002) and Kundu’s (2003) definitions of ‘non‐farm’ align closely to that of Benjamin Davis (2007).

40
Improving human capital and workers’ mobility in Sulawesi requires improving overall
human development indicators, particularly in health and education outcomes. A
comparison of five key education and health outcomes show that Sulawesi has an average
education level but performs poorly in health. Sulawesi’s junior high school enrollment rate
of only 66 percent and senior high school enrollment rate of only 52 percent was lower than
Java, Bali and Sumatera but higher than Kalimantan and the rest of Eastern Indonesia. In the
share of births assisted by skilled health workers and health facilities utilization rates,
Sulawesi performs poorly compared to other regions.
Figure 4.1. General population ‐ Key service delivery indicators, Sulawesi and other regions, 2012
Source: Susenas, World Bank estimates.
Sulawesi needs to improve its provision of basic services in order to lift its education and
health outcomes. Chapter 8 analyzes the main constraints for effective service delivery and
proposes a set of recommendations to address the identified issues.
4.5. Poor infrastructure constrains sustainable economic growth
Access to public Infrastructure in Sulawesi has been steadily improving during the last
decade, but overall improvement has been modest. Household access to electricity,
sanitation, water and roads has had modest but steady improvements all across the island.
Compared to other regions in Indonesia, Sulawesi provides households an average level of
access to infrastructure. Sulawesi’s access to all types of public infrastructure is slightly
below average, in comparison to the rest of Indonesia. In general, Java and Bali have the
best access for all types of infrastructure except sanitation. Eastern Indonesia has the worst
access to electricity and sanitation. Kalimantan has the worst access to water and roads.
Sulawesi has a similar level of access to Sumatera: it performs well in some areas such as
water and roads but worse in others such as electricity and sanitation.
Sulawesi spends much less on infrastructure than other regions. In 2001‐09, Sulawesi’s
annual per capita infrastructure expenditure was only Rp 88,500 (in constant 2000 rupiah).
This figure includes spending by all levels of government—central, provincial and district
governments.
62%
46%
66%
77%
45%
74%
53%
86%80%
47%
66%
48%
80% 77%
35%
66%
52%
71%76%
41%
71%
55%
88%
76%
45%
0%
20%
40%
60%
80%
100%
NER Junior High NER Senior High Births assisted byskilled worker
Immunization rate Utilization rate
Eastern Ind. Java/Bali Kalimantan Sulawesi Sumatera

41
Limited access to infrastructure constrains the ability of workers to seek employment in
more productive sectors. Infrastructure is needed to enable those employed in the low‐
productivity agriculture sector to transition to rural non‐farm jobs or migrate from rural to
urban areas to work in higher productivity jobs.
Sulawesi needs to improve access to all types of infrastructure in order to grow
sustainably and inclusively. Without adequate infrastructure, Sulawesi cannot take full
advantage of the positive spillovers that come with urban economic growth and rural
development that has been taking place in the region. Chapter 9 analyzes Sulawesi’s
urbanization and infrastructure trends and proposes policies to improve infrastructure in the
region

Part 2: Addressing the challenge to inclusive economic growth in Sulawesi
Part two of the report comprises Chapter 5-9 discusses each
challenge in more detail and proposes policy measures for
each challenge. Chapter 5 analyzes the first challenge of how
to make agricultural sector more productive in order to
increase income for labor participants in the sector. This
chapter analyzes the agriculture sector through the lens of
Sulawesi’s three main commodities: rice, cocoa, and maize.
Chapter 6 analyzes the challenge of developing the rural
non-farm sector so that it can generate alternative and
higher income employment for the rural poor. Chapter 7
discusses why Sulawesi’s extractive industry is not inclusive
and offers ideas for improvement so that more communities
benefit from its growth. Chapter 8 analyzes why health and
education outcomes are low in Sulawesi and identifies the
main constraints for effective service delivery, particularly
for the vulnerable and marginalised population. Chapter 9
assesses Sulawesi’s infrastructure challenges and how
increased access to public infrastructure is crucial for
ensuring Sulawesi achieves sustained economic growth.
Chapter 10 will conclude with a conclusion of the key
priorities for Sulawesi.
Part 2: Aeconomic growth in Sulawesi
Part two of the report comprises Chapter 5-9 discusses each
challenge in more detail and proposes policy measures for
each challenge Chapter 5 analyzes the first challenge of h
enerate alter
e employment for the rural poor.
why Sulawesi’s extractive industry is n
s ideas for improvement so that more c
from its growth. Chapter 8
education outcomes are low in
main constraints for effective
for the vulnerable and
assesses Sulawesi
increased access
ensuring Sulawe
Chapter 10 will co
pr


Chapter 5Improve Agricultural Sector
Productivity

45
As identified in Chapter 4, a priority for improving growth inclusiveness is to improve
agricultural sector productivity in Sulawesi. Although the sector is not growing as quickly
the rest of the Sulawesi economy, it remains an important sector because a large proportion
of the poorest 40 work in the agriculture sector. Increasing the income of the poorest 40
through improving agricultural sector productivity is therefore a priority for Sulawesi.
This chapter proposes policy solutions for improving agricultural productivity by discussing
the opportunities and constraints in sustaining growth in three main commodities: rice,
cocoa, and maize. These three commodities are the focus of Chapter 5 because they are the
most important contributors to Sulawesi’s agricultural sector GDP.
5.1. Rice
5.1.1. Constraints and Opportunities for Smallholder Farming in Rice
Since early 2000s, the Indonesian government shifted its rice policy from focusing on price
stabilization to promoting high prices for farmers. Prior to the 1997 Asian financial crisis,
Indonesian government was relatively successfull in achieving the rice policy goal of
stabilizing domestic rice prices so that it is close to the average international price (Warr,
2011; Dodge and Gemessa, 2012).10 Since the 2000s, however, the government enacted
trade restrictions and shifted rice policy to one that promoted high prices for farmers. The
domestic rice price was significantly higher than the international price between 2005‐2007.
An export ban prevented domestic prices from increasing further in 2008‐2009 at a time
when international prices was also high. From 2010, domestic rice price was persistently
higher than the international price. Previously a traded good where the domestic price was
largely driven by the international market, rice became a non‐traded good where the
domestic price became dependent on domestic conditions of supply and demand (Warr,
2011).
Most rice producers in Sulawesi, and in Indonesia broadly, do not benefit from the “high‐
rice‐price” policy because they are not net producers of rice. According to the 2012
Susenas survey, only 18 percent of Sulawesi households are net rice producers. Across
Indonesia, only 12.6 percent of households are net rice producers. The majority of rice
producers are therefore disadvantaged by high rice prices. According to Warr (2011), several
studies show that high rice prices have adverse impacts, particularly for Indonesia’s poor.
For example, Warr’s analysis shows that a 10 percent increase in the real price of rice will
raise poverty incidence by 0.8 percent.
Instead of ensuring high prices, Sulawesi should prioritize efforts to improve rice
production efficiency and productivity and increase the available marketing channels to
producers. Improving agricultural efficiency and productivity can raise domestic rice
production and farmers’ incomes without raising the price level, which can have an adverse
impact on poor consumers.
10 Indonesia’s domestic rice price in 1967‐97 hovers around long‐term median rice price with just a quarter of global price
volatility (Dodge and Gemessa, 2012).
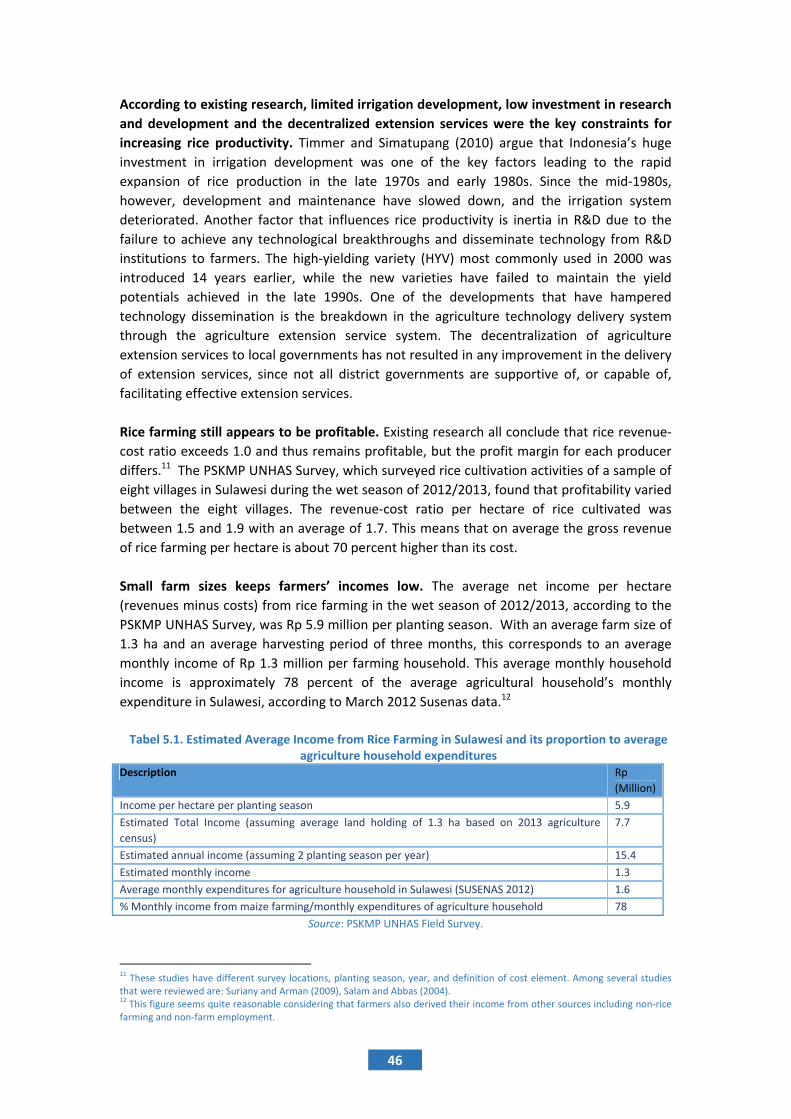
46
According to existing research, limited irrigation development, low investment in research
and development and the decentralized extension services were the key constraints for
increasing rice productivity. Timmer and Simatupang (2010) argue that Indonesia’s huge
investment in irrigation development was one of the key factors leading to the rapid
expansion of rice production in the late 1970s and early 1980s. Since the mid‐1980s,
however, development and maintenance have slowed down, and the irrigation system
deteriorated. Another factor that influences rice productivity is inertia in R&D due to the
failure to achieve any technological breakthroughs and disseminate technology from R&D
institutions to farmers. The high‐yielding variety (HYV) most commonly used in 2000 was
introduced 14 years earlier, while the new varieties have failed to maintain the yield
potentials achieved in the late 1990s. One of the developments that have hampered
technology dissemination is the breakdown in the agriculture technology delivery system
through the agriculture extension service system. The decentralization of agriculture
extension services to local governments has not resulted in any improvement in the delivery
of extension services, since not all district governments are supportive of, or capable of,
facilitating effective extension services.
Rice farming still appears to be profitable. Existing research all conclude that rice revenue‐
cost ratio exceeds 1.0 and thus remains profitable, but the profit margin for each producer
differs.11 The PSKMP UNHAS Survey, which surveyed rice cultivation activities of a sample of
eight villages in Sulawesi during the wet season of 2012/2013, found that profitability varied
between the eight villages. The revenue‐cost ratio per hectare of rice cultivated was
between 1.5 and 1.9 with an average of 1.7. This means that on average the gross revenue
of rice farming per hectare is about 70 percent higher than its cost.
Small farm sizes keeps farmers’ incomes low. The average net income per hectare
(revenues minus costs) from rice farming in the wet season of 2012/2013, according to the
PSKMP UNHAS Survey, was Rp 5.9 million per planting season. With an average farm size of
1.3 ha and an average harvesting period of three months, this corresponds to an average
monthly income of Rp 1.3 million per farming household. This average monthly household
income is approximately 78 percent of the average agricultural household’s monthly
expenditure in Sulawesi, according to March 2012 Susenas data.12
Tabel 5.1. Estimated Average Income from Rice Farming in Sulawesi and its proportion to average
agriculture household expenditures Description Rp
(Million)
Income per hectare per planting season 5.9
Estimated Total Income (assuming average land holding of 1.3 ha based on 2013 agriculture
census)
7.7
Estimated annual income (assuming 2 planting season per year) 15.4
Estimated monthly income 1.3
Average monthly expenditures for agriculture household in Sulawesi (SUSENAS 2012) 1.6
% Monthly income from maize farming/monthly expenditures of agriculture household 78
Source: PSKMP UNHAS Field Survey.
11 These studies have different survey locations, planting season, year, and definition of cost element. Among several studies
that were reviewed are: Suriany and Arman (2009), Salam and Abbas (2004). 12 This figure seems quite reasonable considering that farmers also derived their income from other sources including non‐rice
farming and non‐farm employment.
47
Indonesia’s premium rice export market is still relatively small but is a potential
opportunity for Sulawesi’s farmers. Indonesia’s rice exports have been small, having never
exceeded 1,200 tons. There are three constraints to rice exports. First, under current
regulations rice producers may only export premium‐grade rice. Second, exports are also
limited by production constraints such as farmers’ practice of choosing rice varietas based
on yield rather than quality; and limited using of post‐harvest treatment and milling
technology (Suriany, et.al, 2009). Third, few actors in the agricultural sector are interested in
exporting rice13 and the P3KM UNHAS survey also found that a quality grading system is not
widely used in Sulawesi’s rice trading.
5.1.2. Policy Implications and Recommendations for Rice
Increasing land productivity is the most feasible option to increase income from rice
farming in Sulawesi. Rice farmers’ income remains low because farms are small but
increasing the average farm size will take time because it requires existing laborers to move
to alternative sectors. Keeping domestic rice prices high to increase farmers’ revenue hurts
the poor who are the net consumers of rice. There is, however, an opportunity to increase
land productivity in Sulawesi because yield per hectare is 21 percent lower than the
benchmark regions in East Java. Increasing productivity to East Java levels, means the
average farmers’ income per hectare will be 21 percent higher (assuming costs and prices
stay constant).
Rehabilitating Sulawesi’s irrigation network needs provincial and district government
investment in order to increase land productivity. Irrigation and extension services are two
services that fall under the provincial and district governments’s responsibilities14 but are
currently under‐provided. Investment is needed both to improve the coverage of the
irrigation network and to rehabilitate existing networks. Improving coverage needs
significant capital and can only be achieved with central government support and
coordination. Rehabilitation should be possible with financing from sub‐national
government budgets.
Revitalizing extension services is another priority area for Sulawesi’s governments because
the services could provide farmers the support needed to improve farming practices. Field
research by P3KM UNHAS suggests that Sulawesi’s farmers have not fully adopted more
advanced farming practices. The UNHAS study suggests that farmers could improve land
productivity through using higher quality seeds, using location‐specific fertilizer and
adopting new farming techniques such as direct seeding and Systems of Rice Intensification
(SRI). Encouraging farmers to adopt these farming techniques requires revitalizing the
provision of extension services. The provincial and district governments in Sulawesi need to
disseminate evidence‐based agricultural knowledge and technology and relevant research
and development advancements, provide marketing information, and facilitate access to
finance.
Extension services must be adequately resourced. The re‐channeling of the central
government fund for extension services – currently channeled as deconcentration fund –
13 http://www.sulsel.go.id/content/beras‐sulsel‐ditarget‐51‐juta‐ton
14 Except for irrigation network that spans across the boundary of provinces, state, or strategic network which falls under the
authority of central government.

48
into regional transfer fund, i.e. as DAK for example, can leverage additional resources for
extension services if it includes a requirement to provide matching budget component as a
way to ensure the contribution of local governments. It will also fully transfer the
management of extension workers to local governments, and avoiding the problem of
conflicting directions stemming from a dual funding structure.
Governments should consider using farmers’ organizations to deliver extension services.
Farmers groups can act as a “knowledge broker” and identify the service needs to their
members and link those members to relevant providers or provide those services
themselves. One of the conclusions from National Agriculture Panel Survey (PATANAS) is
that farmers groups are more effective if they provide services such as operating a rotating
saving and credit group (arisan), run religious study groups (pengajian) and saving‐loan
group.
5.2. Maize
5.2.1. Constraints and Opportunities for Smallholder Farming in Maize
Demand for maize continues to be strong, fueled by the increasing demand from the
livestock feed industry. Demand for maize from the livestock feed industry grew by 11
percent annually over 2009‐2013. Since this demand cannot be met through domestic
production Indonesia is a net importer of maize, despite official statistics showing a large
production surplus. Although Indonesia has not placed an import tariff on maize since 2011,
the Ministry of Agriculture (MoA) maintains an unofficial import quota. In order to import
maize, a feed miller must obtain an import recommendation from MoA. The number of
important recommendations the MoA issues depends on the estimated difference between
domestic corn production and feed demand (USDA, 2014).
Ensuring an uninterrupted supply of quality maize also drives imports. Although domestic
maize prices are often lower than import prices, the volume of maize imported to Indonesia
remains significant. For example, the average producer price for maize in Indonesia was
below the estimated landed price15 for imported maize in 2012. Moreover, the average
producer prices in the two main production centers in Sulawesi (South Sulawesi and
Gorontalo) have always been lower than estimated price for imported maize. The continued
high level of maize import may be due to (a) the existence of production deficit as suggested
by USDA data but refuted by data from the BPS; and (b) the challenges on relying on a
continuous domestic supply of quality maize, as claimed by feed industry sources. The
seasonal nature of Indonesia’s maize harvest and the limited number of proper warehouses
(silos) makes it difficult for producers to maintain a constant supply of maize throughout the
year. Furthermore, domestically produced maize face quality issues that stem from poor
post‐harvest management practices – most farmers do not have drying facilities and use sun
drying methods that result in high moisture content (Desianto 2012, USDA 2014).
15 Calculated as average international price based on World Bank Commodity Price Database plus additional 25% for estimated
cost of freight which is lower bound estimate for freight cost, as provided by Abbassian (2006)

49
Sulawesi’s maize production has increased significantly since 2005. Sulawesi’s share of
national maize production showed increased from 9.2 percent in 2001 to 14.6 percent in
2013. Among the six provinces in Sulawesi, Gorontalo’s maize production achieved the
fastest growth. According to BPS data, Gorontalo’s production increased by 810 percent
from 2001 to 2013 – its share of total national maize production increased from 0.9 percent
in 2001 to 3.6 percent in 2013.
Sulawesi’s yield per hectare is lower than many other provinces, suggesting an
opportunity for improvement. Maize productivity in West Sulawesi province is the highest
in Sulawesi but remains approximately 50% lower than West Java, Indonesia’s most
productive maize producer. The overall maize yield in Sulawesi is about 20 percent lower
than in Java and Sumatra. Southeast Sulawesi’s average yield in 2013 was amongst the
lowest in Indonesia at only 2.5 tons per hectare.
Climate, topography and lower levels of hybrid seed adoption are possible reasons for
Sulawesi’s lower maize productivity. Existing research suggests that the spread of hybrid
seeds led to rapid maize yield increases in the early 1990s but Sulawesi was a late adopter
(Kasryno, et.al, 2010, Swastika, et.al 2004). Sarasutha (2002) pointed out that as late as
1989, 75 percent of maize cultivated in Sulawesi used locally bred seed. Kasryno, et.al (2010)
concluded that maize yields in South Sulawesi were relatively stagnant until the mid‐1990s
compared to other regions, such as in Sumatra (Lampung province) and Java regions, areas
that had higher hybrid seed adoption rates. Swastika, et.al (2004) found that the adoption
rate of hybrid seeds was lower in South Sulawesi than in Sumatra (in Lampung) and in Java.
Farmers’ did not purchase hybrid seeds due to limited access to capital. Sulawesi farmers
who used hybrid seeds achieved excellent financial returns of a revenue‐cost ratio of 2
(PSKMP UNHAS (2013), PATANAS (2011), and Hadijah and Subagio (2012)). Total revenue
from maize farming remains low, however, leaving little capital for investment for the
following season’s planting. (See table 4.2 for illustration).
Table 5.2. Estimated Average Income from Maize Farming in Sulawesi and its proportion to
average agriculture household expenditures
Description Rp
(Million)
Income per hectare per planting season 3.29
Estimated Total Income (assuming average land holding of 1.3 ha based on
2013 agriculture census)
4.27
Estimated annual income (assuming 3 planting season per year) 12.83
Estimated monthly income 1.06
Average monthly expenditures for agriculture household in Sulawesi
(SUSENAS 2012)
1.64
% Monthly income from maize farming/monthly expenditures of agriculture
household
65
Source: PSKMP UNHAS Field Survey.

50
5.2.2. Policy Implications and Recommendations for Maize
Sulawesi has the potential to become one of the biggest maize producing regions in
Indonesia. South Sulawesi has always been one of the key maize producing provinces in
Indonesia. Gorontalo province’s emergence as a key maize producer during the last decade
demonstrates the potential of other provinces in Sulawesi to improve their maize
production and play a larger role to meet the increasing demand from Indonesia’s domestic
market. Southeast Sulawesi and Central Sulawesi, in particular, has the potential to
significantly increase maize production through improving yields because it has similar agro‐
climatic conditions with other provinces in Sulawesi.
Governments should consider establishing partnerships with the private sector to promote
high yield maize varieties and other productivity enhancing inputs to farmers. The
corporate sector, such as seed companies and the feed industry, promote hybrid seeds and
good farming management practices as part of their marketing strategy. The existence of
these promotional activities creates opportunities for public private partnerships, in order to
reduce the burden on government research and extension services.
Farmers’ access to finance needs to expand. Low adoption of productivity enhancing inputs
is both a function of farmers’ limited knowledge and skills and their limited access to capital.
Maize farmers income levels are insufficient to finance productivity enhancing inputs such as
hybrid seeds; farmers also only have access to credit that incur relatively high interest rate.
Existing government initiatives designed to enhance access to finance for farmers, such as
Kredit Ketahanan Pangan (Food Security Credit), and through programs such as PUAP (Rural
Agribusiness Development Program) need to be strengthened. According to PSKMP UNHAS,
only a small number of farmers surveyed received their loans from cooperatives and banks.
Governments should consider providing incentives to the private sector to provide drying
and storage facilities. Anecdotal evidence suggests that drying and storage facilities
provided by the government with good intention are not being used16, despite the need for
these facilities. Instead of providing these facilities directly, the government should consider
encouraging the private or nonprofit sector to supply the facilities through the provision of
incentives such as subsidies.
5.3. Cocoa
5.3.1. Constraints and Opportunities for Smallholder Farming in Cocoa
Sulawesi’s cocoa is mainly sold in the international market. Indonesia is the third‐largest
producer of cocoa beans globally, contributing to about 12.5 percent to global production.
Approximately 67 percent of Indonesia’s production originates from Sulawesi (BPS 2013),
which makes Sulawesi the third largest producer of cocoa beans after Cote d’Ivoire and
Ghana. The majority of Indonesia’s cocoa is exported either as raw beans or processed
cocoa (paste, liquor, butter, or powder).
16 One of them that was found during PSKMP UNHAS survey is the unutilized power thresher.
51
Since 2010, Indonesia has significantly increased the export of processed cocoa. To
promote downstream industrial development, the Government introduced a raw cocoa
beans export tax in April 2010. The rate of tax is on a sliding scale between 0 to 15 percent
depending on international cocoa price. Export tax ceases if the international cocoa price
drops below US$2,000 per ton, and may increase up to a maximum of 15 percent if the price
is above US$3,500/ton. The policy’s impact on Indonesia’s export composition was
immediate. Prior to the export tax, 77 percent of Indonesia’s cocoa exports were raw cocoa
beans. The proportion of raw beans declined to 46 percent of total cocoa exports in 2011
and 37 percent in 2012. The increased dominance of processed cocoa in Indonesia’s cocoa
export market was driven by a combination of increase in processed bean production from
utilizing unused capacity and the establishment of new processing facilities.17
Raw beans still constitute the majority of exports that originate directly from Sulawesi,
however. In 2012, Sulawesi exported 84 percent raw beans and 16 percent processed cocoa,
indicating that most cocoa processing took place outside of Sulawesi.
Ageing cocoa trees and pest infestation are two key constraints facing cocoa production in
Sulawesi. A cocoa tree’s peak production level is at 10 years of age, after which its yields
start to decline. The majority of cocoa trees in Sulawesi were planted after 1980. Many
cocoa trees in Sulawesi, therefore, need to be replanted. Smallholder farmers who
constitute the majority of cocoa farmers seem hesitant to invest in upgrading. One study
shows that only 6 percent of farmers interviewed for a field survey in Central Sulawesi
planned to undertake major replanting initiatives (Clough, et.al, 2009). Farmers may be
reluctant to replant because it is costly and knowledge intensive. Moreover, the pest
infestation is increasingly problematic and reduces incentive to invest in replanting (PSKMP
UNHAS, 2013). According to Nishiyama (1996), the spread of cocoa pod borer (CPB) disease
was first discovered in the mid‐1990s in Sulawesi but the dramatic impact on yields was not
observed until after 2004 when yields continued to decline until 2009. All villages that were
part of the PSKMP UNHAS field survey and the 2012 PATANAS survey reported the severity
of pest infestation in their areas. According to one estimate, severe CPB attacks have
infected about 40 percent of cocoa planting areas, and caused yields to decline by 5‐80
percent (Wahyudi, 2007).
The quality of cocoa produced in Sulawesi is also inconsistent, resulting in lower prices.
Sulawei’s cocoa beans has low butter content, is relatively small size, and often has high
content of dirt. These quality problems are partly caused by CPB infestation, which causes
flat or unfilled beans and the mixing of beans with dirt (MCI, 2010; World Bank, 2006;
PSKMP UNHAS, 2013). Moreover, quality issues are exacerbated because Indonesia’s cocoa
trading system is characterized by the need to fulfill targeted quantities for export. In order
to meet export targets, producers mix good beans with beans that were initially rejected for
export, which reduced the price of Sulawesi’s cocoa in the international market.
Producers were also reluctant to increase quality through cocoa fermentation. Sulawesi
beans were traditionally exported to the United States. The beans were used as fillers and
17 As a consequence of the Export Tax, International exporters are now revising their business strategy. Rather than exporting
raw bean for processing overseas, ADM and Cargill are considering opening processing factories in Indonesia. Other new investors include Guanchong Cocoa (Malaysia), JB Cocoa (Malaysia) and Barry Callebaut/PT Comextra Majora (Swiss/Indonesia) (Sendall, 2013).

52
blended with flavor‐adding fermented beans sourced elsewhere. These unfermented beans
were sold at the discounted New York terminal price. Although fermented beans are sold at
a 10% price premium, farmers remain reluctant to add the processing cost and time to the
production process (at least one week). Sulawesi’s limited cocoa processing facilities may
also limit the demand for fermented beans. According to MCI (2010), the processing
industry generally requires a secure supply of fermented beans. An increase in domestic
processing should therefore lead to an increase in the demand for fermented cocoa beans.
5.3.2. Policy Implication and Recommendations for Cocoa
Cocoa producers are constrained by production challenges. Ageing trees and pest
infestation have caused yields to decline and made cocoa cultivation less profitable, thus
encouraging some farmers to switch crops. Cocoa farmers are less able to take advantage of
favorable changes to market conditions, both internationally and domestically.
Smallholder farmers are also limited by personal constraints. Concerns about economic
security, lack of alternative sources of income, and risk aversion means farmers are reluctant
to invest the time and capital needed to replace low‐yield cocoa trees. These factors,
combined with limited technical knowledge on good agriculture practices, means farmers
have not been able to effectively overcome production problems of ageing trees and pest
infestation. External support from public and private sector actors is needed.
The public sector massive investment in the form of GERNAS Kakao is seems to be a step
in the right direction; however, the program achievements need to be fully assessed by
the independent evaluator. Between 2009‐2013, the Indonesian government invested at
least Rp 3 trillion rupiah18 in the GERNAS Kakao program. The program includes activities
that rejuvenate and rehabilitate cocoa trees, train farmers in good agricultural practices,
develop new research stations, recruit additional extension workers, and quality
improvement initiatives. The government is likely to extend the program to the end of
201419. In the absence of an independent evaluation of the program and because of the
limited information available regarding its implementation, this policy note does not assess
whether GERNAS Kakao should be continued or not. Public investments in effective
programs that assist farmers to overcome production constraints need to be continued,
however.
A public program like GERNAS Kakao needs to be combined with an initiative that
facilitates access to finance for smallholders. A key reason farmers are reluctant to invest in
cocoa replanting is the loss of income during the waiting for new plants to grow and the
concern that the replanting effort will fail because inappropriate technology was used (for
example, side grafting versus scion grafting). Farmers need bridge financing until the next
harvest. Moreover, replanting is high risk because of potential spread of pests and as a
result financial institutions may not be interested in financing cocoa farming. Farmers
needing credit to finance replanting and productivity improvement investment need a third‐
party guarantor. The Government can potentially become a guarantor perhaps in
18 Figures for the whole Indonesia
19 “Anggaran Meningkat, Gernas Pro Kakao Lanjut 2014”. http://www.antarasulawesiselatan.com/print/27871/profil‐antara

53
partnership with the cocoa‐processing industry, who depends on an uninterrupted supply of
raw materials from cocoa farmers.
Create synergy with private and non‐government sector initiatives. The cocoa sector is
quite exceptional in the willingness of downstream private sector actors to assist upstream
production actors to secure an uninterrupted supply of quality cocoa. Private‐sector
companies such as Armajaro, BT Cocoa, Olam, and Mondelez, in cooperation with the
Indonesian Cocoa Association (ASKINDO) have implemented programs to assist farmers,
sometimes in partnership with non‐government organizations. The majority of these
programs focus on training farmers in good agriculture practices, establishing links with
downstream value‐chain actors, strengthening farmer organizations, as well as research and
development activities aimed to contain the spread of cocoa pests. These programs offer
many valuable lessons that can be integrated into government‐sponsored programs.
Establish a data management system and improve data reliability and accessibility. Having
access to reliable data is critical for improving cocoa planning and management.
Unfortunately, government‐sourced data and industry‐sourced data on cocoa are often
inconsistent, a problem faced in accessing reliable for other agricultural commodities. In
2008, Cocoa Sustainability Partnership (CSP), a multi stakeholder partnership for cocoa
development, recommended that the GERNAS Kakao program invest in developing a
comprehensive data management system, which included information on satellite imaging,
weather forecasts, market information, information on the spatial distribution of cocoa
production areas, planting conditions, pest infestation, and information on farmer groups.
No such database exists and both the establishment and maintenance of such a database
would require considerable resources. As an initial step, the Government can disseminate
the data from the 2013 agriculture census to provide more accurate data on cocoa
cultivation areas and improve the methodology used to estimate total cocoa production
levels. Improveing the reliability of production data is a small step towards better
monitoring of whether public programs for cocoa development is achieving its goals.
Utilize cocoa middlemen and trader networks as an alternative way of delivering public
services to the agricultural community. Cocoa traders are often viewed with suspicion and
are not involved in the delivery of public programs that aim to help farmers. Competition
within the cocoa trading sector is strong and margins relatively low and to differentiate
themselves, many traders have provided services to farmers such as financing. Traders’ close
relationship with farmers, driven by mutual economic interest, is a strong platform to deliver
services to farmers. For example, traders can potentially serve as a guarantor when farmers
apply for financing. A trained trader can also be used to provide information and training to
farmers on good agricultural practices, or assist them to develop links with a cocoa
processing company that might provide incentives to improve quality. The experience of
PEKA (Peningkatan Ekonomi Kakao Aceh), a program implemented by Swiss Contact,
demonstrates that an inclusive approach towards traders yields good results (De Wolf,
2013).
Promote of quality improvement through market‐based approaches rather than enacting
more regulatory measures. The PSKMP UNHAS survey found that quality control was
needed in order to prevent Sulawesi cocoa from being sold at a discounted price because it
did not comply with the Indonesian national standard (SNI). Instead of enacting regulatory

54
measures, the Indonesian government should consider market‐based approaches such as
using farmer cooperatives to set quality standards. This creates a win‐win situation where
farmer members can sell their cocoa quickly and receive a share of the premium qprice
received by cooperatives. In the absence of farmer organizations, the PEKA project in Aceh
showed that providing incentives for traders to pay premiums for fermented beans is also
effective (De Wolf, 2013).
5.4. Conclusion
Improving agricultural growth in Sulawesi can be achieved by reducing the productivity
gap between Sulawesi and the best performing regions in Indonesia. Average land
productivity or yield for rice in Sulawesi is 21 percent lower than in East Java, one of the
most productive regions in Indonesia; The gap in maize productivity is even larger – maize
yield in West Sulawesi, the regions most productive maize producer, is around 50 percent
lower than West Java, which has the highest yield in Indonesia. Cocoa productivity in
Sulawesi is high in comparison to other regions, but its currently yield levels is only 70
percent of that achieved during the late 1990s.
Sub‐optimal farming practices such as using poor quality seeds and insufficient investment
in replanting cocoa trees contribute to low land productivity in Sulawesi. The 2010
PATANAS survey, for example, found that only 29 percent of rice South Sulawesi farmers in
survey villages used labeled seedling, compared to 68 percent in rice producing villages
surveyed in East Java. Several studies also suggest that the adoption of high yielding maize
varieties is lower in Sulawesi in comparison to Java or Sumatra. In cocoa commodity, farmers
are also not investing in rejuvenating and replanting aged trees.
Insufficient use of better quality inputs is both a function of farmers’ limited knowledge
and skills and a function of financial constraints farmers face. Farmers generally do not
generate enough income to save and invest to improve the following harvest’s yields. If
investments are made, they are financed by high‐interest loans. For example, the lack of
bridging finance is a key reason for why farmers do not replace ageing and low‐yield cocoa
trees.
Farmers cannot take advantage of favorable market conditions if they do not overcome
production constraints. The demand for maize and cocoa is increasing, at least in the
medium term. Demand for maize is predominantly from the livestock feed industry, while
there is a global structural deficit in cocoa production. Domestic maize and cocoa production
capacity does not meet this growing demand. Although Sulawesi’s maize and cocoa prices
are competitive in the international market, it does not meet quality requirements. Sulawesi
maize’s high moisture content and the absence of bean fermentation of Sulawesi’s cocoa
are two key quality problems that need to be overcome. Furthermore, Sulawesi’s inability to
provide uninterrupted supply of cocoa and maize limits its ability to capture a larger share of
the domestic market.
Rice prices and profits are vulnerable to the national rice policy changes. Since the early
2000s, the central government shifted its rice policy from price stabilization to promoting
high prices for farmers with the result that domestic rice price is higher than the
international price. Since Sulawesi’s average rice production cost is slightly higher than the

55
landed price for imported rice, but lower than production cost of other regions within
Indonesia, this policy allows Sulawesi’s farmers to remain competitive in the domestic rice
market. Transport and logistics costs of sending rice out of the island are indeed high, but
not prohibitive as has been demonstrated by the substantial quantity of inter‐island trade
from Sulawesi. The problem with high rice prices is that most farmers in Sulawesi are not
net producers of rice because average farm size is small and thus cannot take advantage of
the “high‐price” policy. Moreover, as a major staple food, high rice prices have a
disproportionate negative impact on the poor.
Sulawesi’s provincial and district governments should focus their limited resources on
increasing maize and cocoa productivity. Sulawesi is relatively competitive in the
international and domestic markets of both commodities. The existing domestic production
deficit implies that increasing output is not expected to lead to a sharp decline in the prices
of these commodities. In particular, South‐East Sulawesi province has an opportunity to
increase maize productivity because its productivity level is amongst the lowest in Indonesia.
Gorontalo province’s maize productivity increased by 113 percent during the last decade,
and sets a strong example of potential results from a concerted effort to improve
productivity.
Improving maize and cocoa yields requires improving farmers’ access to finance and
improving the provision of extension services. The government has introduced many
initiatives to enhance agriculture and rural financing but these programs need to expand
their coverage. Only a limited number of farmers surveyed by PSKMP UNHAS received loans
from cooperatives and banks suggesting the limited penetration of these programs. Sulawesi
farmers also need to adopt more good agricultural practices, such as using better quality
seeds, applying location‐specific fertilizer, and adopting PSPSP in cocoa20. Extension services
are needed so that farmers receive appropriate information on scientific based agricultural
practices, technology and knowledge. In the cocoa and maize sectors, opportunities to
establish partnerships with the private sector in promoting these practices exist. Taking
advantage of public‐private partnerships in the provision of extension reduces the
government’s burden. .
Improving rice productivity is also important but needs significant public investment. The
two main priorities for Sulawesi’s governments are expanding Sulawesi’s irrigation networks,
rehabilitating existing networks and revitalizing extension services. Expanding irrigation
coverage, however, require significant capital and can only be achieved if there is
coordination across all levels of government. Extension services needs to be adequately
resourced and can be delivered through networks such as farming organizations.
20 "Panen Sering, Pemupukan, Sanitasi dan Pemangkasan"; translated "frequent harvesting, application of fertilizers, sanitation
and pruning"


Chapter 6Create More Opportunities in
the Rural Non-Agricultural Sector

58
To reduce agricultural sector labor surplus, more opportunities in the rural non‐
agricultural sector needs to be created. As discussed in Chapter 4, one of the key reasons
for low income in the agricultural sector is the low labor productivity driven by the large size
of agriculture labor. Thus agricultural workers need to shift to more productive, higher
income, non‐agricultural sectors. In particular, more non‐agricultural sector opportunities
are needed in rural areas. This report uses Davis’s (2007) definition of ‘non‐agricultural’ to
include non‐agricultural income generating activities, either through wage employment or
self‐employment. Rural non‐agricultural income sources can come from rural service, rural
trade, rural manufacturing, as well as income originating from transfers and other non‐labor
sources.21
This chapter assesses the contribution of the rural non‐agricultural sector to Sulawesi’s
economy, its potential in providing alternative higher income employment for the rural poor
and policy measures that foster its development.
6.1. The Contribution of the Rural Economy in Sulawesi
The rural economy contributes to more than half of Sulawesi’s economy. The contribution
of rural GDP in Sulawesi declined from 57.3 percent in 2001 to 55.2 percent in 2011,22
reflecting the trend that Sulawesi’s rural economy has been growing at a slower rate than
the urban economy. Rural economic growth increased by 35 percent in 2000‐06. During this
period, Sulawesi’s rural growth rate was faster than its urban growth rate, and the national
growth rate. Between 2006‐11, the region’s rural economy grew by a further 37 percent.
Over this period, the rate of urban growth exceeded rural growth as a result of the booming
tertiary sectors.23
Per capita rural GDP is increasing more quickly than per capita urban GDP but in 2011 was
still only two‐thirds of per capita urban GDP. Per capita GDP in rural Sulawesi increased
from Rp 3.3 million in 2001 to Rp 5.4 million in 2011, representing 83 percent of Sulawesi’s
overall per capita GDP and 62 percent of per capita GDP in urban Sulawesi. North Sulawesi
has the highest rural GDP per capita of Rp 7.0 million, while Gorontalo has the lowest rural
GDP per capita of Rp 2.4 million.
The agricultural sector is the highest contributor to Sulawesi’s rural economy, although its
share is declining. The share of agriculture in the rural economy declined from 56 percent in
2001 to 47 percent in 2011. Conversely, industrial sectors increased from 20 percent of
Sulawesi’s rural economy in 2001 to 24 percent in 2011, and the share of tertiary sectors
increased from 23 percent to 29 percent over the same period.
21 As a comparison, Junior Davis (2004) defines the ‘rural non‐farm economy’ as comprising “all those non‐agricultural activities
which generate income to rural households (including income in‐kind and remittances), either through waged work or in self‐employment,” while Elbers & Lanjouw (2001) uses the term ‘non‐farm’ and ‘non‐agricultural’ interchangeably. The latter, however, defines ‘non‐agricultural income’ as comprising income derived from home businesses and wage employment, while defining ‘non‐agricultural employment’ as only including “those individuals with wage employment in the non‐agricultural sector as a primary occupation.” Araujo, et al. (2002) and Kundu’s (2003) definitions of ‘non‐farm’ align closely to that of Benjamin Davis (2007). 22 The share of rural GDP is estimated by taking the proportion of per capita expenditure of rural workers based on their
employment sectors.

59
6.2. Rural Non‐Agricultural Work
The employment rate in rural Sulawesi increased from 91 percent in 2001 to 98 percent in
2011. Sulawesi’s rural employment rate in 2011 is similar to the region’s overall employment
rate but higher than its urban employment rate and Indonesia’s national employment.
Recent trend shows a declining gap between rural and urban employment rate with only 3
percent difference in 2011. The convergence of urban and rural employment rates in
Sulawesi reflects the rapid growth of the urban economy, which now provides more jobs
than the rural economy.
Rural laborers predominantly work in the agricultural sector. In 2011, around 60 percent of
rural workforce was employed in agriculture. The number of people employed in this sector,
however, was getting smaller in the higher quintiles. Within the same year, there was
around 77 percent of rural workforce in the lowest quintile that worked in agriculture
compared to 37 percent in the highest quintile. This composition reflects the positive
relationship between rural non‐agricultural employment and welfare as indicated by the
household consumption per capita.
Even though the majority of rural employment is in the agricultural sector, rural household
income is predominantly sourced from non‐agricultural activities. According to the 2011
Susenas household survey, approximately 55 percent of total primary household income in
rural Sulawesi is from non‐agricultural sectors. On average, non‐agricultural activities
contribute to 42 percent of individual household income (Susenas, 2011). According to the
2007 IFLS survey, non‐agricultural activities contribute to 67 percent of total rural household
income (revenue from primary sources and secondary sources such as rent) in South
Sulawesi. The average proportion of non‐agricultural income per individual household in
South Sulawesi is 54 percent (IFLS, 2007).
An increase in the share of non‐agricultural income correlates with higher consumption.
According to the 2007 IFLS survey of South Sulawesi households, households in the highest
consumption quintile source approximately 79 percent of its income from non‐agricultural
activities. Conversely, households in the lowest consumption quintile source only 44 percent
of its income from non‐agricultural sectors. Income from non‐agricultural wage and self‐
employment makes up the largest portion of non‐agricultural income across quintiles.
Meanwhile, income from transfers and other non‐labor sources in most quintiles is a
relatively small contributor to rural income in South Sulawesi.
Average non‐agricultural wages is almost twice the average agricultural sector wages. In
2011, average rural non‐agricultural wage was Rp 1,380,301 per month, significantly higher
than rural agricultural wages of Rp 763,391 per month. Non‐agricultural sectors’ higher
income is probably the main reason that the rural labor force in Sulawesi is shifting from
agricultural to non‐agricultural activities. In 2001‐11, the proportion of households in the
highest consumption quintile that derive their income from non‐agricultural employment
increased by 21 percent whereas it only increased by 10 percent in the lowest quintile. This
labor shift itself was largely led by young workers aged between 15 to 44 years old (87
percent). In addition to wage and income, other factors that may push rural laborers to shift
to non‐agricultural activities include land constraints, high risk associated with farming, and
weak financial systems to support those in the agriculture sector.

The
prov
prim
sect
adm
serv
soci
pub
With
prod
agric
Labo
mon
labo
this
inco
prod
is R
prod
Rp
mon
inclu
busi
606,
The
wor
high
perc
agric
30 p
rest
in t
emp
A la
und
was
why
prod
emp
emp
24 Ave
majority o
vision of soc
mary income
tor with a
ministration,
vice activities
al services,
lic administr
6.3. Profile
hin the non
ductivity an
cultural em
orers workin
nthly wage e
orers in eac
definition,
ome of tho
ductivity no
Rp 306,548 p
ductivity non
1,818,300
nthly agricult
uding sel
inesses and
,608 per mo
majority
rkers in rural
h‐productivit
cent of tho
cultural sect
percent of t
aurants, and
he high‐pro
ployed.
arge propo
eremployed
discussed p
y workers ar
ductivity wo
ployed in hig
ployment is
erage monthly wa
of primary i
cial services.
in non‐agric
share of 1
education,
s, and privat
almost half
ration.
of Rural Non
n‐agricultura
d low prod
ployment in
ng in in low‐p
earned by a
ch province
the average
ose working
on‐agricultura
per month
n‐agricultura
per month.
tural sector
f‐employed,
family work
nth.
of non‐ag
l Sulawesi w
ty sector. In
ose working
tors as their
this group w
d hotels and
ductivity se
rtion of w
d and engage
previously in
re also invol
orkers work
gh‐productiv
higher in low
age in agriculture
income in r
In 2011, so
cultural rura
14.2 percen
health and s
te household
comes from
n‐Agricultura
al sector, w
ductivity em
nto low‐ an
productive em
gricultural
.24 Under
e monthly
g in low‐
al sectors
and high‐
al sector is
. Average
income—
home
ers—is Rp
gricultural
work in the
n 2011, 54
g in non‐
main occup
worked in so
15 percent w
gment work
workers in t
ed in second
which risk a
ved in non‐
less than 3
vity jobs. Th
w‐productivi
e is Rp 604,900.
60
rural non‐ag
cial services
al Sulawesi, f
nt. The soc
social work,
ds with emp
m education
al Workers
wages differ
mployment.
nd high‐pro
mployment a
pation were
ocial services
worked in co
ked as emp
the low‐pro
dary jobs. T
and insecuri
‐agricultural
35 per wee
e proportio
ity sector co
Figure 6.p
Source: Worl
4,6 5
0
10
20
30
40
Perc
ent
Low-High-
gricultural s
sector cont
followed by
cial services
other comm
loyed person
n and more
r significant
Elbers and
ductivity no
are those tha
in high‐prod
s, another 2
onstruction. A
loyees and
oductivity n
This fact align
ty in agricul
activities. A
k, compared
n of worker
ompared to t
1. Share of emproductivity w
d Bank staff ca
16,4
0,2
,9
10,4
0,5
Productivity-Productivity
sector is de
ributed 43.5
trade, resta
sector con
munity, soci
ns. Of the 43
than one‐th
tly between
Lanjouw (20
on‐agricultur
at earn less t
ductivity jobs
25 percent w
Around half o
another qu
non‐agricultu
ns with the
ture are par
Around 36.1
d to 19.4 p
rs participati
the high‐pro
mployment inwork by secto
lculations from
6,7
36,2
5
15,1
25,5
erived from
5 percent of
aurant, and h
nsists of p
ial, and pers
3.5 percent f
hird comes f
n those in
001) divide
ral employm
than the ave
s. Approxim
worked in tr
of those wo
uarter were
ural sector
push factor
rt of the rea
percent of
percent of t
ing in secon
oductivity se
n low‐ and higor, 2011
m Susenas data,
6,3
0,2
2
11,0
1,1
the
total
hotel
ublic
sonal
from
from
high
non‐
ment.
erage
ately
rade,
rking
self‐
are
that
asons
low‐
hose
ndary
ctor.
gh‐
BPS.
29,330,5

61
The proportion of workers who have engaged in secondary employment but are still
underemployed is also higher for low‐productivity sector (5.6 percent) compared to high‐
productivity sector (3.2 percent).
The majority of those engaged in high‐productivity rural non‐agricultural employment is
male and tend to be in smaller households. Over three quarters of those working in high‐
productivity jobs were men while 58 percent of workers in low‐productivity jobs were
women. More than half of the workers in the high‐productivity group were in households
with four or fewer members.
People working in high‐productivity non‐agricultural sectors have higher education and
more experience. About 44 percent of workers in the high‐productivity segment completed
at least senior secondary education, averaging 9.8 years of schooling. In comparison, only
11.2 percent of those primarily employed in agriculture and 30.5 percent of those engaged
in low‐productivity non‐agricultural activities have finished senior secondary school.
Furthermore, 73 percent of workers in high‐productivity sectors are above 30 years of age
suggesting that experience is important in gaining employment in higher‐productive sectors.
In comparison, low‐productive sector workers are younger: only 42 percent of workers in
low‐productivity sectors are over 30 years of age.
Workers in the rural non‐agricultural sectors (non‐employers) have better access to credit
and capital than people working in agriculture. About 19.0 percent of workers in high‐
productivity non‐agricultural and 17.6 percent of workers in low‐productivity non‐
agricultural employment or a member of their household have received credit. In
comparison, only 9.8 percent of agricultural workers have received credit. Furthermore,
approximately two‐thirds of high‐ and low‐productivity workers reside in areas that have
non‐agricultural revolving loan fund schemes.
People working in high‐productivity non‐agricultural jobs have good access to
infrastructure. Around 72.7 percent of high‐productivity workers reside in areas with decent
or good condition roads and 40.9 percent live within 15 km of a district capital. Nearly one‐
third live in areas that are both within 15 km of a district capital and have access to decent
or good condition roads, significantly higher than those working in low‐productivity jobs (26
percent) and agriculture (15 percent).
Age, gender, education level, poverty, and health are factors that influence whether a
person is likely to work in rural non‐agricultural sectors and whether they are likely to be
employed in high‐productivity or low‐productivity sectors. A 1.0 percent increase in the
mean age of the rural population decreases the share of rural non‐agricultural employment
by 0.7‐0.8 percent. A 1.0 percent increase in the share of adults with at least senior
secondary education correlates to a 0.9 percent increase in the level of rural non‐agricultural
employment and in rural high productivity non‐agricultural employment. Lower poverty and
morbidity rates also correspond to a higher share of rural non‐agricultural and high‐
productivity sector employment.
Workers with better access to good quality roads are more likely to be employed in rural
non‐agricultural sectors. Workers that reside closer to district capitals are more likely to
be employed in high‐productivity rural non‐agricultural sectors. A 1.0 percent increase in

62
the share of villages with decent or good roads increases rural non‐agricultural employment
by 0.2 percentage points. This trend suggests that high‐productivity employment
opportunities are connected to urban areas such as district capitals.
6.4. The Relationship between Rural Non‐Agricultural Employment and Poverty and
Inequality
Non‐agricultural workers have higher consumption than agricultural workers. The average
agricultural wage laborer spends Rp 376,914 per month, or roughly two‐thirds of the
average monthly expenditure by their non‐agricultural counterparts (Rp 560,430). The per
capita expenditure is also higher for low‐productivity non‐agricultural workers.
A smaller proportion of non‐agricultural workers in rural Sulawesi are poor. In 2011, about
13.8 percent of agricultural workers in rural Sulawesi lived below the poverty line. In
comparison, only 6.6 percent of workers employed in the non‐agricultural sector are poor.
Although the overall rate of poverty amongst non‐agricultural sector workers is lower than
agricultural workers, there are specific non‐agricultural sectors have very high poverty. For
instance, 16 percent of self‐employed people working in the mining sector are living in
poverty. The non‐agricultural sectors with the highest poverty levels are manufacturing
(12.3 percent) and construction (10.9 percent).
Income inequality is higher amongst households with primarily non‐agricultural sources of
revenue. Although 55 percent of primary household income in rural Sulawesi is derived
from non‐agricultural activities, the distribution of that income is less equal than agricultural
income. The Gini (Gk) coefficient that measures inequality – a higher Gini coefficient
indicates greater inequality – is higher for non‐agricultural income (0.7551) than agricultural
income (0.658). Several studies that analysed Sulawesi’s Gini decomposition by income
source (Rao, 1969; Lerman and Yitzhaki, 1985; Podder, 1993) indicate that income from
primarily non‐agricultural employment accounts for 68.4 percent of total inequality in rural
Sulawesi, and that a 1.0 percent increase in non‐agricultural sources of income will increase
overall inequality by 0.13 percentages points.
Table 6.1. Results of Gini decomposition by income source in rural Sulawesi, 2011
Agriculture Non‐
agricultural
Total
Share of total rural household primary income (Sk) 0.45 0.55 1.00
Gini coefficient (Gk) 0.66 0.76 0.50
Gini correlation (Rk) 0.53 0.82 1.00
Contribution to overall Gini coefficient (Sk*Gk*Rk) 0.16 0.34 0.50
% Contribution to overall Gini coefficient
(Sk*Gk*Rk/G)
31.6% 68.4% 100%
Marginal Effect (% Change in Gini from a % change
in income source) (Sk*Gk*Rk/G‐Sk)
‐0.13 0.13 0
Source: World Bank staff calculations from Susenas, BPS.
Inequality in consumption has also increased amongst households with primarily non‐
agricultural sources of revenue. Although per capita monthly consumption for all non‐

agric
Incid
cons
20th
whic
Ineq
thos
the
(incl
high
The
per
betw
sect
cultural sec
dence Curve
sumption. Th
percentile i
ch only incre
Figure 6.2. G
quality, mea
se employed
distribution
ludes self‐em
her inequalit
existence o
capita hous
ween Rp 389
tor househol
ctor workers
e (GIC) indic
he real per c
ncreased by
eased by 2 pe
IC of per capi
Sourc
asured by co
d in other se
n of per ca
mployment)
ty for non‐ag
of higher ine
sehold cons
9,187 for con
ds.
s increased
ates that th
capita consu
y 6 percent,
ercent.
ta consumptiper
ce: World Bank
onsumption,
ctors. The cu
pita consum
is around R
gricultural se
quality in th
umption wit
nstruction se
63
between
he richer per
mption of n
significantly
ion for non‐agrcentile, 2001
staff calculatio
, amongst n
umulative di
mption of p
p 300,000 is
ectors in com
he non‐agricu
thin the no
ector househ
2001‐11, th
rcentiles exp
on‐agricultu
higher than
gricultural wo1‐11
ns from Susena
non‐agricultu
stribution gr
people in n
s larger for h
mparison to
ultural secto
n‐agricultura
holds to Rp 6
he upward
perienced gr
ral sector wo
n the bottom
orkers in rural
as, BPS
ural worker
raph in Figur
on‐agricultu
higher perce
agricultural
or is consiste
al sector va
671,902 for f
sloping Gro
reater growt
orkers in the
m 40th percen
l Sulawesi, by
rs is higher
re 6.4 shows
ral employm
entiles, refle
l sector wor
ent that mon
aries significa
financial serv
owth
th in
e top
ntile,
y
than
that
ment
cting
kers.
nthly
antly
vices

Fig
Sula
On a
Bali
Sula
almo
anot
prov
busi
in G
The
wer
MSI
MSI
Sula
perc
male
perc
only
gure 6.3. CDF
6.5. Profile
awesi has the
average, the
has the hig
awesi, 20.7 i
ost half of t
ther 44 perc
vinces in Sul
inesses per 1
orontalo, 22
majority of
e owned by
s in rural Sul
s are located
awesi. Moreo
cent less tha
es. Roughly
cent had jun
y 1.2 percent
of per capita
Source
of Rural Non
e second hig
re were 20.9
ghest numbe
n Sumatra,
these rural b
cent made u
lawesi, Sout
1,000 people
2.4 in South S
f micro and
y males and
lawesi are m
d in South S
over, 55 per
an 5 years ol
two‐thirds o
nior seconda
t of MSI own
consumption
e: World Bank s
n‐Agriculture
ghest numbe
9 rural busin
er of busines
19.3 in Kalim
businesses a
p of small a
heast Sulaw
e, followed b
Sulawesi and
small indus
had been op
micro‐sized an
Sulawesi, wh
cent of MSIs
d. Around 5
of rural MSIs
ary educatio
ers had terti
64
n across rural
staff calculation
e Enterprise
er of rural bu
esses per 10
sses with 24
mantan and
are small con
nd micro ind
wesi has the
by 24.6 in We
d 18.9 in Cen
stries (MSIs)
perating for
nd 91.5 perc
hile a further
s had been o
53 percent o
s owners ha
n, 15 percen
iary educatio
employment
ns from Susena
es in Sulawes
usinesses pe
000 people in
4.9 per 100
17.8 in eas
nvenience st
dustries (MS
highest rura
est Sulawesi,
ntral Sulawes
) in rural Su
less than 15
cent are prop
r 20.6 perce
operating fo
f MSIs in rur
ad primary e
nt had senio
on.
types in rura
s, BPS.
si
er 1,000 peop
n Indonesia i
people; follo
stern Indone
tores (toko
SIs) at (44.3 p
al business d
24.5 in Nort
si.
ulawesi that
5 years. Abo
prietorships.
nt are situat
r less than 1
ral Sulawesi
education or
or secondary
al Sulawesi, 20
ple in Indon
in 2011. Java
owed by 23
esia. In Sulaw
kelontong),
percent). Am
density with
th Sulawesi,
existed in 2
out 93 perce
Forty perce
ted in South
15 years, wit
were heade
r lower, whil
y education,
011
esia.
a and
.8 in
wesi,
with
mong
33.1
24.1
2011
nt of
nt of
heast
th 19
ed by
le 15
and

65
Figure 6.4. Distribution of MSIs in rural Sulawesi by age of enterprise, 2011
Figure 6.5. Gender breakdown of rural MSI owner in Sulawesi, by province, 2011
Source: WB Staff estimation from Survei Industri Mikro dan Kecil, Quarter 1, 2011
The food industry is the dominant MSI sector. Approximately 42 percent of MSIs were in
the food sector, with a further 24 percent in the wood products sector and 12 percent in the
textiles sector.
6.6. Constraints to Rural Non‐Agriculture Micro and Small Industries Operation
The majority of rural micro and small industries (MSIs) in Sulawesi faces operational
constraints, particularly in accessing capital and raw materials. In 2011, about 82 percent
of rural MSIs in Sulawesi said they faced constraints in their operations. According to Micro
and Small Industry (MSI) survey, 39 percent said the main challenge faced was access to
capital. Approximately 28 percent of respondents said raw materials was their main
constraint while 19 percent said that marketing of products was the MSI’s main problem.
The scale of the industry influenced the type of constraints faced: capital was the major
constraint faced by micro industries (40 percent), small industries identified raw materials
(28.7 percent) and marketing (27.4 percent) as their main constraints.
19,018,0 18,1
11,410,3
7,3 7,2
3,93,2
0,9 0,5 0,3 0,10
5
10
15
20
0- 5- 10- 15- 20- 25- 30- 35- 40- 45- 50- 55- 100-
Perc
ent
Age of Micro/Small Industries
26,735,5
48,5 50,8 56,669,2
46,7
73,364,5
51,5 49,2 43,430,8
53,3
0
10
20
30
40
50
60
70
80
90
100
Perc
ent
Female Male

66
Figure 6.6. Breakdown of main constraints faced by MSIs in rural Sulawesi, by province, 2011
Figure 6.7. Breakdown of main constraints faced by MSIs in rural Sulawesi, by scale, 2011
Source: WB Staff estimation from Survei Industri Mikro dan Kecil, Quarter 1, 2011
Most rural MSIs are financed solely from the owner’s personal resources. Only one‐fifth of
rural MSIs in Sulawesi utilize external or borrowed resources. Debt represents on average
55.2 percent of the MSIs’ total capital, for those that borrow. Micro industries heavily rely
on of personal loans (40.9 percent), while most small industries borrow from banks (54.8
percent). Over half of MSIs who had never borrowed from a bank stated that they were not
interested (52.2 percent); around 16 percent said they did not have the knowledge
regarding the procedures and over 15 percent said they did not have the collateral.
Poor infrastructure may exacerbate the problems faced by rural MSIs in Sulawesi.
According to the Local Economic Governance survey by KPPOD (Regional Autonomy Watch),
which surveyed small to large enterprises in both urban and rural areas, infrastructure was
ranked amongst the top three obstacles faced by 46.5 percent of sampled business entities
in North Sulawesi, South Sulawesi and Gorontalo (2007), and by 76.2 percent of sampled
business entities in West, Central, and Southeast Sulawesi (2010). In West, Central, and
Southeast Sulawesi, 28.5 percent of sampled firms have access to poor quality roads, while
17.0 percent experienced frequent power outages. The lack of, or inadequate supply of
street lighting and water were also common problems experienced by firms in both rural
and urban areas in 2010. Such inadequacies in infrastructure, particularly those related to
poor quality roads, may contribute to the marketing and transportation difficulties faced by
many rural MSIs in 2011.
Poor local governance may also adversely affect rural MSI operations. According to the
KPPOD, one quarter of firms sampled in North Sulawesi, South Sulawesi and Gorontalo in
2007 and half of the firms sampled in West, Central, and Southeast Sulawesi in 2010
considered their interaction with the local government to be among the top three problems
they faced. Other key constraints identified by the KPPOD were related to land availability,
business licenses, and transaction costs.
6.7. Potential Policy Options
Developing rural economic centers by strengthening rural non‐agricultural enterprises is a
key policy priority for developing the rural economy in Sulawesi. Low‐productivity non‐
agricultural activities are currently performed in more remote locations, while high
0
20
40
60
80
100
Percent
Ability to pay wages Capital Fuel/Energy
Marketing Raw materials Transportation
Worker skills Others
0
20
40
60
80
100
Micro Small
Perc
ent
Ability to pay wages Capital Fuel/EnergyMarketing Raw materials TransportationWorker skills Others
67
productivity activities tend to be located in areas closer to urban areas such as district
capitals. Sulawesi therefore needs to develop viable and vibrant rural economic centers by
strengthening and developing rural non‐agriculture enterprises to absorb agricultural labor
surplus in the rural area itself. At the same time, the regions need to build better
connectivity to larger markets or urban areas, which, could become alternative sources of
rural employment. Improved connectivity may encourage short‐distance commuting instead
of mass migration of the workforce to urban areas. 25
Improving infrastructure to facilitate mobility and connectivity should become Sulawesi
governments’ key task. Existing empirical evidence shows that the availability of
infrastructure has a strong association with high‐income non‐agricultural employment. Need
for rural infrastructure development is further discussed in Chapter 9.
Improving human capital such as education and skills is also critical. The rural employment
rate in Sulawesi is already high at 98 percent, thus policies need to focus on the quality of
the employment available. In order for rural workers to access high‐productive employment
opportunities, their education and skills levels must improve. Moreover, income generating
initiatives also need to focus on women who are disproportionately working in low‐
productive non‐agricultural sectors. Governments, therefore, need to establish learning
centers to provide relevant hands‐on training for rural communities. Formal vocational
training or pre‐employment programs may also help those leaving secondary school. Local
governments can also provide incentive programs such as developing employment
guarantee programs with rural businesses to attract more young people into the non‐
agricultural sector upon completing their education.
Strengthening the links between agricultural and non‐agricultural activities needs to
continue. Agro‐processing is one approach for promoting links between agricultural and
non‐agricultural activities in Sulawesi. In this context, local governments need to strengthen
their role in creating an enabling environment for rural enterprise participation, promoting
competition among enterprises, and providing access to rural finance such as rural
cooperatives, rural banks, and micro‐credit institutions.
25 Local governments in the provinces of Zhejiang in China have played an important role in fostering inclusive development,
creating markets to improve connectivity with global networks. Through his report Hamaguchi (2008) indicates that Zhejiang province, originally a poor region not only due to its agricultural conditions, but because of a lack of infrastructure, is now known for the strong entrepreneurship of its small‐ and medium‐sized local firms. The economy was gradually developed around light industries, the production of which was distributed by travelling merchants of local origin. As these industries grew, the local government established huge wholesale markets to sell their manufactured goods. These markets attracted large numbers of retailers, both domestic and foreign, seeking low price merchandise. Producers of similar products from other parts of China are now increasingly dependent on Zhejiang’s wholesale markets. As a consequence, local clusters of firms in Zhejiang have developed and diversified.


Chapter 7Promote Greater Inclusiveness in the Extractive Industries in
Sulawesi

70
As identified in Chapter 4, the extractive industries (EI) have played an important role in
Sulawesi’s fast economic growth over the past decade. Despite EI’s importance to Sulawesi,
however, its growth has not always translated into real benefits to the island’s communities.
Although EI is responsible for approximately 6.8 percent of the island’s gross regional
domestic product (GRDP) in 2013, it only employs 1.76 percent of Sulawesi’s work force.
Moreover, the economic multiplier effect of EI is relatively low compared to other sectors.
A key priority for Sulawesi is to ensure that Sulawesi maximizes the economic benefit from
the EI and to ensure that its development is inclusive. This chapter provides a
comprehensive analysis of the extractive industries in Sulawesi. This chapter describes the
main activities within EI and its various contributions to the economy including employment,
revenue, and human development. This chapter also assesses the risks of having a large EI
and proposes recommendations on how to improvement the industry’s inclusiveness in
Sulawesi.
7.1. Description of Extractive Industries in Sulawesi
Sulawesi has substantial natural resources: it is one of the world’s key nickel producers
and a small producer of gold and oil and gas. The majority of Indonesia’s nickel mining
operations and a substantial portion of Indonesia’s ferro‐nickel production capability is in
Sulawesi. In addition to nickel, gold mining and natural gas extraction are also growing
industries for the region. Artisanal and small‐scale mining (ASM) operations, particularly
gold, employ a significant numbers of local workers.
Several Sulawesi districts have long‐term large‐scale nickel mining operations. Nickel price
rises in 2002‐2008 attracted new operators to Sulawesi. Furthermore, domestic companies
increased their investment, particularly from PT Aneka Tambang (Antam). Antam is
Indonesia’s main state‐owned mining company and has been growing quickly over the past
decade. Antam mines nickel ore for export and produces ferro‐nickel in a smelter that the
company has been operating in Sulawesi since 1973. Antam shares many similarities with
nickel producer PT Vale because both are state‐owned companies aiming to modernize and
internationalize their operations.

71
Table 7.1. Extractive industry production and revenue estimates, 2011
Commodity/Producer /Units Production Revenue (US$)
Nickel1 (t) 219,900 4,041,843,000
PT Antam2 (t) 56% 2,250,408,000
PT Vale (t) 30% 1,242,555,000
Other companies 14% 548,880,000
Gold (oz) 202,579 339,319,825
PT Tokatindung (oz) 79% 268,000,000
PT Lanut ‐ J Resources (oz) 21% 71,319,825
Artisanal / Small‐scale Unknown Unknown
Oil & Gas
Donggi Senoro ‐ Associated gas fields (mt)
2 TBA
Sengkang ‐ Energy World Corp (MW) 315 TBA
Total 4,381,162,825
Source: World Bank staff estimates (includes new supply from Donggi Senoro and
Tokatindung); Annual reports and forecasts. 1. Estimates only include companies with
available annual reports 2. State‐controlled company
Indonesia is the world’s largest
Nickel producer and Sulawesi
accounts for most of the
country’s production. Indonesia
produces 17.7 percent of the
world’s nickel, estimated at
294,000 tons, most of which
comes from Sulawesi. Two large
Sulawesi operators, Antam and
Vale, produce 65 percent of
Indonesia’s nickel output.
Antam is Indonesia’s largest
nickel producer and its nickel
operations are all in Sulawesi.
Antam produces approximately 30 percent (or 123,000 tons) of Indonesia’s total nickel
production. Some of Antam’s nickel is exported as high‐ and low‐ grade concentrate. Some
of the nickel is used in its own smelters to produce ferro‐nickel. PT Vale is Sulawesi’s second
largest producer with an annual production of 67,000 tons.
Sulawesi has attracted attention for the region’s potential to extract other resources, such
as gold and natural gas, but is limited by regulatory uncertainty. Gold mining remains
relatively small. According to official statistics, Sulawesi only produced 6 tons of gold from
two mines. Gold exploration has been limited in recent years by risks associated with
uncertainty in the policy and regulatory framework. There has also been significant interest
in Sulawesi’s potential to generate liquefied natural gas (LNG). Although exploration activity
has increased, Sulawesi is not considered an important driver of LNG growth in Indonesia.
Figure 7.1. Nickel production, 2011
Source: World Bank estimates, Annual Reports, Survey Data, BOIC,
AusAID, London Metal Exchange.
66.900 123.000 104.100 294.000
1.660.000
- 200.000 400.000 600.000 800.000
1.000.000 1.200.000 1.400.000 1.600.000 1.800.000
PT Vale(Sulawesi)
PT Antam(Sulawesi)
Others(Sulawesi,
Halmahera)
Indonesia World
Tons
con
tain
ed N
i Met
al

72
7.2. The Opportunities and Dangers of Resource Growth
Policy makers regulating the extractive industries (EI) face the ‘resource paradox’ challenge,
whereby a region is well‐endowed with natural resources but fails to leverage those
resources into long‐term inclusive development.26 One potential cause of the “resource
paradox” is the so‐called ‘Dutch disease’, where reliance on a booming natural resource
sector may make other sectors such as manufacturing less competitive. Apart from ‘Dutch
disease’, other reasons for the resource paradox include potential corrosive impact of
natural resources on institutions and governance standards including removing incentives
for reforms and encouraging rent‐seeking.
The Indonesian government needs to both maximize the economic benefits of EIs and
leverage these benefits for sustainable inclusive development. The government faces two
challenges in achieving the two goals. First, it needs to ensure that benefits from natural
resource development are not being offset by costs associated with potential negative
socioeconomic impacts. Second, resource operations are often a source of community
dissatisfaction because of debate over the distribution of benefits from EI. It is critical
therefore to align private and public investments and use EI resources to reduce poverty and
maximize the benefits for the communities.
The main risk associated with natural resource based growth is the ‘Dutch disease’.
Typically, ‘Dutch disease’ has two effects:
Spending effect: a booming resource sector draws in foreign currency and causes
domestic consumption (private and public) to increase, increasing the prices of non‐
tradable goods. This may cause real exchange rate to appreciate, which in turn may
reduce the competitiveness of other sectors.
Resource movement effect: labor and capital are drawn to the resource sectors and
away from other sectors, resulting in the shrinking of those sectors.
There is no evidence that the spending effect is taking place in Sulawesi because the cost
of inputs for construction—a non‐tradable sector—is not higher in EI‐intensive districts27.
To test whether a spending effect exists, the research team conducted a regression analysis
comparing the size of the extractive industries in each district in Sulawesi (proportion of
total district GRDP generated by EI) against the local price level of non‐tradable goods
(construction price index). The construction price index is used as the proxy for the price of
on‐tradable goods because the cost of construction is a function of local wage levels and the
price of inputs. A spending effect exists when local wages and the price of other inputs
increase in districts that have higher EI activity. The regression analysis found no statistically
significant correlation between each district’s share of GRDP generated by EI and
construction prices.
There is also no evidence a resource movement effect exists in Sulawesi because
manufacturing sector employment has not decreased in areas where EI dominates the
26 See for example Rents to Riches: The Political Economy of Natural Resource Led Development, World Bank 2012
27 The following equation is used to test the spending effect in Sulawesi
, , , , Where Smining is share of mining GRDP for district i at time t, IKK is construction cost index. The result shows that inflation is not affected by share of mining GDP, but it is affected by construction cost index last year as well as by the dummy variables.

73
district’s economy. To test whether a resource movement effect exists, this study
conducted a regression analysis comparing the size of the extractive industry (proportion of
total district GRDP generated by EI) and changes in the share of workers employed by the
manufacturing sector. A resource movement effect exists if a district with a large share of
GRPD generated by EI (that is, the economy that is dominated by EI) has a smaller share of
its labor force working in the manufacturing sector. If this phenomenon exists, it suggests
that labor is moving to the extractive industries away from manufacturing. The regression
analysis found no statistically significant correlation between Sulawesi districts’ share of
mining GDP and the change in the share of manufacturing employment growth28 (Table 7.2).
Table 7.2. Dutch Disease Panel Regression
VARIABLES
Inflation Changes in share
of employment
Standard errors in
parentheses
Lag 1 of construction cost index ‐0.235*** *** p<0.01, **
p<0.05, * p<0.1
(0.04)
Share of mining GDP ‐0.0274 ‐0.0389
(0.13) (0.16)
2007b.year 0 0
0.00 0.00
2008.year 10.65*** 0.582*
(0.75) (0.32)
2009.year 10.05*** 1.169***
(1.92) (0.32)
Lag 1 of log employment ‐4.062***
(0.43)
Constant 46.82*** 31.81***
(5.84) (3.52)
Observations 190 200
R‐squared 0.902 0.508
Number of districts 68 69
Source: World Bank Staff calculations.
7.3. Economic Contribution of Extractive Industries
Extractive industries’ direct contribution to Sulawesi’s GDP growth, volatility, and
inequality
In 2011, extractive industries (mining and quarrying) accounted for 6.3 percent of
Sulawesi’s GDP and between 4.8 and 7.6 percent of GDP in four provinces: North, Central,
Southeast and South Sulawesi. The sector’s contribution to Sulawesi’s economy was
relatively stable in 2000‐11, going from 7.0 percent to 6.3 percent of Sulawesi’s GDP. At the
national level, mining and quarrying represented 7.4 percent of GDP in 2011, in real terms.
While important in North, Central, Southeast and South Sulawesi, EIs are marginal in West
28 To test the resource movement effect, the model employed is
, , , , Where EM is employment from non‐EI to EI districts, employment is defined as share of labor force employed in manufacturing.

Sula
may
The
cont
perc
such
sect
likel
susc
Grow
rece
grow
35
depe
from
auth
has
distr
2000
Emp
Desp
extr
1.76
The
wor
still
extr
thes
stem
the
plac
Info
extr
emp
abso
sect
mor
awesi and Go
y change this
overall EI se
tribution wa
cent of grow
h as Antam
tor’s contribu
y to be les
ceptible to th
wth in the e
ent years. Ho
wth. Central
percent in
endent on t
m its collapse
hority to loca
been a prol
ricts with a
0‐10, althoug
ployment in
pite an over
ractive secto
6 percent of
share of ex
kers in Sulaw
stands
ractive prod
se differenc
m from the
mining se
ces.
ormality d
ractive secto
ployment in
orbing only
tor increased
re formal EI w
orontalo, alt
s.
ector contrib
as highest in
wth, respecti
and PT Vale
ution to grow
ss significant
he downturn
extractive se
owever, dist
and Southe
2011. Extra
the world ni
e. Growth in
al governme
iferation of
higher share
gh the assoc
the extract
rall increase,
or remains lo
f the labor f
xtractive ind
wesi has rise
below o
ducing provi
ces are like
different siz
ectors in t
dominates
or, with mor
Sulawesi w
1.8 percent
d from 0.51 p
workers. How
though proje
bution to rea
n Central and
ively. This p
e in these lo
wth remain
t. Marginal
n in nickel pri
ctor has bee
tricts more r
east Sulawes
active secto
ckel price: t
2010‐11 ma
nts in 2009.
new entran
e of mining
ciation is wea
tive industrie
, the share o
ow at
force.
dustry
n but
other
nces;
ly to
zes of
these
the
re than half
as 94.7 perc
age points o
percent in 20
wever, this n
74
ects current
al growth in
d Southeast
ossibly refle
ocations. Ot
small or dec
producers
ices post‐glo
en accelerati
reliant on EI
i saw mining
r growth in
the relative
ay be linked
Both provin
ts in the nic
GDP tended
ak.
es
of workers in
f the sector’
cent of the
of the total.
010 to 0.96 p
number is sti
Figure 7.2. S
Source:
ly under dev
2001‐11 wa
Sulawesi, a
ects the impa
ther provinc
cline. Minera
may also b
obal financial
ing in Centra
Is are more
g sector grow
n these two
slowdown in
to the decis
nces are hom
ckel sector s
d to experie
n the
s workers b
labor force
. The numbe
percent in 20
ll lower than
Share of work
BPS Sakernas, W
velopment in
s 6.0 percen
accounting fo
act of stable
es have see
al reserves in
be more pri
crisis.
al and South
likely to exp
wth accelera
o provinces
n 2008‐09 p
ion to grant
me to nickel m
ince 2009.
nce more vo
being in info
in 2012, wi
er of forma
012, correspo
n that of info
ers in the ext
World Bank cal
n West Sula
nt in Sulawes
or 25.0 and
e large produ
en the extra
n these area
ce‐sensitive
heast Sulawe
perience vol
ate to more
appears to
probably resu
mining licen
mining and t
Across Sulaw
olatile grow
ormal jobs. T
ith the EI se
l workers in
onding to 37
ormal worker
tractive secto
culations.
awesi
si; its
27.6
ucers
ctive
s are
and
esi in
latile
than
o be
ulted
nsing
there
wesi,
th in
Total
ector
n the
7,000
rs.
r

75
Table 7.3. Employment in the extractive sector in Sulawesi, 2012 SAKERNAS (% of labor force)
Sulawesi North Sulawesi
Central Sulawesi
South Sulawesi
Southeast Sulawesi
Gorontalo
West Sulawesi
Formal EI sector workers
0.96% 1.46% 1.37% 0.54% 1.71% 1.23% 0.21%
Informal EI sector workers
0.80% 1.37% 1.09% 0.17% 1.34% 2.78% 0.47%
Total EI Workers 1.76% 2.82% 2.46% 0.71% 3.06% 4.01% 0.68%
Total labor force 8,109,732 1,060,969 1,279,717 3,657,419 1,043,390 479,702 588,535
SUSENAS
Female workers (% of Labor Force)
0.09% 0.04% 0.10% 0.04% 0.24% 0.16% 0.07%
Female workers (% of Total EI workers)
7.43% 2.41% 7.28% 7.93% 11.41% 6.09% 18.25%
Source: BPS Sakernas and Susenas, World Bank staff calculations.
Male workers dominate jobs in the EI sector; the sector’s workers usually have low
educational attainments. Only 7.4 percent of EI jobs go to female workers (Table 7.2).
Interviews indicate that field work (excavation, drilling, processing, security, etc.) is usually
carried out almost exclusively by men, while administrative jobs (reception, finance and
accounting, etc.) are generally carried out by women. Most of the sector’s workers are
between 15 and 45 years old, with low educational attainments: those below or at junior
high school level accounted for 71.2 percent of the total in 2012. Surveyed companies
declare favoring local employment in an effort to improve their relationship with local
governments and communities. Large companies employ local and non‐local labor (including
expatriates), while the small to medium companies generally only employ local labor.
Companies report having
difficulties finding specific skills
locally and as a result many
locals are employed in low
ranking positions. Companies
declare that the biggest obstacle
they face in employing local
people is the shortage of skills
and qualifications. The
proportion of local workforce
occupying managerial and top
positions is usually low. The local
workforce tends to be employed
as field workers, heavy equipment operators, administrative staff, catering staff, security
staff, drivers, office boys, receptionists, and in positions that do not require specific skills.
Middle to upper management positions tend to be filled by non‐local workers, these
positions include: the general manager, division heads, internal auditors, and quality
controllers.
Table 7.4. Demographic characteristics of EI workers, 2012 2008 2010 2012
<= SMP 74.0 73.7 71.2
SMU 23.4 22.7 24.7
University 2.7 3.7 4.1
Age group
15 – 30 44.7 42.1 42.7
31 – 45 39.7 41.9 42.8
46 – 60 13.3 14.2 11.8
> 60 2.3 1.8 2.7
Source: BPS Sakernas, World Bank calculations
Note: Figures are in percent

76
In order to assess the overall significance
of EIs in Sulawesi’s economy it is
necessary to study these industries’ links
with other sectors. We compute gross
outcome multipliers, which estimate the
overall economic activity generated by the
demand for EI products. This is based on
the idea that to produce Rp 1.0 worth of EI
products to meet final demand, EI
companies will use intermediate inputs
from companies that will in turn use inputs
in their production. Hence, to meet Rp 1.0
of final demand for their products, EI
companies will have to produce Rp 1.0
(initial effect), their suppliers will have to
produce the inputs they use (the first round
effect) and in turn their suppliers to produce the inputs EI suppliers use (the industrial
support effect).
The economic multiplier associated with EIs in Sulawesi is low compared with other
economic sectors, indicating an “enclave style development” for EI, with little linkages to
other economic sectors. For Rp 1.0 of final demand, EIs generate Rp 1.26 of output in
Sulawesi through production linkages, bringing EI GDP contribution from 6.3 to 7.4 percent.
Figure 7.3 presents economic multipliers for the different sectors in Sulawesi, distinguishing
between the economic activity in Sulawesi and in other parts of Indonesia. The latter are
generally low indicating that companies in Sulawesi mostly use intermediate inputs
produced on the island. The extractive sector multiplier in Sulawesi, with a value of Rp 1.26,
indicates that to satisfy Rp 1.0 of final demand the EI sector generates an extra Rp 0.26 of
output, decomposed as described below:
Rp 0.09 generated in the EI sector itself, meaning that the sector provides
intermediate inputs for itself (e.g. mining contractors doing land clearing and
preparation)
Rp 0.10 generated in the services sector (e.g. security and accounting firms working
for EI companies)
Rp 0.04 generated in the utility and construction sector (e.g. electricity purchased
for operations and construction of factory and office buildings)
The remaining Rp 0.03 is generated in oil & gas, heavy industries, and manufacturing
7.4. Fiscal Contribution of Extractive Industries
The most significant sources of revenue from EI companies are royalties, land rent, and
corporate income tax. Revenues generated by royalties and the land rent are returned to
provinces through the natural resource revenue‐sharing fund. This fund contains revenue
from EIs, as well as others, such as forestry and fisheries. However, in 2011, 96 percent of
the non‐tax revenue sharing fund came from EI revenues: the following analyses consider
Figure 7.3. Inter‐regional economic multipliers by economic sector, 2005
Source: World Bank, BPS.
1,08 1,26 1,26 1,421,68 1,73 1,78 1,79 2,03 2,08
0,00
0,50
1,00
1,50
2,00
2,50
Sulawesi multiplier Rest of Indonesia multiplier

the
the
gove
Fig
Tran
gove
acco
the
the
perc
(Rp
focu
reve
entit
reve
and
Natu
gove
havi
shar
billio
the
to y
have
An
Sula
pote
expo
expo
tota
rule
29 Est
throu
whole fund
General A
ernments, no
gure 7.4. Per
nsfers from
ernments’ r
ount natural
DAU attribut
most recen
centage poin
290 billion).
uses on non
enue, is clea
tled to mor
enue is the h
North Sulaw
ural resour
ernments’ r
ing peaked
re of the tot
on in 2011, i
nickel indust
ears where s
e been partic
estimation
awesi indica
ential from
orts for 2011
orts value ca
al royalty po
s. On this
timated “mining gh to natural res
and do not d
Allocation Fu
ot only prod
capita revenu
Source: W
the center
evenue in S
resources n
table to natu
t year for w
nts (Rp 10.7
To understa
‐tax revenue
arly attributa
re than non‐
highest are:
wesi (Rp 745,
rces non‐tax
revenue in 2
in 2007, the
al revenue a
in current te
try and high
sector growt
cularly affect
of the pote
ates that th
nickel reve
1. We use th
an be deduct
otential shou
basis, we e
DAU” is calculat
source revenue sh
disaggregate
und (DAU)
ucing district
ue (in Rp) of s
WB staff calcula
linked to E
Sulawesi in
non‐tax reve
ural resource
which data a
8 trillion) a
and the loca
e‐sharing wh
able to EI a
‐producing o
Southeast S
,670).
x revenue‐s
2011, and it
e amount of
and in value.
erms. The pe
global dema
th slowed du
ted because
ential for ni
here may b
nue‐sharing,
e 4 percent r
ted as costs
uld accrue t
estimate a
ted as 26% of thharing
77
e it. Corporat
and are t
ts, according
subnational g
ation based on M
EI revenue r
2011, or Rp
enue‐sharing
es29. This dec
are available
nd non‐tax
l impacts an
hich, even if
nd varies ac
ones. The p
Sulawesi (Rp
sharing onl
ts value ha
f non‐tax re
It went dow
eak of 2007
and for mine
uring the glo
of slowing d
ckel royaltie
be significan
, we use th
rate for roya
incurred by
to local gov
royalty pote
he mining relate
te income ta
hen redistr
g to a formul
overnments (
Ministry of Fina
represented
p 11.07 trillio
g, as well as
composition
e. Of this, D
revenue‐sha
nd significanc
f it accounts
cross district
rovinces wh
910,087), Ce
ly represen
s been decl
venue‐sharin
wn from Rp 3
corresponds
erals. The sub
obal financial
demand from
es collection
nt leakages.
he value of
alties and est
the produce
ernments ac
ential of Rp
ed net domestic
x revenues f
ibuted acro
a.
(province and
ance data.
22.0 percen
on. This me
an estimate
is presented
AU from EI
aring 0.6 pe
ce of EI reve
s for a little
ts as produc
ere the per
entral Sulaw
nted 0.6 pe
lining over t
ng has decr
385 billion in
s to the high
bsequent slu
l crisis; the n
m China.
n in Central
. To estima
nickel ore
timate that 1
ers. Finally, 8
ccording to
p 336,421 bi
revenues minus
from EI accru
oss to all
d districts), 20
nt of total
easure takes
e of the sha
d for 2011 as
represents
ercentage po
enue the ana
e share of th
cing districts
r capita EI‐li
wesi (Rp 766,
ercent of
the years. A
reased both
n 2007 to Rp
growth yea
ump corresp
nickel sector
l and South
ate the reve
and ferro‐n
10 percent o
80 percent o
revenue‐sha
illion for ni
s the funds distr
ue to
local
011
local
into
re of
s it is
21.4
oints
alysis
he EI
s are
nked
,568)
local
After
as a
p 290
rs of
onds
may
heast
enue
nickel
f the
f the
aring
ickel,
ibuted

com
for a
of m
the
in 20
Figu
Soci
welf
the
the
pock
welf
To a
at t
whe
2002
mea
and
whe
over
Incr
incre
with
perc
incre
cont
no s
the
30 Wo
mpared with t
all mining co
magnitude is
national leve
011 was not
ure 7.5. Natur
7.5. Extract
io‐economic
fare in a loc
aggregate le
mine for a s
kets of ineq
fare situation
assess the ag
he district l
ether change
2 and 2008 a
asures over t
gas), and a
ether an incr
r a period en
eases in the
eased house
h poverty red
cent increas
eases of 0.1
trolling for d
statistically s
poverty rate
orld Bank (2014),
the actual am
ommodities,
consistent w
el, between
collected30.
ral resources
tive Industrie
c impact as
calized area
evel, this usu
significant sh
quality, parti
n can be mas
ggregate im
evel we use
es in differe
are associate
the same per
ll other GRD
rease in EI a
ncompassing
three GRDP
ehold expen
duction, wh
e in agricul
11, 0.06, an
district popu
significant as
e or gap, whi
Improving Minin
mount of no
representin
with the findi
28‐51 perce
revenue‐sharof tota
Source
es and Huma
sessments
around the
ually follows
hare of their
cularly that
sked by a nu
pact of extra
ed regressio
nt gross reg
ed with chan
riod. The cat
DP compone
activity in a
g the commo
P categories
nditure. How
ile increases
ture, mining
d 0.13 perc
lation size an
ssociation be
le agricultur
g Non‐Tax Reven
78
n‐tax revenu
ng only 48 pe
ings of other
ent of potent
ring of subnatal revenue, 20
e: Ministry of F
an Developm
of various
operations
households
household i
of the histo
umber of rela
active indus
on analysis.
gional domes
ges in per ca
tegories of G
ents. The hyp
district has
odity boom (2
(agriculture
wever, increa
s in agricultu
g, and othe
cent in aver
nd the share
etween incre
e and other
nue Administratio
ue‐sharing re
ercent of the
r World Bank
tial coal non‐
tional governm005‐11
Finance
ment
mines have
improve, in
that have jo
income. Agg
oric or indig
atively highly
stries on exp
The chosen
stic product
apita househ
RDP are agri
pothesis to b
a significant
2002‐07).
, mining, an
ases in mini
ural and othe
r GRDP is r
rage househ
e of urban p
eases in min
GRDP increa
on
eceived of Rp
e nickel pote
k research es
‐tax revenue
ments in Sula
e found tha
some cases
obs with the
regate data
genous com
y paid immig
penditure lev
specificatio
(GRDP) cate
hold expendit
iculture, min
be tested w
t impact on
d other) are
ng GRDP are
er GRDP are
respectively
old per cap
opulation. H
ning GRDP an
ases are both
p 161,258 bi
ential. This o
stimating tha
e (from roya
awesi, percen
at incomes
s significantl
e mine or re
can hide se
munities, w
grants.
vels and pov
on allows to
egories betw
ture and pov
ning (includin
with this mod
these indica
e associated
e not associ
e. In a district
associated
pita expendi
However, the
nd reduction
h associated
llion,
order
at, at
lties)
tage
and
y. At
ly on
rious
hose
verty
test
ween
verty
ng oil
del is
ators
with
ated
t, a 1
with
ture,
ere is
ns of
with

79
poverty rate/gap reductions. On average, districts that experience an increase in mining
activity tend to experience larger increases in household expenditure but no faster poverty
rate reduction than they would have in the absence of mining growth.
Within EI districts,31 EI households32 have higher levels of per capita expenditure than non‐
EI households, but they have lower net enrollment rates in junior high school. Average per
capita expenditure for EI households in 2010 is Rp 482,609, while it is Rp 419,505 for other
households, indicating that people working in EI may be financially better off. Measured
human development indicators do not show any statistically significant difference across the
two groups, with the notable exception of junior high school net enrollment rate (NER). The
NER is more than 4 percentage points lower for EI households. This may be explained by the
fact that in some mining communities, especially where informal mining is important, young
people sometimes leave school early to work in the informal mining sector. This may also
explain the low educational attainments of most mining workers.
The number of illegal artisanal and small‐scale mining (ASM) miners in some areas of
Sulawesi has decreased in recent years. Not all ASM operations are illegal, as ASM miners
are allowed to apply for IPRs (people’s licenses) since the 2009 mining law. Local
governments in North Sulawesi estimate that illegal mining has decreased in recent years
thanks to ASM miners obtaining these licenses. The number of illegal gold miners in North
Sulawesi is still estimated to be around 5,000 people. Significant reduction of the number of
illegal miners has also occurred elsewhere: according to the Ministry of Mines and Energy
Resources in Southeast Sulawesi the number of illegal gold miners decreased from 2,000 in
2009 to 100‐200 people in 2012.
Interviews in North Sulawesi indicate that artisanal and small‐scale mining practices
present risks for miners, surrounding communities and the environment, especially in gold
extraction. This is independent of whether or not these ASM operations are legal. In fact,
interviews indicate that many ASM miners with an IPR license operate without
environmental permits. The environment office (Dinas) in North Sulawesi points out that
ASM miners use hazardous substances such as cyanide and mercury in their production
processes, notably for smelting. These materials are not disposed of with the necessary care,
and are often released in ponds or streams, which they contaminate and thereby affect
surrounding communities.
7.6. The Political Economy of Resource Growth and Governance Challenges
The problems linked to resource growth can also have adverse governance effects.
Research has been increasingly looking into how resource growth can hamper development
through political and governance related channels. Natural resources generate revenue
windfalls that may lessen the incentives for institutions to become more inclusive,
transparent, and efficient.
Anecdotal evidence suggests that rent‐seeking behavior may be an issue in Sulawesi and
threaten governance quality. However, it was not possible to test this hypothesis and
further research is needed. Officials have been accused by civil society organizations of 31 Defined as a district where the EI sector account for more than 5 percent of GRDP
32 An EI household is defined as a household having one or more member(s) working in the EI sector

80
misusing third‐parties donations received from EI companies.33 Such accusations could be
indicators that corruption has grown because of mining rents. In the absence of
comprehensive data on the number of cases brought to trial and their outcomes, however,
it is not possible to assess the exact magnitude of these issues.
Governance challenges: licensing and oversight of extractive companies
Adverse governance impacts may be reinforcing several institutional shortcomings in EI
oversight. Analyzing Indonesia’s mining legislation, Gandataruna and Haymon (2011) point
out that low capacity of local governments has “led to legal uncertainty, poor administrative
practices, a lack of coordination across government departments and a dramatic increase in
illegal mining activity” and that companies who lacked capabilities and experience have
been allowed to operate and export. Furthermore, they point out that the proliferation of
illegal mines, operating within the concessions of legal companies, “would only have been
possible with the support of local officials, presumably for financial reward”.
Field research34 indicates that some new small and medium size companies (IUPs) in
Sulawesi do not appear to be complying with legal obligations, or operating in a way
conducive to inclusive and sustainable development. Many new mining permits (IUPs) are
overlapping with other concessions, and some companies may be conducting mining
operations without permits. There are reports of non‐transparent practices regarding export
permits and quotas: some companies have been reported to export their product under
another company’s name to overcome export limitations. Local government agencies report
nonpayment or under‐payment of taxes and royalties. Lastly, there are reports of damaged
public roads as a result of their being used by overloaded mining companies’ trucks. Larger
companies tend to develop their own infrastructures, limiting their use of public facilities.
Sources report that some of these practices have a negative impact on communities’
livelihoods through environmental degradation. Some new entrants in Central and
Southeast Sulawesi seem to be disregarding international standards, and operate in a way
not conducive to inclusive and sustainable development. Environmental degradation caused
by these practices could cause loss of livelihoods and have adverse consequences on the
population. There are reports of sediments spilled by mining companies not operating in an
environmentally conscious way: these sediments threaten livelihoods, for instance by
destroying rice paddies and rendering fishing impossible close to the coast. If these practices
are not investigated and infringers sanctioned, livelihoods may be affected in the long term
and communities may suffer even after the mining operations close down.
These practices seem to go largely unsanctioned as a result of the limited capacity of local
governments. Gandataruna and Haymon (2011) point out that the “limited capacity of
regional governments to enforce mining regulations” and the entry of low quality investors
may lead to a rapid depletion of the country’s mineral resources and cause significant
environmental damage while generating low levels of revenue for the state.
33 For instance: “Gubernur Sultra: Sumbangan Pihak Ketiga Masuk APBD”, Kompas Kendari, February 19, 2013
34 Source: interviews conducted by World Bank and Hasanuddin University teams, Jan‐Apr 2013

81
7.7. Potential Policy Options
In order to improve the contribution of extractive industries to inclusive development in
Sulawesi, this study propose recommendations structured around four pillars. The main
recommendations are presented below. A detailed and comprehensive list of
recommendations can be found in the policy note (SDD PN 6), which also identifies the
stakeholders who could be involved in the implementation of each recommendation.
The first pillar focuses on expanding economic opportunities and mitigating adverse
impacts of EI growth today, so that the EI sector can contribute more to improving
people’s livelihoods in the short term. Targeted professional training could help local
communities acquire the professional skills needed by the EI sector and help local residents
to access better jobs. Industry‐wide corporate social responsibility best practices could be
promoted to small‐ and medium‐scale firms: for instance, by encouraging these
organizations to provide training or health facilities to communities. Trainings could be
offered to people engaging in ASM (artisanal and small‐scale mining) to reduce
environmental degradation and other health and safety risks.
Maximizing the benefit of extractive industry to the economy would be better achieved
through fiscal means, by optimizing revenue collection and improving spending patterns,
rather than through production‐side policy, such as the downstream processing
requirements. While such policy could increase forward linkages of the extractive industry,
it also creates net welfare losses at least in the medium term. A study by USAID (2013)
estimated that the net welfare losses for Indonesian economy as whole from the restriction
on unprocessed nickel could go up to USD 781 million, if the policy does not result in
additional processing investment which could happen due to low financial profitability of
investment in downstream processing. In the best case scenario when all new processing
investment become operational as expected, the net gain will only start in 2020.
Downstream processing could become economical if there is a focus on creating sustainable
competitive advantage. The relevant competitive factors are energy supply and
infrastructure rather than ore availability. Downstream processing worldwide has suffered
from declining margins as a result of a large increase in the smelting capacity in China in the
2000’s. The extent of the margin decline depends on the commodity: in the case of nickel
pig iron (NPI) and sponge iron, smelting could still possibly be economical. Building smelting
capacity in Sulawesi could make sense if the infrastructure situation improved, and the
necessary complementary factors were available. Antam’s case provides a good illustration
of the current shortage: it has been smelting nickel in Sulawesi since 1973 without grid
electricity, and to this day is still using high cost diesel generators.
The second pillar focuses on investing mineral resources rents for the future. There is a
need for broader and longer‐term programs to realize the potential benefits from EI and
mitigate the temporary nature of the revenues they generate. Such programs could address
low educational attainment, professional skills shortage and gender imbalances identified.
Setting up foundations, trusts and funds (FTFs) should be considered in Sulawesi: they could
be managed by EI companies or third parties. Lastly, a resource corridor pilot project could
be developed to showcase how resource corridor strategy could work.

82
The third pillar focuses on optimizing revenue collection. To do so, the mining office and
the revenue office (Dinas) should play a greater role in the non‐tax revenue collection
process including collection, control, and compliance. To help local governments support
non‐tax revenue collection, cooperation between government agencies should be fostered,
notably with customs on sharing export data in order to check the production figures
reported by companies. It is also important to address issues regarding the tracking of the
origin of companies’ non‐tax payments to enable a more proper revenue‐sharing to the
producing regions.
The fourth pillar focuses on improving the oversight and transparency of extractive
industries. Improving the governance of the extractive sector is key to addressing some of
the most critical issues identified, such as the proliferation of smaller actors with
detrimental mining practices. A gap assessment of the “Clean & Clear” process should be
conducted. National audit agencies (BPK, Inspectorate) should receive training and be given
mandates to conduct compliance audits of EI licensing procedures. At the subnational level,
governments should systematically address EI issues in planning documents. The
attractiveness of mining and environment inspectors’ positions should be improved, and
their capacities strengthened. Lastly, programs should be developed to increase citizens’
awareness of issues posed by EI development, an Extractive Industry Transparency Initiative
(EITI) standard which ensure full disclosure of taxes and other payments made by extractive
companies to the government should be implemented, so that ultimately citizen could push
these issues forward to their local governments.


Chapter 8Improving Access to
Basic Services for the Poor

85
As identified in Chapter 4, one of the key constraints to inclusive growth is education and
skills levels particularly amongst the poor. As identified in Chapter 6 and 7, improving
education and skills levels is key to obtaining employment opportunities in non‐agricultural
sectors, in both rural and urban areas. A key constraint to improving human capital in
Sulawesi is the effective provision of basic services, particularly health and education
services.
This chapter seeks to analyze health and education outcomes in Sulawesi and identify the
main constraints for effective service delivery, particularly in providing services for the
most the vulnerable segments of the population. This chapter also provides a set of
recommendations to improve basic service delivery in Sulawesi.
Under decentralization, sub‐national governments have primary responsibility for
managing education and health services. In education, districts are responsible for
providing primary, junior secondary, early childhood, and non‐formal education. Provinces
hold responsibility for delivering senior secondary and vocational education, while the
central government delivers tertiary education, and providing overall guidance on the level
of financial support provided for each level of education. In health, districts are responsible
for allocating resources to and managing hospitals and primary care. Provinces play a key
role in coordination, training, and provide oversight for the management of provincial‐level
hospitals.
8.1. Service Delivery Performance in Sulawesi35
This chapter first assesses and compares Sulawesi’s performance in five education and
health output indicators against the performance of four regions in Indonesia: eastern
Indonesia, Java and Bali, Kalimantan, and Sumatera. The five selected indicators are:
Net enrollment rate (NER) at junior high schools (SMP).
Net enrollment rate at senior high schools (SMA).
Share of births assisted by skilled workers.
Immunization coverage.
Utilization rate of medical facilities.
Output indicators are used in this assessment because they are more responsive to policy
changes than outcome indicators, which often only change over much longer periods of
time. For example, a successful education program can change enrollment rates (output
indicator) almost instantly, while it can take many years to effectively change the problem
solving skills of the students or the literacy rate (outcome indicators) in the region. A second
reason for using output indicators is that there is limited data measuring outcomes available
at the regional level. For instance, indicators such as standardized test scores (e.g., PISA36)
or maternal and infant mortality rates are not available at the district level.
35 The data used for this section is 2012, unless indicated otherwise.
36 Program for International Student Assessment, OECD.

86
Table 8.1. Service delivery performance indicators
Type of services Indicators Description
1. Education Net enrollment rate (NER)
in junior high schools
(SMP)
Junior high school age children who are
enrolled in junior high school as a
proportion of all junior high school
children
Net enrollment rate (NER)
in senior high schools
(SMA)
Senior high school age children who are
enrolled in senior high school as a
proportion of all senior high age children
2. Health Share of births assisted by
skilled workers
Share of total births for which one of the
following is present: doctor, midwife,
paramedic
Immunization coverage Share of children under 5 having
completed at least one of the required
immunizations (BCG, DPT, Polio, Measles,
and Hepatitis B)
Utilization rate of medical
facilities
Share of people among those sick over the
last month who have visited a formal
health facility
Source: World Bank definition based on Susenas available data.
For three of the five indicators, Sulawesi has an average performance in comparison to
other regions. For two health indicators, Sulawesi performs poorly in comparison to other
regions. Sulawesi’s NER in junior high schools (66 percent) and senior high schools (52
percent) are lower than Java and Bali and Sumatera and higher than Kalimantan and eastern
Indonesia. Immunization coverage across all five regions are similar, thus Sulawesi’s 76
percent is comparable to all other regions. Sulawesi performs more poorly on the other two
health indicators, however. With only 71 percent of births in Sulawesi assisted by skilled
workers, the region lags significantly behind other regions. In particular, Sulawesi is 17
percentage points lower than Sumatera and 15 percentage points behind Java and Bali. Only
eastern Indonesia performs worse in this indicator where a skilled worker assists only 66
percent of births. Sulawesi’s health services utilization rate is also low. At 41 percent, only
Kalimantan has a lower utilization rate.
Figure 8.1. General population ‐ Key service delivery indicators, Sulawesi and other regions, 2012
Source: Susenas, World Bank estimates.
If the analysis is restricted to the poorest 40 percent – as measured by expenditure levels –
Sulawesi performs well in the NER for senior secondary school, remains average for NER
for junior secondary school and immunization rate, and performs poorly in two health
62%
46%
66%
77%
45%
74%
53%
86%80%
47%
66%
48%
80% 77%
35%
66%
52%
71%76%
41%
71%
55%
88%
76%
45%
0%
20%
40%
60%
80%
100%
NER Junior High NER Senior High Births assisted by skilledworker
Immunization rate Utilization rate
Eastern Ind. Java/Bali Kalimantan Sulawesi Sumatera

87
output indicators. Sulawesi’s ranking amongst Indonesia’s five major regions does not
change significantly when the analysis is focused on the poorest 40 percent. Sulawesi only
improved in the NER in senior high schools where it is ranked second at 44 percent, only 5
percent behind Sumatera, which has the highest NER of 49 percent. Only 62 percent of the
poorest 40’s births were assisted by skilled health workers in Sulawesi, significantly less than
the 81 percent in Java and Bali and 83 percent in Sumatra.
Figure 8.2. Vulnerable population ‐ Key service delivery indicators, Sulawesi and other regions, 2012
Source: Susenas, World Bank estimates.
The poorest 40 have lower access to basic services than the overall population, but the
difference in access has reduced between 2001 and 2012 (figure 8.1 and 8.2). For instance,
in 2012, the NER for senior secondary education was 8.4 percentage points higher in the
overall population than in the poorest 40. For instance, Java and Bali and eastern Indonesia
both managed to achieve a greater reduction in the gap in immunization coverage and
utilization rate. The gap between the poorest 40 and the general population for the
proportion of births attended by a skilled health worker actually increased from 0.3 percent
in 2001 to 9 percent in 2012. Although the proportion of births of the poorest 40 attended
by a skilled health worker increased between 2001‐ 2012, the growth for this indicator was
faster for the general population over the same period.
Based on the five indicators assessed, the deliver of education services has seen larger
improvements than health services between 2001‐2012. The improvements in basic
services have also been pro‐poor, except for the share of births attended by skilled
workers, which has improved more slowly for the poorest 40 than the general population.
The senior high school NER improved dramatically in most provinces: Gorontalo’s overall
senior secondary NER increased by 131 percent and by 241 percent for the poorest 40. At
the individual provinces, health indicators have also improved by a smaller margin than
education indicators. The share of births assisted by skilled workers has increased by 100
percent in North Sulawesi and 85 percent in South Sulawesi, but has seen more modest
improvements in other provinces on the island. There has been no significant improvement
in immunization coverage in any province and has even decreased for the poorest 40 in
North and Central Sulawesi. Most health and education indicators achieved greater
improvements more for the poorest 40, albeit usually starting from a lower base. This
indicates a trend of the poorest 40 converging with the rest of the population.
56%
35%
54%
75%
44%
71%
42%
81% 81%
45%
61%
37%
70%73%
33%
63%
44%
62%
74%
37%
69%
49%
83%
74%
42%
0%
10%
20%
30%
40%
50%
60%
70%
80%
90%
NER Junior High NER Senior High Births assisted byskilled worker
Immunization rate Utilization rate
Eastern Ind. Java/Bali Kalimantan Sulawesi Sumatera

88
Performance of districts in all five indicators varies widely, but the variance is particularly
large for health indicators. The divergence of NER for senior secondary education is higher
than junior secondary education. Amongst the health indicators, the variation between
districts is the highest for the share of births assisted by skilled workers. For example, 99
percent of births were assisted by a skilled worker in the city of Tomohon (in North
Sulawesi). In stark contrast, a skilled health worker assisted only 25 percent of births in
Wakatobi district (Southeast Sulawesi). Conversely, district immunization coverage values
tend to be clustered around the mean.
8.2. Demand‐side Constraints
A key demand‐side constraint was that despite disparity between the quality of services
provided (as shown in the assessment of indicators above), users’ satisfaction in Sulawesi
was quite high in 2006.37 In fact, across Indonesia users’ satisfaction was high across
Indonesia. In 2006, 91 percent of users in Sulawesi were satisfied or somewhat satisfied with
education services and 93 percent were satisfied with health services. Users’ satisfaction in
Java and Bali was also at 91 percent for education and only 2 percentage points higher for
health services. Satisfaction was high even in eastern Indonesia, which scores low on most
performance indicators, with 82 of the population satisfied or somewhat satisfied with
education services and 83 percent reported satisfaction or somewhat satisfaction in the
health services received. The high levels of reported satisfaction may be exaggerated due to
courtesy bias, low expectations, and optimistic predispositions (Lewis and Pattinasarany,
2009). Previous research argues that: “it certainly seems reasonable to assume that the
probability of citizen satisfaction is related to the actual quality of services. However, the
likelihood that citizens are satisfied is also influenced by many other factors such as
expectations, predispositions, and governance conditions“(Lewis and Pattinasarany, 2009).
Thus, while user satisfaction us not a perfect proxy “objectively” measure quality of public
service, low user expectations may raise the risk that insufficient pressure is put on
politicians and local bureaucracy to improve the quantity and quality of services provided.
In 2006, education services users in Sulawesi were most concerned with the condition of
school buildings and equipment but were less concerned with students’ achievements,
particularly in comparison to other regions. Amongst the five regions, Sulawesi had the
highest proportion of people, at 40 percent, who cite the condition of school buildings and
equipment as the most important aspect that needed improvement. Only 25 percent of
respondents in Sulawesi mention students’ academic achievements as their main concern. In
regions with better education indicators, a larger proportion of respondents cite students’
achievement as their main concern, For example, 39 percent of respondents in Java and Bali
said the aspect that most needed improvement was students’ achievement. Only 9 percent
of respondents in Sulawesi mention school fees as the main issue that needed to be
addressed.
37 The last year for which data are available. The GDS survey has not been updated since then.

89
Figure 8.3. Education services, most important dimension to improve according to users, 2006
Source: GDS 2nd edition, World Bank estimates.
The top health issue respondents in Sulawesi were most concerned about was the
condition of health service venues. Approximately 29 percent of Sulawesi respondents
indicated that the condition of health service venues was the most important aspect that
needed improvement. Physical condition of health facilities was less important in other
regions. For instance only 22 percent of respondents in eastern Indonesia considered it their
most important concern. For eastern Indonesians, their main concern (33 percent) was the
availability of medicines and vaccines. In contrast to education, the affordability of health
services was a relatively important issue. In Sulawesi, 21 percent of people cited affordability
as the most important issue that needed improvement, while only 9 percent raised
education affordability as an issue.
Figure 8.4. Health services, most important dimension to improve according to users, 2006
Source: GDS 2nd edition, World Bank estimates.
The majority of respondents said they would be willing to pay more for better quality
health and education services. Even though many respondents raised affordability as a
health issue, most also said they would be willing to pay more to receive better services.
This pattern indicates that although most users declared they were satisfied with current
services, they did recognize that these same services could be improved and were willing to
invest their own resources, both money and time (such as participating in social
accountability initiatives) to achieve that improvement.
The proportion of total household expenditure spent on out‐of‐pocket (OOP) education
expenditure is higher than OOP health expenses. In 2012, the average per capita spending
on OOP education expenses in Sulawesi was Rp 74,000 and Rp 45,000 on OOP health
34%23% 29%
40%29%
20%
17%
24%17%
19%
7%
12%
8%9%
8%
28%39% 26%
25%30%
5% 6% 6% 3%4%
7% 4% 7% 7% 10%
0%
20%
40%
60%
80%
100%
Eastern Jawa/Bali Kalimantan Sulawesi Sumatera
Condition of school building and equipment Teacher's attentiveness towards student Affordability of school fee
Student academic achievements Extracurricular activities Others
22% 17% 18%29%
22%
17%15% 19%
15%17%
16% 25%25%
21%24%
33% 25%26% 20% 25%
7%12%
5% 7% 3%5% 7% 7% 7% 9%
0%
20%
40%
60%
80%
100%
Eastern Jawa/Bali Kalimantan Sulawesi Sumatera
Condition of the health service venue Attentiveness of the medical officers Affordability of the health services
Medicines and vaccine supply Waiting time Others

90
expenses (current IDR). This means that 6.2 percent of household income was spent on
education and 2.5 percent was spent on health. There is generally a greater variation in
health spending across households. Families experiencing specific events such as illnesses
and accidents may have to allocate a higher share of their spending on health services.
Although the poorest 40 percent spent less on OOP education and health expenses,
education represent a larger share of their total expenditure. The poorest 40 percent
spent an average of Rp 36,000 per person on OOP education expenditure and Rp 12,000 per
person on OOP health expenses. As a share of total household expenditure, education
represented 7.8 percent of the total household expenditure, which is higher than the 6.2
percent of the total household expenditure spent on OPP education expenses by the
average Sulawesi household.
8.3. Supply‐side Constraints
This section analyzes a series of supply‐readiness indicators to show where the supply of
basic services is lagging behind and in which dimensions the largest gaps exists.38 This
section also analyzes the impacts the supply‐readiness may have on service delivery
performance. This analysis uses a set of education and health indicators the measure three
dimensions of supply‐readiness: availability and accessibility of facilities, presence and
qualification of personnel, physical characteristics of facilities.
Table 8.2. Education supply‐readiness indicators
Dimension Indicator Description
1. Availability and accessibility of facilities
Access to SMA (10 km) Share of population living in village with
access to a senior high school (SMA)
within 10 km
Access to SMP (6 km) Share of population living in village with
access to a junior high school (SMP)
within 6 km
2. Presence and qualification of
personnel
S1 SMA teachers Share of SMA teachers with at least an
S1 degree (bachelor)
S1 SMP teachers Share of SMP teachers with at least an
S1 degree (bachelor)
3. Physical characteristics of facilities
SMP with laboratory Share of SMPs with laboratory
School with electricity Share of schools with electricity
School with water in
bathroom
Share of schools with water in the
students’ bathroom
Source: adapted from Sparrow and Vothknecht, 2012.
Sulawesi has widespread access to junior secondary education but access to senior
secondary education is more limited, especially in Central and West Sulawesi provinces. At
89 percent, access to junior secondary school is above the national average in all provinces
in Sulawesi. Access to senior secondary school is uneven – only 76 percent of people have
access in Central Sulawesi and 79 percent have access in West Sulawesi. In contrast, all other
provinces in Sulawesi at least 85 percent of the population have access to senior secondary
education.
38 The supply readiness indicator used for this section is for 2012, unless indicated otherwise
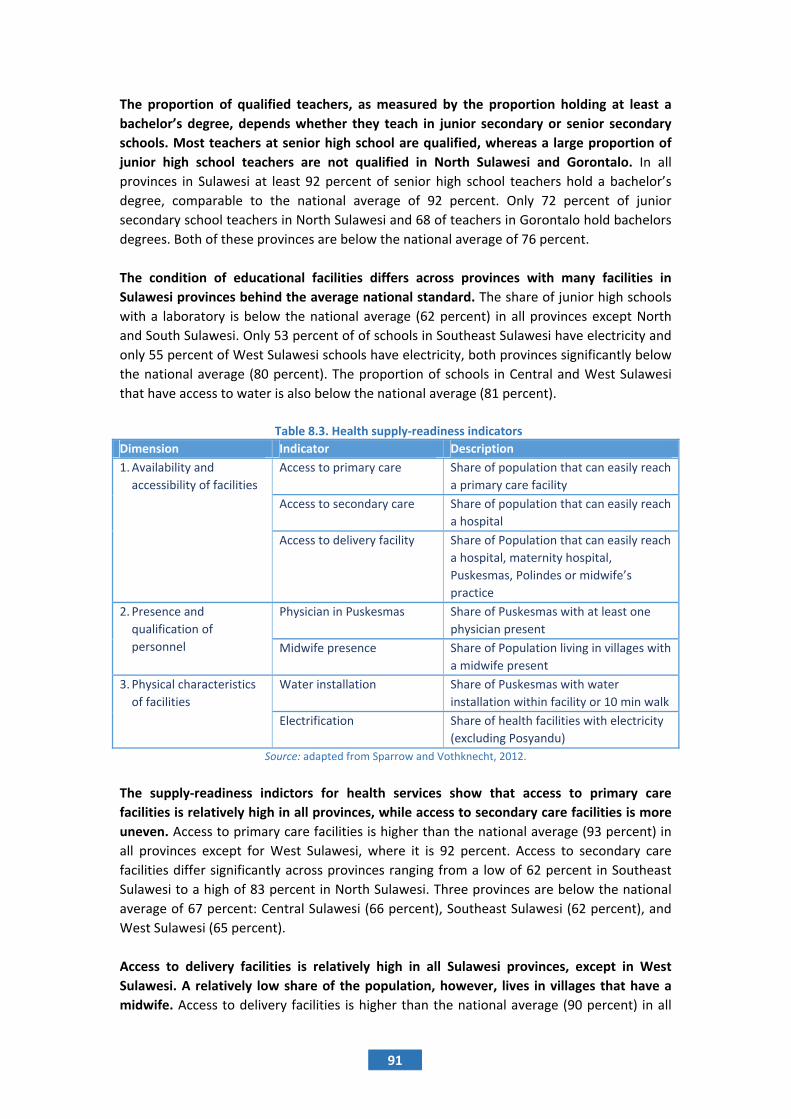
91
The proportion of qualified teachers, as measured by the proportion holding at least a
bachelor’s degree, depends whether they teach in junior secondary or senior secondary
schools. Most teachers at senior high school are qualified, whereas a large proportion of
junior high school teachers are not qualified in North Sulawesi and Gorontalo. In all
provinces in Sulawesi at least 92 percent of senior high school teachers hold a bachelor’s
degree, comparable to the national average of 92 percent. Only 72 percent of junior
secondary school teachers in North Sulawesi and 68 of teachers in Gorontalo hold bachelors
degrees. Both of these provinces are below the national average of 76 percent.
The condition of educational facilities differs across provinces with many facilities in
Sulawesi provinces behind the average national standard. The share of junior high schools
with a laboratory is below the national average (62 percent) in all provinces except North
and South Sulawesi. Only 53 percent of of schools in Southeast Sulawesi have electricity and
only 55 percent of West Sulawesi schools have electricity, both provinces significantly below
the national average (80 percent). The proportion of schools in Central and West Sulawesi
that have access to water is also below the national average (81 percent).
Table 8.3. Health supply‐readiness indicators
Dimension Indicator Description
1. Availability and accessibility of facilities
Access to primary care Share of population that can easily reach
a primary care facility
Access to secondary care Share of population that can easily reach
a hospital
Access to delivery facility Share of Population that can easily reach
a hospital, maternity hospital,
Puskesmas, Polindes or midwife’s
practice
2. Presence and qualification of
personnel
Physician in Puskesmas Share of Puskesmas with at least one
physician present
Midwife presence Share of Population living in villages with
a midwife present
3. Physical characteristics of facilities
Water installation Share of Puskesmas with water
installation within facility or 10 min walk
Electrification Share of health facilities with electricity
(excluding Posyandu)
Source: adapted from Sparrow and Vothknecht, 2012.
The supply‐readiness indictors for health services show that access to primary care
facilities is relatively high in all provinces, while access to secondary care facilities is more
uneven. Access to primary care facilities is higher than the national average (93 percent) in
all provinces except for West Sulawesi, where it is 92 percent. Access to secondary care
facilities differ significantly across provinces ranging from a low of 62 percent in Southeast
Sulawesi to a high of 83 percent in North Sulawesi. Three provinces are below the national
average of 67 percent: Central Sulawesi (66 percent), Southeast Sulawesi (62 percent), and
West Sulawesi (65 percent).
Access to delivery facilities is relatively high in all Sulawesi provinces, except in West
Sulawesi. A relatively low share of the population, however, lives in villages that have a
midwife. Access to delivery facilities is higher than the national average (90 percent) in all

prov
live
Sula
The
and
with
Sula
Wat
rem
nati
perc
Sula
Sout
Wea
high
large
both
high
8.6
whic
read
leve
pop
Figuin
Fig
vinces excep
in a village t
awesi, and Go
presence of
Southeast S
h physicians
awesi (94 per
ter installatio
mains limited
onal averag
cent. Across
awesi provinc
theast Sulaw
althier and
her quality e
e variations,
h for educat
her supply‐re
shows that
ch often resi
diness indica
el. This analy
ulation living
ure 8.5. Educandex and per c
gure 8.7. Educ
pt for West S
hat has a mi
orontalo.
f physicians
Sulawesi. Th
than the na
rcent), and G
on is prevale
d in some pr
e of 86 per
Indonesia,
ces, howeve
wesi (59 perc
more urban
education an
, districts wi
tion and he
eadiness sco
the places w
ide in rural a
ators. These
ysis indicates
g in remote a
ation and heacapita GRDP,
2012
So
cation and he
ulawesi, whe
dwife is belo
at Puskesm
ree province
tional avera
Gorontalo (96
ent in the he
rovinces. The
cent in all p
around 81
r, fall below
ent), and We
n districts be
nd health fa
th a higher
alth. Figure
res, with mo
with a highe
and remote
relationship
s that priori
areas has acc
lth supply reaSulawesi dist
ource: PODES, S
alth supply red
92
ere it is 87 p
ow the natio
mas is relativ
es in Sulawes
ge (86 perce
6 percent).
ealth facilitie
e rate of wa
provinces ex
percent of h
w the nationa
est Sulawesi
enefit from
acilities. As
regional GD
8.7 shows
ore access to
er proportion
areas, also h
s are all stat
ity must be
cess to good
adiness tricts,
Figin
Susenas, World
eadiness indedistricts, 2011
percent. The
nal average
vely high in S
si have a hig
ent): North S
es in Sulawe
ter installati
xcept for We
health facilit
al average: C
(75 percent
having acce
shown in fig
DP tend to ha
that more u
o basic servic
n of the poo
have lower e
tistically sign
placed on e
d quality facil
gure 8.6. Educndex and shar
d Bank estimate
ex and share o1
share of the
in North Sula
Sulawesi, ex
her proporti
Sulawesi (95
si whereas e
on is close t
est Sulawesi
ties have ele
entral Sulaw
).
ess to a larg
gure 8.5, alt
ave higher s
urban distric
ce facilities. M
orest 40 (vul
education an
nificant at th
ensuring tha
ities.
cation and hee of vulnerab
2012
es.
of urban popu
e population
awesi, South
xcept for Ce
on of puskes
5 percent), S
electricity ac
to, or above
i, where it i
ectricity. Sev
wesi (73 perc
ger quantity
hough there
supply readin
cts tend to
Moreover, fi
nerable peo
nd health sup
he 5 or 1 per
at the vulner
ealth supply rble, Sulawesi d
ulation, Sulaw
that
heast
ntral
smas
outh
ccess
, the
is 77
veral
ent),
and
e are
ness,
have
igure
ople),
pply‐
rcent
rable
eadiness districts,
wesi

This
dete
regr
indic
vuln
the
on t
GDP
The
seni
incre
imp
seco
seni
is ex
abo
stat
to ju
incre
conc
The
outp
utili
utiliz
0.1
read
s study used
erminant of
ression mode
cators used
nerable in pa
impact of a
the respectiv
P and the sha
education s
ior secondar
easing the n
roving the s
ondary schoo
or high by a
xpected to r
ut 5 percen
istically signi
unior high s
easing enrol
cerns.
health supp
put indicato
zation rate o
zation rate b
percent, an
diness index
So
a regressio
f education
el estimates
in this stu
articular. The
change in th
ve health an
are of the ur
supply‐readi
ry school but
number of e
school’s phy
ols. A 0.1 p
bout 3 perce
result in an
ntage points
ificant impac
school is alr
lment involv
ply‐readines
rs: share of
of medical fa
by 0.03 perc
nd the immu
does not h
ource: PODES, S
n model to
n and healt
the influen
dy, both fo
e model uses
he supply‐re
nd service o
ban populat
ness index h
t not on jun
education fa
ysical facilitie
point change
entage point
even higher
. A change
ct on the NER
eady almost
ves resolving
s index has
births assist
acilities. A 0
cent; increas
unization co
ave a signifi
93
Susenas, World
demonstrat
th service d
ce of the su
or the gener
s 2012 data f
adiness com
output indica
ion in the dis
has a statisti
ior secondar
cilities, raisi
es are likely
e in the ind
ts. For the vu
r increase in
in the supp
R in junior se
t universal (
g other facto
a statistical
ted by skille
.1 point incr
se the share
overage by
icantly differ
d Bank estimate
e that supp
delivery ou
upply‐readine
ral populatio
for 73 distric
mposite indic
ators, contro
strict.
cally signific
ry school. Th
ng the shar
to increase
ex is foreca
ulnerable, a 0
n the senior
ply‐readiness
econdary sch
(above 93 p
rs such as pe
ly significan
d workers, i
ease in the i
e of births as
0.01 percen
rent impact
es.
ly‐readiness
tcomes in
ess index on
on of Sulaw
cts in Sulawe
es for educa
olling for per
ant impact o
hat is, the mo
e of qualifie
e net enrollm
sted to incr
0.1 point cha
secondary
index does
hool. This ref
ercent in al
ersonal cons
t impact on
mmunizatio
ndex is pred
ssisted by sk
nt. A change
on vulnerab
s is an impor
Sulawesi.
n the five ou
wesi and for
esi and estim
ation and he
r capita reg
on enrollme
odel implies
ed teachers,
ments for se
rease the NE
ange in the i
school NER
s not result
flects that ac
l provinces)
straints or qu
n all three he
on coverage,
dicted to incr
killed worker
e in the sup
ble populatio
rtant
The
utput
r the
mates
ealth,
ional
nt in
that
and
enior
ER in
ndex
‐ by
in a
ccess
and
uality
ealth
, and
rease
rs by
pply‐
on in

94
comparison to the overall population. The impact that health supply‐readiness has on all
selected indicators supports the idea that the provision of quality health facilities remains a
binding constraint for improving health output indicators for Sulawesi inhabitants.
8.4. Financing for Service Delivery
Thirteen years after Indonesia’s big bang decentralization, spending by central and
subnational governments is consistently increasing. Indonesia’s big bang decentralization,
which began over a decade ago in 2001, comprised a momentous shift in service
responsibilities and funding from the center to subnational governments. In the event,
subnational took over primary responsibility for delivering nearly all public services. The
assignment of new functions was accompanied by a massive reallocation of funding—
districts and province government is experiencing significant increase in spending, more
than double in 10 years period. District and provincial governments, who are now
responsible for delivering public services in decentralized sectors, are now managing more
fiscal resources than before. Sub‐nationals now manage about half of total core public
spending (i.e. excluding central government subsidies and interest payments) (The World
Bank, 2011).
Sulawesi subnational governments are spending more than the national average,
especially after 2005. Subnational governments in Sulawesi are also experiencing significant
increase in fiscal resources, more than doubled in 10 years’ time. The fiscal resources are
mainly to finance the subnational governments, provincial and district governments, in
providing public services to the people of Sulawesi. In per capita term, Sulawesi’s spending
increased from Rp 890 thousand in 2001 to Rp 2.1 million in 2011. For Sulawesi, the per
capita spending increase reaches 132 percent or 13 percent annually. This is much higher
than the national per capita consolidated spending which is at Rp 1.7 million in 2011. The
increase in spending for Sulawesi happened after 2005 when the country is experiencing
windfall from oil price increase and subsidy reduction.
However, the additional fiscal resource has not been translated to improved service
delivery. The expectation was that decentralization would allow subnational governments to
better identify and respond to the service delivery needs of their citizens. In the context of
Sulawesi, increased public spending ‐‐ which is higher comparing to other regions—also has
mixed results on basic service delivery.
Provincial government in Sulawesi tends to underspend compare to their national
counterpart, while the districts governments are at par. Provincial and districts
governments have different roles in term of delivering service delivery. District governments
have the leading role in delivering public services, especially in education and health. The
provincial governments’ role is characterized by its coordinating function, in particular as the
representative of the central government in the regions. On top of that, they are also
responsible for distinct service delivery role with district governments. In education, the
district government has a much larger role compare to province, hence the shares of
spending for education is much higher. For health, the district‐spending share is a bit higher
than the province. However, in the case of Sulawesi, the provincial government tends to
spend lower share of its budget on education and health.
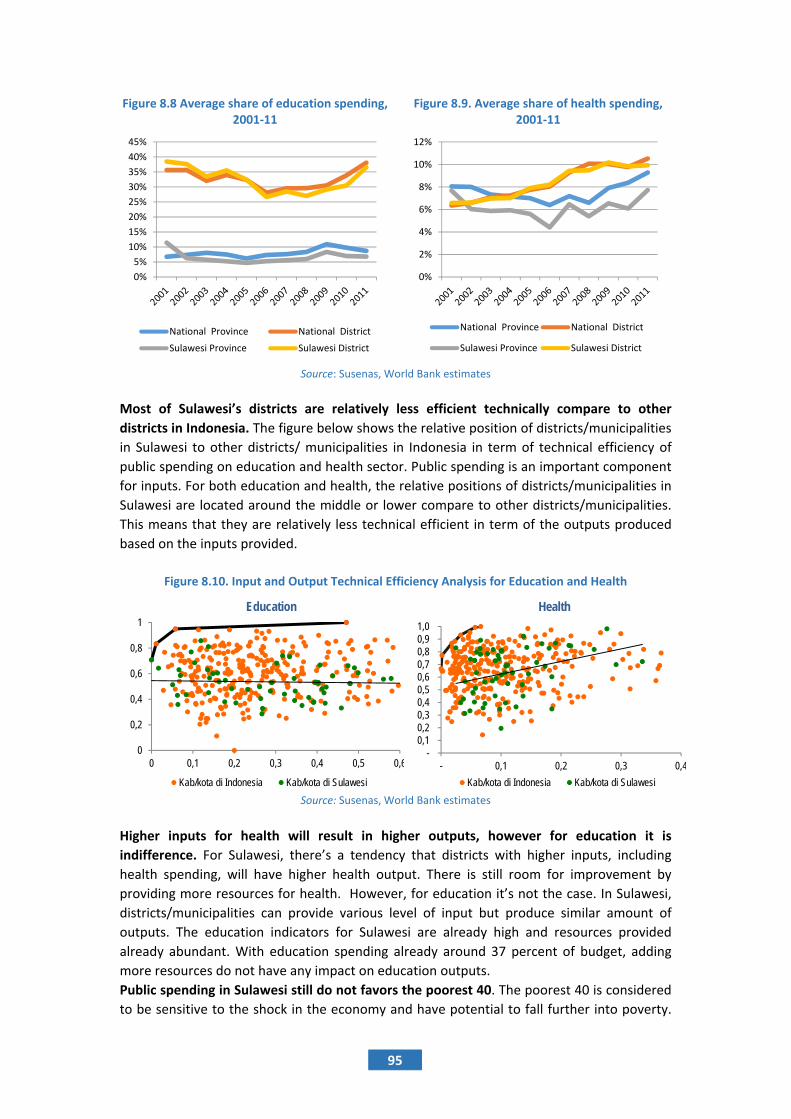
95
Figure 8.8 Average share of education spending, 2001‐11
Figure 8.9. Average share of health spending, 2001‐11
Source: Susenas, World Bank estimates
Most of Sulawesi’s districts are relatively less efficient technically compare to other
districts in Indonesia. The figure below shows the relative position of districts/municipalities
in Sulawesi to other districts/ municipalities in Indonesia in term of technical efficiency of
public spending on education and health sector. Public spending is an important component
for inputs. For both education and health, the relative positions of districts/municipalities in
Sulawesi are located around the middle or lower compare to other districts/municipalities.
This means that they are relatively less technical efficient in term of the outputs produced
based on the inputs provided.
Figure 8.10. Input and Output Technical Efficiency Analysis for Education and Health
Source: Susenas, World Bank estimates
Higher inputs for health will result in higher outputs, however for education it is
indifference. For Sulawesi, there’s a tendency that districts with higher inputs, including
health spending, will have higher health output. There is still room for improvement by
providing more resources for health. However, for education it’s not the case. In Sulawesi,
districts/municipalities can provide various level of input but produce similar amount of
outputs. The education indicators for Sulawesi are already high and resources provided
already abundant. With education spending already around 37 percent of budget, adding
more resources do not have any impact on education outputs.
Public spending in Sulawesi still do not favors the poorest 40. The poorest 40 is considered
to be sensitive to the shock in the economy and have potential to fall further into poverty.
0%
5%
10%
15%
20%
25%
30%
35%
40%
45%
National Province National District
Sulawesi Province Sulawesi District
0%
2%
4%
6%
8%
10%
12%
National Province National District
Sulawesi Province Sulawesi District
0
0,2
0,4
0,6
0,8
1
0 0,1 0,2 0,3 0,4 0,5 0,6
Education
Kab/kota di Indonesia Kab/kota di Sulawesi
- 0,1 0,2 0,3 0,4 0,5 0,6 0,7 0,8 0,9 1,0
- 0,1 0,2 0,3 0,4
Health
Kab/kota di Indonesia Kab/kota di Sulawesi
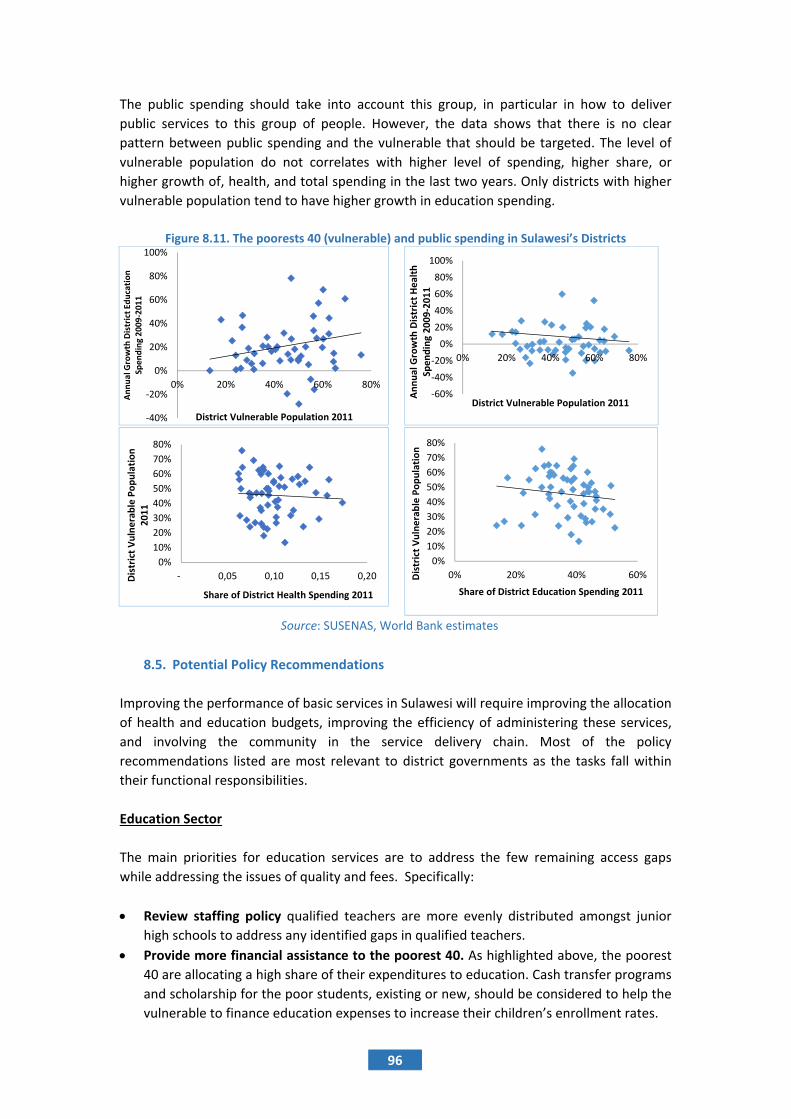
96
The public spending should take into account this group, in particular in how to deliver
public services to this group of people. However, the data shows that there is no clear
pattern between public spending and the vulnerable that should be targeted. The level of
vulnerable population do not correlates with higher level of spending, higher share, or
higher growth of, health, and total spending in the last two years. Only districts with higher
vulnerable population tend to have higher growth in education spending.
Figure 8.11. The poorests 40 (vulnerable) and public spending in Sulawesi’s Districts
Source: SUSENAS, World Bank estimates
8.5. Potential Policy Recommendations
Improving the performance of basic services in Sulawesi will require improving the allocation
of health and education budgets, improving the efficiency of administering these services,
and involving the community in the service delivery chain. Most of the policy
recommendations listed are most relevant to district governments as the tasks fall within
their functional responsibilities.
Education Sector
The main priorities for education services are to address the few remaining access gaps
while addressing the issues of quality and fees. Specifically:
Review staffing policy qualified teachers are more evenly distributed amongst junior
high schools to address any identified gaps in qualified teachers.
Provide more financial assistance to the poorest 40. As highlighted above, the poorest
40 are allocating a high share of their expenditures to education. Cash transfer programs
and scholarship for the poor students, existing or new, should be considered to help the
vulnerable to finance education expenses to increase their children’s enrollment rates.
‐40%
‐20%
0%
20%
40%
60%
80%
100%
0% 20% 40% 60% 80%
Annual Growth District Ed
ucation
Spending 2009‐2011
District Vulnerable Population 2011
‐60%
‐40%
‐20%
0%
20%
40%
60%
80%
100%
0% 20% 40% 60% 80%
Annual Growth District Health
Spending 2009‐2011
District Vulnerable Population 2011
0%
10%
20%
30%
40%
50%
60%
70%
80%
‐ 0,05 0,10 0,15 0,20District Vulnerable Population
2011
Share of District Health Spending 2011
0%
10%
20%
30%
40%
50%
60%
70%
80%
0% 20% 40% 60%District Vulnerable Population
Share of District Education Spending 2011

97
Address deficiencies in school facilities. Studies show that Sulawesi schools lack
laboratories and access to electricity remains limited. While the shortage of electricity
in schools may reflect a regional problem with electricity access, the schools need to
seek alternative avenues to access electricity such as through the provision of
generators.
Use social accountability mechanisms to foster improvements in service outcomes for
the education and health sectors. Service quality improvements can be achieved both
through increasing resource allocation but also improving frontline service delivery
through deploying provider incentives. One way to deploying provider incentives is by
mobilizing the demand side so that users voice their demands for better quality services.
Health Sector
The main priorities for health services should be to increase access to secondary care, and
improve the quality of existing facilities. Specifically:
Increase the presence of midwives in villages. Regions lacking widespread presence of
midwives in villages needs to be systematically identified. Once these regions have been
identified, governments should pilot incentives schemes to increase the presence of
midwives in areas where there is a shortage. This may also include experimenting with
non‐monetary incentives for all health service providers (doctors, midwives, nurses)
including better career opportunities, merit‐based career management, and improved
in‐kind benefits (such as housing and education) to encourage more service providers to
go to remote areas. Another potential solution is to experiment with rotational services.
Moreover, governments should also promote interest in the health profession in
secondary schools and develop specific curriculums in health professional schools
Expand access to secondary care. Access to secondary care should be expanded by
providing incentives to local governments to establish hospitals in lagging regions. One
way to achieve is to include access to secondary care indicators in the medium‐term
development plans (RPJMD).
Cash transfers to the vulnerable. Given that the vulnerable in Sulawesi still have poor
health outcomes and the gap between the general population of Sulawesi and the
vulnerable has widened, sub‐national governments should allocate more resources to
narrowing the gap and improving access. Sub‐national governments should seek ways to
increase health spending efficiency. Planning and budgeting should include
consideration of the role of the private sector to ensure more optimal use of resources.


Chapter 9Improve Infrastructure in
Sulawesi

100
9.1. Urbanization and Economic Development
Sulawesi has one of the fastest urbanization rates in Indonesia, but is starting from a low
base. Sulawesi is one of the least urbanized regions in Indonesia. Only Maluku, Papua, and
Nusa Tenggara regions have a higher proportion of rural population. Sulawesi’s urban
population is growing at a faster pace than Indonesia as a whole. Urbanization undoubtedly
has a positive effect on the region’s economy and on poverty reduction. Conversely, it also
poses huge infrastructure challenges for a region where infrastructure is at a level similar
with Sumatera.
Access to all types of infrastructure in Sulawesi needs to be improved in order for the
region to continue to grow sustainably. Without adequate infrastructure, positive spillovers
from urban economic growth to rural area will not be realized. Infrastructure development
is of such vital importance Sulawesi development that this report includes a chapter
specifically on the subject of infrastructure and urbanization.
This chapter examines Sulawesi’s urbanization trends, and analyzes the infrastructure
spending patterns. It also proposes policy solutions for improving infrastructure in the
region.
Population and Urbanization across Indonesia by Island
Sulawesi’s population of 17 million people represents less than 8 percent of Indonesia’s
total population. Over 130 million or 58 percent of Indonesia’s population resides in Java
and Bali. Sumatra has a population of 46 million or 20 percent of Indonesia’s total. The
population of the eastern islands and Kalimantan make up only 7 percent and 6 percent of
the total, respectively (Table 9.1).
Sulawesi is the second least‐urbanized island of Indonesia. Only about one‐third of
Sulawesi’s total population lives in urban areas. Eastern Indonesia is slightly less urbanized
than Sulawesi with just 30 percent of the total population residing in urban areas. In
comparison, almost 60 percent of the population in Java is urbanized (Table 9.1).
Table 9.1. Population, urbanization, and migration in Indonesia, by island grouping
Source: WB staff calculation based on BPS data
Sulawesi’s urban population is growing faster than elsewhere in Indonesia. Sulawesi’s
urban population has been increasing at an average of 8.6 percent per year since 2005—
Population Urban Population Percent Urban Population Urban Population Net Migration Percent of Pop
Sumatra 46,136,521 18,523,823 40.2 1.7 4.0 2,291,833 5.4
Kalimantan 13,787,831 5,799,291 42.1 2.1 4.5 1,408,599 11.3
Java/Bali 129,865,723 75,164,855 57.9 1.0 4.3 -3,345,829 -2.7
Sulawesi 17,371,782 5,843,103 33.6 1.7 8.6 -186,753 -1.2
Eastern 15,349,435 4,597,801 30.0 2.4 5.6 -195,212 -1.4
Total 222,511,292 109,928,873 49.4 1.4 4.5 -27,362 0.0
Aceh not included due to lack of data.
Level (2010) Growth (2005-2010) Lifetime Migration (2005)

101
almost twice the national growth rate. Eastern Indonesia’s urban population is also growing
quickly at 5.6 percent per year.
Sulawesi has had net out‐migration through 2005. Sulawesi lost 1.2 percent of its
population through migration. The net out‐migration is highest in Java and Bali at 2.7
percent and eastern Indonesia lost about 1.4 percent of its population from met out‐
migration over the same period. Conversely, Kalimantan’s experienced significant net in‐
migration—the region gained 11.3 percent of its population through migration. Sumatra
also had a significant in‐migration—5.4 percent of its population is through migration (Table
9.1).
Population and Urbanization across Sulawesi by Province
North Sulawesi has by far the largest population among Sulawesi provinces representing
45 of the island’s total population. Two other large provinces are South Sulawesi with 37
percent of the population and Gorontalo, which has 34 percent of Sulawesi’s total. The
remaining three provinces: Southeast Sulawesi, Central Sulawesi, and West Sulawesi have
similar population levels (Table 9.2).
North Sulawesi is the most urbanized province on the island. About 45 percent of its
population resides in urban areas. South Sulawesi and Gorontalo have slightly lower
urbanization rates at 37 percent and 34 percent, respectively.
Table 9.2. Population, urbanization, and migration in Sulawesi by province
Source: WB staff calculation based on BPS data
South Sulawesi has the most rapidly growing urban population. Its urban population grew
by an astonishing 18 percent per year between 2005‐2010. The annual growth rate of West
Sulawesi’s urban population is 8.5 percent, similar to the Sulawesi average of 8.6 percent
per annum. Gorontalo, Central Sulawesi, and North Sulawesi all had urbanization rates
below Sulawesi’s overall average but still grew faster than the national average. In contrast
to the other provinces, Southeast Sulawesi’s urban population fell at an annual rate of about
7 percent over 2005‐2010 (Table 9.2).
South Sulawesi (including West Sulawesi) and Gorontalo both experienced net out‐
migration through 2005. They lost 8.4 percent and 6.4 percent of their population to net
out‐migration, respectively. Conversely, both Central Sulawesi and Southeast Sulawesi had
significant net in‐migration through 2005; net in‐migration rates for those two provinces
were 12.0 percent and 11.0 percent, respectively. North Sulawesi’s population has been
almost unaffected by migration (Table 9.2).
Population Urban Population Percent Urban Population Urban Population Net Migration Percent of Pop
Sulawesi Utara 2,270,596 1,026,584 45.2 1.1 5.0 -468 0.0
Sulawesi Tengah 2,635,009 640,948 24.3 2.2 6.3 282,825 12.0
Sulawesi Selatan 8,034,776 2,945,429 36.7 1.4 18.0 -626,370 -8.4
Sulawesi Tenggara 2,232,586 611,373 27.4 2.5 -6.9 218,464 11.0
Gorontalo 1,040,164 353,681 34.0 1.7 7.2 -61,204 -6.4
Sulawesi Barat 1,158,651 265,088 22.9 2.4 8.5 na na
Total 17,371,782 5,843,103 33.6 1.7 8.6 -186,753 -1.2
Aceh not included due to lack of data. Migration data for Sulawesi Barat are included in Sulawesi Selatan.
Level (2010) Growth (2005-2010) Lifetime Migration (2005)

102
Urbanization and Economic Development across Indonesia by Island
Worldwide, urbanization is strongly associated with economic growth and development.
Urbanization does not cause economic growth per se, but agglomeration economies found
in urban areas can stimulate economic development.
In Indonesia, per capita GDP increases as population density (a proxy for agglomeration
economies) rises. The positive relationship between the GDP and population density also
holds for Sulawesi. Population density is far higher in the rest of Indonesia, especially Java
and Bali, than Sulawesi however. Sulawesi’s lower population density is also reflected in its
lower per capita income.
Existing research suggests that while the level of urbanization in Indonesia is positively
associated with economic growth the rate of change of urbanization is negatively
correlated with the growth in economic output. 39 That is, the higher the rate of increase in
urban population (proxy for rate of change in urbanization), the lower the rate of economic
growth. The negative relationship between rate of urbanization and economic growth also
exists in Sulawesi. One explanation proposed by existing research is not all benefits from
urban agglomeration economies are realized if urbanization takes place at too rapid a pace.
That is, the failure of public infrastructure investment to keep up with the increase in urban
population may have a negative effect on economic growth.
The negative impact of rapid urban population growth on economic development is more
severe in Sulawesi than in the rest of Indonesia, holding all other things equal. Across
Indonesia, a 1 percent increase in the rate of urban population growth leads to a nearly 0.1
percent decrease in the rate of growth of per capita GRDP. The negative impact of urban
population growth on economic growth appears to be approximately 50 percent stronger
for Sulawesi than for the rest of the nation on average, all other things remaining the same.
Economic growth in urban places has a modest positive influence on economic
development in nearby rural areas. A 1 percent increase in the urban economic growth rate
leads to an increase of 0.03 percent in rural economic growth rate. The urban spillover
impact on rural areas in Sulawesi is weaker than for Indonesia as a whole.
9.2. Access to Infrastructure and Impact of infrastructure on Economic Growth
Access to Infrastructure across Indonesia by Island
Access to major types of infrastructure, including electricity, sanitation, water, and roads,
is unexceptional in Sulawesi over 2001‐10 compared with other islands. Infrastructure
access is best in Java and Bali for all types of infrastructure except sanitation. Conversely,
access to infrastructure is worst in eastern Indonesia for electricity and sanitation and in
Kalimantan for water and roads. Sulawesi’s infrastructure access is at a level similar to
39 See Lewis (2010), “Impact of Demographic Change and Urbanization on Economic Growth in Indonesia” LKY School of Publicy
Policy NUS Working Paper.

Sum
but
Sula
hou
sani
Acce
Acce
prov
infra
Goro
Prob
espe
the
to se
fund
cons
defa
prog
Imp
Wor
stim
road
Sula
bett
exce
9.3)
Fig
matera, wher
poor access
awesi has im
seholds hav
tation, wate
ess to Infras
ess to infras
vinces in Sul
astructure is
ontalo and W
blems that c
ecially the u
island. The e
ecure neede
ded at all le
strained by
ault on past
gram.
pact of Infras
rldwide, go
mulating eco
d network (
awesi’s acces
ter than eas
ept for the p
gure 9.1 Avera
Source:
re the island
in others su
mproved hou
ve experienc
er, consistent
structure ac
structure in
lawesi. With
s better in N
West Sulawe
constrain inf
se of outdat
extension of
ed land. Tran
vels of gove
regional wa
loans and a
structure on
ood energy
onomic grow
length and
ss to energy
stern Indone
percentage o
age infrastruc2001‐10
World Bank st
d provide go
uch as electri
usehold acce
ced modest
t with Indone
cross Sulawe
North Sula
h the except
North and So
si is poor, in
frastructure
ted transmis
f road netwo
nsport sector
ernment. Mo
ater authori
an inability
n Economic
and transp
wth. Sulawes
quality of
and road inf
esia and Kal
of electricity
cture access S0
aff estimates.
103
od access in
icity and san
ess to infrast
but steady
esia’s overal
esi by Provin
wesi and So
tion of roads
ough Sulawe
particular ac
access in Su
ssion equipm
orks is restri
r specialists
oreover, san
ities (PDAM
to restructu
Growth acr
port infrast
si’s energy i
roads) are
frastructure
limantan. Su
supplied by
Sulawesi,
n some secto
nitation.
tructure ove
improveme
l trends.
nce
outh Sulawe
s in South Su
esi. In contr
ccess to sani
ulawesi inclu
cover prod
inability to
expansion;
transportat
services. El
exceed sale
and the sta
PLN, argues
insufficient
subsidies. P
technical an
extending
ment and di
cted by the
complain th
nitation and
s)’s financia
ure loans un
ross Indones
ructure are
nfrastructure
similar to
is worse tha
ulawesi’s acc
y PLN where
ors such as w
er the past d
ents in acce
esi is better
ulawesi, acce
rast, infrastr
tation (Figur
ude: electrici
uction costs
o secure
and funding
ion, sanitat
ectricity pro
es prices in
ate‐owned e
s that the ava
to cover
PLN also asse
nd non‐techn
electricit
fficult geogr
local public
at the secto
water servi
al difficulties
der the cen
sia and in Su
e considered
e (use and
Indonesia’s
n Java and B
cess is simil
Sulawesi do
water and r
decade. Sula
ss to electr
r than the o
ess to all typ
ructure acce
re 9.1).
ity prices do
s; governme
land for
g limitation
tion and w
oduction cost
many provi
electricity ut
ailable fundi
r the im
erts that it f
nical problem
ty cover
raphic terrai
sector’s ina
or is insufficie
ces expansio
s including
ntral governm
ulawesi
d importan
PLN supply)
overall aver
Bali but gene
lar to Suma
oes better (T
oads
awesi
icity,
other
es of
ss in
o not
ents’
road
s for
water
ts far
inces
tility,
ing is
plied
faces
ms in
rage,
n on
bility
ently
on is
their
ment
nt to
and
rage.
erally
tera,
Table

104
Table 9.3 Road length and electricity use by island
Source: World Bank staff calculation based on Ministry of Public Work data (road), BPS (population), and PODES
(electricity)
Improved infrastructure has a positive impact on economic growth in Indonesia. A 10
percent increase in electricity use as a proportion of valued‐added by manufacturing firms
leads to a 0.05 percent increase in growth of per capita GDP, while a 10 percent increase in
the proportion of total electricity use that is supplied by PLN results in an additional 0.01
percent increase in the growth of per capita GDP. A 10 percent increase in the number of
kilometers of roads per 1,000 persons is correlated with a 0.6 percent to growth in economic
output and a 10 percent increase in the proportion of total kilometers of roads in good
quality also leads to an extra 0.01 percent increase in growth.
Deficiencies in infrastructure constrain business activities. Regional Autonomy Watch
(KPPOD) carried out surveys of a sample firms all across Indonesia in 2007 and 2011 to
ascertain the most important constraints to business development. They found that
infrastructure was by far most frequently cited as the main constraint on firm operations
(Figures 9.5 and 9.6).
North Sulawesi, South Sulawesi, and Gorontalo were among the provinces sampled in the
KPPOD survey in 2007. Poor infrastructure was cited as the most important constraint by
nearly 40 percent of the firms in North Sulawesi and by 30 percent of Gorontalo businesses.
Fewer than 20 percent of firms in South Sulawesi, however, indicated that infrastructure
inadequacies were the most significant limitation; in South Sulawesi a larger percentage of
businesses identified land availability as the main constraint facing businesses (Figure 9.1).
The lack of access to land may be caused by insufficient infrastructure, however.
Southeast Sulawesi, Central Sulawesi, and West Sulawesi were surveyed by KPPOD in
2011. Infrastructure inadequacies were again cited by businesses as the most important
constraint on its operations. Nearly 60 percent of the firms surveyed in Southeast Sulawesi
identified infrastructure as the most binding constraint. Around 40 percent of the
businesses in Central and West Sulawesi said infrastructure was the biggest problem facing
private sector development. Across Indonesia problems related to infrastructure seem to
have become more severe in 2007‐11 (Figure 9.2).
Km Roads Km Roads Percent Electricty Percent
Per 1,000 Pop Per Sq M Good Per VA PLN
Sumatra 2.48 0.59 25.12 0.12 46.53
Kalimantan 2.78 0.22 23.98 0.11 42.73
Java/Bali 0.80 0.94 30.51 0.12 82.29
Sulawesi 2.62 0.47 25.02 0.14 66.75
Eastern 3.13 0.28 18.31 0.26 62.72
Indonesia 1.91 0.63 26.53 0.13 65.15

Infra
Sula
infra
200
and
abo
on
sign
othe
nati
infra
distr
perc
cont
infra
Goro
Ove
Rp 1
rang
Inte
any
an a
Fi
Sourc
Note
3=bu
integ
6=reg
9=inf
12=fi
settle
010
2030
400
1020
3040P
erce
nt
9.3. Infrastr
astructure S
awesi spen
astructure t
1‐09, Sulaw
central gov
ut Rp 88,500
infrastructu
ificantly less
er island gr
onal trend
astructure e
rict governm
cent), while
tributes to
astructure sp
ontalo spen
r the past de
122,000. In
ged from a lo
restingly, th
other provi
average of ar
igure 9.2 Prima
ce: World Bank
e: 1=land a
usiness licensin
grity; 5=local g
gulations; 7=tr
frastructure; 1
inancing; 13=m
ements.
0 5 10
Sulawesi Utar
Gorontalo
Ma
ructure Spen
Spending ac
nds much
than other i
wesi (provinc
vernments)
0 per perso
ure (in 200
s than the a
roups. Cons
ds, the m
xpenditure
ments in Su
provincial g
20 percent
pending.
nds noticeab
ecade, Goron
contrast, ot
ow of Rp 91,
e province o
nce—about
round Rp 65,
mary constrainactivity, 2007
k staff estimates
availability; 2
ng; 4=regional
government‐bu
ansactions cos
10=local taxes
marketing; 14=s
0 15 0
ra S
R
in Obstacle to Business Operatio
nding and fin
ross Sulawe
less on
islands. In
cial, district
spent only
on annually
00 prices),
average for
istent with
majority of
is spent by
ulawesi (75
government
and centra
bly more on
ntalo’s avera
ther Sulawes
000 in Centr
of Gorontalo
Rp 47,500 p
,000 to Rp 70
nts on busines7
s.
2=legal certa
head capacity
usiness interac
ts; 8=transpare
; 11=labor iss
security; 15=co
5 10 15
Sulawesi Selatan
Rest of Indonesia
ons
105
nance
esi
al governme
n infrastruct
age annual p
si provinces
ral Sulawesi t
spent more
per capita—
0,000 per ca
ss Figu
ainty;
y and
ction;
ency;
sues;
nflict
Source
Note:
4=priva
capacit
betwee
govern
10=infr
Figure 9infra
020
4060
020
4060
0
Per
cent
ent contribu
ture than ot
per capita inf
average ann
to a high of
than twice
in 2001‐09.
pita on infra
ure 9.3 Primaac
: World Bank st
1=legal cer
ate sector d
ty of local go
en public a
nment regula
rastructure.
.4. Average pstructure spe
Source: World
5
Sulawesi Tenggara
Sulawesi Barat
Main Ob
utes to 5 p
ther provinc
frastructure
nual per cap
Rp 84,200 in
as much on
District gov
structure pe
ry constraintsctivity, 2011
taff estimates.
tainty; 3=bus
development;
overnment hea
nd private
ations; 8=tra
rovincial, distending per cap
d Bank staff est
10 0
Sula
Rest
bstacle to Business Operations
percent of
ces in Sulaw
expenditure
pital expend
n North Sulaw
infrastructu
vernments sp
er year.
s on business
siness licensi
5=integrity a
ad; 6=interact
sectors; 7=lo
ansaction cos
trict, and centpita, 2001‐09
timates.
5 10
awesi Tengah
t of Indonesia
total
wesi.
e was
iture
wesi.
re as
pent,
ng;
and
ion
ocal
sts;
tral

106
Revenues Available for Infrastructure Spending across Sulawesi by Province
Sulawesi also has lower revenues than other islands. In 2001‐09, Sulawesi’s average real
annual per capita revenue (from both provincial and district sources) was Rp 526,200. In
comparison, Kalimantan had the highest average annual per capita revenue of Rp 790,500
over the same 9‐year period. Sulawesi’s comparatively small revenues may be one reason
why it spends so little on infrastructure (Table 9.4).
Gorontalo‘s average annual per capita revenue was the highest in in Sulawesi. Over 2001‐
09, Gorontalo’s per capita revenue was Rp 684,600 per year. In contrast, the second highest
revenue was in North Sulawesi at Rp 582,200 per capita per year. The other provinces
ranged from Rp 560,400 for West Sulawesi to a low of Rp 497,900 in South Sulawesi.
Gorontalo’ s high revenue is largely due to the high general allocation (DAU) it receives,
which is much larger than that of other provinces in Sulawesi.
Table 9.4 Provincial and district revenues in Indonesia, per capita by island group
Source: World Bank staff estimate based on MoF SIKD data
Sulawesi’s low level of revenue is consistent across the different levels of government and
the different types of revenue. Compared to other regions in Indonesia, Sulawesi has the
second lowest total per capita revenue (province and district), only slightly higher than Java
and Bali. Sulawesi’s per capita district‐level revenue is the lowest in Indonesia. Sulawesi also
performs poorly in per lowest own‐source, shared natural resource, DAU revenue, shared
PAD DBH Tax DBH SDA DAU DAK Oth Rev Total Rev
Sumatra 61,373 14,197 40,512 36,617 603 16,971 170,272
Kalimantan 91,562 27,083 100,585 62,997 1,336 4,435 287,999
Java/Bali 67,986 22,910 1,425 15,713 62 1,829 109,925
Sulawesi 46,137 8,906 1,128 67,755 1,892 4,028 129,846
Eastern 29,899 15,888 12,382 90,576 26,543 87,244 262,532
Indonesia 63,919 19,886 15,824 31,211 2,093 10,844 143,775
PAD DBH Tax DBH SDA DAU DAK Oth Rev Total Rev
Sumatra 35,232 43,145 40,354 307,163 28,784 38,875 493,554
Kalimantan 39,245 51,937 55,703 292,044 23,949 39,617 502,494
Java/Bali 32,713 35,842 32,124 279,547 25,367 33,963 439,556
Sulawesi 22,129 31,104 36,882 255,415 23,564 27,290 396,384
Eastern 28,638 40,624 37,596 296,191 28,720 37,333 469,101
Indonesia 32,482 39,879 38,535 287,880 26,325 35,648 460,749
PAD DBH Tax DBH SDA DAU DAK Oth Rev Total Rev
Sumatra 96,605 57,342 80,866 343,780 29,387 55,847 663,827
Kalimantan 130,806 79,021 156,287 355,041 25,285 44,052 790,493
Java/Bali 100,699 58,752 33,549 295,260 25,429 35,793 549,481
Sulawesi 68,266 40,010 38,011 323,170 25,456 31,318 526,229
Eastern 58,537 56,512 49,978 386,767 55,263 124,577 731,633
Indonesia 96,401 59,765 54,359 319,091 28,418 46,491 604,525
Province
District
Total
All figures are averages for 2001-2009 and are in constant (2000) per capita terms.
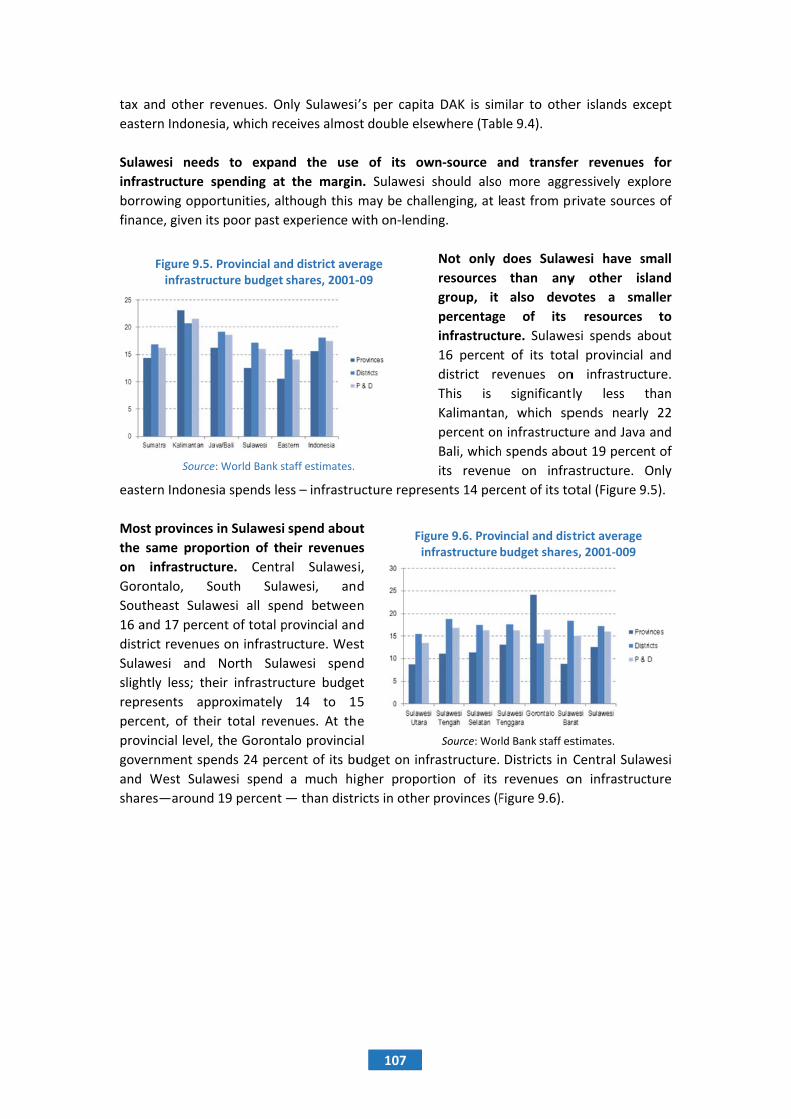
tax
east
Sula
infra
borr
fina
east
Mos
the
on
Goro
Sout
16 a
distr
Sula
sligh
repr
perc
prov
gove
and
shar
and other r
tern Indones
awesi needs
astructure s
rowing oppo
nce, given its
tern Indones
st provinces
same propo
infrastructu
ontalo, So
theast Sulaw
and 17 perce
rict revenue
awesi and
htly less; the
resents app
cent, of thei
vincial level,
ernment spe
West Sulaw
res—around
Figure 9.5. infrastruc
Source
evenues. On
sia, which rec
s to expan
spending at
ortunities, alt
s poor past e
sia spends les
in Sulawesi
ortion of th
ure. Centra
outh Sula
wesi all spe
ent of total p
s on infrastr
North Sula
eir infrastruc
proximately
ir total reve
the Goronta
ends 24 perc
wesi spend
19 percent
Provincial ancture budget
e: World Bank st
nly Sulawesi
ceives almos
nd the use
the margin
though this
experience w
ss – infrastru
spend abou
eir revenue
al Sulawes
awesi, and
end between
provincial and
ructure. Wes
awesi spend
cture budge
14 to 15
enues. At the
alo provincia
cent of its bu
a much hig
— than distr
d district aveshares, 2001‐
taff estimates.
107
’s per capita
st double els
e of its ow
n. Sulawesi
may be chal
with on‐lendi
ucture repre
ut
es
i,
d
n
d
st
d
et
5
e
al
udget on inf
gher propor
ricts in other
erage ‐09
Figin
a DAK is sim
ewhere (Tab
wn‐source a
should also
llenging, at l
ing.
Not only
resources
group, it
percentage
infrastruct
16 percen
district re
This is
Kalimantan
percent on
Bali, which
its revenu
sents 14 per
frastructure.
rtion of its
r provinces (F
gure 9.6. Provnfrastructure
Source: Wor
milar to othe
ble 9.4).
and transfe
o more aggr
east from pr
does Sulaw
than any
also devo
e of its
ture. Sulawe
t of its tota
evenues on
significant
n, which sp
n infrastructu
h spends abo
ue on infra
cent of its to
Districts in
revenues o
Figure 9.6).
incial and distbudget share
ld Bank staff es
er islands ex
er revenues
ressively exp
rivate source
wesi have s
y other is
otes a sm
resources
esi spends a
al provincial
n infrastruc
ly less
pends nearly
ure and Java
out 19 perce
astructure.
otal (Figure 9
Central Sula
on infrastruc
strict average es, 2001‐009
stimates.
xcept
s for
plore
es of
small
sland
maller
to
bout
and
ture.
than
y 22
a and
nt of
Only
9.5).
awesi
cture

Mar
Sula
ever
reve
leve
and
mar
shar
leve
Kalim
Indo
rupi
spen
Mar
perc
In Su
spen
an a
perc
shar
perc
Only
40 Ma
rupiah
Fi
rginal Impac
awesi spend
ry additiona
enue on inf
el comparab
Sumatra.
rginal infra
re is higher
el of 11
mantan (9.9
onesia, only
ah of add
nt on infrastr
rginal budge
cent and 6.2
ulawesi, sha
nding, consis
additional 0.3
cent is thus a
red non‐tax
cent, respect
y 2.6 percent
rginal budget shh increase in reve
igure 9.8. Dist
Sourc
ct of Revenu
ds 12.7 per
al rupiah of
frastructure
ble to Java a
The
astructure
r than the
.5 percen
percent). In
7.9 percent
ditional reve
ructure (Figu
et shares va
percent, res
ared tax reve
stent with tr
38 rupiah sp
also significa
revenue and
tively. DAU b
t of DAU incr
ares refer to theenue
trict marginal
ce: World Bank
ues on Infras
rcent of
f district
,40 at a
and Bali
region’s
budget
national
nt and
eastern
of each
enue is
ure 9.7).
ary significan
spectively (Fi
enue is the m
rends across
ent on infras
ant source of
d own‐sourc
barely has an
rease is spen
e additional incre
l budget share
staff estimates
108
structure Sp
ntly across
igure 9.8).
most import
s Indonesia.
structure. T
f revenue fo
ce revenue, l
ny impact on
nt on infrastr
ease in infrastruc
Figure 9.7.
S
es, 2001‐09
s.
pending acro
all types of
level, s
most im
margina
addition
revenue
rupiah s
and sha
also r
infrastru
shares
percent
shares f
the DAU
ant source o
An extra rup
he marginal
or infrastruct
less importa
n infrastruct
ructure (Figu
ture spending sh
District marg
Source: World B
oss Indones
revenues.
shared tax
mportant rev
al infrastruct
nal rupiah
e leads to
spent on inf
ared non‐ta
easonably
ucture, with
at 18.7 pe
, respectiv
for own‐sour
U are relativ
of revenue fo
piah of share
budget shar
ture. The ma
nt, at 15.1 p
ure expendit
ure 9.8).
hare due to the a
ginal budget s
Bank staff estim
sia by Island
At the nat
revenue is
venue source
ture budget
of shared
an extra
frastructure.
ax revenues
important
marginal bu
ercent and
vely. Mar
rce revenues
vely small at
or infrastruc
ed taxes lead
re for DAK is
arginal share
percent and
ture in Sulaw
additional increas
shares, 2001‐0
mates.
ional
the
e for
t. An
tax
0.35
DAK
are
for
udget
18.1
ginal
s and
12.6
cture
ds to
29.6
es for
14.7
wesi.
se of a
09

109
Accumulation of Fiscal Reserves across Indonesia by Island
Sulawesi has the fewest per capita fiscal reserves of any region. As of the end of 2011,
Sulawesi had accumulated Rp 205,300 per capita reserves, significantly lower than
Kalimantan with Rp 1.3 million per capita reserves. Eastern Indonesia and Sumatera also
have reasonably significant reserves—Rp 436,200 and Rp 382,200, respectively. Java and
Bali’s per capita fiscal reserves of Rp 224,500 is small.
North Sulawesi has the highest per capita fiscal reserves of any province in Sulawesi,
Rp 319,800. In contrast, South Sulawesi has the smallest per capita fiscal reserve of
Rp 154,900. Central Sulawesi’s reserves, at Rp 263,800, are above average for the province.
Southeast Sulawesi reserves more than doubled from 2010 to Rp 201,500 in 2011. [There is
no information on Gorontalo’s and West Sulawesi’s fiscal reserves, which may have been
included as part of the calculations for North Sulawesi and South Sulawesi, respectively, as
were formerly part of that province.
Borrowing for Infrastructure Development across Indonesia by Island
Borrowing is not an important
source of infrastructure financing
in Indonesia. The average
amount borrowed by provinces,
districts, and PDAM between
1975‐2005 was only Rp 27,000
per person. Sulawesi subnational
governments and PDAM’s
borrowings of Rp 27,000 per
capita to invest in infrastructure is similar to other regions (Table 9.5).
Repayment of infrastructure development loans has been poor all across Indonesia, but is
exceptionally poor in Sulawesi. Indonesia’s overall arrears rate on loan repayment is nearly
50 percent. That is, nearly 50 percent of all loans in Indonesia are in arrears. Sulawesi’s
repayment rate is worst in Indonesia – approximately 80 percent of its loan payments are in
arrears.
Sulawesi has borrowed for infrastructure development to about the same extent in per
capita terms as other islands (i.e. not much), except for eastern, which has borrowed
considerably less. Sulawesi’s extremely poor loan repayment track record may negatively
affect the private sector’s view of its creditworthiness and future borrowing possibilities.
9.4. Potential Policy Options
Sulawesi needs to significantly increase its infrastructure investments if it wants to reduce
inequality and sustain economic growth. Investment priorities include sanitation and roads,
both of which are poor condition, particularly in comparison to other regions in Indonesia.
Sulawesi also needs to invest fast growing urban places and build infrastructure that will
better connect urban and rural areas within districts and provinces. These investments
Table 9.5. Per capita borrowing across islands, 1975‐2005
Source: Ministry of Finance
No. of Loans Amounts Borrowed Arrears Rate
Sumatra 239 21,307 61.4
Kalimantan 41 27,456 56.9
Java/Bali 418 31,330 39.5
Sulawesi 116 26,841 79.5
Eastern 24 7,845 71.3
Indonesia 838 27,060 48.1

110
would reduce urban congestion, which constrains economic growth, and enhance urban
economic spillovers to rural areas, which are weak by national standards.
In order expand access to electricity in Sulawesi, national energy policy and regulatory
framework needs to be improved. Currently electricity production costs far exceed sales
prices in many provinces and PLN argues that available funding is insufficient to cover the
implied subsidies. PLN claims funding shortages limits its ability to expand access to
electricity. In Sulawesi, additional investment is also needed to replace outdated
transmission equipment and overcoming difficult geographical terrain.
At minimum, Sulawesi needs to increase the share of the region’s own‐source and transfer
revenues on infrastructure. Sulawesi sub‐national governments should also explore debt‐
financing options. For example, increasing their loans from the central government, via the
Government Investment Agency (PIP); more aggressively explore borrowing opportunities
from private financial institutions; explore options to issue bonds. The latter two debt
options will be challenging, however, since commercial banks’ are reluctant to lend to sub‐
national governments and these governments’ have weak debt management capacity.
Finally, the central government might consider increasing its own direct investment in sub‐
national public infrastructure.
Official infrastructure plans (MP3EI) for Sulawesi focus on connecting urban areas with
one another across the island. This plan needs to be integrated with plans that address
other identified infrastructure gaps. While official investment plans such as the MP3EI will
yield substantial benefits if realized, they will not help to alleviate urban congestion or
improve economic linkages between urban and rural areas, both of which are clearly
needed. Enormous financial investments are required to implement these plans and
probably can only be feasibly financed mostly through public‐private partnerships (PPPs).
Given Indonesia’s poor experience with PPPs, how securing private investment will proceed
remains unclear.


Chapter 10Conclusion
113
This chapter attempts to revisit the main questions pose at the beginning of this report. It starts by
answering the question on what are the driving factors behind Sulawesi’s rapid economic growth during
the last decade, and which segment of the population that is lagging behind. It is followed by addressing
the question on: what needs to be done to make the growth more inclusive.
What drives rapid growth in Sulawesi and who is lagging behind?
Sulawesi’s rapid economic growth during the last decade was mostly driven by tertiary sectors
growth. Tertiary sectors that include: Trade, Hotel, Restaurant, Transport, Communication and Services
sectors, contribute to about 52 percent of Sulawesi’s economic growth during 2001 to 2013 period. The
tertiary sectors may have benefited from the spillovers from the local commodity boom that happened
during 2006‐2010 period. During this period, Sulawesi’s terms of trade with the rest of Indonesia
increased by 2.5 percent. This reflect a relative increase in the price of Sulawesi’s products ‐ mainly
consisting of natural resource‐based commodities – in comparison with the prices of goods in the rest of
Indonesia. According to the literatures, the increased capital inflows from increased commodity
revenues lead to higher demand in non‐tradable sectors, including services and construction sectors.
The poorest 40% of the population (from herein referred to as the “poorest 40”) is lagging behind other
groups in Sulawesi. Between 2003 and 2012, growth in per capita expenditure for the poorest 40
percent of the population in Sulawesi is only 1.4 percent, lower than the overall average of 5.2 percent
and significantly lower than the per capita expenditure growth rate of the richest 1% of 15.7 percent.
The differences in the growth rate of per capita consumption caused inequality to widen. In 2012, the
wealthiest 1 percent of the population had a real per capita consumption level almost 37 times higher
than the poorest one percent.
The majority of the poorest 40 in Sulawesi reside in rural areas, employed in the agriculture sector,
and poorly educated. In 2012, 81.4 percent of the poorest 40 lived in rural area, 58 percent of those
who have employment worked in agriculture sector, and on average have only 7 years of schooling.
What needs to be done to make growth more inclusive?
1. Improve Agriculture Sector Productivity
Agriculture remains an important sector because a large proportion of the poorest 40 work in the
sector. Agricultural sector income is low because labor productivity in the sector remains low,
agriculture still has the lowest value added per worker compared to the other sector in the economy.
Increasing the income of the poorest 40 through improving agricultural sector productivity is therefore a
priority for Sulawesi.
Improving agricultural productivity in Sulawesi can be achieved by reducing the productivity gap
between Sulawesi and the best performing regions in Indonesia. Average land productivity or yield for
rice in Sulawesi is 21 percent lower than in East Java, one of the most productive regions in Indonesia;
The gap in maize productivity is even larger – maize yield in West Sulawesi, the regions most productive
maize producer, is around 50 percent lower than West Java, which has the highest yield in Indonesia.

114
Cocoa productivity in Sulawesi is high in comparison to other regions, but its current yield levels is only
70 percent of that achieved during the late 1990s.
Sub‐optimal farming practices such as using poor quality seeds and insufficient investment in
replanting cocoa trees contribute to low land productivity in Sulawesi. The 2010 PATANAS survey, for
example, found that only 29 percent of South Sulawesi rice farmers in survey villages used labeled
seedling, compared to 68 percent in rice producing villages surveyed in East Java. Several studies also
suggest that the adoption of high yielding maize varieties is lower in Sulawesi in comparison to Java or
Sumatra. In cocoa commodity, farmers are also not investing in rejuvenating and replanting aged trees.
Sulawesi’s provincial and district governments should focus their limited resources on increasing
maize and cocoa productivity. Sulawesi is relatively competitive in the international and domestic
markets of both commodities. The existing domestic production deficit implies that increasing output is
not expected to lead to a sharp decline in the prices of these commodities. In particular, South‐East
Sulawesi province has an opportunity to increase maize productivity because its productivity level is
amongst the lowest in Indonesia. Gorontalo province’s maize productivity increased by 113 percent
during the last decade, and sets a strong example of potential results from a concerted effort to improve
productivity.
2. Create More Opportunities in the Rural Non Agriculture Sector
More opportunities in the rural non‐agricultural sector needs to be created to reduce agricultural
sector labor surplus. One of the key reasons for low income in the agricultural sector is the low labor
productivity driven by the large size of agriculture labor. Thus agricultural workers need to shift to more
productive, higher income, non‐agricultural sectors.
Improving human capital through education and health program, as well as, improving infrastructure
to facilitate mobility and connectivity should become Sulawesi governments’ key priorities in
increasing non agriculture employment. Existing empirical evidence shows that higher health and
education outcomes, as well as, better access to infrastructure, increase the likelihood of a person to be
employed in the rural non‐agricultural sectors. Apart from fixed circumstances such as gender, and age,
employment in rural non agriculture sectors are found to be positively correlated with higher education,
lower morbidity, and, better access to good quality roads.
Developing rural economic centers by strengthening rural non‐agricultural enterprises is another key
policy priority for developing the rural economy in Sulawesi. Low‐productivity non‐agricultural
activities are currently performed in more remote locations, while high productivity activities tend to be
located in areas closer to urban areas such as district capitals. Sulawesi therefore needs to develop
viable and vibrant rural economic centers by strengthening and developing rural non‐agriculture
enterprises to absorb agricultural labor surplus in the rural area itself.

115
3. Promote Greater Inclusiveness in The Extractive Industry in Sulawesi
Sulawesi needs to ensure that the extractive industries play a more inclusive role in region’s economy.
With Sulawesi already considered Indonesia’s main nickel producing region, the extractive industries
have the potential to grow further and become more significant to Sulawesi’s economy. Moreover, the
risks associated with a growing extractive industry are considerable: environmental damage and
potential conflict between industry and local communities over resource management, for example,
means that it is crucial that the extractive industries are properly managed and monitored.
Maximizing the benefit of extractive industry to the economy would be better achieved through fiscal
means. This could be achieved by optimizing revenue collection and improving spending effectiveness,
rather than through production‐side policy, such as the downstream processing requirements. While
such policy could increase forward linkages of the extractive industry, it also creates net welfare losses,
at least in the medium term.
In order to improve the contribution of extractive industries to inclusive development in Sulawesi, this
report proposes recommendations structured around four pillars. The first pillar focuses on expanding
economic opportunities and mitigating adverse impacts of EI growth today. The second pillar focuses on
investing mineral resources rents for the future. The third pillar focuses on optimizing revenue
collection, and the fourth pillar focuses on improving the oversight and transparency of extractive
industries.
4. Improve Access to Basic Services for the Poor
Limited skills and education is a key challenge facing the poorest 40 because it constrains their ability
to find higher income employment. A key obstacle for worker mobility is that many in the poorest 40 do
not have the relevant skills to work in the secondary and tertiary sectors. The extractive industries, for
example, tend to employ skilled labor from outside of Sulawesi for their more senior positions. Limited
human capital also constrains Sulawesi from diversifying its economy. Hence, improving skills and
education of the poorest 40 and shifting them to more productive sectors is the main way to improve
their income.
Improving human capital and workers’ mobility in Sulawesi requires improving overall human
development outcomes, particularly in the health and education sectors. A comparison of five key
education and health outcomes show that Sulawesi has an average education level but performs poorly
in health. Sulawesi’s junior high school enrollment rate of only 66 percent and senior high school
enrollment rate of only 52 percent was lower than Java, Bali and Sumatera but higher than Kalimantan
and the rest of Eastern Indonesia. In the share of births assisted by skilled health workers and health
facilities utilization rates, Sulawesi performs poorly compared to other regions.
In access to basic services, there are still weaknesses related to several indicators of supply readiness
in Sulawesi. In education the main gap in supply readiness is found in the quality of school facilities.
There is also limited access to senior high schools and properly qualified SMP teachers. Supply readiness
in health highlights the unequal access to secondary health care and midwives are not available in many

116
villages. The shortcomings in education should be addressed by providing properly qualified teachers
through a review of staffing policy to allow a better distribution of qualify teachers between junior high
schools and by improving the school facilities such as through the provision of laboratories for SMP and
generators for electricity matters. Meanwhile to address the shortcoming in health, regions lacking a
widespread presence of midwives in villages should be systematically identified. Training and incentives
programs should then be set up to address this gap. The incentive could include experimenting with
non‐monetary incentives for all providers, especially midwives, including better career opportunities,
merit‐based career management, and improved in‐kind benefits (such as housing and education) to
encourage more deployment to remote areas. Appropriate resources to address the gap in both
education and health should be allocated by sub‐national governments.
5. Improve Infrastructure in Sulawesi
Access to public Infrastructure in Sulawesi has been steadily improving during the last decade, but
overall improvement has been modest. Household access to electricity, sanitation, water and roads has
had modest but steady improvements all across the island. Access to all types of infrastructure in
Sulawesi needs to be improved in order for the region to continue to grow sustainably. Without
adequate infrastructure, positive spillovers from urban economic growth to rural area will not be
realized.
Sulawesi needs to better prioritize its infrastructure investment if it wants to create and sustain
equitable service delivery and economic growth. Sectoral priorities include sanitation and roads, both
of which are below national standards. Geographic priorities include infrastructure investments within
the jurisdiction of fast growing urban areas, as well as those linking urban and rural areas. Such
investments would help to reduce urban congestion, which constrained economic growth, and enhance
urban economic spillovers to rural areas, which are currently weak by national standards. Investing in
infrastructure that connects urban and rural areas will make it easier to supply input for agriculture and
rural non‐farm activities as well as facilitate the marketing of agricultural and rural products. As for
expanding the access to electricity in Sulawesi, it will require improvement in the nation wide policy and
regulatory framework. Electricity production costs far exceed sales prices in many provinces and PLN
argues that available funding is insufficient to cover the implied subsidies, hence limit the PLN’s ability to
invest more on electricity supply. Particularly for Sulawesi, additional investment will also be needed to
replace the outdated transmission equipment and overcoming difficult geographic terrain.
Financing the needed infrastructure improvements will require the Sulawesi’s government to spend
much more than it does now as well as making more effort in lending. Sulawesi should at the very
least spend more of its own‐source and transfer revenues on infrastructure than the current level.
Sulawesi subnationals should also consider increasing their borrowing from the central government, via
the Government Investment Agency (PIP) and more aggressively explore borrowing opportunities from
private financial institutions, as well as bond issuances. Given the current lack of appetite among
commercial banks for lending to subnational governments and weak administrative capacity, the latter
two will not be easy. Finally, the central government might consider increasing its own direct investment
in subnational public assets, even though this runs counter to the spirit of decentralization.

117
References
Akiyama, T., Nishio,N. 1996. “Indonesia’s Cocoa Boom: Hands Off Policy Encourages Smallholder
Dynamism”. World Bank Policy Research Working Paper No. 1580
Alliance for Financial Inclusion. (2013). Regulatory Framework to Promote Financial Eligibility of Poor
Households and SMEs. Presented on APEC 2013 Workshop on Financial Inclusion in North Sulawesi,
23‐24 May 2013.
Araujo, C., A. de Janvry, and E. Sadoulet. (2002). Spatial patterns of non‐agricultural employment growth
in rural Mexico during the 90s. mimeo. University of California at Berkeley.
Bank Indonesia. (2008). Dari Hobi ke Bisnis Miliaran. Meraih Sukses Bisnis dengan Dukungan
Pembiayaan Perbankan, Chapter 14, 161‐171.
Bank Indonesia. (2013). Kajian Ekonomi Regional Sulawesi Utara Triwulan IV 2013.
Birkhaeuser, D., Evenson, R. E. and Feder, G., 1991. “The Economic Impact of Agricultural Extension: A
Review”, Economic Development and Cultural Change, 39, pp. 607‐650.
BPS, 2011. Struktur Ongkos Usaha Tani Tanaman Pangan. BPS, Jakarta
Clough, Y.,Faust,H.,Tscharntke, T. 2009 “Cacao Boom and Bust:Sustainability of Agroforests and
Opportunities for Biodiversity Conservation” Conservation Letter 2(2009).
Coulombe, S. (2011). “Lagging behind: Productivity and Good Fortunes of Canadian Provinces” C.D.Howe
Institute Commentary, No 331, June 2011.
Davis, B., P. Winters, G. Carletto, K. Covarrubias, E. Quinones, A. Zezza, K. Stamoulis, G. Bonomi, and S.
DiGiuseppe. (2007). Rural income generating activities: A cross country comparison. Food and
Agricultural Organization ESA Working Paper No. 07–16.
Davis, J. (2001). Conceptual issues in analysing the rural non‐farm economy in transition
economies. National Resources Institute.
Davis, J. (2004). The Rural Non‐Farm Economy, Livelihoods and their Diversification. Issues and Options. Department for International …. Retrieved from http://r4d.dfid.gov.uk/pdf/outputs/agecon/rnfeissuesandoptions.pdf
Davis et al (2007).”Rural Income Generating Activities: A Cross Country Comparison”, ESA Working Paper
No. 07‐16. Agricultural Development Economics Division. The Food and Agriculture
Organization, UN.
De Janvry, A., Saudolet, E. 2009. “Agricultural Growth and Poverty Reduction: Additional Evidence” The
World Bank Research Observer Vol 25, No. 1
Desianto, B.U. 2012. “Indonesian Maize Production and Trading for Feed”, Presentation at International
Maize Conference, Gorontalo 2012.

118
De Wolf, C. 2013. “Lessons Learned and Opportunities for Scaling‐up of Successful Models of Value
Chain Development for Smallholder Coffee, Cocoa and Tea”. Report prepared for the World
Bank, processed
Diaz Rios, L. 2013. “Market Promotion Initiatives: Experiences from Cocoa, Coffee, and Tea sectors”,
Report prepared for the World Bank, processed.
Dodge, E., Gemessa, S. 2012. “ Food Security and Rice Price Stabilization in Indonesia: Analysis of Policy Responses” Thesis at John.F.Kennedy School of Government
Elbers, C., and P. Lanjouw. (2001). Intersectoral Transfer, growth, and inequality in rural Ecuador. World Development, 29(3), 481–296.
Feder, G., Murgai, R. and Quizon, J.B. 2004. “Sending Farmers Back to School: The Impact of Farmer Field
Schools in Indonesia”, Review of Agricultural Economics 26 (1), pp. 45‐62.
Hamaguchi, Nobuaki. 2008. “Regional Productive Integration in East Asia.” Japan.
Hadijah, A.D., Subagyo. 2012. “Economic Analysis of Hybrid Maize in South Sulawesi” Proceeding of
International Maize Conference, Gorontalo 2012.
Haryono, 2012. “Maize for Food, Feed, and Fuel in Indonesia: Challenges and Opportunity” Presentation
at International Maize Conference, Gorontalo 2012.
Herianto, A.S.,Wastutiningsih, S.P.,Foster, D., Rimmer, M.,Callinan,R. 2010, “Agriculture and Fisheries
Extension Services in Indonesia: Origins, Transition, and Current Challenges” Extension Farming
Systems Journal volume 6 number 1
ICCO, 2012. The World Cocoa Economy: Past and Present, ICCO: London
IFAD 2009. Smallholder Farming in Transforming Economies of Asia and the Pacific: Challenges and
Opportunities Discussion Paper prepared for the side event organized during the 33rd session of
IFAD’s Governing Council
IFC. (2010). Scaling‐Up SME Access to Financial Services in the Developing World.
Johnston, D., & Morduch, J. (2008). The Unbanked: Evidence from Indonesia. The World Bank Economic Review, 22(3), 517–537. doi:10.1093/wber/lhn016
Kasryno, F., Pasandaran, E.,Suyamto,Adnyana, M.O. 2007 “Gambaran Umum Ekonomi Jagung
Indonesia” in Jagung: Teknik Produksi dan Pengembangan. (Eds: Sumarno, Suyamto, A. Widjono,
Hermanto, H. Kasim). Puslitbang Tanaman Pangan, Badan Litbang Pertanian
Kida, M. (2011). Agriculture and inclusive growth—Key questions and diagnostic tools for country
economists. PRMED.
Kundu, A., Sarangi, N., & Dash, B. (2003). Rural Non‐farm Employment: An Analysis of Rural Urban
Interdependencies (Working Paper 196). UK. London: Overseas Development Institute.
Lerman, R. & Yitzhaki, S. (1985). Income Inequality Effects by Income Source: A New Approach and
Applications to the United States. Review of Economics and Statistics, 67, 151‐156.

119
Lewis, B. (2010), “Impact of Demographic Change and Urbanization on Economic Growth in Indonesia” LKY School of Publicy Policy NUS Working Paper.
Lewis, B. & Pattinasarany, G.D.V. (2009). “Determining citizen satisfaction with local public education in
Indonesia: The significance of actual service quality and governance conditions” Growth and Change Journal, Vol 40 Issue 1.
Lipsey, R.G.; Karlaw, K. (2001). "What Does Total factor Productivity Measures?" Study Paper version 02.
Vancouver: Simon Fraser University

Sulawesi Development Diagnostic:hievingAc Shared Prosperity
wesaweweweweesi opmh evinghhiev