suitability of depleted gas reservoirs for geological co2
TRANSCRIPT

Suitability of depleted gas reservoirs for geological CO2 storage: A simulation study
Arshad Raza1, Raoof Gholami1, Reza Rezaee2, Amanat Ali Bhatti3, Chua Han Bing4, Vamegh Rasouli5
1-Department of Petroleum Engineering, Curtin University, Malaysia E-Mail: [email protected]
2-Department of Petroleum Engineering, Curtin University, Australia 3-Department of Petroleum and Gas Engineering, UET Lahore, Pakistan
4-Department of Chemical Engineering, Curtin University, Malaysia 5- Department of Petroleum Engineering, University of North Dakota, USA
Abstract
Hydrocarbon reservoirs, particularly depleted gas formations, are promising geological sites
for carbon dioxide (CO2) storage. Although there have been many studies on the storage
aspects of gas reservoirs, suitability of these formations in terms of fluid types such as dry,
wet, condensate have not been properly addressed at the reservoir level. In this study, an
attempt was made to evaluate different gas reservoirs in order to provide an insight into their
storage capabilities. A dynamic numerical simulation was done to simulate CO2 injection in a
synthetic but realistic model of a geologic formation having dry, wet or condensate gas. The
obtained results at particular conditions revealed that the condensate gas medium offers a
good storage potential, favorable injectivity and reasonable pressure buildup over a long
period of time, whilst dry gas formations were found to be the least favorable sites for storage
among gas reservoirs. A sensitivity analysis was done to evaluate the injection rate and
permeability variation of different media during and after storage. It was indicated that the
storage behavior of gas reservoirs is sensitive to the injection rate and selection of an
optimum injection rate may help to achieve a good storage capacity in condensate gas
systems. The results also highlighted that CO2 immobilization in gas reservoirs after injection
is enhanced due to the reduction of permeability, while no heterogeneity effect was observed
under different permeability realizations.
Keywords: CO2 storage, depleted gas reservoirs, numerical simulation, trapping mechanisms
1. Introduction
Capturing of Carbon dioxide (CO2) from the combustion of fossil fuels and injection it into
subsurface geologic formations for permanent storage has been widely recognized as one of
the reliable strategy to reduce the amount of CO2 emission into the atmosphere. Deep saline
aquifers, depleted oil and gas reservoirs, and coal-bed seams are possible sites for CO2
storage.1 However, depleted oil and gas reservoirs are often the best options as they already
hosted hydrocarbon for thousands of years. These petroleum fluids systems are generally
divided into five categories of black oil, volatile oil, condensate gas, wet gas, and dry gas. Out
of these categories, gas reservoirs which are classified into dry, wet and condensate gas
bearing formations2, 3 have gained the attention of many researchers in recent years as a
better place to store CO2 compared to oil reservoirs due to the high compressibility of gas.4, 5

For instance, Gorgon Carbon Dioxide Injection project in Australia has been initiated and is in
its construction phase for deployment of CO2 in a gas field. 6
There have been many studies carried out to show the potential of injecting CO2 into dry gas7-
15 and condensate gas reservoirs4, 16-19 using numerical modeling techniques. According to
these studies, the success of a CO2 storage practice is linked to the injection strategy, reservoir
characteristics and operational parameters. For instance, Oldenburg et al.15 studied the
storage by focusing on physical processes associated with injections through a numerical
simulation. The results obtained indicated that injection allows additional production of
methane during or after injection. Jikich et al.9 numerically considered the effects of the
injection strategy and operational parameters on CO2 storage. They concluded that injection
after field abandonment can provide a better recovery compared to injection at early stages.
In a similar study, Al-Hashami et al.7 showed that CO2 solubility in brine is favorable to delay
the breakthrough time and CO2 injection at later stages will be more effective in terms of
methane production. Polak and Grimstad.12 developed a numerical approach to evaluate CO2
storage in the Atzbach-Schwanenstadt gas field of Austria. They found a quick breakthrough
of CO2 which could ultimately limit production. They also reported that the reservoir pressure
stabilizes after the stoppage of injection and only 10% of injected CO2 dissolves in the
immobile reservoir water during 1500 years with leakage from other wells. Feather and
Archer.8 numerically analyzed the factors favorable to enhance natural gas recovery by
carbon dioxide injection for storage purposes. They considered well types, permeability,
reservoir geometry, injection timing, and injection rate in their modeling. They found that
vertical wells, reservoir geometry and low permeable isotropic homogeneous reservoirs are
favorable for a successful storage job. Pamukcu et al.14 focused on numerical modeling to
predict the short term (less than a decade) system performance of CO2 injection in the In-
Salah gas field. The indicated that CO2 can reach the northern part of the gas field in 2010 and
spread out over an area including production wells in 2015. Khan et al.10 illustrated the
potential of CO2 storage in natural gas reservoirs. Their simulation results indicated that
optimal timing of injection and different injection rates might be favorable to control the
breakthrough of CO2. Khan et al.11 performed numerical simulation to maximize enhanced
gas recovery in a natural gas reservoir by storage of CO2 and H2S. They concluded that CO2
breakthrough at the production well occurred faster than the breakthrough of mixed CO2–
H2S injection. Kühn et al.13 carried out a comprehensive assessment of the EGR potential of
the Altmark field and concluded that proper usage of storage capacity can mitigate the risk of
leakage during EGR and CO2 storage. Similarly, studies carried out on condensate gas
reservoirs are emphasizing the potentials of these geological formations as a suitable site for
CO2 storage. For instance, Azin et al.16 analyzed partial depleted gas reservoirs for CO2
storage. They suggested a scheme for storage purposes by selecting an optimum pressure or
injection of a high volume of gas at the early stage of injection for a suitable gas recovery.
Barrufet et al.4 evaluated the storage capacity of depleted condensate gas reservoirs and
aquifers by considering formation types, level of CO2 purity and injection schedules. They
concluded that CO2 injection recovers complete condensate which makes these reservoirs a

better place for storage compared to aquifers due to overall compressibility. Shen et al.18
investigated CO2 storage in nearly depleted gas reservoirs. They concluded that CO2 sinks into
the bottom of the gas cap and stores permanently when gas recovery by CO2 displacement
and condensate re-vaporization processes take place. Narinesingh and Alexander17 showed
that the injection pressure increases in high condensate recoveries due to the re-vaporization
of the condensate drop-out. According to Yuan et al.19, a fast condensate recovery and CO2
storage can be achieved by combining the processes of enhanced recovery and storage at the
early stage of the field development.
Although the above studies confirmed the feasibility of dry and condensate gas reservoirs for
CO2 storage, there have been very limited number of researches assessing these reservoirs
for sequestration. This might be due to the complexity of key storage aspects of these
reservoirs such as injectivity, storage capacity, trapping mechanisms, and containment which
have not been fully understood.20 For instance, some gas reservoirs may cause loss of
injectivity, over pressurization or less CO2 immobilization as the mixture of CO2 with the
residual gas may change the properties of CO2 and gas mixture.15, 18, 21-23 In the meantime, CO2
mixing with resident gas depends on reservoir geometry, anisotropy, heterogeneity, injection
rate, time of injection, rock or fluid properties, and diffusion which can only be studied
through numerical modeling. In this paper, a 3D numerical model was built for gas reservoirs
based on the modified Peng-Robinson equation of state to explore their feasibility of a long-
term CO2 storage.
2. Methodology
2.1 Numerical simulation
Numerical simulations were performed by the help of Eclipse simulator which is an advanced
industry standard finite difference flow simulator developed by Schlumberger Limited. It is a
major tool used for compositional modeling of enhanced recovery processes and CO2 storage.
As mentioned earlier, injection after field depletion is the best scenario to sequester CO2 with
a better residual recovery.9, 17 Hence, simulation was run for a long term-storage to
investigate the compositional impact of different gas types on the storage of depleted gas
reservoirs.
In the first step, compositions of dry, wet and condensate gas at the depleted stage were
taken from the literature.22 Adisoemarta et al.22 used these compositions to calculate the
compressibility factor for storage purposes in depleted gas reservoirs. In the data preparation
stage by Adisoemarta et al.22, the hydrocarbon components were normalized to 1.0 mole and
the components were analyzed to find the median composition for each category of gas
reservoirs. Table 1 gives the normalized median compositions of each category of gas
reservoirs used for the purpose of this study.

Table 1. Mole composition of typical reservoir fluids in depleted gas reservoirs expressed as the mole fraction of hydrocarbon components22
Components Dry gas Wet gas Condensate (50psi)
CO2 0.0001 0.0001 0.0001
C1 0.9661 0.9002 0.2477
C2 0.0267 0.0475 0.0527
C3 0.0051 0.0203 0.0541
C4 0.0020 0.0102 0.0770
C5 0 0.0041 0.0667
C6 0 0.0035 0.0734
C7+ 0 0.014 0.4282
Total 1 1 1
Dry gas has a significant concentration of methane (C1) whilst the wet and condensate gases
have a remarkable amount of heptane’s-plus fractions (C7+). There are no phase changes in
dry and wet gases and, therefore, a median dry and wet gas compositions can be considered
as the compositions of gas at depleted reservoir conditions. This, however, is not the case for
retrograde gas, which undergoes a phase change at the reservoir condition. For the purpose
of this study, depleted condensate gas compositions at the pressure of 50 psi was taken into
consideration. This compositional gas data and the depletion pressure are favorable because
the pore pressure depletion of gas reservoirs is large.24
Three different compositions representing three different gas types, as given in Table 1, were
used to evaluate the suitability of gas reservoirs and describe the behavior of CO2 once mixed
with residual gases. A 0.0001 mole fraction from butane component of each gas was picked
to introduce CO2 in the modeling. The black oil PVT analysis by the PVTi module of Eclipse at
the reservoir temperature of 220 oF was carried out to confirm the gas type and generate
properties of each gas type including critical pressure, critical temperature, acentric factor
together with z-factor and binary coefficients. These properties are essential inputs to govern
the fluid properties for modeling the storage site. Figure 1 shows the phase diagrams of
considered gases, which confirms the fluid type with reference to the temperature condition,
position of critical point, and the envelop size as reported by McCain Jr2 and Terry and
Rogers3.

Figure 1. Phase diagram of dry gas (top), wet gas (middle) and
condensate gas (bottom)
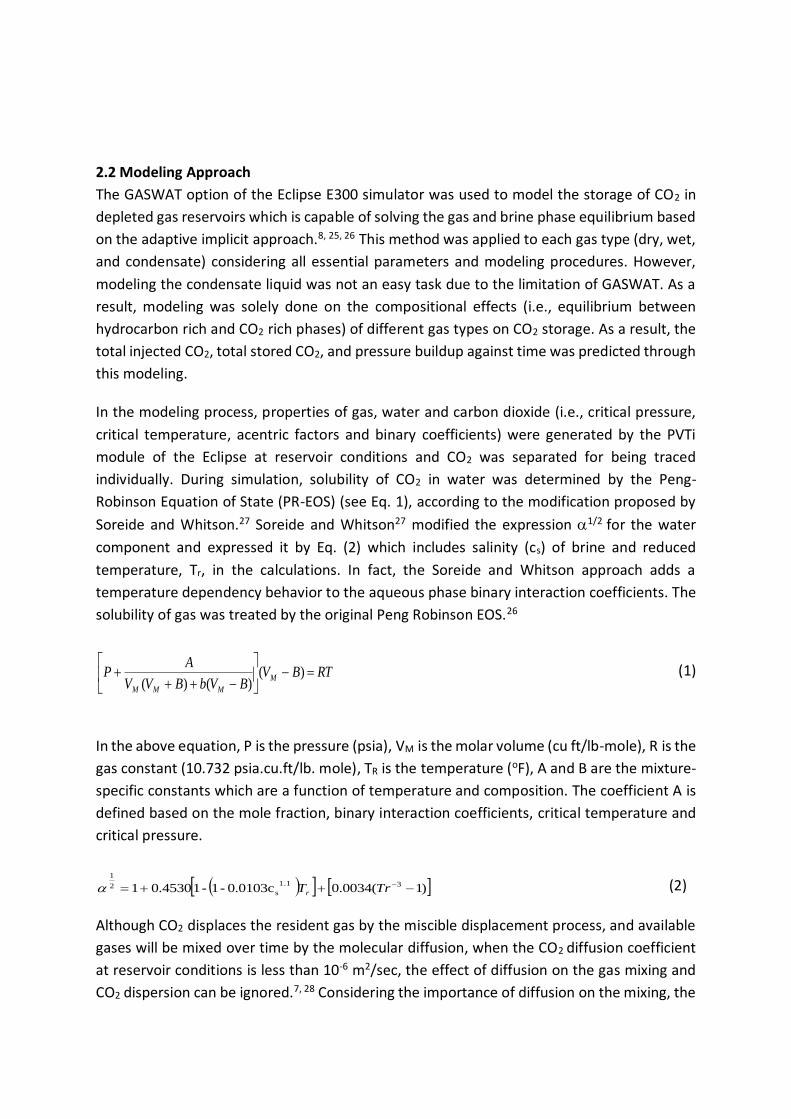
2.2 Modeling Approach
The GASWAT option of the Eclipse E300 simulator was used to model the storage of CO2 in
depleted gas reservoirs which is capable of solving the gas and brine phase equilibrium based
on the adaptive implicit approach.8, 25, 26 This method was applied to each gas type (dry, wet,
and condensate) considering all essential parameters and modeling procedures. However,
modeling the condensate liquid was not an easy task due to the limitation of GASWAT. As a
result, modeling was solely done on the compositional effects (i.e., equilibrium between
hydrocarbon rich and CO2 rich phases) of different gas types on CO2 storage. As a result, the
total injected CO2, total stored CO2, and pressure buildup against time was predicted through
this modeling.
In the modeling process, properties of gas, water and carbon dioxide (i.e., critical pressure,
critical temperature, acentric factors and binary coefficients) were generated by the PVTi
module of the Eclipse at reservoir conditions and CO2 was separated for being traced
individually. During simulation, solubility of CO2 in water was determined by the Peng-
Robinson Equation of State (PR-EOS) (see Eq. 1), according to the modification proposed by
Soreide and Whitson.27 Soreide and Whitson27 modified the expression 1/2 for the water
component and expressed it by Eq. (2) which includes salinity (cs) of brine and reduced
temperature, Tr, in the calculations. In fact, the Soreide and Whitson approach adds a
temperature dependency behavior to the aqueous phase binary interaction coefficients. The
solubility of gas was treated by the original Peng Robinson EOS.26
RTBVBVbBVV
AP M
MMM
)(
)()( (1)
In the above equation, P is the pressure (psia), VM is the molar volume (cu ft/lb-mole), R is the
gas constant (10.732 psia.cu.ft/lb. mole), TR is the temperature (oF), A and B are the mixture-
specific constants which are a function of temperature and composition. The coefficient A is
defined based on the mole fraction, binary interaction coefficients, critical temperature and
critical pressure.
)1(0.0034 0.0103c-1-10.45301 31.1
s2
1
TrTr (2)
Although CO2 displaces the resident gas by the miscible displacement process, and available
gases will be mixed over time by the molecular diffusion, when the CO2 diffusion coefficient
at reservoir conditions is less than 10-6 m2/sec, the effect of diffusion on the gas mixing and
CO2 dispersion can be ignored.7, 28 Considering the importance of diffusion on the mixing, the

molecular diffusion was introduced and considered as part of the analysis.29-31 This diffusion
ensures that gas interblocks diffusive flows by defining the diffusivity input for each
component25 which is obtained using Eqs. (3) and (4)
d
yDyJ ii
i
(3)
i
m
ggigD
diff
ig ybSDTF )( (4)
In Eq. (3), x is the total molar concentration (mol m-3), Ji is the flux of component i per unit
area (mol m2 s-1), Di is the diffusion coefficient of component I (m2 s-1), and ∂yi/∂d is the molar
concentration gradient of component i in the direction of flow (mole fraction). These diffusion
coefficients are used in the simulator module to obtain the gas interblock diffusive flows
expressed by Eq. (4). In Eq. (4), Fig is the interblock diffusive flow (mol/hour), TD is the
diffusivity (m2/s), and yi is the vapor mole fractions, Sg is the gas saturation (fraction), and m
pb
is the molar density of gas (mol/m3).
The relative permeability of water and gas (CO2) was determined based on the approach
presented by Oak.32 The relative permeability curves obtained are shown in Figure 2, having
69% of initial gas saturation, 40% of trapped gas saturation and 31% of connate water
saturation. It was then apparent that hysteresis effects are strong in the gas relative
permeability only. One may say that these data were generated for a brine-nitrogen gas
system under a low pore pressure condition32 and may not be suitable for a CO2 system. It
should be noted that this data has already been used to study the hysteresis of relative
permeability in saline aquifers33, and the value of residual gas saturation at 40% is within the
range of experimental values presented by Bennion and Bachu.35 GASWAT modeling is used
in order to model gas (CO2)/aqueous phase equilibriums for CO2 storage in depleted gas
reservoirs by utilizing the relative permeability and capillary pressure data of water and gas
(CO2) phases. Pure CO2 injection was made in water zone. Considering this facts, combinations
of gas and water relative permeability of CO2 injection in aquifer which are taken from Juanes
et al., 2006 was utilized to quantify the effect of different gas type in residual form on CO2
storage performance.
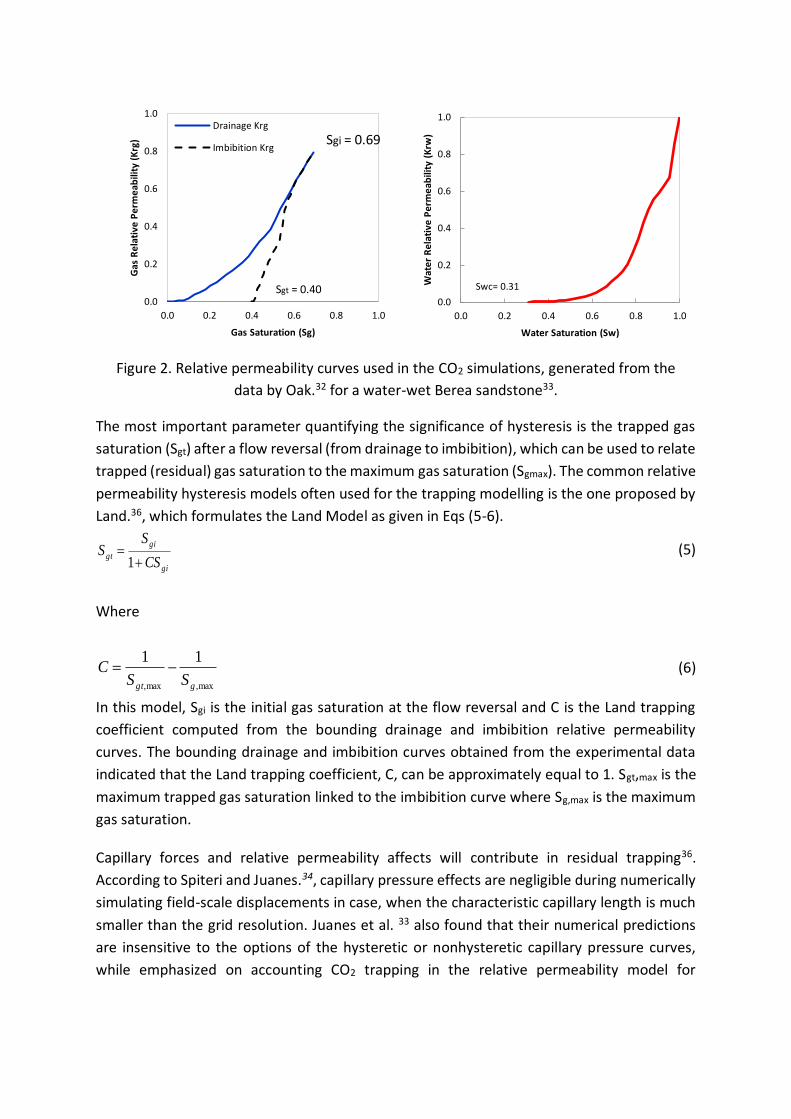
Figure 2. Relative permeability curves used in the CO2 simulations, generated from the
data by Oak.32 for a water-wet Berea sandstone33.
The most important parameter quantifying the significance of hysteresis is the trapped gas
saturation (Sgt) after a flow reversal (from drainage to imbibition), which can be used to relate
trapped (residual) gas saturation to the maximum gas saturation (Sgmax). The common relative
permeability hysteresis models often used for the trapping modelling is the one proposed by
Land.36, which formulates the Land Model as given in Eqs (5-6).
gi
gi
gtCS
SS
1 (5)
Where
max,max,
11
ggt SSC (6)
In this model, Sgi is the initial gas saturation at the flow reversal and C is the Land trapping
coefficient computed from the bounding drainage and imbibition relative permeability
curves. The bounding drainage and imbibition curves obtained from the experimental data
indicated that the Land trapping coefficient, C, can be approximately equal to 1. Sgt,max is the
maximum trapped gas saturation linked to the imbibition curve where Sg,max is the maximum
gas saturation.
Capillary forces and relative permeability affects will contribute in residual trapping36.
According to Spiteri and Juanes.34, capillary pressure effects are negligible during numerically
simulating field-scale displacements in case, when the characteristic capillary length is much
smaller than the grid resolution. Juanes et al. 33 also found that their numerical predictions
are insensitive to the options of the hysteretic or nonhysteretic capillary pressure curves,
while emphasized on accounting CO2 trapping in the relative permeability model for
0.0
0.2
0.4
0.6
0.8
1.0
0.0 0.2 0.4 0.6 0.8 1.0
Wat
er
Re
lati
ve P
erm
eab
ility
(K
rw)
Water Saturation (Sw)
Swc= 0.31
0.0
0.2
0.4
0.6
0.8
1.0
0.0 0.2 0.4 0.6 0.8 1.0
Gas
Re
lati
ve P
erm
eab
ility
(K
rg)
Gas Saturation (Sg)
Drainage Krg
Imbibition KrgSgi = 0.69
Sgt = 0.40

1
0.5
0
Sgi
Sgt(Sgi)
evaluation of the distribution and mobility of CO2 in the formation.33 Thus, we assumed
ignored capillary pressure data in the simulations presented here.
A relative permeability hysteresis model characterizes the scanning curves during imbibition
and drainage cycles. In this paper, the hysteresis model developed by Killough.37, were utilized
in which the gas relative permeability along a scanning curve, such as the one shown in Figure
3 is determined by using the expression given in Eqs (7,8). For a given value of Sg imax, the
trapped critical saturation and the relative permeability for a particular gas saturation, Sg, on
the scanning curve is calculated by using the expression given in Eqs. (7-8).33
)(
)()()(
max,
*
gi
d
rg
gi
d
rgib
rgg
i
rgSk
SkSkSk
g (7)
Where,
gtgi
gtgigtg
gtgSS
SSSSSS
))(( max,max,
max,
* (8)
In the above equations, kdrg and kib
rg represent the bounding drainage and imbibition curves,
respectively. Sg,max is the maximum gas saturation, and Sgt,max is the maximum trapped
saturation, associated with the bounding imbibition curve.
Figure 3. Parameters involved in the evaluation of the Land Trapping
model33
0 0.2 0.4 0.6 0.8 1
Gas
Rel
ativ
e P
erm
eab
ility
, Krg
Gas Saturation, Sg
Sgt,max
Sgmax
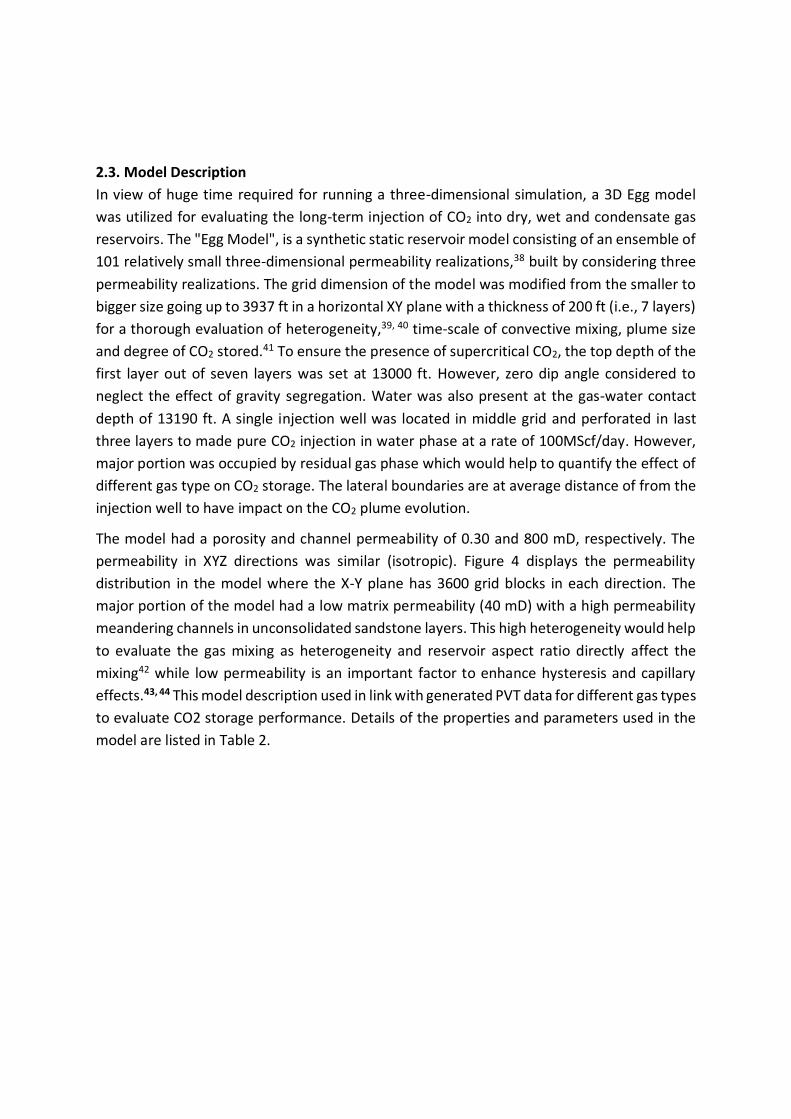
2.3. Model Description
In view of huge time required for running a three-dimensional simulation, a 3D Egg model
was utilized for evaluating the long-term injection of CO2 into dry, wet and condensate gas
reservoirs. The "Egg Model", is a synthetic static reservoir model consisting of an ensemble of
101 relatively small three-dimensional permeability realizations,38 built by considering three
permeability realizations. The grid dimension of the model was modified from the smaller to
bigger size going up to 3937 ft in a horizontal XY plane with a thickness of 200 ft (i.e., 7 layers)
for a thorough evaluation of heterogeneity,39, 40 time-scale of convective mixing, plume size
and degree of CO2 stored.41 To ensure the presence of supercritical CO2, the top depth of the
first layer out of seven layers was set at 13000 ft. However, zero dip angle considered to
neglect the effect of gravity segregation. Water was also present at the gas-water contact
depth of 13190 ft. A single injection well was located in middle grid and perforated in last
three layers to made pure CO2 injection in water phase at a rate of 100MScf/day. However,
major portion was occupied by residual gas phase which would help to quantify the effect of
different gas type on CO2 storage. The lateral boundaries are at average distance of from the
injection well to have impact on the CO2 plume evolution.
The model had a porosity and channel permeability of 0.30 and 800 mD, respectively. The
permeability in XYZ directions was similar (isotropic). Figure 4 displays the permeability
distribution in the model where the X-Y plane has 3600 grid blocks in each direction. The
major portion of the model had a low matrix permeability (40 mD) with a high permeability
meandering channels in unconsolidated sandstone layers. This high heterogeneity would help
to evaluate the gas mixing as heterogeneity and reservoir aspect ratio directly affect the
mixing42 while low permeability is an important factor to enhance hysteresis and capillary
effects.43, 44 This model description used in link with generated PVT data for different gas types
to evaluate CO2 storage performance. Details of the properties and parameters used in the
model are listed in Table 2.

Table 2: Reservoir and fluid properties used in this study
Symbol Variable Value Field Units
N Grid blocks 25200
Active blocks 18553
L Length 1200 feet
W Width 1200 feet
H Thickness 200 feet
Dtop Depth at the top of the injection well 13000 feet
α Dip degree 0
φ porosity 30 %
K Channel permeability 800 mD
D Molar concentration gradient of component
CO2 1.72 10-5 C1 1.61 10-5
C2 4.30 10-6 C3 4.30 10-6 C4 4.30 10-6 C5 4.30 10-6 C6 1.20 10-5 C7+ 1.40 10-6 Liquid 10-10
m2/sec
Cr Rock compressibility 2×10⁻⁷
Swc Connate water saturation 31 %
Pini Initial reservoir pressure 50 psi
S Salinity 15000 ppm
Temp Temperature 220 oF
Qg Gas injection rate 100 MScf/day
S Skin 0
PV Initial pore volume 6.6 Billion tons (Bt)
xCO2 CO2 mole fraction 1 Mole fraction
Pmax(inj) Maximum injection pressure 4500 psi
T Injection time Simulation time
5 1000
years years
Figure 4: Top view of the egg shaped reservoir model displaying a
typical structure of high-permeability meandering channels (800 mD) in
a low permeability blue background matrix (<40 mD)

2.4. Initial conditions for simulation During the simulation, the volumetric gas reservoir was assumed to be at the end of the gas
production. There were only brine and gas phases in the reservoir before CO2 injection having
pressure of 50 psi and a gas-water contact at a particular datum depth of 13150 ft. The
temperature was assigned to be 220 oF, while the initial gas saturation at the depleted stage
for dry, wet and condensate gas cases were respectively 0.19. 0.14, 0.11 fractions. Prior to
CO2 injection, the remaining gas at the depleted condition pressure of 50 psi was different in
various media. Thus, relative permeability data for residual gas phase is not required by
GASWAT module. During injection phase, drainage relative permeability data of CO2 and
water phases is used as injection is a drainage process. At the time of storage process,
imbibition relative permeability data of CO2 and water phases is acquired by GASWAT module.
Therefore, significant residual trapping is occurred after injection stops when water displaces
CO2. 33.Owing to this, relative permeability hysteresis data by Juanes et al. (2006) 33 accounting
for CO2 trapping was considered for predicting the distribution and mobility of CO2 in the
formation after injection stops. A well was considered for the injection of pure CO2 (i.e., 100
mole percent of CO2) under a maximum sustainable pressure of 4500 psi at a rate of
100MScf/day for 5 years. A skin equal to zero was considered near the well bore of the
injection well. To investigate the long-term storage of CO2 in the gas reservoirs, the simulation
was run for 1000 years.
3. Results and Discussions Quantifications of the storage aspects for formation reservoirs with different gas
compositions at particular conditions was evaluated in this study. Considering the simulation
conducted, it can be safely say that the results obtained are realistic since the actual protocol
adopted to carry out the simulation covers all possible factors included in the realistic
modeling of dry, wet and condensate gases compositions.
In order to investigate the interaction between different kinds of gases and CO2, three
simulation cases were generated and named as dry-base, wet-base and condensate-base.
Moreover, the effect of the injection rate and heterogeneity during storage was also
evaluated. These three cases are neglecting the CO2-water-rock reaction for precipitation and
dissolution during injection due to the limitation of the simulator25 and low reactivity of
sandstone reservoirs.45
3.1. Temporal evolution of CO2 in different phases As mentioned earlier, there are four major trapping mechanisms for CO2 storage in a gas
reservoir. When CO2 is injected into a gas reservoir, initially displaces the brine and gas, mixes
with the resident gas and flows upwards by the buoyant force because it is less dense than
water. During this process, a fraction of CO2 is capillary trapped as the residual CO2 saturation
in narrow pore throats in a short-term scale. In a longer term, a significant amount of CO2
dissolves in brine and forms an immobilized dissolved phase. The dissolved CO2 can form
H2CO3(aq), HCO3−, and CO3
2− by interacting with brine which can change the pore geometry
due to the dissolution and precipitation of minerals in the reservoir. Some fractions of CO2

are also transformed into stable carbonate minerals (mineral phase) for the permanent
storage, but this mechanism was not taken into consideration during simulation by GASWAT
E300. During and after injection, trapping mechanisms play their role to store (immobilize)
the injected CO2, depending on the characteristics of the storage medium.46 Figure 5 (a)
indicates that the mass of CO2 storage in different gas mediums start to increase slowly till
the injection period of 5 years which is aligned with earlier study47. Once injection stops, mass
of CO2 stored due to the residual and dissolution trappings starts to decline for few years, but
sharply increases after that. Figure 5 (a) confirms that that the residual trapping and
dissolution trapping play crucial roles to achieve a favorable CO2 storage capacity. Condensate
gas, which has the maximum residual and dissolved CO2 saturations, shows the maximum
storage capacity during and after injection as discussed earlier22 Comparison of the dry base,
wet base, and the condensate base cases shows that the storage medium with condensate
gas has significant impact on the total storage capacity due to favorable residual and
dissolution trapping. This may indicate that high a compressible fluid like condensate gas is
favorable to immobilize large fraction of CO2 in the form of residual and dissolved phases.
Comparing the total injected mass of CO2 in Figure.5 (b), it can be seen that that the maximum
mass of CO2 was injected in the condensate base case and the least amount belongs to the
dry base case. The total amount of injected CO2 in all three cases was different ranging from
3.75 billion tonnes (Bt), 4.50 Bt, and 6.16 Bt for dry, wet and condensate base cases
respectively owing to the effect of the bottom-hole injection pressure and pressure
distribution in the reservoir. It seems that condensate gas with a lower remaining gas at the
depleted pressure would be more beneficial for enhancing the well injectivity by permitting
more CO2 to flow into the reservoir. It might be due to the high compressibility of condensate
gas at the depleted stage compared to dry and wet gases because condensate gas at 50 psi is
1.1 times more compressible than condensate at 500 psi for wet and dry gases.23
The pressure buildup due to CO2 injection is generally not a limiting parameter but must not
exceed the fracture initiation pressure of formations.47 In this study, the maximum injection
pressure was monitored in dry, wet and condensate gas media upon injection as shown in
Figure 5(c). Looking at this figure, it can be concluded that the pressure reaches its maximum
value in the dry base case but stays at its lowest magnitude in the condensate base case
regardless of the huge mass of CO2 which was injected and stored in the condensate gas
formation. This behavior of pressure in different gas mediums can be attributed to the
compressibility level of these gases. Figures 6 shows the percentage of CO2 in different phases
over time for all three cases of gas reservoirs.
As it is seen in this Figure, initially a large amount of CO2 resides in the reservoir, while some
amounts are residually trapped and dissolved at the early stage of injection. As injection
continuous, the amount of supercritical CO2 increases at the end of injection after 5 years in
which 38.2%, 42.5% and 65% of CO2 is trapped in dry, wet and condensate cases, respectively.
Residual and dissolved trapping are not significant and within the range of 8-20% in a short-
term geological sequestration of CO2. Moreover, the potential of residual phase trapping is
less than the dissolution in the base case of wet and condensate gases for a short-term

scenario. As time passes, the capillary phenomenon becomes significant resulting in the
increase of residual phase while dissolution takes place with a slow rate, enhancing CO2
residual trapping and dissolution in brine. On the other hand, CO2 in the supercritical phase is
reduced as time passes. At the end of 1000 years, the residual trapping becomes the main
mechanism of trapping and more than half of total CO2 injected is trapped. In a short or long
term scenario, the amount of supercritical CO2 is significant in the condensate gas medium
while it is very minor in a dry gas reservoir. However, all gas types show a great potential for
residual trapping relative to dissolution trapping in a long-term and the free CO2 phase is
residually trapped and decrease with time. Comparatively, the condensate gas reservoir
offers a significant immobilization in residual and dissolution phases (65.2%) during shut-in
period till 1000 years. Nevertheless, the pressure and molecular diffusivity play a major role
in the gas mixing, which can be attributed to the interactions of CO2 with gas components and
remaining gas saturation as explained earlier. It was also revealed that components other
than methane might enhance the residual and dissolution mechanisms as methane solely
support more dissolution compared to CO2, O2, SO2, H2S, and N2.49 However, the dry base case
doesn’t show any significant dissolution trapping even in the presence of high huge methane.
Although, the high percentage of supercritical phase in condensate base case relative to
others is a favorable option for injection and storage, it may initiate leakage due to its long
term contact with the caprock50, 51. Table 3 summarizes the material balances (total injected
CO2, stored CO2 and maximum pressure buildup) of dry base, wet base, and condensate base
cases.
0
1
2
3
4
5
0.0001 0.001 0.01 0.1 1 10 100 1000
Sto
red
CO
2M
ass
(Bt)
Time, years
Dry_base
Wet_base
Condensate_base
0
1
2
3
4
5
6
7
0.0001 0.001 0.01 0.1 1 10 100 1000
Tota
l CO
2 In
ject
ed M
ass
(Bt)
Time, years
Dry_base
Wet_base
Condensate_base

Figure 5. (a) Comparison of gas mediums for total mass of CO2 stored at different time intervals; (b) The total injected CO2 mass vs time; (c) The maximum pressure buildup vs time
Generally, the condensate gas type has a high compressibility and as such it offers a larger
storage capacity compared to dry and wet gas type22, 23 as also evident in Figure 6. A similar
conclusion was made by Sobers et al.23, where the large storage capacity of condensate gas
reservoirs was attributed to the phase behavior of the condensate gas-CO2 mixture23, good
injectivity due to a high compressibility, low remaining gas, and small amount of methane
mole fractions. Although the effect of the condensate liquid was not included in the analysis
of this study due to the limitation of GASWAT, it seems that it could further enhance the
storage space23 and recovery by re-vaporization.17
CO2 supercritical phase
Residual Phase
Dissolved Phase
Figure 6. Percentage of CO2 in different phases after 5 years and 1000
years in dry gas, wet gas and condensate gas reservoirs
0
1,000
2,000
3,000
4,000
5,000
0.0001 0.001 0.01 0.1 1 10 100 1000
Max
miu
m p
ress
ure
incr
ease
(psi
)
Time, years
Dry_base
Wet_base
Condensate_base
38.2%
9.5%
8.9%
Dry_5yr
43.6%12.4%
12.8%
Wet_5yr
66.4%
8.5%
18.1%
Condensate_5yr
17.2%
29.6%
9.8%
Dry_1000yr
20.3%
32.7%
15.8%
Wet_1000yr
27.8%
45.7%
19.5%
Condensate_1000yr

Table 3: Summary of the gas type effect on cumulative injected CO2, total stored CO2, and
maximum pressure buildup Case Gas Type CONSTRAINTS Inj. Rate
(MScf/D) Cum. CO2
Injected (Bt)
CO2 amount in 1000 years (Bt) Maximum pressure buildup, psi
BHP (psia)
Inj. Time (years)
Supercritical free phase
Stored CO2 as Residual phase
Stored CO2 as Dissolved in brine
Base Case
Dry 5000 5 100 3.75 1.14 1.96 0.65 4496 Wet 5000 5 100 4.55 1.34 2.16 1.05 3307
Condensate 5000 5 100 6.16 1.84 3.03 1.29 2671
3.2. Spatial evolution of CO2 mixing Pressure built up near the injection well was expected during injection, resulting in generation
of a high saturation region near the wellbore which smoothly depleted towards the reservoir.
This build-up slowly decreases after the stoppage of injection in 5 years for all base cases (dry,
wet, condensate), although gas mixing may play an important role in this reduction. According
to Oldenburg28, gas mixing in the medium increases with pressure, which depend on rock and
fluid properties, may result in different compositions of CO2 phases. This is clearly observed
in Figures 7 and 8 which are demonstrating the maximum pressure build up near the injection
well and CO2 saturation in the reservoir, respectively. Overall, the results obtained from
saturation and pressure build up are aligned with what was shown in Figure 5. Figure 9 shows
the distribution of CO2 mixed with gas in the top layer of the model for all three cases after 5
and 1000 years. Dry base
Wet base

Condensate base
Figure 7. Cross section view of the reservoir for maximum pressure build at the end of 1000
years near the wellbore in dry base, wet base, and condensate base cases

Figure 8. Cross section view of the reservoir for CO2 saturation distribution near the
wellbore in the dry base (top), wet base (middle), and condensate base (bottom)
cases after 5 years (left) and 1000 years (right) of storage. Red strip shows the high
gas saturation near the wellbore
The contours shown in Figures 8 and 9 indicates that once injected, CO2 quickly moves away
from the injection site into the high permeable area and slowly spreads into the surrounding
low permeable portions. The fraction in the blue zone is very small after displacing the
remaining gas during the first 5 years in all three base cases. During the whole process in three
cases, the low permeable and high heterogeneous areas are holding a low saturation over a
short to long term period of time.
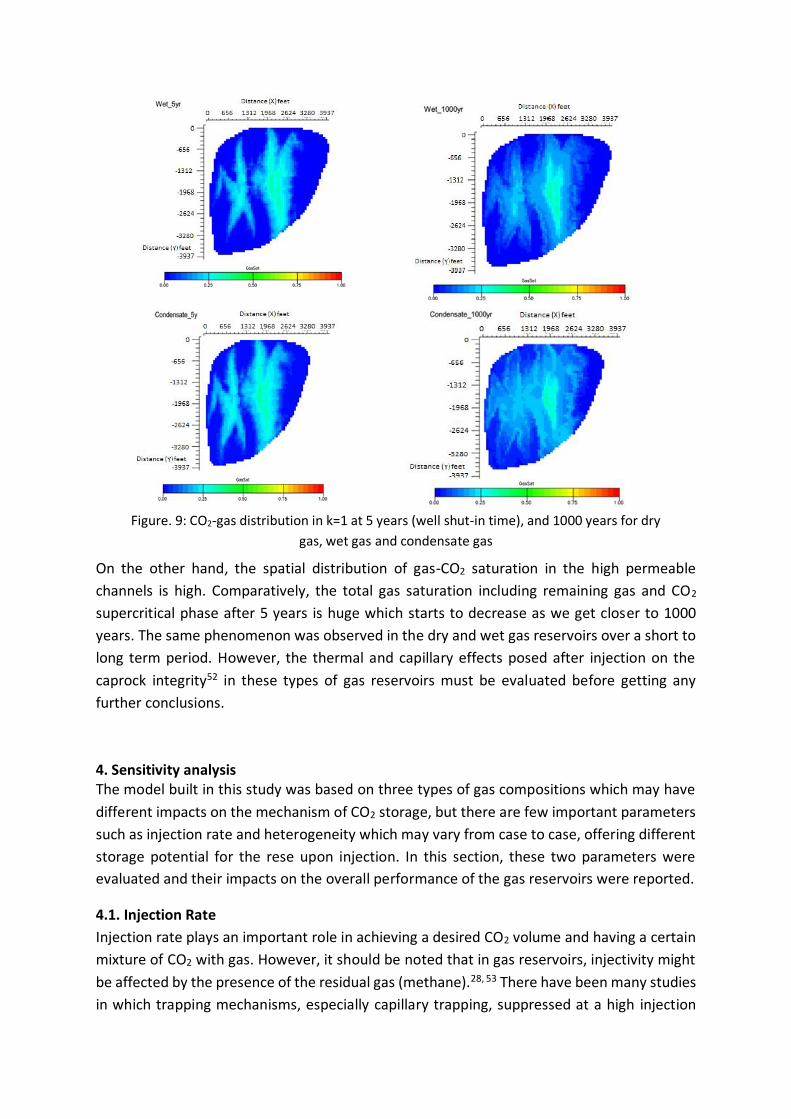
Figure. 9: CO2-gas distribution in k=1 at 5 years (well shut-in time), and 1000 years for dry
gas, wet gas and condensate gas
On the other hand, the spatial distribution of gas-CO2 saturation in the high permeable
channels is high. Comparatively, the total gas saturation including remaining gas and CO2
supercritical phase after 5 years is huge which starts to decrease as we get closer to 1000
years. The same phenomenon was observed in the dry and wet gas reservoirs over a short to
long term period. However, the thermal and capillary effects posed after injection on the
caprock integrity52 in these types of gas reservoirs must be evaluated before getting any
further conclusions.
4. Sensitivity analysis The model built in this study was based on three types of gas compositions which may have
different impacts on the mechanism of CO2 storage, but there are few important parameters
such as injection rate and heterogeneity which may vary from case to case, offering different
storage potential for the rese upon injection. In this section, these two parameters were
evaluated and their impacts on the overall performance of the gas reservoirs were reported.
4.1. Injection Rate
Injection rate plays an important role in achieving a desired CO2 volume and having a certain
mixture of CO2 with gas. However, it should be noted that in gas reservoirs, injectivity might
be affected by the presence of the residual gas (methane).28, 53 There have been many studies
in which trapping mechanisms, especially capillary trapping, suppressed at a high injection

rate.54-57 Considering these facts, a low (50 MScf/D) and high injection rates (150 MScf/D)
were selected and compared to evaluate different gas reservoirs against the variation of
injection rate. The results obtained from running the numerical model for 5 and 1000 years
indicated that at a low injection rate of 50MScf/D, the storage capacity of the dry gas medium
is more than the wet gas case but less than the condensate gas system. The storage potential
of the dry gas reservoir at the high injection rate seems to be the lowest and that of the
condensate gas would be the highest similar to the base case. Thus, it was concluded that
storage potential is sensitive to the gas type. At different rates, the condensate gas medium
shows a high potential compared to other two cases if the mass of CO2 stored is compared.
This highlights the fact that an optimum injection rate may help to achieve a good capacity in
condensate gas systems. Figure 10a shows the amount of CO2 stored in different gas
reservoirs at low and high injection rates.
As it is seen in Figure 10b, the total amount of CO2 injected increases gradually at early stages
(after 5 years) and stabilized once injection stops. However, the total injected CO2 is low in
the dry and wet gas systems compared to the condensate gas medium at the low injection
rate. A very similar trend exists at the high injection rate, but the amount of CO2 injected was
clearly lower than the low injection rate as shown in Figure 10b. It worth to mention that a
large amount of CO2 is injected at a high injection rate in the wet and condensate gas cases
compared to the wet base and the condensate base cases. On the contrary (see Figure 10a),
lesser amount of CO2 was stored in these two gas systems through residual and dissolution
trappings at the high injection rate of 150 MScf/D compared to the results obtained from the
injection rate of 100 MScf/D. This might be related to the effect of high injection rate which
suppresses the residual trapping and dissolution trapping potentials55,56 and as such a huge
amount of CO2 appears under supercritical condition.
0
1
2
3
4
5
0.0001 0.001 0.01 0.1 1 10 100 1000
Sto
red
CO
2M
ass
(Bt)
Time, years

Figure. 10: (a) Comparison of gas mediums for total mass of CO2 stored at different time; (b)
The total injected CO2 mass vs time; (c) The maximum pressure buildup vs time at different
injection rates (50 MScf/D, 100 MScf/D and 150 MScf/D)
It was also found that the trends of pressure build up in the gas mediums slowly increases up
until the end of injection periods47, regardless of injection rate chosen. The trend of pressure
increase in at a low injection rate is similar but quantitatively less than the one observed in
bases cases. The most important observation was the pressure build up at a high injection
rate which was maximum for all gas formations approaching to the pressure build up
observed at 5 years in the dry base case (see Figure 10c). Thus, it could be concluded that
selection of an appropriate gas medium plays an important role to achieve a favorable storage
potential with lesser mobile CO2 and lower pressure build up.
4.2. Heterogeneity
Heterogeneity may have impacts on the multiphase flow of CO2-brine58 and can be expressed
in terms of permeability variation.28 The storage capacity is linked to heterogeneities and
porosity, whilst injectivity is related to petrophysical properties such as permeability. 59 To
0
1
2
3
4
5
6
7
8
9
0.0001 0.001 0.01 0.1 1 10 100 1000
Tota
l CO
2In
ject
ed M
ass
(Bt)
Time, years
0
500
1,000
1,500
2,000
2,500
3,000
3,500
4,000
4,500
5,000
0.0001 0.001 0.01 0.1 1 10 100 1000
Max
miu
m p
ress
ure
incr
ease
(p
si)
Time, years
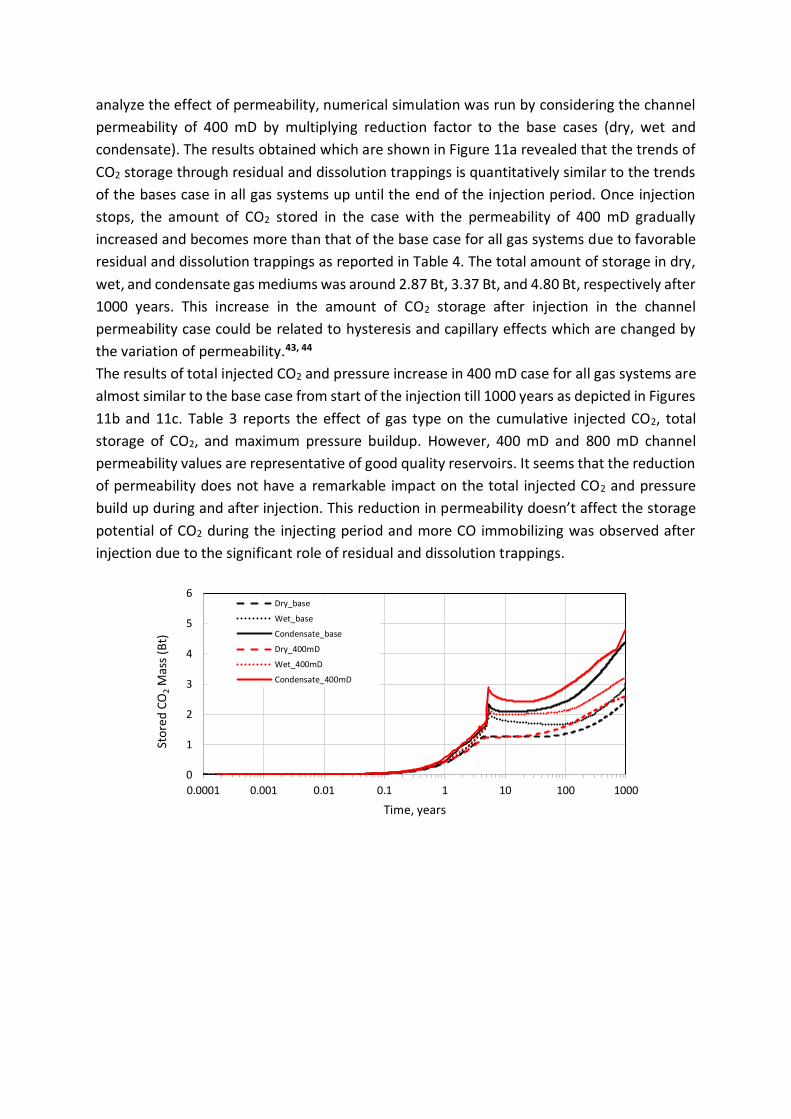
analyze the effect of permeability, numerical simulation was run by considering the channel
permeability of 400 mD by multiplying reduction factor to the base cases (dry, wet and
condensate). The results obtained which are shown in Figure 11a revealed that the trends of
CO2 storage through residual and dissolution trappings is quantitatively similar to the trends
of the bases case in all gas systems up until the end of the injection period. Once injection
stops, the amount of CO2 stored in the case with the permeability of 400 mD gradually
increased and becomes more than that of the base case for all gas systems due to favorable
residual and dissolution trappings as reported in Table 4. The total amount of storage in dry,
wet, and condensate gas mediums was around 2.87 Bt, 3.37 Bt, and 4.80 Bt, respectively after
1000 years. This increase in the amount of CO2 storage after injection in the channel
permeability case could be related to hysteresis and capillary effects which are changed by
the variation of permeability.43, 44
The results of total injected CO2 and pressure increase in 400 mD case for all gas systems are
almost similar to the base case from start of the injection till 1000 years as depicted in Figures
11b and 11c. Table 3 reports the effect of gas type on the cumulative injected CO2, total
storage of CO2, and maximum pressure buildup. However, 400 mD and 800 mD channel
permeability values are representative of good quality reservoirs. It seems that the reduction
of permeability does not have a remarkable impact on the total injected CO2 and pressure
build up during and after injection. This reduction in permeability doesn’t affect the storage
potential of CO2 during the injecting period and more CO immobilizing was observed after
injection due to the significant role of residual and dissolution trappings.
0
1
2
3
4
5
6
0.0001 0.001 0.01 0.1 1 10 100 1000
Sto
red
CO
2M
ass
(Bt)
Time, years
Dry_base
Wet_base
Condensate_base
Dry_400mD
Wet_400mD
Condensate_400mD

0
500
1000
1500
2000
2500
3000
3500
4000
4500
5000
0.0001 0.001 0.01 0.1 1 10 100 1000
Max
miu
m p
ress
ure
incr
ease
(p
si)
Time, years
Dry_base
Wet_base
Condensate_base
Dry_400mD
Wet_400mD
Condensate_400mD
Figure. 11. (a) Comparison of gas mediums for total mass of CO2 stored at different
time for bases case and case_400mD; (b) The total injected CO2 mass vs time for
bases case and case_400mD; (c) The maximum pressure buildup vs time for bases
case and case_400mD
Table 4: Comparing the effect of the gas type on cumulative injected CO2, total stored CO2, and maximum pressure buildup
Case Gas Type CONSTRAINTS Inj. Rate (MScf/D)
Cum. CO2
Injected (Bt)
CO2 amount in 1000 years (Bt) Maximum pressure buildup
BHP (psia)
Inj. Time (years)
Supercritical free phase
Stored CO2 as Residual phase
Stored CO2 as Dissolved in brine
Base Case
Dry 5000 5 100 3.75 1.14 1.96 0.651 4496
Wet 5000 5 100 4.55 1.34 2.16 1.05 3307
Condensate 5000 5 100 6.16 1.84 3.03 1.29 2671
400mD Dry 5000 5 100 3.75 0.88 2.20 0.67 4481
Wet 5000 5 100 4.56 1.19 2.30 1.07 3328
Condensate 5000 5 100 6.17 1.37 3.30 1.50 2670
0
1
2
3
4
5
6
7
0.0001 0.001 0.01 0.1 1 10 100 1000
Tota
l CO
2In
ject
ed M
ass
(Bt)
Time, years
Dry_base
Wet_base
Condensate_base
Dry_400mD
Wet__400mD
Condensate_400mD

To assess CO2 injection into heterogeneous media, two different permeability realizations
were considered, as shown in Figure 12, and simulations were run under the same conditions
as before. The average channel permeability in these two realizations was 913 mD and 798
mD. The values of permeability in different directions are given in Table 5. As discussed earlier,
the heterogeneity factor is related to the gas mixing upon CO2 injection. Figure 13 shows the
results obtained from two different permeability realizations governing the behavior of CO2
injection.
From Figure13, similar trends for the cumulative amount of CO2 stored and injected are
observed during and after injection in all gas systems which are almost the same trends
obtained from the base case. However, little fluctuation in the cumulative amount of CO2
stored was observed for both permeability realizations (R1 and R2) after the injection period
which could be related to the effect of heterogeneity on residual and dissolution trappings.
Looking at Table 6, the obtained results for permeability realizations are almost similar to the
base case under similar injection conditions. It was then concluded that heterogeneity may
not have a significant impact on the storage mechanism of CO2 in dry, wet and condensate
gas systems. However, the permeability variation such as 400mD (see Figure 11) or the one
close to a poor-quality storage medium (<10 mD) may offer different storage potentials under
certain conditions.
Table 5: Permeability values in different directions in the given realizations
Permeability Realization Kh
(mD)
Kv
(mD)
Kz
(mD)
Kavg
(mD)
R1 1300 1310 130 913
R2 1140 1140 114 798
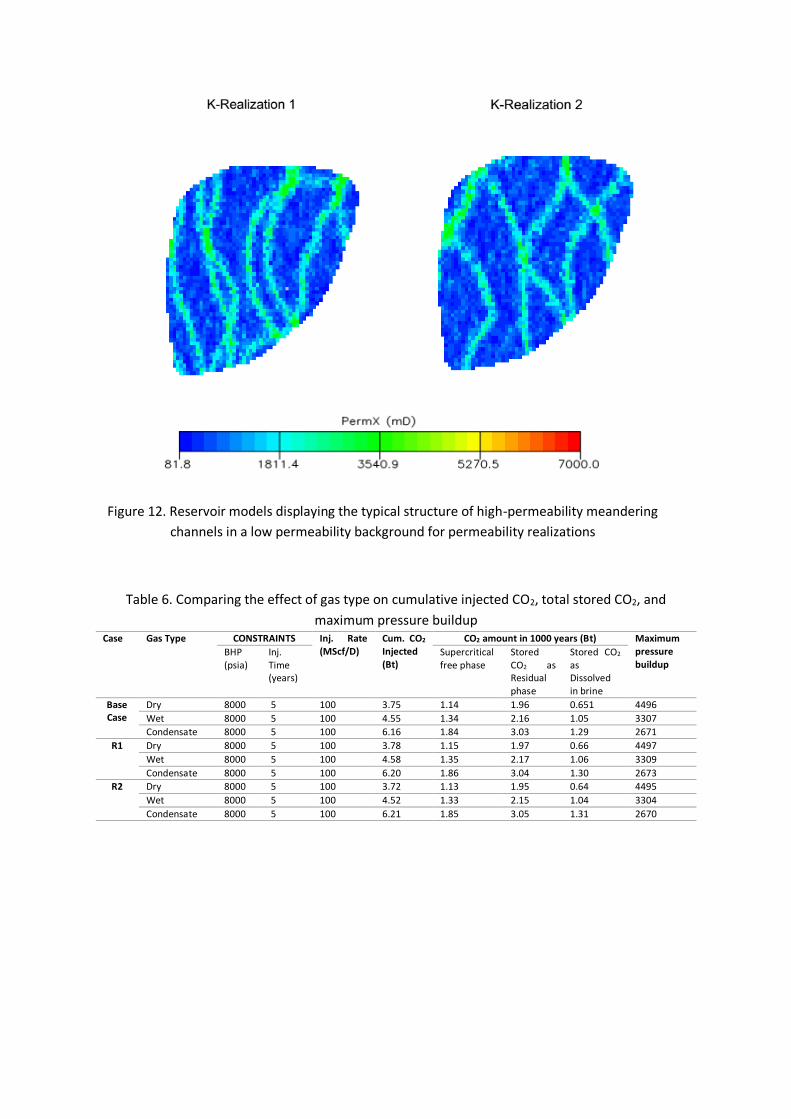
Figure 12. Reservoir models displaying the typical structure of high-permeability meandering
channels in a low permeability background for permeability realizations
Table 6. Comparing the effect of gas type on cumulative injected CO2, total stored CO2, and
maximum pressure buildup Case Gas Type CONSTRAINTS Inj. Rate
(MScf/D) Cum. CO2
Injected (Bt)
CO2 amount in 1000 years (Bt) Maximum pressure buildup
BHP (psia)
Inj. Time (years)
Supercritical free phase
Stored CO2 as Residual phase
Stored CO2 as Dissolved in brine
Base Case
Dry 8000 5 100 3.75 1.14 1.96 0.651 4496
Wet 8000 5 100 4.55 1.34 2.16 1.05 3307
Condensate 8000 5 100 6.16 1.84 3.03 1.29 2671
R1 Dry 8000 5 100 3.78 1.15 1.97 0.66 4497
Wet 8000 5 100 4.58 1.35 2.17 1.06 3309
Condensate 8000 5 100 6.20 1.86 3.04 1.30 2673
R2 Dry 8000 5 100 3.72 1.13 1.95 0.64 4495
Wet 8000 5 100 4.52 1.33 2.15 1.04 3304
Condensate 8000 5 100 6.21 1.85 3.05 1.31 2670

Figure 13: Comparing the amount of CO2 stored in different gas formations based
on two permeability realizations
0
1
2
3
4
5
0.0001 0.001 0.01 0.1 1 10 100 1000
Sto
red
CO
2M
ass
(Bt)
Time, years
Dry_baseWet_baseCondensate_baseDry_R1Wet_R1Condensate_R1Dry_R2Wet_R2Condensate_R2
0
1
2
3
4
5
6
7
0.0001 0.001 0.01 0.1 1 10 100 1000
Tota
l CO
2In
ject
ed M
ass
(Bt)
Time, years
Dry_baseWet_baseCondensate_baseDry_R1Wet_R1Condensate_R1Dry_R2Wet_R2Condensate_R2
0
1000
2000
3000
4000
5000
0.0001 0.001 0.01 0.1 1 10 100 1000
Max
miu
m p
ress
ure
incr
ease
(p
si)
Time, years
Dry_baseWet_baseCondensate_baseDry_R1Wet_R1Condensate_R1Dry_R2Wet_R2Condensate_R2

5. Conclusions
A numerical model was built in this study for gas reservoirs to evaluate the long-term storage
of CO2 in gas reservoirs by considering representative compositions of dry, wet and
condensate gases. It appears that gases reservoirs have a good potential for CO2
immobilization in a long-term, but the condensate gas formations would be the best among
all three. This could be attributed to the slight remaining gas volume, phase behavior of the
condensate gas-CO2 mixture, good injectivity, and lesser amount of methane mole fractions
present in the medium.
A sensitivity analysis was performed to evaluate the variation of the injection rate and
heterogeneity on CO2 storage. It was found that the gas medium storage behavior is sensitive
to the injection rate. Selection of an optimum injection rate could help to achieve a high
storage potential in gas reservoirs, particularly in condensate gas mediums. Particularly, a
high injection rate would also be beneficial for wet gas media to provide a good storage
capacity. The results obtained also revealed that reduction in the permeability of the storage
site enhances the overall storage capacity by boosting the residual and dissolution trappings
after the injection period. Finally, it was concluded that the medium with condensate gas is a
more favorable place for storage compared to mediums with dry gas and wet gas.
Nomenclature
k Permeability µ Fluid viscosity
cr Formation compressibility
Porosity c
pniF Flow rate component in a phase (p=o, w, g)
Tni Transmissibility between cells n and i c
py Mole fraction of component c in phase p
krp Relative permeability of phase Sp Saturation of phase p
m
pb Molar density of phase p
p Viscosity of phase p
dPpni Potential difference of phase p between cells n and I, given by CO2 Carbon dioxide N2 Nitrogen O2 Oxygen SO2 Sulfur dioxide H2S Hydrogen sulfide P Pressure VM Molar volume R Gas constant T Temperature
A, B Mixture-specific functions of T and composition with the mixing rules
Tr Reduced temperature Cs Salinity bqi Soreide and Whitson constants Ji Flux of component i per unit area Di Diffusion coefficient of component I, ∂yi/∂d Molar concentration gradient of component i. Fig Interblock diffusive flow

TD Diffusivity, the analogue of transmissibility for diffusive flow yi Vapor mole fractions. Sg Gas saturation Sgi Initial gas saturation C Land trapping coefficient Sg,max Maximum gas saturation Sgt, max Maximum trapped gas saturation Kd
rg bounding drainage curve Kib
rg bounding imbibition curves BScf Billion standard cubic feet Bt Billion tones
Acknowledgment
This work was funded by Curtin Sarawak Research Institute (CSRI) of Curtin University
Malaysia under the grant number CSRI-6015. We also acknowledge Schlumberger Malaysia
for providing Petrel tool and Eclipse compositional simulator.
References
1. Bachu S, Gunter W, Perkins E. Aquifer disposal of CO2: hydrodynamic and mineral
trapping. Energy Conversion and Management 35(4):269-79 (1994).
2. McCain Jr WD. Heavy components control reservoir fluid behavior. Journal of Petroleum Technology 46(09), 746-750 (1994).
3. Terry RE, Rogers JB. Applied petroleum reservoir engineering. Pearson hall: Pearson Education; (2013).
4. Barrufet MA, Bacquet A, Falcone G. Analysis of the storage capacity for CO2 sequestration of a depleted gas condensate reservoir and a saline aquifer. Journal of Canadian Petroleum Technology 49(08):23-31 (2010).
5. Bachu S. Evaluation of CO2 sequestration capacity in oil and gas reservoirs in the Western Canada Sedimentary Basin. Alberta Geological Survey, Alberta Energy and Utilities Board March. (2004).
6. Institute GC. THE GLOBAL STATUS OF CCS | 2016 SUMMARY REPORT. 2016:9-10.
7. Al-Hasami A, Ren S, Tohidi B, editors. CO2 injection for enhanced gas recovery and geo-storage: reservoir simulation and economics. SPE Europec/EAGE Annual Conference, Spain, Society of Petroleum Engineers, (2005):
8. Feather B, Archer R, editors. Enhance natural gas recovery by carbon dioxide injection for storage purposes. Australia Fluid Mechanics Conference, Auckland, New Zealand, (2010).
9. Jikich SA, Smith DH, Sams WN, Bromhal GS, editors. Enhanced Gas Recovery (EGR) with carbon dioxide sequestration: A simulation study of effects of injection strategy and operational parameters. SPE Eastern Regional Meeting, Pennsylvania, 1-9, (2003).
10. Khan C, Amin R, Madden G. Carbon dioxide injection for enhanced gas recovery and storage (reservoir simulation). Egyptian Journal of Petroleum 22(2):225-40 (2013).
11. Khan C, Amin R, Madden G. Effects of CO2 and acid gas injection on enhanced gas recovery and storage. Journal of Petroleum Exploration and Production Technology, 3(1):55-60 (2013).
12. Polak S, Grimstad A-A. Reservoir simulation study of CO2 storage and CO2-EGR in the Atzbach–Schwanenstadt gas field in Austria. Energy procedia 1(1):2961-8 (2009).
13. Kühn M, Förster A, Großmann J, Lillie J, Pilz P, Reinicke KM, et al. The Altmark Natural Gas Field is prepared for the Enhanced Gas Recovery Pilot Test with CO2. Energy Procedia. 37(Supplement C):6777-85 9 (2013).
14. Pamukcu Y, Hurter S, Jammes L, Vu-Hoang D, Pekot L. Characterizing and predicting short term performance for the In Salah Krechba field CCS joint industry project. Energy Procedia 4(0):3371-8 (2011).
15. Oldenburg C, Pruess K, Benson SM. Process modeling of CO2 injection into natural gas reservoirs for carbon sequestration and enhanced gas recovery. Energy & Fuels 15(2):293-8 (2001).
16. Azin R, Nasiri A, Entezari J. Underground gas storage in a partially depleted gas reservoir. Oil & Gas Science and Technology-Revue de l'IFP.;63(6):691-703 (2008).
17. Narinesingh J, Alexander D. CO2 enhanced gas recovery and geologic sequestration in condensate reservoir: A simulation study of the effects of injection pressure on condensate recovery from reservoir and CO2 storage efficiency. Energy Procedia 63:3107-15 (2014).
18. Shen C-H, Hsieh B-Z, Tseng C-C, Chen T-L. Case study of CO2-IGR and storage in a nearly depleted gas-condensate reservoir in Taiwan. Energy Procedia 63:7740-9 (2014).
19. Yuan C, Zhang Z, Liu K. Assessment of the recovery and front contrast of CO2 EOR and sequestration in a new gas condensate reservoir by compositional simulation and seismic modeling. Fuel 142:81-6 (2015).
20. IPCC. IPCC special report on carbon dioxide capture and storage. Prepared by Working Group III of the Intergovernmental Panel on Climate Change. Metz B, Davidson O, De Coninck H, Loos M, Meyer L, editors. Cambridge, United Kingdom and New York, NY, USA (2005).
21. Xiaoling S, Fangui Z, Hejuan L. CO2-CH4 system mixing properties and enhanced natural gas recovery. International Journal of Digital Content Technology & its Applications. 6(21):1-5 (2012).
22. Adisoemarta PS, Frailey SM, Lawal AS. Measured Z-Factor of CO2-Dry gas/wet gas/gas condensates for CO2 storage in depleted gas reservoirs. SPE/DOE Symposium on Improved Oil Recovery, Oklahoma 1-11; (2004).
23. Sobers L, Frailey S, Lawal A, editors. Geological sequestration of carbon dioxide in depleted gas reservoirs. SPE/DOE Symposium on Improved Oil Recovery, Oklahoma, Society of Petroleum Engineers (2004).
24. Loizzo M, Lecampion B, Bérard T, Harichandran A, Jammes L. Reusing O&G-depleted reservoirs for CO2 storage: Pros and Cons. SPE Projects, Facilities & Construction. 5(03):166-72 (2010).

25. Schlumberger. Technical Description 2014;2014.2.
26. Schlumberger. Reference Manual. 2014;2014.2.
27. Soreide I, Whitson CH. Peng-Robinson Predictions for Hydrocarbons, CO2, N2, and H2S with pure water and NaCI brine. Fluid Phase Equilibria;77:217-40 (1992).
28. Oldenburg CM. Carbon dioxide as cushion gas for natural gas storage. Energy & Fuels 17(1):240-6 (2003).
29. Hoteit H, Firoozabadi A. Numerical modeling of diffusion in fractured media for gas-injection and-recycling schemes. SPE Journal. 2009;14(02):323-37.
30. Alavian SA, Whitson CH, editors. Scale dependence of diffusion in naturally fractured reservoirs for CO2 injection. SPE Improved Oil Recovery Symposium, Oklahoma, USA; (2010).
31. Yanze Y, Clemens T. The role of diffusion for nonequilibrium gas injection into a fractured reservoir. SPE Reservoir Evaluation & Engineering 15, 60-71 (2012).
32. Oak MJ. Three-Phase Relative Permeability of Water-Wet Berea. In SPE/DOE Enhanced Oil Recovery Symposium. Society of Petroleum Engineers 1-12, (1990)
33. Juanes R, Spiteri E, Orr F, Blunt M. Impact of relative permeability hysteresis on geological CO2 storage. Water Resources Research, 42(12) (2006).
34. Spiteri, E. J, Juanes, R. Impact of relative permeability hysteresis on the numerical simulation of WAG injection,J. Pet. Sci. Eng.,50(2)(2006), 115 – 139
35. Bennion DB, Bachu S. Supercritical CO2 and H2S - Brine Drainage and Imbibition Relative Permeability Relationships for Intercrystalline Sandstone and Carbonate Formations. SPE: Society of Petroleum Engineers (2006).
36. Land CS. Calculation of imbibition relative permeability for two-and three-phase flow from rock properties. Society of Petroleum Engineers Journal 8(02):149-56 (1968).
37. Killough J. Reservoir simulation with history-dependent saturation functions. Society of Petroleum Engineers Journal 16(01):37-48 (1976).
38. Jansen JD, Fonseca RM, Kahrobaei S, Siraj M, Van Essen G, Van den Hof P. The Egg Model - data files. TU Delft. Dataset. http://dx.doi.org/10.4121/uuid:916c86cd-3558-4672-829a-105c62985ab2. (2013).
39. Kuo C-W, Perrin J-C, Benson SM. Simulation studies of effect of flow rate and small scale heterogeneity on multiphase flow of CO2 and brine. Energy Procedia 4(0):4516-23 (2011).
40. Hingerl FF, Yang F, Pini R, Xiao X, Toney MF, Liu Y, et al. Characterization of heterogeneity in the Heletz sandstone from core to pore scale and quantification of its impact on multi-phase flow. International Journal of Greenhouse Gas Control 48:69-83 (2016).
41. Han W, Kim K-Y, Esser R, Park E, McPherson B. Sensitivity study of simulation parameters controlling CO2 trapping mechanisms in saline formations. Transport in Porous Media.;90(3):807-29 (2011)
42. Connolly M, Johns RT. Scale-Dependent mixing for adverse mobility ratio flows in heterogeneous porous media. Transport in Porous Media 113(1):29-50 (2016).
43. Gershenzon NI, Ritzi RW, Dominic DF, Mehnert E, Okwen RT, Patterson C. CO2 trapping in reservoirs with fluvial architecture: Sensitivity to heterogeneity in permeability and constitutive relationship parameters for different rock types. Journal of Petroleum Science and Engineering (2016).
44. Gershenzon NI, Ritzi Jr RW, Dominic DF, Mehnert E, Okwen RT. Comparison of CO2 trapping in highly heterogeneous reservoirs with Brooks-Corey and van Genuchten type capillary pressure curves. Advances in Water Resources, 96:225-36 (2016).
45. Audigane P, Gaus I, Pruess K, Xu T, editors. A long term 2D vertical modelling study of CO2 storage at Sleipner (North Sea) using TOUGHREACT. Proceedings, TOUGH Symposium; (2006).
46. Raza A, Rezaee R, Gholami R, Bing CH, Nagarajan R, Hamid MA. A screening criterion for selection of suitable CO2 storage sites. Journal of Natural Gas Science and Engineering.;28:317-27 (2016).
47. Jalil, M., R. Masoudi, N.B. Darman, and M. Othman. Study of the CO2 injection storage and sequestration in depleted M4 carbonate gas condensate reservoir Malaysia. in Study of the CO2 injection storage and sequestration in depleted M4 carbonate gas condensate reservoir Malaysia. 2012. Carbon Management Technology Conference.
48. Raza A, Gholami R, Sarmadivaleh M, Tarom N, Rezaee R, Bing CH, et al. Integrity analysis of CO2 storage sites concerning geochemical-geomechanical interactions in saline aquifers. Journal of Natural Gas Science and Engineering, 36PA:224-40 (2016).
49. Ziabakhshganji Z, Kooi H, editors. Equation of State for thermodynamic equilibrium of gas mixtures and brines to allow simulation of the effects of impurities in CO2 storage. EGU General Assembly Conference Abstracts (2012).
50. Chiquet P, Broseta D, Thibeau S. Wettability alteration of caprock minerals by carbon dioxide. Geofluids, 7(2):112-22 (2007).
51. Shojai Kaveh N, Barnhoorn A, Wolf KH. Wettability evaluation of silty shale caprocks for CO2 storage. International Journal of Greenhouse Gas Control 49:425-35 (2016).
52. Vilarrasa V, Rutqvist J, Rinaldi AP. Thermal and capillary effects on the caprock mechanical stability at In Salah, Algeria. Greenhouse Gases: Science and Technology.;5(4):449-61 (2015).
53. Saeedi A, Rezaee R. Effect of residual natural gas saturation on multiphase flow behaviour during CO2 geo-sequestration in depleted natural gas reservoirs. Journal of Petroleum Science and Engineering, 82–83(0):17-26 (2012).
54. Soroush M, Wessel-Berg D, Kleppe J. Effects of Wetting Behaviour on Residual Trapping in CO2-Brine Systems. SPE: Society of Petroleum Engineers; (2013).
55. Wildenschild D, Armstrong RT, Herring AL, Young IM, Carey JW. Exploring capillary trapping efficiency as a function of interfacial tension, viscosity, and flow rate. Energy Procedia; 4:4945-52 (2011).
56. Shamshiri H, Jafarpour B. Controlled CO2 injection into heterogeneous geologic formations for improved solubility and residual trapping. Water Resources Research, 48(2) (2012).

57. Al Mansoori SK. Impact of carbon dioxide trapping on geological storage: Imperial College London; (2009).
58. Kuo C-W, Benson SM. Numerical and analytical study of effects of small scale heterogeneity on CO2/brine multiphase flow system in horizontal corefloods. Advances in Water Resources, 79(0):1-17 (2015).
59. Raza A, Rezaee R, Gholami R, Rasouli V, Bing CH, Nagarajan R, et al. Injectivity and quantification of capillary trapping for CO2 storage: A review of influencing parameters. Journal of Natural Gas Science and Engineering 26:510-7 (2015).

Arshad Raza Raoof Gholami Arshad Raza has B.Sc. and M.Sc. degrees in
Petroleum Engineering from UET, Lahore,
Pakistan. He had worked in Department of
Petroleum & Gas Engineering, UET Lahore,
Pakistan since 2010. He obtained his
Doctoral Degree from Curtin University,
Malaysia in 2017. His research areas are
Reservoir Characterization and CO2 Sequestration.
Raoof Gholami is a drilling and
geomechanical engineer in the
Department of Petroleum Engineering
at Curtin University, Malaysia. He
received his PhD from Shahrood
University of Technology, Iran in 2014.
He has done several projects related to
petroleum geomechanics for various
companies. His main research area of interests are wellbore
stability and integrity issues, rock characterizations, anisotropy
analysis and well path design. Reza Rezaee Chua Han Bing
Professor Reza Rezaee of Curtin’s Dept of
Petroleum Engineering has a PhD in
Reservoir Rharacterization. He has over 25
years’ experience in academia. His research
has been focused on integrated solutions for
reservoir characterization, formation
evaluation and petrophysics. Currently, he is
working on unconventional gas including gas
shale and tight gas sand reservoirs.
Dr. Chua is currently a senior faculty
member of the Chemical Engineering
Department at Curtin University,
Sarawak Malaysia. He obtained his
Doctoral Degree from Queen Mary
College, London University in 1983.
Prior to joining Curtin, Dr. Chua served
as a senior academic with a leading
tertiary institution in West Malaysia.
Ramasamy Nagarajan
Dr. R. Nagarajan is senior faculty member of
the Applied Geology Department at Curtin
University Sarawak Malaysia. He completed
his PhD at Anna University (India) in 2003.
His research area mainly focuses on
sediment and environmental geochemistry.