sugarcane yield and plant nutrient response to sulfur amended everglades histosols
TRANSCRIPT
Full Terms & Conditions of access and use can be found athttp://www.tandfonline.com/action/journalInformation?journalCode=lpla20
Download by: [University of Arkansas Libraries - Fayetteville] Date: 28 August 2016, At: 16:06
Journal of Plant Nutrition
ISSN: 0190-4167 (Print) 1532-4087 (Online) Journal homepage: http://www.tandfonline.com/loi/lpla20
Sugarcane Yield and Plant Nutrient Response toSulfur-Amended Everglades Histosols
Avjinder S. Kaler, J. Mabry McCray, Alan L. Wright & John E. Erickson
To cite this article: Avjinder S. Kaler, J. Mabry McCray, Alan L. Wright & John E. Erickson (2016):Sugarcane Yield and Plant Nutrient Response to Sulfur-Amended Everglades Histosols, Journalof Plant Nutrition, DOI: 10.1080/01904167.2016.1218024
To link to this article: http://dx.doi.org/10.1080/01904167.2016.1218024
Accepted author version posted online: 23Aug 2016.Published online: 23 Aug 2016.
Submit your article to this journal
Article views: 2
View related articles
View Crossmark data
ACCEPTED MANUSCRIPT
ACCEPTED MANUSCRIPT 1
Sugarcane Yield and Plant Nutrient Response to Sulfur-Amended Everglades Histosols
Avjinder S. Kaler1, J. Mabry McCray
2, Alan L. Wright
2 and John E. Erickson
3
1Department of Crop, Soil, and Environmental Science, University of Arkansas, Fayetteville, AR
72701
2Everglades Research and Education Center, Belle Glade, FL 33430
3Agronomy Department, University of Florida, Gainesville, FL 32611
Address Correspondence to Avjinder S Kaler and J Mabry McCray:([email protected] and
ABSTRACT
High soil pH causes leaf nutrient deficiencies and reduces sugarcane yield. Soil pH in Florida
Histosols has been increasing as these soils subside and depth to limestone is decreased. A
factorial experiment of 4 sulfur (S) rates and 3 added calcium carbonate (CaCO3) levels in soil
was designed to determine S-amendment effectiveness in reducing pH and increasing nutrient
availability in sugarcane as calcium (Ca) carbonate levels were increased. Sulfur-amendment and
increased CaCO3 level had limited effects on yield and leaf nutrient concentrations during the
growing season. Most leaf nutrients were within optimum range except nitrogen (N), phosphorus
(P), iron (Fe), and manganese (Mn). Unexpected increases in Mn concentrations with added
CaCO3 were associated with reducing conditions due to increased soil bulk density. High soil
pH caused Mn deficiencies in the plants. Soil pH, P and Mn concentrations were important
factors in predicting sugarcane yield.

ACCEPTED MANUSCRIPT
ACCEPTED MANUSCRIPT 2
Keywords and Abbreviations
EAA, Everglades Agricultural Area; S, Elemental Sulfur; CaCO3, Calcium Carbonate; Leaf
Nutrition Concentration; Yield.
ACCEPTED MANUSCRIPT
ACCEPTED MANUSCRIPT 3
INTRODUCTION
Sugarcane (Saccharum spp.) is the predominant row crop in south Florida with an approximate
cultivation of 162,000 ha per year. About 80% of this sugarcane is grown on the muck soil of
Everglades Agricultural Area (EAA) (Morgan et al., 2009). The EAA soils are Histosols and
typically contain 80% organic matter. These soils are high in nitrogen (N) content, but have low
available phosphorus (P) and micronutrient concentrations in their natural state. Nutrients of
particular concern for adequate nutrition of sugarcane in Florida soils are N, P, potassium (K),
magnesium (Mg), boron (B), copper (Cu), iron (Fe), manganese (Mn), silicon (Si), and zinc (Zn)
(Rice et al., 2010). Each nutrient has their own specific role in crop growth and production. Plant
nutrient availabilities are highly influenced by the deficiency or overabundance of any of these
nutrients and overabundance of one nutrient may limit the uptake of others. For example, Zn
availability can be limited due to high application of P fertilizers (Li et al., 2007). As observed in
alkaline soils, poor nutrient availability rather than low total nutrient content in the soil is one of
the major factors causing plant nutrient deficiency. High soil pH, which causes nutrient
deficiencies, can limit sugarcane yield (McCray and Rice, 2013). Sensible use of fertilizers
and/or amendments can improve nutrient balance in soil, resulting in increased crop yield and
enhanced fertilizer use efficiency. High pH of organic soils in the EAA reduces nutrient
availability to crops, especially P and micronutrients, and consequently affects the growth and
yield of the plants. Increased pH in these shallow soils is mostly due to the incorporation of
calcium carbonate (CaCO3) from underlying limestone bedrock because of tillage operations for
bed preparation and agricultural drainage (Snyder, 2005). Drainage and cultivation practices
increase soil organic matter (SOM) decomposition, which results in soil subsidence and
ACCEPTED MANUSCRIPT
ACCEPTED MANUSCRIPT 4
decreased soil depth; thus, increasing the influence from underlying limestone (CaCO3) bedrock.
Calcium carbonate, being the source of agricultural lime, increases soil pH. The current soil
subsidence rate is estimated at 1.5 cm per year (Wright and Snyder, 2009). Snyder, in 2005,
predicted that in 2050 nearly half of EAA soil would have soils less than 20 cm in depth, which
will not be suitable for sugarcane production. There are five main soil series in EAA depending
upon the depth to underlying limestone bedrocks and mineral contents; Dania, Lauderhill,
Pahokee, Terra Ceia, and Torry. Differences in soil depth results in variable amounts of mixed
CaCO3 and variable soil pH (Daroub et al., 2011).
Soil pH adjustment is one of the strategies that has been used to increase availability of
pH-sensitive nutrients. Application of soluble micronutrient fertilizers to a soil high in CaCO3 is
ineffective because they are quickly bound in unavailable forms (Wiedenfeld, 2011). Elemental
S application has been recommended to reduce soil pH and consequently increases nutrient
availability to crops (Schueneman, 2001). Oxidation of elemental S reduces soil pH in the
presence of Thiobacillus spp. and aerobic heterotrophic bacteria (Yang et al., 2010). An earlier
recommendation of elemental sulfur (S) application was 560 kg S ha-1
at pH ≥ 6.6 to reduce soil
pH (Anderson, 1985); however, an actual nutritional requirement of S for sugarcane is satisfied
through oxidation of organic soils in the EAA. Beverly and Anderson (1986) determined that soil
pH reduction with an elemental S application was only for a short term due to strong buffering
capacity of EAA soils, which counteracts the acidification of S oxidation. Although S
amendment reduces soil pH and increases nutrient availability in alkaline soils, this response
depends on the amount of calcium carbonate present in the soil, which buffers the acidification
effects of elemental S (Lindemann et al., 1991). At one location of a field study with sugarcane,
ACCEPTED MANUSCRIPT
ACCEPTED MANUSCRIPT 5
448 kg S ha-1
failed to enhance nutrient availability and yield (Ye et al., 2010). However,
McCray and Rice (2013) determined sugarcane yield response to elemental S when pH was >7.2
in previous field studies. Variable soil depths to limestone bedrock due to subsidence have
resulted in more micronutrient deficiencies related to high pH and increased Ca carbonate in the
root zone. (McCray et al., 2010). This emphasizes the need for revised recommendations of S
application for sugarcane in the EAA. However, expanded elemental sulfur application to the
calcareous soils of EAA could potentially cause environmental problems to the Everglades
wetland ecosystem (Childers et al., 2003; Orem et al., 2011). Therefore, there is a strong need to
determine the level of S application producing favorable responses in terms leaf nutrient
concentrations and yield while minimizing adverse environmental impacts under soil conditions
varying in CaCO3 contents. Leaf nutrient analysis, a complement to soil testing, has been widely
used as a diagnostic tool in sugarcane production (Anderson and Bowen 1990). The hypothesis
of this study was that increased S application rate would reduce the soil pH depending upon
varying CaCO3 levels and as a result, would affect the leaf nutrient concentrations and sugarcane
yield. Leaf nutrient analysis aids the soil test in EAA in decision making regarding the fertilizer
recommendations for optimum growth and yield of sugarcane. The objective was to determine
elemental S effects on yield and leaf nutrient concentrations on organic soil having variable
amounts of calcium carbonate.
MATERIALS AND METHODS
Experimental Site and Design
A single outdoor pot study was conducted at the University of Florida’s Everglades Research and
Education Center (EREC) in Belle Glade, Florida. The experiment was a factorial experiment
ACCEPTED MANUSCRIPT
ACCEPTED MANUSCRIPT 6
with two factors; three levels of added CaCO3 (0%, 12.5%, and 50% by volume) and four
elemental S rates (0, 90, 224, 448 kg S ha-1
), which were arranged using a randomized complete
block design with four replications (48 experimental units). Shell rock was used for the CaCO3
additions, which was thoroughly mixed in appropriate volumes with the entire soil for each pot
(95L or 25 gallon pots). Organic soil for the experiment was obtained from a field (N 26° 39′, W
80° 37′) at EREC. A single sugarcane accession, ‘CP 89-2143’, was planted as single-eye seed
pieces in flats of the same organic soil used for the pots in December 2011 and then six seedlings
were transplanted from the nursery to each pot in January 2012. A single furrow, approximately
15 cm deep, was formed in each pot in which all fertilizers were applied and then the seedlings
were transplanted and the furrow was covered. Four rates of granular elemental S (90% S) were
applied in a band in the furrow along with the other fertilizer. Other fertilizers were applied
according to recommendations and guidelines for this region and soil type (Gilbert et al., 2012).
All the fertilizers and elemental S were applied prior to planting and all pots received 29 kg P ha-
1 as monoammonium phosphate, 139 kg K ha
-1 as muriate of potash, and 39 kg micromix ha
-1
(containing Mn, Zn, Cu, and B). All calculations for fertilizer and S applications were based on
the surface area of the pot. No nitrogen was applied because sugarcane on muck soils does not
require N fertilization (Rice et al., 2010). Water was applied two times a day through an
automatic microjet irrigation system using well water. There were drainages holes on the sides at
the bottom. Weeds were removed by hand, as necessary, during the growing season. A support
structure of cables was built outside each row of pots in August 2012 to prevent sugarcane
lodging.
Biomass Sampling and Tissue Nutrient Analysis
ACCEPTED MANUSCRIPT
ACCEPTED MANUSCRIPT 7
To evaluate the leaf nutrient concentrations, ten top visible dewlap leaves were collected from
each pot in May and August 2012, corresponding to approximately 4 and 8 months after
planting, respectively. Leaf blades, after removing midribs, were rinsed in DI water to remove
soil and dust particles that may contaminate the samples, and then dried in the oven at 60°C in
paper bags. Dried leaf samples were ground in a Wiley mill to pass through a 2-mm mesh screen
and stored in plastic bags to analyze the nutrient concentrations. Subsamples were used to
determine the Ca, Mg, K, Mn, P, Fe, Zn, Cu, and S concentrations in leaf tissue using a nitric
acid digestion and analysis with inductively coupled plasma atomic emission spectrometry (ICP)
(Perkin-Elmer Optima 5300, Shelton, CT). Plant N concentration was determined using a Total
Kjeldahl Nitrogen (TKN) digestion followed by Lachat instrument analysis (QuikChem 8500;
Lachat, St. Joseph, MI). Silicon digestion was carried out to determine the silicon (Si)
concentration in leaf tissue followed by probe colorimeter analysis (Brinkmann Model 950,
Metrohm, Riverview, FL).
Harvest data was taken by cutting and weighing the sugarcane from each pot. Millable stalks
were counted from the harvested sugarcane. After weighing the sugarcane, the stalks were milled
and the crusher juice was analyzed for Brix and Pol values. Brix was measured using a
temperature-correcting refractometer, and Pol measured using a saccharimeter. Brix and Pol
values were used to calculate the kg sucrose per ton cane (KST) according to the theoretical
recoverable sugar method (Legendre, 1992). Tons cane ha-1
(TCH) was calculated from each pot
by using pot diameter (0.6 m) as the row length and assumed row width as 1.5 m to allow for
shading as in field conditions. Calculation of tons sucrose ha-1
(TSH) was computed as the
ACCEPTED MANUSCRIPT
ACCEPTED MANUSCRIPT 8
product of tons cane ha-1
(TCH) and KST (divided by 1000 to convert kg sucrose to metric tons)
(McCray and Rice, 2013).
Statistical Analysis
All statistical analyses were performed using SAS version 9.3 and JMP 10. A mixed model was
fitted using restricted maximum likelihood in the GLIMMIX procedure of SAS (SAS Institute,
Cary, NC, USA). The fixed effects were S application rate, CaCO3 levels, time, and their
interaction, with block as a random effect. Analysis of variance (ANOVA) was performed using
PROC GLIMMIX and treatment differences were determined using Tukey’s test with
significance at P < 0.05. Degree of freedom was adjusted using the Kenward-Roger adjustment.
Pearson correlation analysis was performed to assess relationships between variables using
PROC CORR. Stepwise multiple regressions were used to evaluate the relative importance of
soil pH and plant nutrients in predicting sugarcane yield.
RESULTS AND DISCUSSION
Nitrogen
There were no significant differences in leaf N concentration with elemental S application in
organic soils varying in CaCO3 content during the sugarcane growing season (Table 1).
Significantly greater leaf N concentration was observed in soils with no added CaCO3 compared
to soils with added CaCO3 (Table 1). In EAA’s soils, sufficient N for sugarcane crop requirement
comes from the oxidation of organic soils (Rice et al., 2010). Low N tissue concentration with
added CaCO3 was likely due to a decrease in the volume of organic matter for oxidation, as well
as increased soil pH and increased Ca concentration, which decreased N availability in soils.
ACCEPTED MANUSCRIPT
ACCEPTED MANUSCRIPT 9
Nitrogen concentration in leaves was negatively correlated with soil pH (r2 = -0.62) and soil Ca
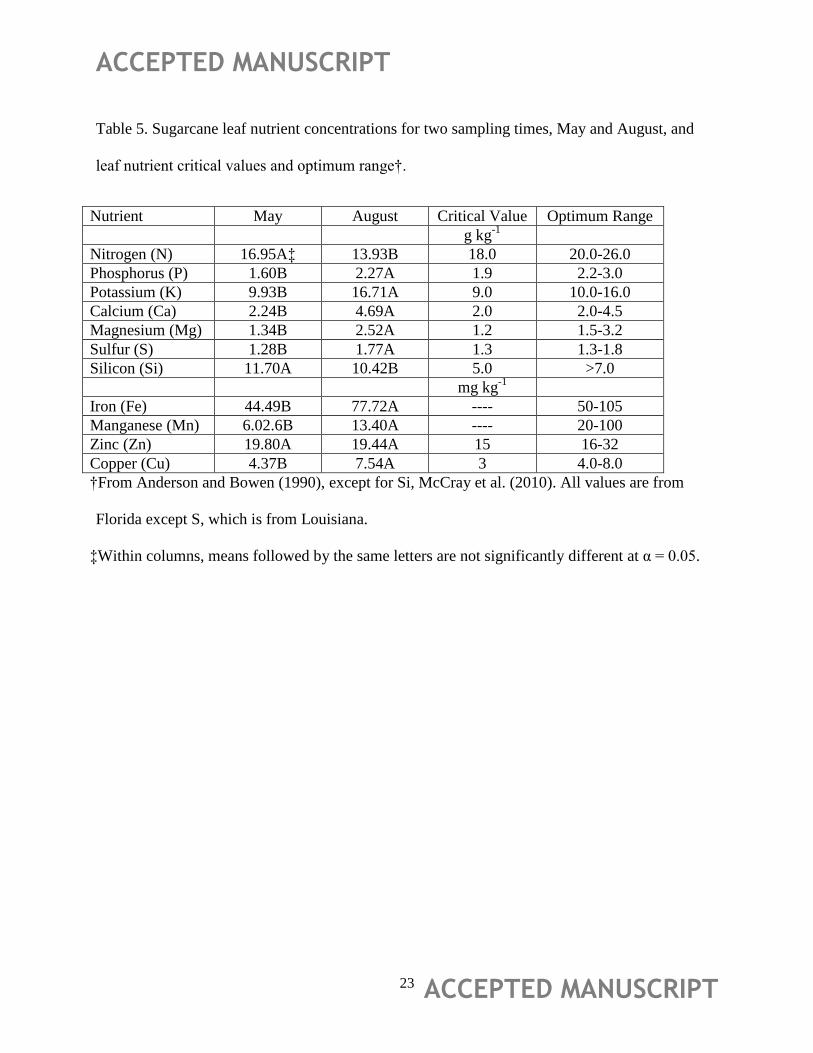
concentration (r2 = -0.45). Averaged across treatments, leaf N concentration was lower in May
(16.95 g kg-1
) and August (13.93 g kg-1
) than the critical N value (18.0 g kg-1
) for sugarcane
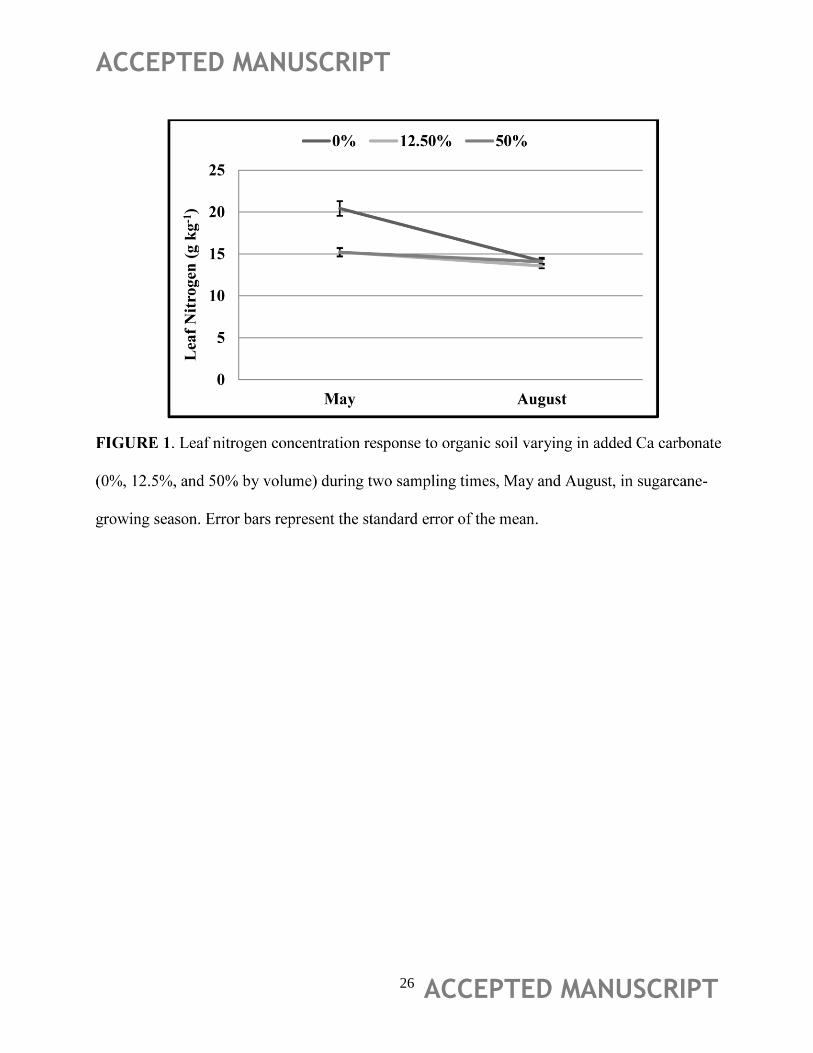
(Table 5). Leaf N concentration was highest for soil with no added CaCO3 in May and then
significantly reduced in August for all treatments (Figure. 1). The reduced N concentration was
likely due to leaching losses of N from the soil and also N demand may have increased in August
because the plants were larger, which were observed in the soil N test (data not shown) (Ye et
al., 2011).
Phosphorus
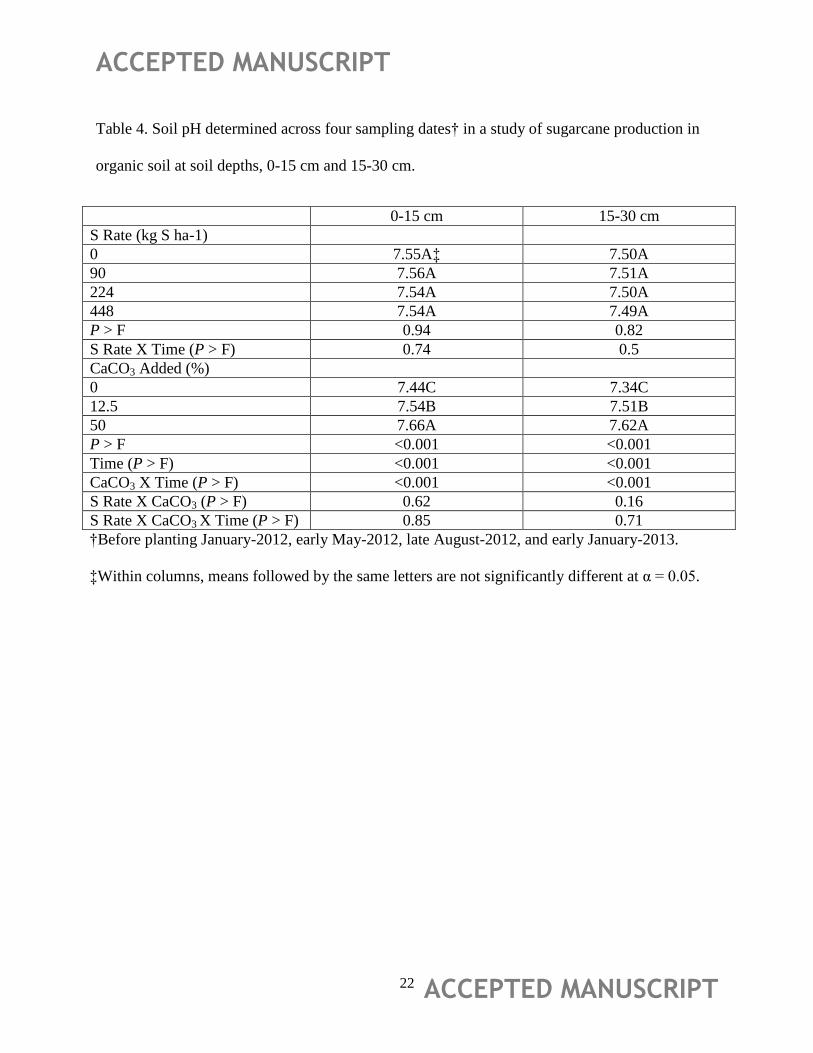
There were no significant differences in leaf P concentration as influenced by S amendment at
any level of CaCO3 during the growing season (Table 1). This was likely due to limited soil pH
reduction by the S treatments at any soil depths, 0-15 cm and 15-30 cm (Table 4) (Ye et al.,
2011). There were also no significant differences in leaf P concentration with added CaCO3 in
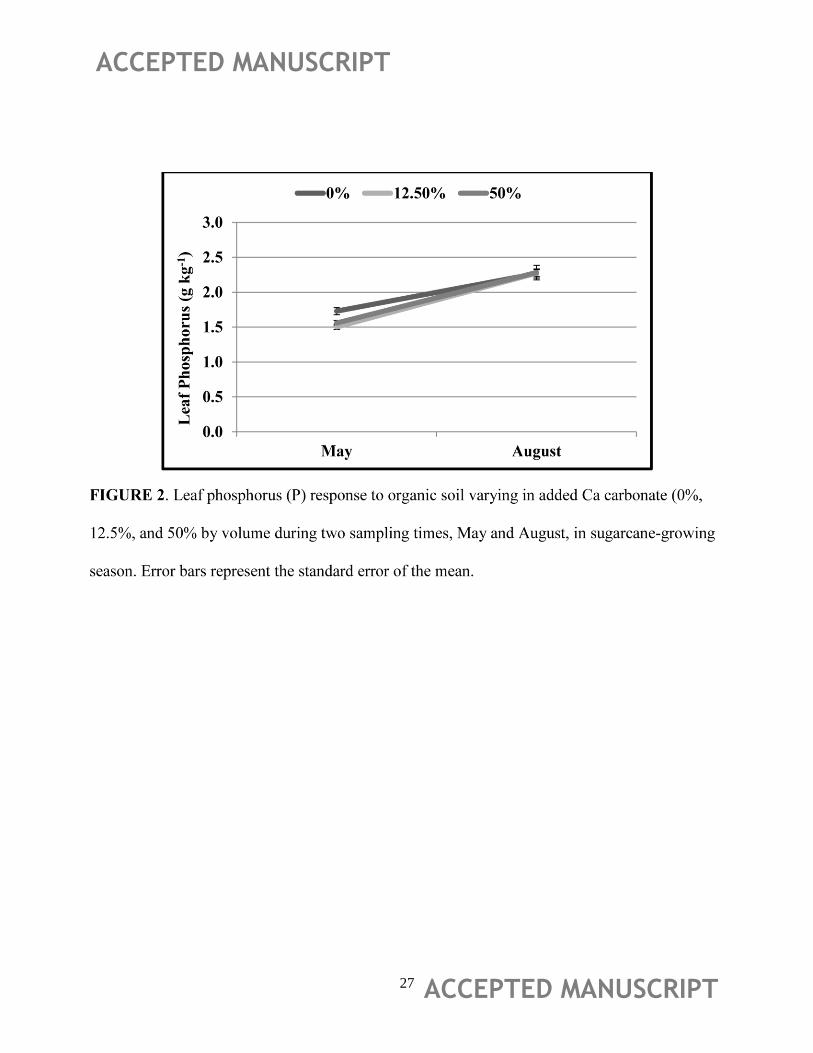
organic soils (Table 1). Leaf P concentration was below the critical P value (1.9 g kg-1
) for
sugarcane in May (1.60 g kg-1
) and then significantly increased in August (2.27 g kg-1
) (Figure
2)(Table 5). Low leaf P concentrations in the spring may be associated with drought stress in the
spring with less rainfall as compared to summer (McCray et al., 2009).
Sulfur, Calcium, Potassium, and Magnesium
Other leaf nutrients, S, Ca, K, and Mg were not affected by different rates of elemental S
application in organic soils during the growing season (Table 1). Leaf K concentration
significantly decreased with added CaCO3 (Table 1). There was a significant difference for leaf S
ACCEPTED MANUSCRIPT
ACCEPTED MANUSCRIPT 10
between no added CaCO3 soil and 12.5% CaCO3 soil (Table 1). However, Ca and Mg did not
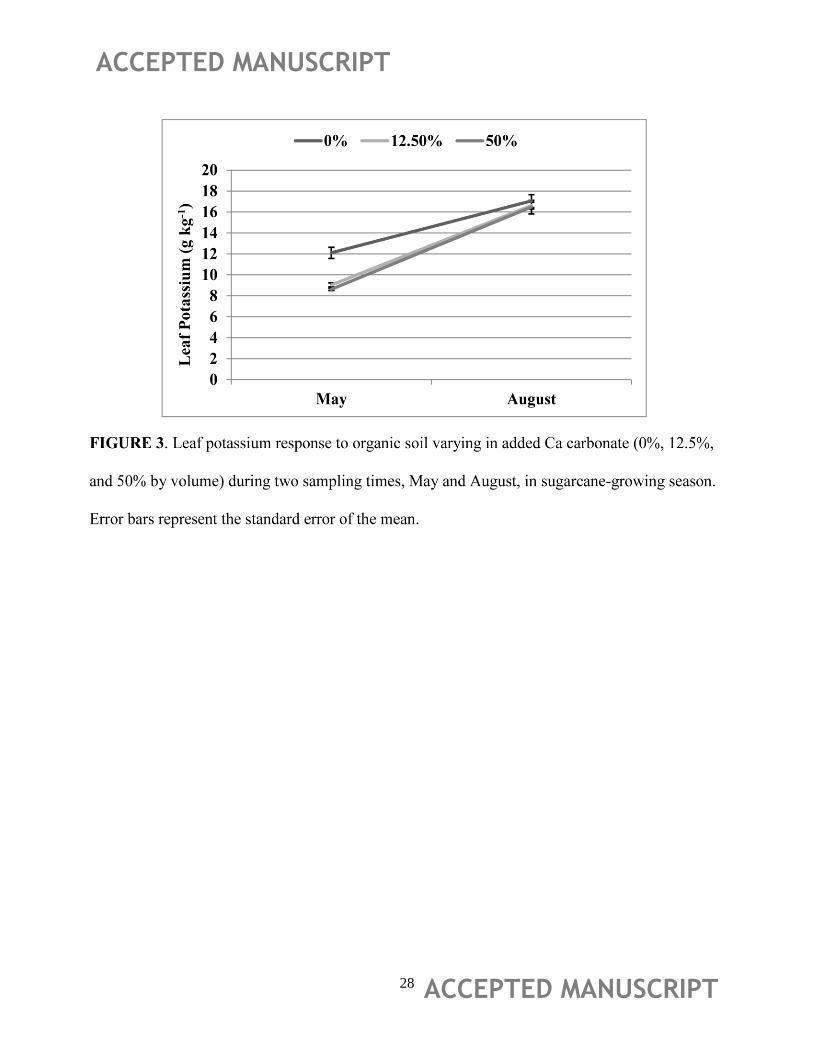
show any significant effects of added CaCO3 in soils. Leaf K concentration significantly
increased as the growing season progressed and was highest in soil with no added CaCO3
(Figure. 3). Increased volume of CaCO3 increased the pH and Ca concentration in soil and
decreased the volume of organic matter, which reduced the soil K concentration (data not shown)
and resulted in less K uptake. Significant negative correlation of leaf K with soil pH (r2
= -0.73)
and soil Ca concentration (r2
= -0.56) indicate that increased soil pH and Ca concentration were
associated with lower leaf K concentration. The concentrations of all these nutrients were at or
above the critical values for sugarcane at both sampling times (Table 5).
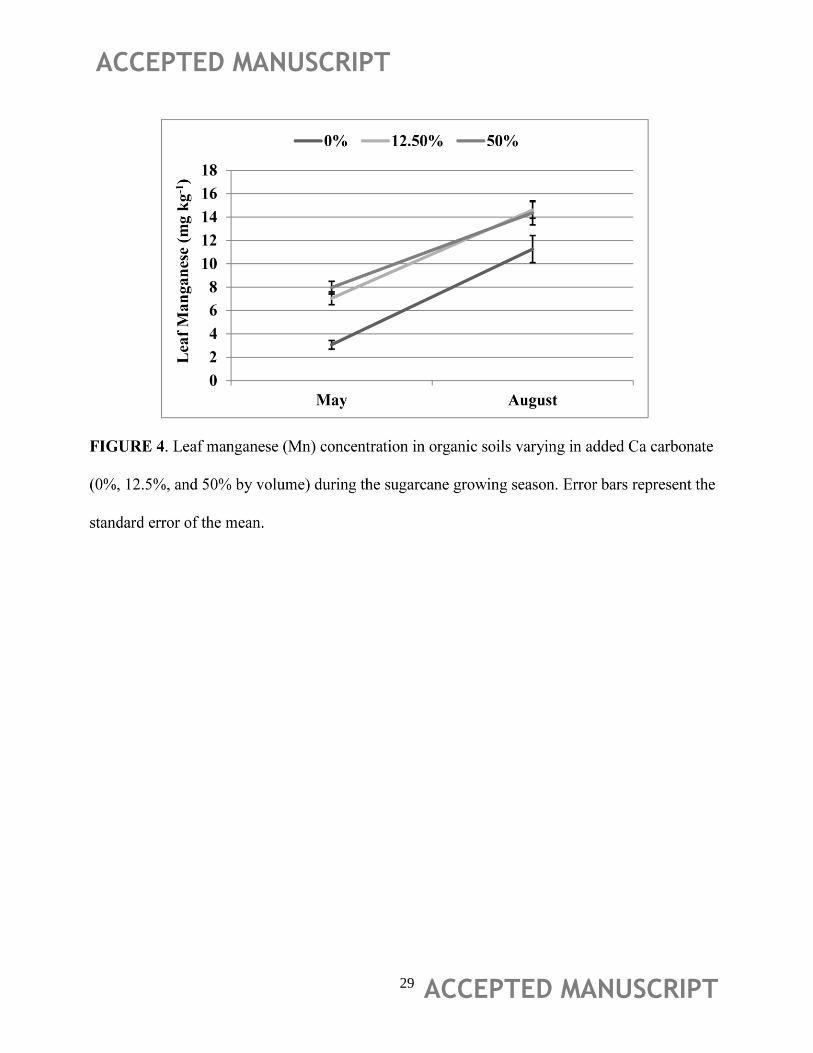
Manganese
Sulfur amendment did not significantly enhance leaf Mn concentration in all organic soil
conditions during the growing season (Table 2). This may be due to the limited effects of
elemental S application on soil pH reduction at both depths (Table 4); hence, Mn availability was
similar across S treatments (Table 2). Unexpected results of leaf Mn concentration were
observed with CaCO3 treatments. Increased CaCO3 level in organic soil significantly increased
the leaf Mn (Table 2) and soil Mn concentrations. This was likely due to the change in physical
characteristics of the soil with added CaCO3. Added CaCO3 increased bulk density of the soil by
decreasing the volume of organic soil and consequently decreased the infiltration rates of water.
Low infiltration led to periodic flooding and poor drainage, which consequently increased
reducing anaerobic conditions. These conditions resulted in increased leaf Mn concentration as
has been observed with increased soil moisture in the summer rainy season in Florida (McCray
et al., 2009). As the growing season progressed, leaf Mn concentration significantly increased
ACCEPTED MANUSCRIPT
ACCEPTED MANUSCRIPT 11
from spring to summer (Figure. 4), but it was still within the deficient category for both sampling
times, May (6.02 mg kg-1
) and August (13.40 mg kg-1
) (Table 5). Similar results of increased leaf
tissue Mn were also found in one previous study (Weil et al., 1997).
Iron, Copper, Zinc, and Silicon
Sulfur amendment did not show any significant effect on leaf tissue Fe, Cu, Zn, and Si
concentrations under different organic soil conditions during the growing season (Table 2).
Increased levels of CaCO3 did not significantly influence leaf Fe, Cu, and Zn concentrations
(Table 2). This was likely due to limited soil pH reduction by the S treatments at soil depths, 0-
15 cm and 15-30 cm (Table 4). Leaf Si concentration was significantly increased with added
CaCO3 content (Table 2) which follows the increased solubility of soil silicate species with
increasing pH (Lindsay, 1979). Leaf Cu, Zn, and Si concentrations were within or above the
optimum range for sugarcane (Table 5). Averaged across treatments, leaf Fe concentration was
below the critical Fe value for sugarcane in May, but leaf Fe concentration was within the
optimum range for sugarcane in August leaf sampling (Table 5). Leaf Fe and Cu concentrations
significantly increased from May to August (Table 5). Increased leaf Fe and Cu concentrations
in August were likely due to the rainy season, which increased the soil moisture and reducing
conditions and consequently increased Fe and Cu availability in soil (McCray et al., 2009).
However, leaf Zn concentration did not show any significant difference across the growing
season (Table 5).
Sugarcane Yield
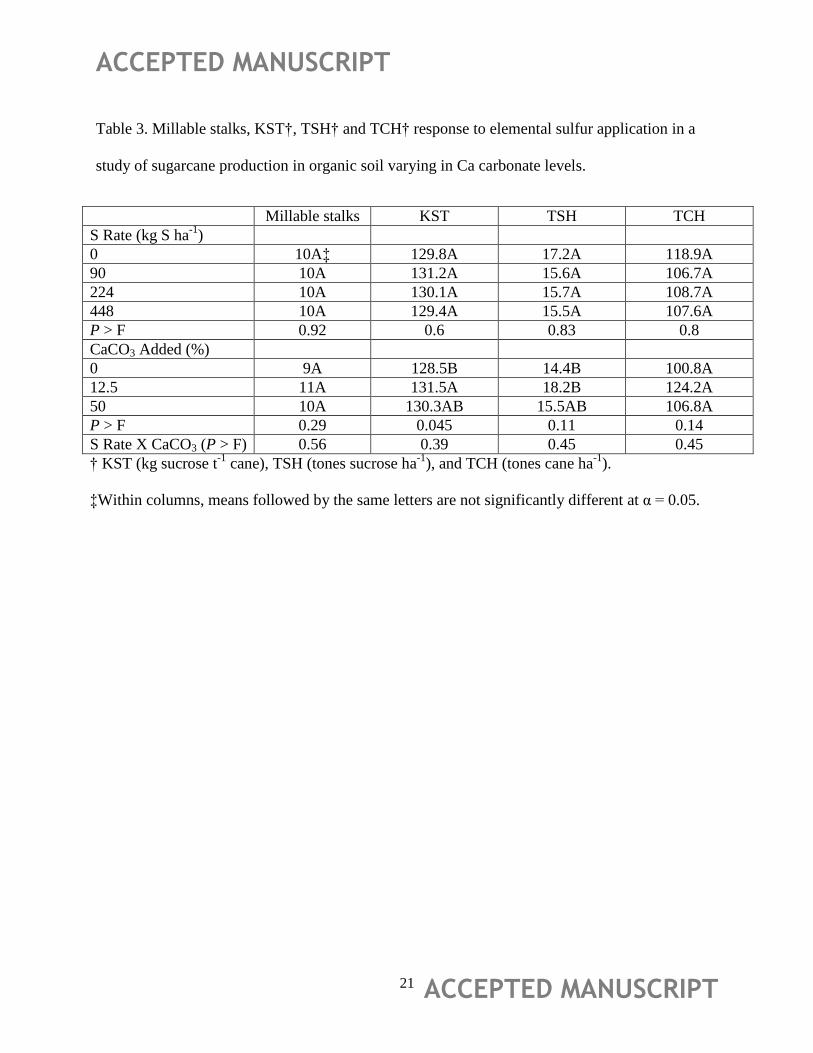
There were no significant differences among the treatments for millable stalks. Sulfur application
in organic soils did not affect the millable stalk numbers and variation in CaCO3 rates did not
ACCEPTED MANUSCRIPT
ACCEPTED MANUSCRIPT 12
influence the millable stalks number (Table 3). This lack of an effect on millable stalks might be
due to the limited effects of S application on soil pH reduction and also that most nutrients were
within optimum ranges. Sulfur application did not significantly affect the yield parameters kg
sucrose t-1
cane (KST), t cane ha-1
(TCH), or t sucrose ha-1
(TSH) in organic soils varying in
added CaCO3 (Table 3). This can be explained by the lack of pH change in soils with S
application. There were also no significant differences in TCH or TSH among CaCO3 treatments.
Similar results were found in one previous study, where a current recommendation rate 448 kg S
ha-1
failed to enhance nutrient availability and yield (Ye et al., 2010).
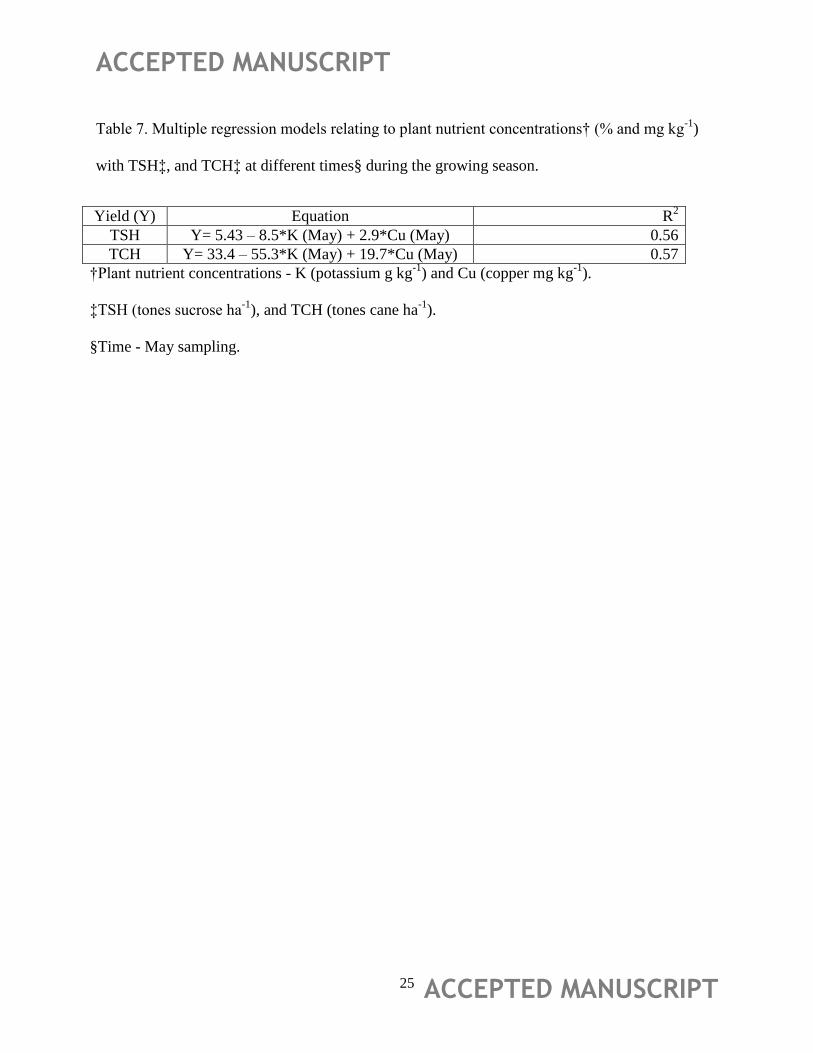
Yield Predictor
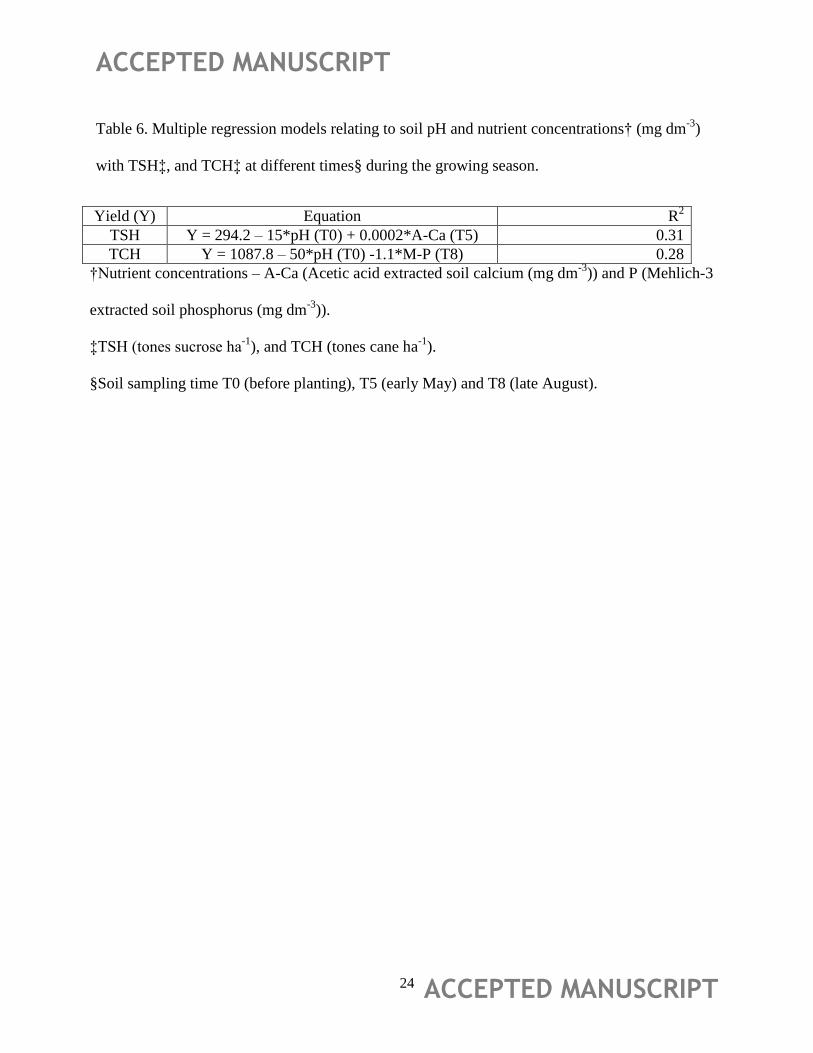
Multiple regression models were developed to determine the important factors in soil and plants
that could be used to predict the yield of TSH and TCH (Table 6 and Table 7). Soil pH before
planting and fertilization and phosphorus in august sampling were the important factors in soil,
which negatively influenced the yield of TSH and TCH (Table 6). This indicates that high soil
pH and reduced P availability in soil would decrease the sugar yield. In plants, positive
correlated Cu and negative correlated K concentrations with yield in May tissue sampling were
important factors which influenced the yield (Table 7). Negative relation of K concentration with
yield might not indicate a direct effect on yield reduction. This could be due to the influence of K
on other nutrients like Mn or covariance with other factors. In our study, soil K and Mn
concentrations showed a negative correlation (r2 = -0.46), which indicates that increased uptake
of K was negatively related to factors that decreased leaf Mn concentration (r2 = -0.76). Also,
leaf Mn concentration was below the critical value of Mn for sugarcane in all treatments (Table
5). Thus, Mn concentration may be one of the predictors which indirectly influences the yield.
ACCEPTED MANUSCRIPT
ACCEPTED MANUSCRIPT 13
There were low coefficient of determinations (R2) for TSH and TCH for both soil and plant
(Tables 6 and 7), indicating that factors which influence the yields were not quantified
(Anderson et al., 1999). These linear models gave only rough approximations of the relationships
between the factors and yield (Anderson et al., 1999; Ye et al., 2011).
CONCLUSIONS
Sulfur amendment at different rates had limited effects on plant nutrient concentrations under
different organic soil conditions varying in CaCO3 levels. High buffering capacities of these soils
limited the soil pH reduction with elemental S application and therefore, failed to enhance
nutrient availability to sugarcane. Variable CaCO3 levels in these organic soils had significant
effects on leaf N, K, S, Si, and Mn concentrations; added CaCO3 in soil reduced the leaf N, K,
and S concentrations, but increased the Si and Mn concentrations. An unexpected increase of leaf
Mn concentrations is associated with increased soil Mn availability with increased CaCO3 levels.
Increased CaCO3 levels enhanced the soil reducing conditions, which were due to the changes in
the physical properties of the soil with added CaCO3. Added CaCO3 in organic soils increased
bulk density and decreased water infiltration rates in soils, which led to an increase in water
retention, soil moisture which led to development of anaerobic reducing conditions. The
reducing conditions solubilized Mn and increased Mn availability; thus, leaf Mn concentrations
increased. Correspondingly, S amendment at different rates for variable CaCO3 levels did not
influence sugarcane yield parameters; KST, TSH or TCH, due to limited changes in nutrient
concentrations. All the plant nutrients were within optimum range except P, Fe, and Mn for
sugarcane, which indicates that high soil pH reduces P, Fe and Mn availability to crops.
Subsequently, soil pH, P and Mn were the most important predictors of sugarcane yield. This
ACCEPTED MANUSCRIPT
ACCEPTED MANUSCRIPT 14
study demonstrated that not only soil chemical properties but also soil physical properties are
changed as Histosols become shallower with subsidence and that all these changes should be
considered in the evaluation of agronomic practices on these soils.
ACKNOWLEDGMENT
We are thankful to Everglades Agricultural Area Environmental Protection District for funding
ACCEPTED MANUSCRIPT
ACCEPTED MANUSCRIPT 15
REFERENCES
Anderson, D.L. 1985. Crop soil fertility recommendations of the Everglades soil testing
laboratory. EREC-Belle Glade Report EV-1985-10. Belle Glade, FL: University of
Florida.
Anderson, D. L. and J. E. Bowen. 1990. Sugarcane Nutrition. Potash and Phosphate Institute,
Atlanta, GA.
Anderson, D.L., K.N. Portier, T.A. Obreza, M.E. Collins, and D.J. Pitts. 1999. Tree regression
analysis to determine effects of soil variability on sugarcane yields. Soil Science Society
of America Journal 63:592-600.
Beverly, R.B., and D.L. Anderson. 1986. Effects of acid source on soil pH. Soil Science143:301-
303.
Childers, D.L., R.F. Doren, R. Jones, G.B. Noe, M. Rugge, and L.J. Scinto 2003. Decadal change
in vegetation and soil phosphorus patterns across the Everglades landscape. Journal of
Environmental Quality 32:344-362.
Daroub S.H., S.V. Horn, T. A. Lang and O.A. Diaz 2011, Best management practices and long-
term water quality trends in the Everglades Agricultural Area. Critical Reviews in
Environmental Science and Technology 41:S1, 608-632.
Gilbert R.A., R.W. Rice, and D.C. Odero. 2012. Nutrient requirements for sugarcane production
on Florida muck soils. Florida Cooperative Extension Service Fact Sheet SS-AGR-228.
ACCEPTED MANUSCRIPT
ACCEPTED MANUSCRIPT 16
Legendre, B.L. 1992. The core/press method for predicting the sugar yield from cane for use in
cane payment. Journal American Society of Sugar Cane Technologists 54:2-7.
Li, B.Y., D.M. Zhou, L. Cang, H.L. Zhang, X.H. Fan, and S.W. Qin. 2007. Soil micronutrient
availability to crops as affected by long-term inorganic and organic fertilizer applications.
Soil and Tillage Research 96: 166–173.
Lindemann, W.C., J.J. Aburto, W.M. Haffner, and A.A. Bono. 1991. Effect of sulfur source on
sulfur oxidation. Soil Science Society of America Journal 55:85-90.
Lindsay, W. L. 1979. Chemical equilibria in soils. John Wiley & Sons. New York.
McCray, J.M., S. Ji, G. Powell, G. Montes, R. Perdomo, and Y. Luo. 2009. Seasonal
concentrations of leaf nutrients in Florida sugarcane. Sugar Cane International 27(1):17-
24.
McCray, J. M., S. Ji, G. Powell, G. Montes, R. Perdomo, and Y. Luo. 2010. Boundary lines used
to determine sugarcane production limits at leaf nutrient concentrations less than
optimum. Communications in Soil Science and Plant Analysis 41:606-622.
McCray, J.M., and R.W. Rice. 2013. Sugarcane yield response to elemental sulfur on high pH
organic soils. Proc. International Society of Sugar Cane Technologists 28:280-287.
Morgan, K.T., J.M. McCray, R.W. Rice, R.A. Gilbert, and L.E. Baucum. 2009. Review of
current sugarcane fertilizer recommendations: A report from the UF/IFAS sugarcane
fertilizer standards task force. UF EDIS SL 295, Gainesville, FL.
ACCEPTED MANUSCRIPT
ACCEPTED MANUSCRIPT 17
Orem, W., Gilmour, Cynthia, Axelrad, Donald, Krabbenhoft, David, Scheidt, Daniel, Kalla,
Peter, McCormick, Paul, Gabriel, Mark, and George. 2011. Sulfur in the South Florida
ecosystem: distribution, sources, biogeochemistry, impacts, and management for
restoration'. Critical Reviews in Environmental Science and Technology 41:6, 249-288
Rice, R.W., R.A. Gilbert, and J.M. McCray. 2010. Nutrient requirements for Florida sugarcane.
UF-IFAS SS-AGR-228, Gainesville, FL.
Schueneman, T.J. 2001. Characterization of sulfur sources in the EAA. Soil and Crop Science
Society of Florida Proceedings 60:49-52.
Snyder, G.H. 2005. Everglades Agricultural Area soil subsidence and land use projections. Soil
and Crop Science Society of Florida Proceedings 64:44-51.
Weil R.R., C.D. Foy, and C.A. Coradetti. 1997. Influence of soil moisture regimes on subsequent
soil manganese availability and toxicity in two cotton genotypes. Agronomy Journal Vol.
89:1-8.
Wiedenfeld, B. 2011. Sulfur application effects on soil properties in a calcareous soil and on
sugarcane growth and yield. Journal of Plant Nutrition 34:7, 1003-1013.
Wright, A.L., and G.H. Snyder. 2009. Soil subsidence in the Everglades Agricultural Area. SL
311, Soil and Water Science Dept., Florida Cooperative Extension Service, IFAS,
University of Florida.
ACCEPTED MANUSCRIPT
ACCEPTED MANUSCRIPT 18
Yang Z.H., K. Stoven, S. Haneklaus, B.R. Singh, and E. Schnug. 2010. Elemental sulfur
oxidation by Thiobacillus spp. and aerobic Heterotrophic Sulfur-Oxidizing bacteria.
Pedosphere 20(1):71–79,
Ye, R., A.L. Wright, W.H. Orem, and J.M. McCray, 2010. Sulfur distribution and
transformations in Everglades Agricultural Area soil as influenced by sulfur amendment.
Soil Science 175:263-26
Ye, R., A.L. Wright, J.M. McCray, K.R. Reddy, and L. Young. 2010. Sulfur-induced changes in
phosphorus distribution in Everglades Agricultural Area soils. Nutrient Cycling in
Agroecosystems 87:127–135.
Ye, R., A.L. Wright, and J.M. McCray. 2011. Seasonal changes in nutrient availability for sulfur-
amended Everglades’s soils under sugarcane. Journal of Plant Nutrition 34:2095–2113.
ACCEPTED MANUSCRIPT
ACCEPTED MANUSCRIPT 19
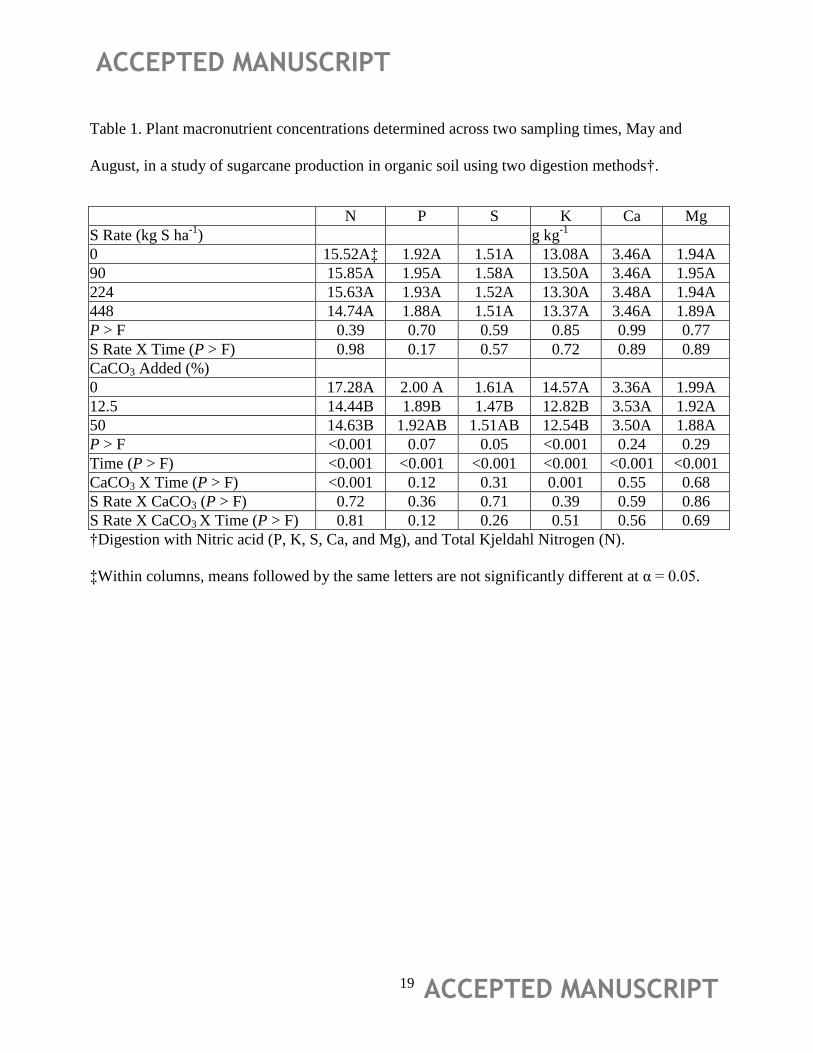
Table 1. Plant macronutrient concentrations determined across two sampling times, May and
August, in a study of sugarcane production in organic soil using two digestion methods†.
N P S K Ca Mg
S Rate (kg S ha-1
) g kg-1
0 15.52A‡ 1.92A 1.51A 13.08A 3.46A 1.94A
90 15.85A 1.95A 1.58A 13.50A 3.46A 1.95A
224 15.63A 1.93A 1.52A 13.30A 3.48A 1.94A
448 14.74A 1.88A 1.51A 13.37A 3.46A 1.89A
P > F 0.39 0.70 0.59 0.85 0.99 0.77
S Rate X Time (P > F) 0.98 0.17 0.57 0.72 0.89 0.89
CaCO3 Added (%)
0 17.28A 2.00 A 1.61A 14.57A 3.36A 1.99A
12.5 14.44B 1.89B 1.47B 12.82B 3.53A 1.92A
50 14.63B 1.92AB 1.51AB 12.54B 3.50A 1.88A
P > F <0.001 0.07 0.05 <0.001 0.24 0.29
Time (P > F) <0.001 <0.001 <0.001 <0.001 <0.001 <0.001
CaCO3 X Time (P > F) <0.001 0.12 0.31 0.001 0.55 0.68
S Rate X CaCO3 (P > F) 0.72 0.36 0.71 0.39 0.59 0.86
S Rate X CaCO3 X Time (P > F) 0.81 0.12 0.26 0.51 0.56 0.69
†Digestion with Nitric acid (P, K, S, Ca, and Mg), and Total Kjeldahl Nitrogen (N).
‡Within columns, means followed by the same letters are not significantly different at α = 0.05.
ACCEPTED MANUSCRIPT
ACCEPTED MANUSCRIPT 20
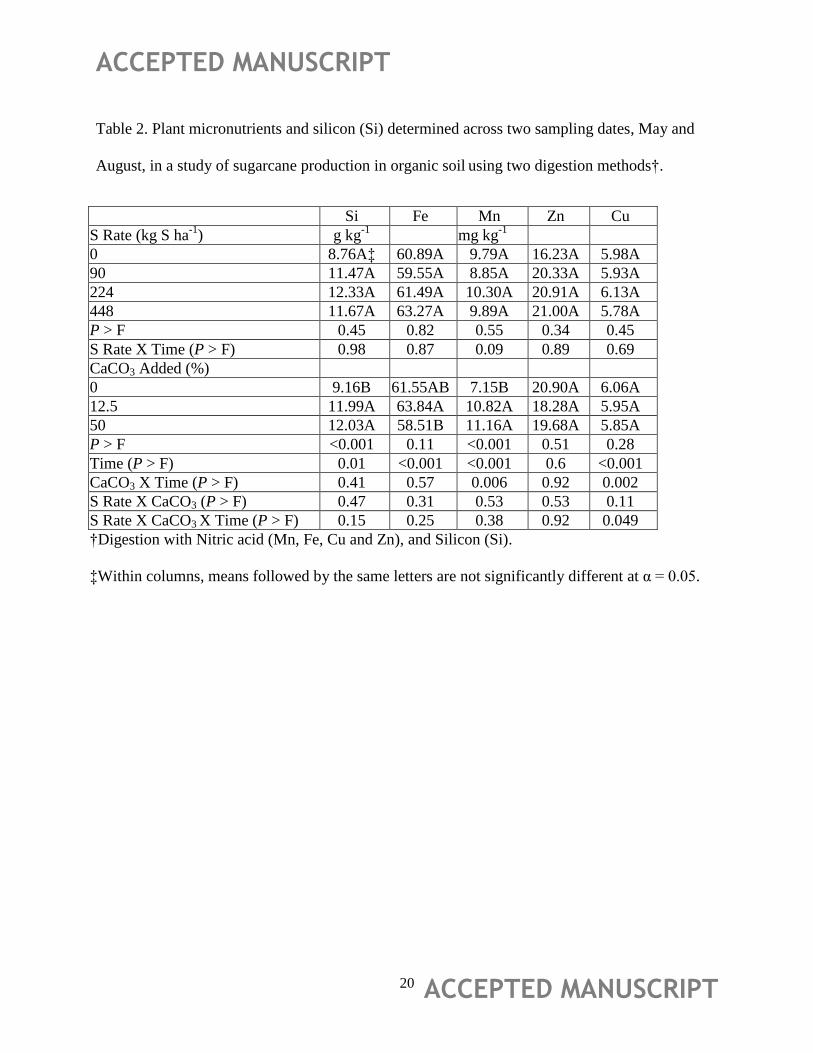
Table 2. Plant micronutrients and silicon (Si) determined across two sampling dates, May and
August, in a study of sugarcane production in organic soil using two digestion methods†.
Si Fe Mn Zn Cu
S Rate (kg S ha-1
) g kg-1
mg kg-1
0 8.76A‡ 60.89A 9.79A 16.23A 5.98A
90 11.47A 59.55A 8.85A 20.33A 5.93A
224 12.33A 61.49A 10.30A 20.91A 6.13A
448 11.67A 63.27A 9.89A 21.00A 5.78A
P > F 0.45 0.82 0.55 0.34 0.45
S Rate X Time (P > F) 0.98 0.87 0.09 0.89 0.69
CaCO3 Added (%)
0 9.16B 61.55AB 7.15B 20.90A 6.06A
12.5 11.99A 63.84A 10.82A 18.28A 5.95A
50 12.03A 58.51B 11.16A 19.68A 5.85A
P > F <0.001 0.11 <0.001 0.51 0.28
Time (P > F) 0.01 <0.001 <0.001 0.6 <0.001
CaCO3 X Time (P > F) 0.41 0.57 0.006 0.92 0.002
S Rate X CaCO3 (P > F) 0.47 0.31 0.53 0.53 0.11
S Rate X CaCO3 X Time (P > F) 0.15 0.25 0.38 0.92 0.049
†Digestion with Nitric acid (Mn, Fe, Cu and Zn), and Silicon (Si).
‡Within columns, means followed by the same letters are not significantly different at α = 0.05.
ACCEPTED MANUSCRIPT
ACCEPTED MANUSCRIPT 21
Table 3. Millable stalks, KST†, TSH† and TCH† response to elemental sulfur application in a
study of sugarcane production in organic soil varying in Ca carbonate levels.
Millable stalks KST TSH TCH
S Rate (kg S ha-1
)
0 10A‡
129.8A 17.2A 118.9A
90 10A 131.2A 15.6A 106.7A
224 10A 130.1A 15.7A 108.7A
448 10A 129.4A 15.5A 107.6A
P > F 0.92 0.6 0.83 0.8
CaCO3 Added (%)
0 9A 128.5B 14.4B 100.8A
12.5 11A 131.5A 18.2B 124.2A
50 10A 130.3AB 15.5AB 106.8A
P > F 0.29 0.045 0.11 0.14
S Rate X CaCO3 (P > F) 0.56 0.39 0.45 0.45
† KST (kg sucrose t-1
cane), TSH (tones sucrose ha-1
), and TCH (tones cane ha-1
).
‡Within columns, means followed by the same letters are not significantly different at α = 0.05.
ACCEPTED MANUSCRIPT
ACCEPTED MANUSCRIPT 22
Table 4. Soil pH determined across four sampling dates† in a study of sugarcane production in
organic soil at soil depths, 0-15 cm and 15-30 cm.
0-15 cm 15-30 cm
S Rate (kg S ha-1)
0 7.55A‡
7.50A
90 7.56A 7.51A
224 7.54A 7.50A
448 7.54A 7.49A
P > F 0.94 0.82
S Rate X Time (P > F) 0.74 0.5
CaCO3 Added (%)
0 7.44C 7.34C
12.5 7.54B 7.51B
50 7.66A 7.62A
P > F <0.001 <0.001
Time (P > F) <0.001 <0.001
CaCO3 X Time (P > F) <0.001 <0.001
S Rate X CaCO3 (P > F) 0.62 0.16
S Rate X CaCO3 X Time (P > F) 0.85 0.71
†Before planting January-2012, early May-2012, late August-2012, and early January-2013.
‡Within columns, means followed by the same letters are not significantly different at α = 0.05.
ACCEPTED MANUSCRIPT
ACCEPTED MANUSCRIPT 23
Table 5. Sugarcane leaf nutrient concentrations for two sampling times, May and August, and
leaf nutrient critical values and optimum range†.
Nutrient May August Critical Value Optimum Range
g kg-1
Nitrogen (N) 16.95A‡ 13.93B 18.0 20.0-26.0
Phosphorus (P) 1.60B 2.27A 1.9 2.2-3.0
Potassium (K) 9.93B 16.71A 9.0 10.0-16.0
Calcium (Ca) 2.24B 4.69A 2.0 2.0-4.5
Magnesium (Mg) 1.34B 2.52A 1.2 1.5-3.2
Sulfur (S) 1.28B 1.77A 1.3 1.3-1.8
Silicon (Si) 11.70A 10.42B 5.0 >7.0
mg kg-1
Iron (Fe) 44.49B 77.72A ---- 50-105
Manganese (Mn) 6.02.6B 13.40A ---- 20-100
Zinc (Zn) 19.80A 19.44A 15 16-32
Copper (Cu) 4.37B 7.54A 3 4.0-8.0
†From Anderson and Bowen (1990), except for Si, McCray et al. (2010). All values are from
Florida except S, which is from Louisiana.
‡Within columns, means followed by the same letters are not significantly different at α = 0.05.
ACCEPTED MANUSCRIPT
ACCEPTED MANUSCRIPT 24
Table 6. Multiple regression models relating to soil pH and nutrient concentrations† (mg dm-3
)
with TSH‡, and TCH‡ at different times§ during the growing season.
Yield (Y) Equation R2
TSH Y = 294.2 – 15*pH (T0) + 0.0002*A-Ca (T5) 0.31
TCH Y = 1087.8 – 50*pH (T0) -1.1*M-P (T8) 0.28
†Nutrient concentrations – A-Ca (Acetic acid extracted soil calcium (mg dm-3
)) and P (Mehlich-3
extracted soil phosphorus (mg dm-3
)).
‡TSH (tones sucrose ha-1
), and TCH (tones cane ha-1
).
§Soil sampling time T0 (before planting), T5 (early May) and T8 (late August).
ACCEPTED MANUSCRIPT
ACCEPTED MANUSCRIPT 25
Table 7. Multiple regression models relating to plant nutrient concentrations† (% and mg kg-1
)
with TSH‡, and TCH‡ at different times§ during the growing season.
Yield (Y) Equation R2
TSH Y= 5.43 – 8.5*K (May) + 2.9*Cu (May) 0.56
TCH Y= 33.4 – 55.3*K (May) + 19.7*Cu (May) 0.57
†Plant nutrient concentrations - K (potassium g kg-1
) and Cu (copper mg kg-1
).
‡TSH (tones sucrose ha-1
), and TCH (tones cane ha-1
).
§Time - May sampling.
ACCEPTED MANUSCRIPT
ACCEPTED MANUSCRIPT 26
ACCEPTED MANUSCRIPT
ACCEPTED MANUSCRIPT 27
ACCEPTED MANUSCRIPT
ACCEPTED MANUSCRIPT 28
ACCEPTED MANUSCRIPT
ACCEPTED MANUSCRIPT 29