sudan economic reportbusiness model 78 figures 1.1 sudan, east africa, and world markets 9 1.2...
TRANSCRIPT

Sud
an Eco
no
mic R
ep
ort�
AFRIC
AN
�DEV
ELOPM
ENT�BA
NK�G
ROU
P

About this seriesThis new Country Economic Report series seeks to bring the best possible knowledge to bear on policy and institutional reforms in Africa. It also seeks to develop and help implement the African Development Bank’s High Five strategies, while guiding the design of individual country assistance strategies. And it seeks to enhance the quality and impact of the Bank’s analytical and advisory activities and development policy operations — and to foster a community of economists (across sectors) on the continent. The series is produced by the Country Economics Department, in close collaboration with teams in other departments of the Bank’s Vice-Presidency for Economic Gov-ernance and Knowledge Management and Office of the Chief Economist.
Copyright © 2018 African Development Bank Group
ISBN: 978-9938-882-84-1
The opinions expressed and arguments employed herein do not necessarily reflect the official views of the African Development Bank, its Boards of Directors, or the countries they represent. This document, as well as any data and maps included, are without prejudice to the status of or sovereignty over any territory, to the delimitation of international frontiers and boundaries, and to the name of any territory, city, or area.

iii
Fore
wor
d |
Aft
er T
wo
Dec
ades
of “
Solit
ude”
: Tar
gete
d St
rate
gies
for Q
uick
Eco
nom
ic W
ins
I t took a long time for economic historians and development theorists to explain the mystery of modern economic growth. Some
researchers suggested that a combination of cheap energy costs and high wages encouraged business people in the western world to devote more resources to technological innovation. Others focused on the benefits of colonial re-source extraction, or on the social and political institutions that encouraged entrepreneurship.
These traditional arguments sounded con-vincing for a long while. Today, they are insuf-ficient at best. Material and political conditions alone could not have done it. The Industrial Revolution was primarily the result of ideas. People and business leaders found innova-tive ways of adopting technology and making it commercially viable so that it could boost productivity. Some great inventions had been sitting on the shelves for many decades. It took some wise and very practical people to design the institutions that would create the appropriate incentives and conditions for their broader use by firms and households, bring benefits and rewards to all stakeholders — and stimulate economic growth.
In a world where labor and capital are quite mobile, the main explanation for the economic differences between rich and poor countries is not just money: It is also and increasingly the difference in their ability to generate, or bor-row and use, the best ideas out there.
This Sudan Country Economic Report, the first in a new series, confirms that it is time for the country to generate, borrow, and use the best ideas out there. It shows that the per-manent removal of U.S. economic sanctions creates an incentive for the government to
deepen policy reforms. That would strengthen the case for heavily indebted poor countries (HIPC) debt relief, which might enlarge the fiscal space, attract more concessional financing, and help reintegrate Sudan into the global econo-my. Removal of sanctions also bodes well for the fairly resilient private sector, which is now looking for opportunities to borrow from the African Development Bank and others. Both traditional and nontraditional creditors are stepping up technical assistance work that would position them to take such investment opportunities. Removal of sanctions will also improve the operational environment, ending long delays in transferring funds for such devel-opment partners, including the Bank.
Policy makers may want to prioritize policies for grasping low hanging fruit to achieve quick wins that could boost investor confidence and enhance the momentum for development. For Sudan, it is critical to apply the rent generated from natural resources to facilitating diversifi-cation to other non-resource-based industries. It has abundant land and natural resources, so it is a primary- product exporter in the first stage of development. To upgrade its industri-al structure, it must first close its endowment gaps with advanced industrial countries by in-vesting in human and institutional capital and in physical infrastructure.
Ferdinand BakoupActing Director, Country Economics
DepartmentVice-Presidency, Economic Governance and
Knowledge Management/Office of the Chief Economist
African Development Bank Group
Foreword

iv
Pref
ace
| A
fter
Tw
o D
ecad
es o
f “So
litud
e”: T
arge
ted
Stra
tegi
es fo
r Qui
ck E
cono
mic
Win
s
Preface
T he Bank has responded positively to a government request to finance the preparation of an economic recovery
master plan through its efforts to intensify its assistance to Sudan in the post-sanctions era. The plan will facilitate Sudan’s access to debt relief and its reintegration into the glob-al economy. That will, in turn, unlock conces-sional financing, create more fiscal space, at-tract both foreign and domestic investment, and end the country’s international economic isolation.
Preparing the plan will proceed in tandem with updating the arrears clearance and debt relief strategy financed by the Bank in 2013 and resuming technical assistance to the Afri-can Union High-level Implementation Panel, chaired by the former president of South Af-rica, Thabo Mbeki. The strategy will be used by the Tripartite Committee on Debt—com-prising the governments of Sudan and South Sudan and the Panel—to seek debt relief. Since 2010, the Bank has complemented its technical and advisory services to the Panel, the lead mediator in Sudan’s initiative to secure a bailout package to address its debt burden. The Bank will resume technical and advisory services to enable Sudan to build momentum seeking debt relief, especially in searching for a debt relief champion.
African Development Bank Group assistance to Sudan will be undertaken in the context of the extended Sudan Country Brief 2020–21. This extended brief, as the development coop-eration framework between the Bank and the government of Sudan, has two pillars: capacity building for improving service delivery, and ag-riculture for job creation and livelihoods. The complementary and mutually reinforcing pillars address the country’s fragility and are geared toward attaining the Bank’s High 5 development goals—light up and power Africa, feed Africa, industrialize Africa, integrate Africa, and improve the quality of life for the people of Africa. The assistance will unlock about $277 million for 2020–21, bringing the Bank’s Sudan portfolio to about $431 million. The Bank will leverage addi-tional resources from bilateral Trust Funds, Afri-ca50, the Global Environment Fund, the Climate Investment Fund, and the Green Climate Fund and explore co-financing with other partners.
This economic report analyzes the impact of sanctions and suggests a pragmatic poli-cy framework and set of targeted policies to achieve quick economic wins.
Gabriel NegatuDirector General, East Africa Development and
Business Delivery OfficeAfrican Development Bank Group

v
Con
tent
s |
Aft
er T
wo
Dec
ades
of “
Solit
ude”
: Tar
gete
d St
rate
gies
for Q
uick
Eco
nom
ic W
ins
Foreword� iiiPreface� ivAcknowledgements� xAbbreviations� xi
Overview� 1
Part�1� Sudan’s�economy� 7
Chapter�1�Sudan�in�the�global�economy� 9
Issues of regional integration 10Sudan’s assets 11Sectoral structure and unemployment 11
Chapter�2�A�volatile�and�challenging�environment� 17
Political background to macroeconomic imbalances 17The macroeconomic effects of Sudan’s two decades of ‘solitude’ 18Missed economic opportunities but still resilient 19
Chapter�3�Growing�macroeconomic�imbalances� 23
Fiscal imbalance and inflation 24Dynamics of public debt and debt sustainability 24Official external flows, foreign direct investment, and remittances 26Macroeconomic effects of sanctions 29Evidence of the price effect of sanctions 31
Chapter�4�Charting�a�new�path� 33
Poverty and inequality 34Opportunities for reengaging with the international community 36A macroeconomic strategy for the post-sanctions era 41A new path 45
Contents

vi
Con
tent
s |
Aft
er T
wo
Dec
ades
of “
Solit
ude”
: Tar
gete
d St
rate
gies
for Q
uick
Eco
nom
ic W
ins
Part�1�Notes�and�referencesNotes 47References 47
Part�2� Targeted�strategies�for�quick�economic�wins� 51
Chapter�5�Sudan’s�medium-term�options� 53
The Growth Identification and Facilitation Framework 54
Chapter�6�Identifying�sectors�with�latent�comparative�advantage� 59
Sudan’s existing comparative advantage 59Which sectors could Sudan potentially enter competitively? 62How does comparative advantage change over time? 62Identifying sectors for quick wins in the short to medium term 64
Chapter�7�Assessing�domestic�capacity�and�production�costs� 69
Sudan’s manufacturing sector 69Estimating direct production costs 71Easing institutional constraints to reduce costs 71
Chapter�8�Attracting�financing�for�economic�development� 75
Sudan’s advantages as a member of international organizations 75New forms of development financing 75Patient capital 76
Chapter�9�Scaling�up�self-discovery�by�private�firms� 81
Examples of successful self-discovery by private firms in other countries 81Support by the government of Sudan 82
Chapter�10�Recognizing�the�power�of�industrial�parks�and�providing�limited�incentives� 85
Recognizing the power of industrial parks and export processing zones 85Providing limited incentives to industries having a latent comparative advantage 87
Part�2�Notes�and�referencesReferences 89Notes 89

vii
Con
tent
s |
Aft
er T
wo
Dec
ades
of “
Solit
ude”
: Tar
gete
d St
rate
gies
for Q
uick
Eco
nom
ic W
ins
Annexes� 93
Annex�1.�Background�information� 95Annex�2.�Economic�performance� 98Annex�3.�Cointegration�results� 106Annex�4.�Forums�and�commitments�for�cooperation�with�Africa� 110Annex�5.�Xinjiang’s�successful�targeted�industrial�policies� 111
Boxes1 Growth Identification and Facilitation Framework at a glance 53.1 Sanctions, war, trade, and macroeconomic conditions 234.1 Setting poverty simulation parameters 364.2 Gum arabic for economic recovery and environmental sustainability in Sudan 445.1 Growth Identification and Facilitation Framework at a glance 555.2 From a commodity exporter to a manufacturing powerhouse: China’s economic
transformation 566.1 Measuring revealed comparative advantage 606.2 Which subsectors create greater numbers of blue-collar jobs? 677.1 Profile of a local leather goods producer 708.1 Combating desertification through public–private partnerships: The Kubuqi
business model 78
Figures1.1 Sudan, East Africa, and world markets 91.2 Natural resource rents in Sudan, 1995–2015 111.3 Sudan’s rapidly growing young labor force, 1950–2100 121.4 Sectoral value added in Sudan, 1980–2016 121.5 Poverty incidence by professional category in Sudan, 2015 141.6 Distribution of labor force by sector of activity in Sudan, 2009 and 2015 152.1 Timeline of major events in Sudan 172.2 Average real GDP growth in Sudan, 1981–2016 192.3 Oil rent and GDP per capita growth 202.4 Output volatility 202.5 Sudan total domestic investment 212.6 Bilateral trade of Sudan, by trading partner 213.1 Total government revenues and oil rents in Sudan, 1990–2016 243.2 Fiscal balance and inflation in Sudan 243.3 Public sector wages and government expenditure in Sudan 253.4 Sudan’s debt profile 253.5 Total and external debt, 1990–2016 263.6 Interest arrears, 1990–2016 263.7 Real exchange rate misalignment, 1990–2016 273.8 Real exchange rate misalignment and terms of trade, 1993–2016 273.9 Real exchange rate misalignment and exports performance, 1990–2016 28

viii
Con
tent
s |
Aft
er T
wo
Dec
ades
of “
Solit
ude”
: Tar
gete
d St
rate
gies
for Q
uick
Eco
nom
ic W
ins
3.10 U.S. aid to Sudan, 1990–2016 283.11 Remittances to Sudan, 1990–2016 293.12 Domestic credit to the private sector, 1980–2016 294.1 Sectoral contribution to GDP in Sudan 334.2 Agriculture’s share of employment in Sudan 344.3 Projecting the Sudanese poverty trend using 2009 data 354.4 Projected trends in poverty under alternative scenarios, 2014–20 354.5 Projected trends in poverty where structural transformation is driven by a switch in
employment 374.6 Projected trends in poverty where structural transformation by driven by switches
in employment and productivity 374.7 The Belt and Road Initiative includes a “string of pearls” in East Africa — Sudan
could be one of the pearls 394.8 Outward foreign direct investment by BRICS countries, 2000–2016 404.9 Composition of China-sponsored projects and programs in Sudan 414.10 Composition of China-sponsored infrastructure projects by percentage of
projects…and by percentage of dollars spent 415.1 Industrialization is an engine of growth: manufacturing and income growth, 1990–2014 536.1 China’s revealed comparative advantage is declining in labor-intensive export
sectors, 1984–2016 636.2 Revealed comparative advantage is declining in some sectors in Egypt, Tunisia, and
Vietnam 647.1 Sudan’s industrial sector’s share of employment 698.1 Shares of world investment from developing country groups will overtake shares
from developed countries after 2015, 1965–2030 768.2 Composition of external financing flows to developing economies, $1.4 trillion in
total, 2016 77A1.1 Sudan’s young labor force and population premium 95A1.2 Sudan’s total exports in 2015 were $5.7 billion 97A1.3 Sudan’s total imports in 2015 were $10.5 billion 97A2.1 Sudan’s share in regional gross domestic products 98A2.2 Domestic investments in Sudan 98A2.3 Oil rents and gross domestic product in Sudan 99A2.4 Total oil rents and net product taxes in Sudan 99A2.5 Net taxes on products in Sudan 100A2.6 Trends in agricultural trade in Sudan 100A2.7 Total external financing flows in Sudan 101A2.8 Decomposition of external financial flows in Sudan 101A2.9 Share of the United States in total ODA in Sudan 102A2.10 Remittances received in Sudan 102A2.11 Remittance growth and share in GDP in Sudan 103A2.12 Institutional efficiency indices in Sudan 103A2.13 Trade facilitation indices in Sudan 104A3.1 Estimated normalized cointegrating vectors 108

ix
Con
tent
s |
Aft
er T
wo
Dec
ades
of “
Solit
ude”
: Tar
gete
d St
rate
gies
for Q
uick
Eco
nom
ic W
ins
A3.2 Generalized impulse responses to a shock in the PPP relation 108A3.3 Generalized impulse responses to shock in PPP relation with broad money 109A5.1 Structural change by sector and employment: 1990–2015 112A5.2 Xinjiang: Trade openness and border trade 113
Tables1.1 Unemployment and youth unemployment by sex in Sudan, 2015 131.2 Youth unemployment in Sudan and several comparators, 1990–2016 131.3 Poverty decomposition by state in Sudan 152.1 Exports of Sudan, by partner (percent of total exports) 212.2 Imports of Sudan, by partner (percent of total imports) 213.1 China’s share in total grants and loans and in debt of Sudan, 1999–2007 283.2 Financial inflows to Sudan 293.3 Macroeconomic impact of 1997 sanctions (before and after analysis) 303.4 Macroeconomic impact of 1997 and 2006 sanctions and 2011 secession of South
Sudan (impact analysis with additional major shocks) 306.1 Sudan and identified comparator countries 606.2 Identified subsectors in which Sudan has a revealed comparative advantage 616.3 Subsectors in which revealed comparative advantage is declining in comparator
countries and which Sudan could potentially enter 626.4 Priority subsector identification using the four criteria for identifying subsectors
for quick wins in the short to medium term 657.1 Foreign direct investment in Sudan’s textiles and leather industry, 1992–2015 707.2 Entry-level blue collar labor costs in Sudan and selected countries 717.3 Performance of logistics services in Sudan and comparator countries 727.4 Access to infrastructure in selected capital cities in Sub- Saharan Africa (percent of
households with access) 73A1.1 Population density: Sudan and its comparators 95A1.2 Sudan’s revealed comparative advantage in SITC 4 digit 96A2.1 Structural transformation (or the lack of) in Africa and Asia 104A3.1 Relative purchasing power parity (RPPP), 1971Q1–2017Q4 106A3.2 Inflation error correction model 1970Q1-2017Q4 107

x
Ack
now
ledg
emen
ts |
Aft
er T
wo
Dec
ades
of “
Solit
ude”
: Tar
gete
d St
rate
gies
for Q
uick
Eco
nom
ic W
ins
Acknowledgements
T his country economic report is a prod-uct of the Vice-presidency for Eco-nomic Governance and Knowledge
Management. Ferdinand Bakoup (Acting Di-rector, Country Economics Department) co-ordinated the preparation of the report and Suwareh Darbo (principal country economist for Sudan) was the Task Team Leader. Vivi-anus Ngong, Amah Ezanin Marie-Aude Koffi, and Tricia Baidoo helped with coordination of the various aspects of the production of the report.
Abebe Shimeles (then Acting Director of the Macroeconomics Policy, Research, and Fore-casting Department) led the team preparing macroeconomic background papers. The team included Anthony Simpasa and Chuku Chuku. Linguere Mbaye and Zackary Seogo provided excellent support and assistance.
The Statistics Department produced the data on poverty under the guidance of Charles Leyeke Lufumpa, Director. Louis Kouakou Koua led the statistics team, which included Nirina Letsara and Yassine Jmal on poverty issues. The report team is grateful for the very productive
collaboration with Sudan’s Central Bureau of Statistics, which led to the successful comple-tion of the survey and the compilation of key indicators under the supervision of the CBS Director General, Dr. Karam Allah Ali Abdelrah-man. The team is also grateful to the Sudanese government ministries for their invaluable con-tributions to the poverty study.
The following external consultants and re-searchers contributed background papers to different chapters: Yan Wang, Suliman Kab-bashi, Adams Adama, Zorobabel T. Bicaba, and Tiguene Nabassaga. Audrey Chouchane and Mark Eghan provided comments on some parts of the report.
Sadiq Bentum Commey (Eighth Wonder Company Limited) designed the cover of the report. Editing and layout were carried out by a team from Communications Development Incorporated led by Bruce Ross-Larson and in-cluding Joe Caponio, Mike Crumplar, and Elaine Wilson.
Finally, the report benefited immensely from the advice of Ibrahim Elbadawi, Managing Director, Economic Research Forum.

xi
Abb
revi
atio
ns |
Aft
er T
wo
Dec
ades
of “
Solit
ude”
: Tar
gete
d St
rate
gies
for Q
uick
Eco
nom
ic W
ins
ACDRS Arrears clearance and debt relief strategy
AfDB African Development BankAGOA African Growth and Opportunity ActAIIB Asian Infrastructure Investment
BankAUHIP African Union High Level
Implementation PanelBRI Belt and Road InitiativeCOMESA Common Market for Eastern and
Southern AfricaCOP21 Paris Climate ConferenceCPI Consumer price indexEBA Everything but ArmsESA Eastern and Southern AfricaEU European UnionFAO Food and Agriculture OrganizationFDI Foreign direct investmentFOCAC Forum on China–Africa
CooperationGDP Gross domestic productGNI Gross national incomeHIPC Heavily indebted poor countriesI2E Importing to exportIFAD International Fund for Agricultural
DevelopmentILO International Labour OrganizationIMF International Monetary FundIT Information technology
KAF Korea–Africa ForumLC Letter of creditLLMICS Low- and lower-middle income
countriesLPI Logistics Performance IndexMVA Manufacturing value addedODA Official development assistanceOECD Organisation for Economic Co-
operation and DevelopmentOFAC U.S. Treasury Office of Foreign
Asset ControlOFDI Outward foreign direct investmentOOF Other official financePPP Purchasing power parityPRSP Poverty reduction support planRCA Revealed comparative advantageSEZ Special economic zoneTICAD Tokyo International Conference on
African DevelopmentTSA Treasury single accountUAE United Arab EmiratesUN United NationsUNEP United Nations Environmental
ProgrammeU.S. United StatesVAR Vector autoregressionWDI World Development IndicatorsWITS World Integrated Trade SolutionWTO World Trade Organization
Abbreviations

1
Ove
rvie
w |
Aft
er T
wo
Dec
ades
of “
Solit
ude”
: Tar
gete
d St
rate
gies
for Q
uick
Eco
nom
ic W
ins
Overview
U .S. economic sanctions were imposed in 1997 after tensions escalated be-tween South Sudan and Sudan and
fighting between the Sudan People’s Liberation Army and Sudan Armed Forces and other mili-tias became intense. The sanctions led to two decades of “solitude” for Sudan. Initially, the effects were mild, since they mainly restricted trade, aid, and bank transactions. The sanctions limited banking sector access to the U.S. dollar clearing system in New York and froze govern-ment deposit accounts with U.S. banks.
The severity of sanctions for individuals and private business activity began to be felt in 2008/2009, when the U.S. Treasury Office of Foreign Asset Control (OFAC) started to moni-tor international transactions of all major inter-national banks. OFAC especially targeted trans-actions with sanctioned countries (Cuba, Iran, Sudan, and others) and applied hefty fines on banks doing business with them.
Sudanese in the diaspora resorted to risky, high-cost, informal, and time-consuming ways of physically transferring cash to their families in Sudan. And the private sector cost of doing business in trade finance (exports or imports) became prohibitively high as international and regional banks avoided Sudanese transactions.
The number of international and regional banks willing to undertake transactions with Sudan has diminished considerably directly due to fear of huge fines imposed by regula-tors. The risk-return curve and risk premiums shifted upward considerably as seen in the following:• Letter of credit confirmation charges in-
creased from 0.1 percent per quarter to 2.5 percent per quarter — that is, 25-fold.
• Terms of financing deteriorated. The letter of credit (LC) margin increased from 10 per-cent to 100 percent. The name “letter of cash” superseded “letter of credit.”
• New charges were introduced, such as a “compliance charge” — a fee of up to 2 per-cent levied by some banks on each trans-action. The banks argued that compliance charges compensate for the cost1 of going through the legal restrictions to comply with U.S. and European Union sanctions.
• International concessional resources de-clined. Net official development assis-tance plummeted from $1.5 billion in 2011 to $900 million in 2015 (AfDB).
• Among macroeconomic indicators2, growth plummeted to 3 percent a year in 2016 and was projected at 3.5 percent in 2017. Infla-tion spiraled to 36.5 percent in 2013 and 36.9 percent in 2014. Current account defi-cits were huge: 10.3 percent of GDP in 2012 and 8.1 percent of GDP in 2013. The country went from a fiscal surplus of 0.1 percent of GDP in 2011 to a deficit of –3.1 percent in 2012 and –2.2 percent in 2013. Foreign exchange reserves plummeted from 1.9 months of import cover in 2012 to 1 month of import cover in 2016, and the parallel market ex-change rate soared while the official market exchange rate remained virtually fixed. (The gap or premium between the parallel and official market rate was more than 120 per-cent in August 2017.)
• Unemployment and poverty rose as a result of the exchange rate’s rapid depreciation and persistent inflation.
• AfDB operations were crippled as interme-diary banks refused to conduct transactions

2
Ove
rvie
w |
Aft
er T
wo
Dec
ades
of “
Solit
ude”
: Tar
gete
d St
rate
gies
for Q
uick
Eco
nom
ic W
ins
bearing the name “Sudan,” so that proj-ects recorded low disbursement rates even though the Bank had obtained an OFAC li-cense in September 2015.Sudan reached several milestones3 on the
way to getting sanctions lifted. Political prog-ress emerged from the National Political Dia-logue in 2016, the 2016 Addis Ababa Roadmap for Peace, and the formation of a government of national unity in 2017. The government has allowed humanitarian aid into Darfur and other rebellious border areas. Sudan made progress with South Sudan in addressing the contentious issues that dominated the immediate post-se-cession years, among which only border de-marcation, the “Two Areas,” and the status of Abyei have yet to be fully resolved. Sudan’s gov-ernment maintains a fruitful relationship with neighboring countries in combating terrorism and thus contributing to regional stability.
The United States permanently lifted sanc-tions on Sudan on 6 October 2017. The decision to lift sanctions and end an economic embargo came after the Trump administration removed Sudan from the list of countries whose citizens are subject to travel restrictions in September 2017. Sudan was the only country removed. However, Sudan remains on the list of state sponsors of terrorism, alongside Iran and Syria, and must discontinue its alleged arms deals with North Korea if the lifting of sanctions is to be maintained.
A new strategy is needed to address Sudan’s post-sanctions macroeconomic challenges. Sudan will continue to face the same macro-economic challenges after sanctions as it did before. This report outlines a strategy aimed at sustainable growth after two decades of sanctions.
The outlookThe permanent removal of U.S. economic sanctions on Sudan creates an incentive for
the Sudanese government to deepen policy reforms. That would strengthen the case for heavily indebted poor countries (HIPC) debt relief,4 which might enlarge the fiscal space, attract more concessional financing, and help reintegrate Sudan into the global economy. The removal of sanctions also bodes well for the fairly resilient private sector, which is now looking for opportunities to borrow from the Bank and others. Both traditional and nontra-ditional creditors are stepping up technical assistance work that would position them to take such investment opportunities. The re-moval of sanctions will also improve the op-erational environment, ending long delays in transferring funds from such development partners as the Bank.
However, the fiscal crisis and the huge debt burden will persist unless the government reaches out to creditors, and intensifies its engagement with the International Monetary Fund to deepen macroeconomic reforms, par-ticularly addressing the exchange rate misalign-ment and tightening monetary policy improves the investment climate to facilitate private sector activity and inflows of foreign direct in-vestment and official development assistance — while limiting the quasifiscal activities of the Central Bank of Sudan. And Sudan urgent-ly needs to reactivate the Tripartite Commit-tee on debt and coordinate with the Bretton Woods institutions and the AfDB in the con-text of the Technical Working Group5 on Debt for HIPC debt relief.
The outlook faces risks. The large and per-sistent external financing gaps over the medium term, if unfilled, could create disorderly adjust-ment, depressed economic activity, and rapid inflation. Mitigating the risks while maintaining the fixed exchange rate regime will require sig-nificant fiscal and monetary adjustment. Other risks include reduced FDI, remittances from the Gulf, and lower oil receipts from South Sudan. Progress in the national dialogue, which

3
Ove
rvie
w |
Aft
er T
wo
Dec
ades
of “
Solit
ude”
: Tar
gete
d St
rate
gies
for Q
uick
Eco
nom
ic W
ins
culminated in the 2016 Addis Ababa Roadmap for Peace and the formation of a Government of National Unity in 2017, augurs well for politi-cal and macroeconomic stability.
A new pathIn today’s increasingly dynamic, multipolar, yet interdependent world, Africa needs a “can do” mindset6 — to cooperate on structural trans-formation for job creation. Emerging and de-veloping countries now account for more than 57 percent of global GDP, while the advanced industrial countries account for less than 43 percent. Emerging and developing countries account for over two-thirds of global growth and are the main drivers of the global econ-omy. China alone accounts for 33 percent of global growth, due to its economic size and its 6.5 to 7 percent annual growth.
Sudan has an unprecedented opportunity to be a destination for firms relocating from China and other emerging donor countries (in-cluding Arabic ones). As real wages rise in China and other upper-middle-income countries, mil-lions of manufacturing jobs will move to other developing countries along with outward for-eign direct investment. Improved connectivity from the construction of several special eco-nomic zones or agri-ecological parks near Port Sudan on the Red Sea would allow Sudan and other countries in northeast Africa to seize the opportunity provided by the industrial upgrading of China, India, South Korea, Turkey, Saudi Arabia, South Africa, and other leading dragons.
Based on the analysis here, policy makers in Sudan may consider the following options:
Option 1: Promote deep openings for foreign direct investment by setting up special eco-nomic zones (SEZs) or agri-ecological parks, and making the zone the best place to at-tract talent and the best place to invest. The
government must invest resource rents inno-vatively in hard and soft infrastructure in and around the selected zones and offer time-lim-ited incentives for foreign and domestic firms to invest — “building the nest to attract the phoenixes.” Further integration with the re-gional market would allow Sudan to seize some of the 85 million manufacturing jobs that China may have to relocate in the next decade. Sudan needs to compete for outward foreign direct investment from China, India, Saudi Arabia, South Korea, UAE, and other emerging econ-omies to foster learning, reduce poverty, and generate employment for its growing young labor force.
Option 2: Augment natural capital such as land, pasture, and other assets by investing in higher value-added agriculture, horticulture, tree crops, and animal husbandry. Promote agri-business for green development to get green financing. And combat desertification following the Kubuqi model in Inner Mongolia. Sudan is endowed with abundant arable pasto-ral land but faces severe drought and desert-ification. Since most of the poor live in rural areas, the government should enable the pri-vate sector to invest in large-scale irrigated ag-riculture, dairy farming and animal husbandry, and the leather supply chain for regional and global export. The production of fertilizers and farming equipment could provide inputs for agriculture and agri-business. To increase rural employment, it might be desirable to attract workers into light manufacturing, such as foot-wear and garments.
This strategy would help Sudan to grasp unprecedented opportunities as firms from emerging market economies, such as from China, Egypt, Saudi Arabia, and South Africa, “go global.” With South Sudan and other neigh-bors, Sudan should jointly form cross-country supply chains for assembly of farm machinery and equipment through original equipment

4
Ove
rvie
w |
Aft
er T
wo
Dec
ades
of “
Solit
ude”
: Tar
gete
d St
rate
gies
for Q
uick
Eco
nom
ic W
ins
manufacturing or processing trade. Sudan should also seek synergies between its emerg-ing tourism and services opportunities and eco-friendly SEZ development in an inclusive model focused on people, providing training and capacity building and attracting talent for a learning and innovative society.
Currently more than 100 countries world-wide have SEZ programs operating several thousand SEZs. As programs continue to pro-liferate, Sudan’s policy makers must target SEZ sectors and locations (near the port) so that foreign and domestic investors are attract-ed and will generate jobs. The mindset must change from the traditional one of seeking the first and best solutions for improving the nationwide investment climate to focusing on institutions that unite, infrastructure that con-nects, and interventions that target, including the sectors and SEZs identified in this report.
Targeting strategies for quick wins
Selecting sectors to targetIdentifying growth pillars or sectors is challeng-ing, as economic theory provides few clues for determining which industries are “right” and which are “wrong.” As some analysts caution, “[t]he first problem for the government in car-rying out an industrial policy is that we actu-ally know precious little about identifying … a ‘winning’ industrial structure. There is not a set of economic criteria that determine what gives different countries preeminence in particular lines of business.”7
A pragmatic process for identifying growth pillars is to analyze latent comparative advan-tage, defined as the “comparative advantage of an economy that is embedded in the factor costs of production [which are] determined by the economy’s endowment structure.”8 La-tent comparative advantage could lie in a new industry that is not yet successful in today’s
economy, mostly likely because of high trans-action costs, logistics, and other unfavorable business conditions. If these conditions are im-proved, the economy could be competitive in the world market in this industry.
Reasons for targeting sectorsSudan has suffered conflicts and embargos and other internal and external shocks since the 1950s, exacerbated by the secession of South Sudan in 2011. In this context, policy makers may want to prioritize policies for grasping low hanging fruit to achieve quick wins that could boost investor confidence and enhance the momentum for development.
The first step is to identify the right target countries and the right industries as a precon-dition for successful catch up (box 1). Gov-ernment must decide which infrastructure to improve and where these services should be provided to facilitate private sector activities. Developing country governments have limit-ed resources to invest in the necessary hard and soft infrastructure, which are often sector specific. Each developing country cannot be successful in all sectors, so individual sectors need to be targeted for attention. Identifica-tion is also important because specialization, agglomeration, and industrial clustering are crucial for achieving economies of scale and reducing costs in any industry. Government needs to provide infrastructure services in certain locations, or incentives for first mov-ers in certain sectors, so that private firms are not spread too thinly over too many sectors, as that reduces the firms’ chances of surviving and gaining a competitive edge in the interna-tional market.
For developing countries whose economies depend heavily on natural resources, it is crit-ical to apply the rent generated from natural resources to facilitating diversification to other non-resource-based industries. Many develop-ing countries have abundant land and natural

5
Ove
rvie
w |
Aft
er T
wo
Dec
ades
of “
Solit
ude”
: Tar
gete
d St
rate
gies
for Q
uick
Eco
nom
ic W
ins
resources, so they are primary product ex-porters in the first stage of their development. To upgrade their industrial structure, they must first close their endowment gaps with advanced industrial countries by investing in human and institutional (intangible) capital and physical infrastructure.
The strategy to get there is to follow a country’s comparative advantage at each stage of development. When firms choose to enter industries and adopt technologies that are consistent with the country’s compara-tive advantage, the economy is most compet-itive. In these conditions, firms will claim the
BOX�1�Growth�Identification�and�Facilitation�Framework�at�a�glance
The six-step Growth Identification and Fa-cilitation Framework can help policy mak-ers in developing countries identify indus-tries with latent comparative advantage and facilitate competitive private sector development:• Choosing the right target. Policy mak-
ers should first pinpoint economically dynamic countries with similar endow-ment structures to their own and with about 100–300 percent higher per capita incomes measured in purchasing power parity. They would then identify trad-able goods and services that have grown well in those countries for the past 15–20 years.
• Assisting domestic private firms. If some private domestic firms are already pro-ducing in these industries, the firms must have the tacit knowledge or local knowl-edge that lowers costs and makes them competitive. Policy makers should try to identify the obstacles that are prevent-ing these firms from upgrading the quali-ty of their products or that limit entry to those industries by other private firms.
• Attracting global investors. For indus-tries in which no or only a few domestic firms are producing, policy makers may try to attract FDI from the countries
identified in step 1 or from other high-er income countries producing those goods.
• Scaling up self-discoveries. In addition to the industries identified in step 1, the government should pay attention to spontaneous self-discovery by private enterprises and support the scaling up of successful private innovation in new industries.
• Recognizing the power of industrial parks. In countries with poor infrastruc-ture and an unfriendly business environ-ment, the government may set up spe-cial economic zones or industrial parks to lower barriers to firm entry and for-eign investment.
• Providing limited incentives to the right industries. Policy makers may consider compensating pioneer firms in the in-dustries identified as having latent com-parative advantage with time-limited tax incentives, co-financing for invest-ments, and access to foreign exchange, to compensate for the externalities cre-ated by first movers and to encourage firms to form clusters.
Source: Adapted from Lin and Monga 2011.

6
Ove
rvie
w |
Aft
er T
wo
Dec
ades
of “
Solit
ude”
: Tar
gete
d St
rate
gies
for Q
uick
Eco
nom
ic W
ins
largest possible market shares and create the greatest possible economic surplus. Owing to the competitiveness of these industries, rein-vested surpluses can earn the highest return, which allows the economy to accumulate even more physical and human capital. This
dynamic can lead to a virtuous circle: it can up-grade the country’s factor endowment struc-ture as well as its industrial structure and, in addition, make domestic firms more compet-itive in more capital- and skill-intensive prod-ucts over time.
7
Ove
rvie
w |
Aft
er T
wo
Dec
ades
of “
Solit
ude”
: Tar
gete
d St
rate
gies
for Q
uick
Eco
nom
ic W
ins
PA RT 1
Sudan’s economy

9
Suda
n in
the
glo
bal e
cono
my
| A
fter
Tw
o D
ecad
es o
f “So
litud
e”: T
arge
ted
Stra
tegi
es fo
r Qui
ck E
cono
mic
Win
s
CHAPTER 1
Sudan�in�the�global�economy
Sudan is located strategically on the Red Sea, the most important ocean shipping route between two of the world’s largest
markets — Asia and Europe. The country bor-ders Chad, Egypt, Eritrea, Ethiopia, Libya, and South Sudan and faces Saudi Arabia across the Red Sea. Port Sudan is near the Suez Canal, Dji-bouti, and the Gulf of Aden, an area through which more than 8,000 commercial cargo ships and around 8 percent of global sea-borne trade pass each year.
After decades of conflict and embargo, Sudan faces unprecedented opportunities and severe challenges. It is divided into three topographic regions: the deserts in the north, which account for about 30 percent of its area; the semi-arid Sahel belt in the middle; and the wetlands and rain forest in the south. Sudan has considerable
natural resource wealth in oil, metals, and land suitable for cultivation and pastoral activities. After the secession of South Sudan in 2011, the country lost 75 percent of its oil revenues and its natural resource rent declined, but mineral rent and other resource rents remain substantial.
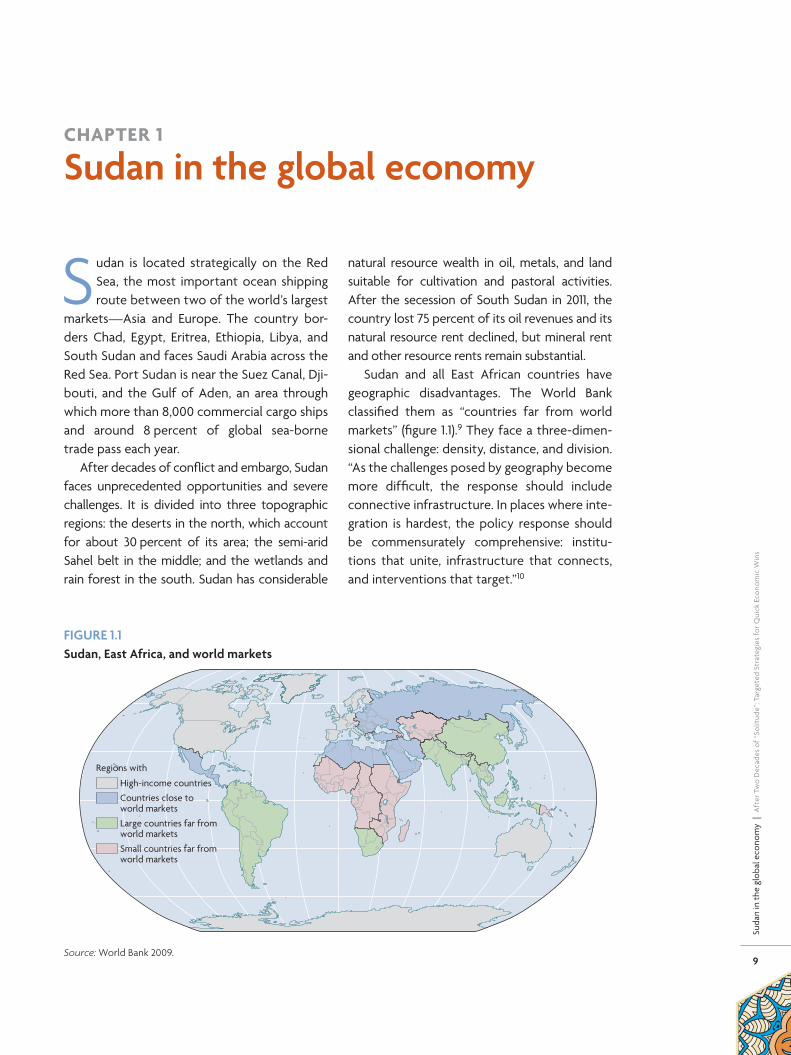
Sudan and all East African countries have geographic disadvantages. The World Bank classified them as “countries far from world markets” (figure 1.1).9 They face a three-dimen-sional challenge: density, distance, and division. “As the challenges posed by geography become more difficult, the response should include connective infrastructure. In places where inte-gration is hardest, the policy response should be commensurately comprehensive: institu-tions that unite, infrastructure that connects, and interventions that target.”10
FIGURE�1.1�Sudan,�East�Africa,�and�world�markets
High-income countries
Countries close toworld markets
Large countries far fromworld markets
Small countries far fromworld markets
Regions with
Source: World Bank 2009.

10
Suda
n in
the
glo
bal e
cono
my
| A
fter
Tw
o D
ecad
es o
f “So
litud
e”: T
arge
ted
Stra
tegi
es fo
r Qui
ck E
cono
mic
Win
s
Countries far from world markets can pro-mote regional integration and seeking large countries such as China, Egypt, and India that can serve as a regional conduit to world mar-kets. A combination of efforts can improve institutional cooperation and regional infra-structure investment. But that is not enough. Targeted interventions and incentives will also be necessary through the establishment of special economic zones and preferential measures to attract foreign direct investment (FDI) and access to markets and to productive inputs.
Issues of regional integrationSudan has a great potential to benefit from regional integration. The country is endowed with a 500 mile coastline on the Red Sea and strategically located Port Sudan, while most of its neighbors are landlocked, including Chad and South Sudan. But Sudan is less integrated into the global economy than any of its region-al neighbors except Eritrea, Somalia, and South Sudan, largely due to its undiversified economy and restrictive trade policies. Sudan must un-dertake reforms that will enhance its capacity to benefit from regional integration and trade. It should exploit its trade with landlocked neighbors. Sudan is already working closely with Ethiopia to improve interconnectivity by exploring a rail link opportunity.
Sudan is a member of several regional com-munities, including the Arab League, the East-ern and Southern Africa (ESA) group, and the Common Market for Eastern and Southern Africa (COMESA). It also has preferences in the European Union (EU) market under the “Every-thing but Arms” (EBA) initiative for least devel-oped countries. Negotiations for World Trade Organization (WTO) membership are well advanced.
With the U.S. embargo lifted in 2017, Sudan needs to deepen its regional and global
integration, including by seeking the African Growth and Opportunity Act (AGOA) prefer-ences offered by the United States. A bilateral free trade agreement with South Sudan (which is a part of AGOA) is critical. Enhanced regional cooperation could create a policy environment conducive to building connectivity structures, such as ports, railways, road corridors, and broadband networks linked to functioning hubs in neighboring countries.
After the lifting of international sanctions, Sudan and other northeastern African coun-tries will have unprecedented opportunities in the next decades in the multipolar world economy, particularly due to the recent de-velopment of supply-chain trade.11 Reduced transport costs, thanks to recent investment in cross-regional infrastructure, enable East Af-rican countries to target the large EU market, which accounts for 35 percent of world trade, and the Asian market, which accounts for 33 percent, by using the “importing to export” (I2E) model to join existing supply chains in the region.
Multilateral development banks and some bilateral donor organizations are enhancing their support for the United Nations Sustain-able Development Goals. New financing plat-forms, facilities, and instruments are being es-tablished.12 China has emerged as Africa’s most important economic partner in aid, trade, in-vestment, and infrastructure financing. As labor costs rise rapidly in China’s coastal regions, manufacturing centers are moving to China’s inland and western regions, and the Chinese government is encouraging enterprise “going out” and “going global” by relocating manufac-turing in developing countries. In doing so, Chi-nese firms of all sizes and sectors are bringing capital investment, managerial know-how, and entrepreneurial spirit to every corner of the African continent. They are creating millions of jobs in developing countries including African ones (see chapter 4).13

11
Suda
n in
the
glo
bal e
cono
my
| A
fter
Tw
o D
ecad
es o
f “So
litud
e”: T
arge
ted
Stra
tegi
es fo
r Qui
ck E
cono
mic
Win
s
Sudan’s assetsBroadly speaking, a country’s development depends on human and social capital, physical capital, and natural and environmental capital. Institutions and technologies shape the gover-nance, efficiency, and effectiveness of the use of such assets. These natural and factor en-dowments represent the total budget that the country can allocate to primary, secondary, and tertiary industries to produce goods and serv-ices. The relative abundance of endowments in a country, which determines the relative factor prices in it, are a given at any specific time but changeable over time. And infrastructure is a fourth endowment that is fixed at any given specific time and changeable over time.14
What is Sudan’s endowment structure? It is characterized by abundant land and natural re-sources but inadequate labor and human cap-ital and inadequate physical and infrastructur-al capital. The country’s natural resource rent was one of the highest in the world, accounting for more than 15 percent of GDP in the years around 2007. After the 2011 South Sudan seces-sion, Sudan lost 75 percent of its oil revenues, and total natural resource rents declined to less than 5 percent in 2015 (figure 1.2). However, this is no reason for dismay. Several countries have provided excellent examples of rising from the ruins of war and the lack of natural resources to become world manufacturing centers, par-ticularly the East Asian newly industrialized countries (NICs) (including South Korea) and, later, China and Vietnam. Cambodia, Ethiopia, Myanmar, and Uganda have made considerable progress.
Sudan’s population is estimated at about 39 million, with 66 percent living in the rural areas (of whom 20 percent are largely nomad-ic). The population is growing relatively rapidly at around 2.1 percent a year, with the average household size about 5.8 persons. The coun-try has a low population density — around 46 persons per square kilometer — but since
about 64 percent of the land is exposed to de-sertification due to natural or human factors, the population density in the oasis and urban areas is high. The largest metropolitan area, Khartoum, includes some 7 million people, of whom approximately 2 million are displaced from the southern war zones and the western and eastern drought-affected areas. Sudanese Arabs account for 70 percent of the popula-tion, with the rest being Arabized Beja, Copts, Nubians, and other peoples. Sudan is almost entirely Muslim. Most citizens speak Sudanese Arabic.15
Sudan’s working-age population (15–64) stands at 22 million, or 45 percent of the total population, and is growing rapidly, with low young-age and old-age dependency lev-els (figure 1.3). The labor force includes about 12 million people, with an overall labor force participation rate of 54 percent (31 percent for women and 76 percent for men). With such a young and growing labor force, Sudan will ex-perience a demographic dividend.
Sectoral structure and unemploymentSudan is the fourth largest economy in Sub- Saharan Africa, with a gross domestic product
FIGURE�1.2�Natural�resource�rents�in�Sudan,�1995–2015Percent of GDP
OilMineralsForest
0
25
5
10
15
20
2015
2014
2013
201220
1120
1020
0920
0820
0720
0620
0520
0420
0320
0220
0120
001999
1998199719961995
Source: Based on World Development Indicators database, accessed 21 October 2017.

12
Suda
n in
the
glo
bal e
cono
my
| A
fter
Tw
o D
ecad
es o
f “So
litud
e”: T
arge
ted
Stra
tegi
es fo
r Qui
ck E
cono
mic
Win
s
(GDP) of $160 billion (in 2014 purchasing power parity), following Nigeria, South Africa, and An-gola, in that order. With a gross national income (GNI) of $1,740 per capita, Sudan is classified by the World Bank as a lower-middle-income country. Despite its resource abundance, Sudan has not yet used its natural resource rent to diversify its economic structure. Like many of the East African countries, Sudan has made an inadequate structural transformation.
The share of agricultural value added has maintained at high level of 39–40 percent of GDP, and agriculture accounts for 80 per-cent of the labor force, implying low produc-tivity. Of the land, 64 percent is exposed to desertification due to human or natural fac-tors. The drought of the past few years ex-acerbated the situation. Serious environmen-tal degradation has affected Sudan during the past 20–30 years, caused by low rainfall (38 percent), overcutting of trees (32 per-cent), overcultivation (15 percent), and over-grazing (13 percent). The share of industrial value added declined dramatically after the conflict and secession from 11 percent to a mere 5 percent. The share of manufacturing
FIGURE�1.3�Sudan’s�rapidly�growing�young�labor�force,�1950–2100Population (millions)
2100209020802070206020502040203020202010200019901980197019601950
Age 14 and under
Age 15–64
Age 65 and over0
20
40
60
80
100
Source: United Nations population projections.
FIGURE�1.4�Sectoral�value�added�in�Sudan,�1980–2016Share of GDP
Agriculture35%
Services49%
Services45%
Services41%
Services53%
Services58%
Industry 15%(Manufacturing 8%)
Industry 14%(Manufacturing 7%)
Industry 25%(Manufacturing 7%)
Industry 12%(Manufacturing 6%)
Industry 3%
Agriculture42%
Agriculture34%
Agriculture35%
Agriculture40%
1980–89
1990–99
2000–09
2010–15
2016
Source: World Development Indicators.

13
Suda
n in
the
glo
bal e
cono
my
| A
fter
Tw
o D
ecad
es o
f “So
litud
e”: T
arge
ted
Stra
tegi
es fo
r Qui
ck E
cono
mic
Win
s
value added has stagnated at around 6 per-cent, lower than the 10 percent average for Sub- Saharan Africa and lower than 8 percent average of the lower-income group of de-veloping countries (see annex 5). The service sector accounted for over 50 percent of GDP. The country is not able to create sufficient formal sector jobs for its young and growing population.
Many smaller countries have seen the share of manufacturing in GDP increase over time.16 Among the small global players that industrial-ized between 1994 and 2014, Cambodia, Myan-mar, and Sri Lanka have made marked progress, and Bangladesh experienced a more modest increase in manufacturing’s share of GDP. In Sub- Saharan Africa, Botswana, Lesotho, Nige-ria, and Uganda were the biggest gainers, with 2–4 percentage point increases in manufac-turing’s share of GDP between 1994 and 2014, starting from lower base shares than the Asian countries did.
Sudan’s unemployment rate has been high — 14–15 percent — for more than two decades.
Youth unemployment, at 25 percent, is much higher than in Sudan’s neighbors or the Sub- Saharan average (tables 1.1, 1.2). Sudan has not been able to generate enough jobs for young entrants into the labor force. Many college graduates have been unemployed, suggesting both low job creation for these young entrants and a mismatch between their skills and labor market demands. The high youth unemploy-ment is a potential source of instability and conflict.
TABLE�1.1�Unemployment�and�youth�unemployment�by�sex�in�Sudan,�2015Percent
Total�unemployment
Youth�unemployment�
(ages�15–24)
Male 9.4 21.4
Female 22.2 30.0
Total 13.5 24.9
Source: AfDB based on Sudan household survey 2015.
TABLE�1.2�Youth�unemployment�in�Sudan�and�several�comparators,�1990–2016Percent
Comparator�countries 1990–99 2000–09 2010–15 2016
China 9.2 9.4 10.3 10.6
Sudan 23.3 23.0 21.5 22.4
Tunisia 31.8 30.3 36.8 35.7
Vietnam 4.7 5.3 5.7 6.4
Neighbors of Sudan
Central African Republic 6.7 6.8 6.6 6.9
Chad 5.6 5.8 5.8 5.8
Egypt 27.2 28.0 33.3 33.4
Ethiopia 6.0 5.6 5.3 5.7
Eritrea 7.5 7.5 7.2 7.3
Libya 19.5 19.1 18.7 19.2
Sub- Saharan Africa 8.0 8.1 7.5 7.4
Source: World Development Indicators database, accessed 24 October 2017.

14
Suda
n in
the
glo
bal e
cono
my
| A
fter
Tw
o D
ecad
es o
f “So
litud
e”: T
arge
ted
Stra
tegi
es fo
r Qui
ck E
cono
mic
Win
s
Sudan’s high youth unemployment was driven largely by overdependence on oil-led growth, which failed to create jobs and also led to the neglect of other productive sectors, such as agriculture. The mismatch between the skills of young graduates and the demands of the labor market makes it difficult to absorb them even as the service sector records rea-sonable growth. The government is working closely with the African Development Bank (AfDB) to address this problem through the EN-ABLE Youth Program, 17 which seeks to create business opportunities and employment for youth along priority agricultural value chains.
Sudan’s high growth in the late 2000s was neither inclusive nor broad based, and it left wide inequality across ages, sexes, and regions without appreciably reducing poverty. This is most notable in the labor force participation rates, where the workforce participation of men is shown to be higher than that of women across all age groups, recorded at 76 percent for men compared with only 31 percent for women. Only 29 percent of women ages 35–44 are active in the workforce, and only 14 per-cent of those ages 65 and older. The highest workforce participation is among men ages
35–54, with 96 percent working. This inequality is largely due to structural rigidities related to labor laws and cultural norms preferring male workers and discouraging employers from hir-ing women in certain jobs. Inclusive growth in Sudan would require not only economic di-versification to create jobs but also conscious policies to remove constraints on female labor force participation, including improving wom-en’s access to land and credit and offering pro-grams that target women.
Unemployment is a major cause of poverty in Sudan. Although individuals living in house-holds with unemployed heads represent only 2.4 percent of the population, 50 percent of them are poor. The most affected homes are those whose head is an unpaid family worker (figure 1.5). The 2014 poverty incidence was es-timated at 36.1 percent, and inequality is high, despite a decline in the Gini index from 0.354 in 2009 to 0.292 in 2014.
Inequality among Sudan’s states is high. Those with the lowest poverty incidence are the Northern, Al-Gezira, and River Nile (table 1.3). The Kordofan and Darfur states are the poorest. A breakdown of poverty by state sup-plemented by an index of priority shows which states should be prioritized for poverty reduc-tion measures. South Kordofan and West and Central Darfur, in which two in three people are poor, have the highest priority index — over 1.8 — and require special attention from policy makers. Red Sea and East and South Darfur are also priority states.
Manufacturing is the most productive sec-tor of the economy, where formal jobs are cre-ated. But manufacturing also employs far fewer people than agriculture or services (figure 1.6). Without manufacturing sector development, unemployment is unlikely to be resolved, es-pecially for youth and women, potentially lead-ing to social unrest. This issue is not limited to Sudan — it threatens all of Sub- Saharan Africa, Europe, and elsewhere.
FIGURE�1.5�Poverty�incidence�by�professional�category�in�Sudan,�2015Percent
0
10
20
30
40
50
60
70
Unpaidfamilyworker
UnemployedOwnaccountworker
Paidemployee
EmployerEconomicallyinactive
Retired
Source: AfDB Statistics.

15
Suda
n in
the
glo
bal e
cono
my
| A
fter
Tw
o D
ecad
es o
f “So
litud
e”: T
arge
ted
Stra
tegi
es fo
r Qui
ck E
cono
mic
Win
s
FIGURE�1.6�Distribution�of�labor�force�by�sector�of�activity�in�Sudan,�2009�and�2015
Agriculture38%
Services54%
Industry 8%
Agriculture45%
Services47%
Industry 8%
2009
2015
Source: AfDB based on Sudan household 2009 and 2015
surveys.
TABLE�1.3�Poverty�decomposition�by�state�in�SudanPercent
StatePoverty�
incidencePopulation�
shareAbsolutea�
contributionRelativeb�
contributionPriority�index
Northern 12.2 2.2 0.3 0.7 0.32
River Nile 19.9 3.9 0.8 2.1 0.54
Red Sea 51.4 3.7 1.9 5.3 1.43
Kassala 27.9 5.6 1.6 4.3 0.77
Al-Gadarif 31.6 5.1 1.6 4.4 0.86
Khartoum 29.9 17.4 5.2 14.4 0.83
Al-Gezira 18.3 11.5 2.1 5.8 0.50
White Nile 40.9 5.9 2.4 6.7 1.14
Sinnar 25.9 4.6 1.2 3.3 0.72
Blue Nile 34.6 3.1 1.1 3.0 0.97
North Kordufan 39.1 9.3 3.7 10.1 1.09
South Kordufan 67.0 2.5 1.7 4.6 1.84
West Kordufan 40.5 2.5 1.0 2.8 1.12
North Darfur 42.3 6.9 2.9 8.1 1.17
West Darfur 64.1 2.6 1.7 4.7 1.81
South Darfur 49.2 7.8 3.8 10.6 1.36
Central Darfur 67.2 3.3 2.2 6.1 1.85
East Darfur 50.4 2.0 1.0 2.8 1.40
Source: 2014 household budget survey.
a. The state’s contribution to Sudan’s total poverty incidence of 36.1 percent.
b. The state’s share of poverty as a percentage of the total number of poor people in
Sudan.


17
A v
olat
ile a
nd c
halle
ngin
g en
viro
nmen
t |
Aft
er T
wo
Dec
ades
of “
Solit
ude”
: Tar
gete
d St
rate
gies
for Q
uick
Eco
nom
ic W
ins
CHAPTER 2
A�volatile�and�challenging�environment
The past five decades have challenged the Sudanese economy with political and economic shocks such as civil con-
flict, military coups, and economic sanctions (figure 2.1). Although such shocks undermined the country’s capacity to efficiently use its re-sources, the economy has been quite resilient.
Many factors can explain this resilience. The oil boom that washed the economy with revenue, particularly between 1999 and 2010, pushed up domestic demand at an unprece-dented rate. Investment increased from a mere $422 million in 1960 to an average of $17 billion between 2009 and 2016. Private consumption continued to increase despite the secession of South Sudan, buoyed by remittances from abroad that were channeled mainly through informal means due to restrictions on interna-tional financial transactions, particularly from the United States. As a result, per capita GDP rose sharply from $687 in 1980 and reached $2,216 in 2016.18
Sudan’s experience illustrates econom-ic mechanisms that can be useful to African
countries in the aftermath of adverse shocks. This chapter examines Sudan’s macroeconom-ic performance under the U.S.-imposed em-bargo as well as the implications of the 2017 removal of these sanctions for the Sudanese economy.
Political background to macroeconomic imbalancesSince the mid-1970s, Sudan has experienced volatile domestic and regional political environ-ments. It has faced a protracted north–south civil war and about five internal conflicts within the north, two of which are not permanently settled. Six of its seven neighboring countries are currently unstable, in conflict, or fragile to some degree, while porous borders facilitate illegal trafficking of arms, drugs, and humans (including potential radicals), into the country. In 1997, the United States levied the first round of sanctions on Sudan. In 2011, South Sudan se-ceded after long years of bitter civil war. The Sudanese economy has largely depended on
FIGURE�2.1�Timeline�of�major�events�in�Sudan
20172016
20152014
20132012
20112010
20092008
20072006
200019
9719
9419
60
1994Non-accrual status
with the World Bankdue to arrears
1997U.S. sanctions
on Sudan
Oct. 2000Started
exporting oil
2006U.S. sanctions,
Darfur war
Jan. 2007New currency withan exchange rate of$1 = 2 Sudanese pounds
2011Secession of South Sudan
2014European
Unionsanctions
Jan. 2017U.S. sanctions
eased; temporaryand under review
Oct. 2017Removal of
articles 1 and 2of U.S. sanctions
Source: AfDB compilation.

18
A v
olat
ile a
nd c
halle
ngin
g en
viro
nmen
t |
Aft
er T
wo
Dec
ades
of “
Solit
ude”
: Tar
gete
d St
rate
gies
for Q
uick
Eco
nom
ic W
ins
oil, which contributed about 8 percent of GDP and more than 50 percent of fiscal revenues between 1995 and 2011. When South Sudan seceded, the world’s newest country received 75 percent of the oil revenues formerly ac-cruing to Sudan. Sudan, whose oil revenues dropped sharply to 2.2 percent of GDP in 2012–15, was left with a depleted fiscal position.
Those events had mixed effects on Sudan’s macroeconomic conditions. The oil boom bol-stered the country’s economy and fiscal posi-tion. However, it also created a disincentive to search for new sources of revenue and growth. The imposition of sanctions compounded the situation and led to Sudan’s international iso-lation. But it also pushed the country to look inward and to other partners, such as China, Kuwait, Qatar, Saudi Arabia, and United Arab Emirate, for trade and investment to sustain its economy. Nonetheless, the oil sector re-mained the main source of revenues and en-gine of growth. Those windfall revenues also stoked the “Dutch disease” — the harmful ef-fects of large increases in a country’s income — effects resulting in little or no detectable structural transformation. With the civil war against South Sudan intensified and militias emerging in Darfur and other regions, Sudan faced increasing international isolation, and its economy fell into an abyss as resources were diverted to fight the wars. In 2011, when South Sudan declared independence, the Su-danese economy grew by a mere 0.9 percent, sharply down from 6.5 percent the previous year. As oil revenues shrank, the fiscal defi-cit plummeted to –3.1 percent of GDP in 2012 from a surplus of 0.8 percent the year before. Inflation nearly doubled from 18.1 percent to 35.7 percent.
Poverty is also high in Sudan. In 2014, the proportion of people living below the pover-ty line was estimated at 25 percent. In the rural areas, the poverty rate of 27 percent is higher than in the cities, where it is 23 percent. The
easing of the 20-year U.S. blockade in October 2017 offered prospects for the country’s rein-tegration into the global economy and bright-ened its medium-term economic outlook.
The macroeconomic effects of Sudan’s two decades of ‘solitude’Before the sanctions were levied in 1997, Sudan already confronted several macroeconomic challenges. Between 1980 and 1996, the fiscal deficit averaged –10.8 percent of GDP, fueling average annual inflation of nearly 70 percent. The external current account deficit was above 30 percent of GDP. Excessive domestic absorp-tion to finance infrastructural development with very limited fiscal space created the high fiscal deficits. Debt started to build in 1970s, largely due to the country’s social and political instability and conflicts, and to sluggish eco-nomic performance from the 1970s through the early 1990s, later amplified by economic sanctions. External debt escalated to a peak of 558 percent of GDP in 1990, compounded by increased accumulation of arrears due to low debt service payments. Sudan committed an average of 22 percent of its exports to debt service, with the lowest rate, 5.6 percent, re-corded in 1993. By the time sanctions were im-posed in 1997, the external debt had declined but remained a high 139 percent of GDP, and debt service stood at 6.7 percent of exports.
These macroeconomic imbalances slowed the economy to an average annual growth of only 2.9 percent between 1980 and 1996. The recent easing of sanctions, by leading to nor-malization of relations with the internation-al community, could bring about debt relief.19 The prospects for debt relief are favorable given Sudan’s recent reforms: satisfaction of the milestones for the lifting of sanctions, suc-cessful implementation of 13 staff-monitored programs; preparation of an arrears clearance and debt relief strategy (ACDRS), satisfaction
19
A v
olat
ile a
nd c
halle
ngin
g en
viro
nmen
t |
Aft
er T
wo
Dec
ades
of “
Solit
ude”
: Tar
gete
d St
rate
gies
for Q
uick
Eco
nom
ic W
ins
of the technical requirements for heavily in-debted poor countries (HIPC) debt relief,20 and creation of a government of national unity in which major opposition parties participate (following the National Political Dialogue that began in 2014). However, concerted efforts will be required to assure creditors and investors of the country’s continuing commitment to re-forms when trade and financial conditions be-come less restricted.
The Bank is updating the ACDRS, which it financed 2013, and as a facilitator is resuming assistance to the African Union High Level Implementation Panel (AUHIP) mediating be-tween Sudan and South Sudan on post-seces-sion issues. The resulting report will be used by the Tripartite Committee, comprising the AUHIP and the governments of South Sudan and Sudan as an instrument for policy dia-logue on debt relief. And the Bank continues to work with the World Bank, International Monetary Fund (IMF), and Paris Club credi-tors in the context of the Technical Working Group to advocate for debt relief on behalf of the two countries. The poverty reduction support program (PRSP) for Sudan, which the Bank is financing as one of the conditions for HIPC debt relief, is also being finalized. Finally, the lifting of sanctions augurs well for the U.S. removing Sudan from its list of state sponsors of terrorism, eventually paving the way for HIPC debt relief.
Missed economic opportunities but still resilientSudan’s development challenges and oppor-tunities in shaping the outcome of the econ-omy can be viewed under several competing hypotheses that reinforce each other.21 The first cites the role oil has played in the Suda-nese economy. The second relates to political instability. Since its independence from Brit-ish rule in 1956, Sudan has been plagued by
ethnic strife and internal conflict. The most pronounced occasions were the First Sudanese Civil War (1955–72) and the Second Sudanese Civil War (1983–2005), which culminated in the July 2011 secession of South Sudan. These con-flicts were rooted in economic, political, and social inequalities.
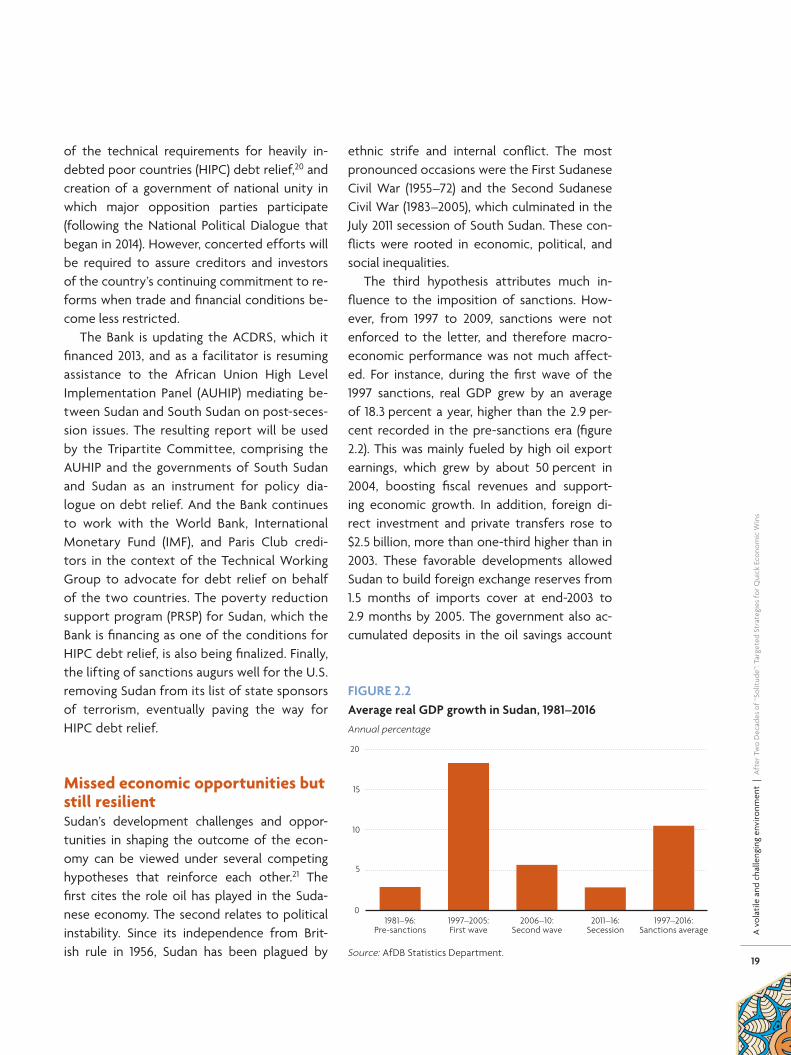
The third hypothesis attributes much in-fluence to the imposition of sanctions. How-ever, from 1997 to 2009, sanctions were not enforced to the letter, and therefore macro-economic performance was not much affect-ed. For instance, during the first wave of the 1997 sanctions, real GDP grew by an average of 18.3 percent a year, higher than the 2.9 per-cent recorded in the pre-sanctions era (figure 2.2). This was mainly fueled by high oil export earnings, which grew by about 50 percent in 2004, boosting fiscal revenues and support-ing economic growth. In addition, foreign di-rect investment and private transfers rose to $2.5 billion, more than one-third higher than in 2003. These favorable developments allowed Sudan to build foreign exchange reserves from 1.5 months of imports cover at end-2003 to 2.9 months by 2005. The government also ac-cumulated deposits in the oil savings account
FIGURE�2.2�Average�real�GDP�growth�in�Sudan,�1981–2016Annual percentage
0
5
10
15
20
1997–2016:Sanctions average
2011–16:Secession
2006–10:Second wave
1997–2005:First wave
1981–96:Pre-sanctions
Source: AfDB Statistics Department.

20
A v
olat
ile a
nd c
halle
ngin
g en
viro
nmen
t |
Aft
er T
wo
Dec
ades
of “
Solit
ude”
: Tar
gete
d St
rate
gies
for Q
uick
Eco
nom
ic W
ins
that were higher than projected by 0.5 percent of GDP.
Despite higher government expenditures, higher fiscal revenues helped keep the fiscal deficit low, averaging only –0.02 percent of GDP during the first wave of sanctions com-pared with –11.8 percent in the preceding de-cade. The improved fiscal situation obviated the need for new net domestic financing. In the context of the National Comprehensive Strategy, the Central Bank of Sudan introduced
tight monetary policy and refrained from mon-etizing the deficit.22 This brought the rate of inflation down from an average of 81.6 per-cent between 1981 and 1996 to 14 percent be-tween 1997 and 2005.23 These favorable macro-economic developments bolstered the growth of the economy, with real GDP expanding at an unprecedented average of 18.3 percent a year. Concomitantly, per capita income nearly tri-pled from $449 in 1997 to $1,099 in 2005. (Fig-ure 2.3 shows the close relationship between oil rent and growth in per capita income in the sanctions era.)
Sudan’s heavy dependence on the volatile oil sector was reflected both in negative growth episodes, typically long but of small magnitude, and in positive growth spurts, which have been short but of larger magnitudes. The volatility affected prospects for economic diversification and transformation. The variability in output growth has been high even in comparison with other countries in the region such as Kenya and Tanzania. Only Ethiopia’s real GDP growth has been more volatile (figure 2.4). Sudan’s variabil-ity was especially high during the first round of sanctions from 1997 to 2005, in both historical and country comparative terms.
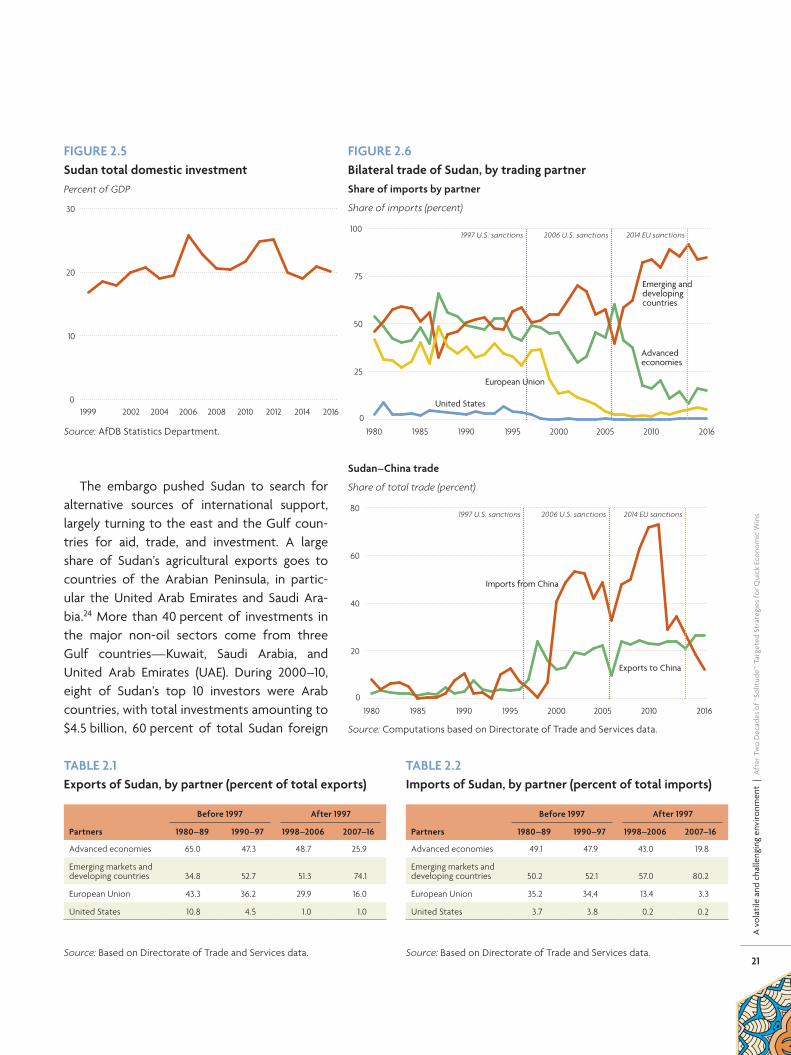
High output variability affected the coun-try’s public investment. But private investment, averaging 19.6 percent of GDP a year, emerged as the major driver of growth. Because of strong private investment, growth in total do-mestic investment accelerated by an annual average of about 2.5 percent during 2002–06, reaching a high of 25.7 percent of GDP in 2006 (figure 2.5). The sharp decline in 2008 marked the implementation and subsequent strength-ening of the second round of sanctions, which had been imposed in 2006. Later, investment picked up as uncertainty associated with the sanctions petered out. However, domestic in-vestment fell rapidly in 2011 with the secession of South Sudan and a decline in physical capital investment in the oil industry.
FIGURE�2.4�Output�volatility3-year moving standard deviation of real GDP growth
0
2
4
6
8
10
12
14
2006–161997–20051991–961981–90
EthiopiaTanzaniaKenyaSudan
Source: AfDB Statistics Department
FIGURE�2.3�Oil�rent�and�GDP�per�capita�growthOil rent (percent of GDP) GDP per capita growth
–0.2
–0.1
0.0
0.1
0.2
0.3
20162010200520001995199019851981
Oil rent
GDP per capita growth
0
5
10
15
20
251997 U.S. sanctions 2014 EU sanctions2006 U.S. sanctions
Source: Based on World Development Indicators database, 2017.
21
A v
olat
ile a
nd c
halle
ngin
g en
viro
nmen
t |
Aft
er T
wo
Dec
ades
of “
Solit
ude”
: Tar
gete
d St
rate
gies
for Q
uick
Eco
nom
ic W
ins
The embargo pushed Sudan to search for alternative sources of international support, largely turning to the east and the Gulf coun-tries for aid, trade, and investment. A large share of Sudan’s agricultural exports goes to countries of the Arabian Peninsula, in partic-ular the United Arab Emirates and Saudi Ara-bia.24 More than 40 percent of investments in the major non-oil sectors come from three Gulf countries — Kuwait, Saudi Arabia, and United Arab Emirates (UAE). During 2000–10, eight of Sudan’s top 10 investors were Arab countries, with total investments amounting to $4.5 billion, 60 percent of total Sudan foreign
FIGURE�2.6�Bilateral�trade�of�Sudan,�by�trading�partnerShare�of�imports�by�partner
Share of imports (percent)
0
25
50
75
100
20162010200520001995199019851980
European Union
Advancedeconomies
United States
1997 U.S. sanctions 2014 EU sanctions2006 U.S. sanctions
Emerging anddevelopingcountries
Sudan–China�trade
Share of total trade (percent)
0
20
40
60
80
20162010200520001995199019851980
1997 U.S. sanctions 2014 EU sanctions2006 U.S. sanctions
Exports to China
Imports from China
Source: Computations based on Directorate of Trade and Services data.
FIGURE�2.5�Sudan�total�domestic�investmentPercent of GDP
0
10
20
30
201620142012201020082006200420021999
Source: AfDB Statistics Department.
TABLE�2.1�Exports�of�Sudan,�by�partner�(percent�of�total�exports)
Partners
Before�1997 After�1997
1980–89 1990–97 1998–2006 2007–16
Advanced economies 65.0 47.3 48.7 25.9
Emerging markets and developing countries 34.8 52.7 51.3 74.1
European Union 43.3 36.2 29.9 16.0
United States 10.8 4.5 1.0 1.0
Source: Based on Directorate of Trade and Services data.
TABLE�2.2�Imports�of�Sudan,�by�partner�(percent�of�total�imports)
Partners
Before�1997 After�1997
1980–89 1990–97 1998–2006 2007–16
Advanced economies 49.1 47.9 43.0 19.8
Emerging markets and developing countries 50.2 52.1 57.0 80.2
European Union 35.2 34,4 13.4 3.3
United States 3.7 3.8 0.2 0.2
Source: Based on Directorate of Trade and Services data.
22
A v
olat
ile a
nd c
halle
ngin
g en
viro
nmen
t |
Aft
er T
wo
Dec
ades
of “
Solit
ude”
: Tar
gete
d St
rate
gies
for Q
uick
Eco
nom
ic W
ins
investments.25 In 2015, official creditors such as Kuwait, Qatar, Saudi Arabia, and UAE deposited an estimated $2.7 billion in the Central Bank of Sudan, boosting the country’s foreign exchange liquidity and reserves.
Asian firms also became increasingly in-volved in Sudan’s oil, led by the China National Petroleum Corporation with a 40 percent stake in the sector. Other firms were Malaysia’s Petro-nas, and India’s Oil and Natural Gas Corpora-tion, and the Sudan state oil company Sudapet. China’s dominance in the oil sector was evident in its share of FDI in the sector. China’s foreign investment in Sudan across all sectors stood at
38.7 percent of total foreign investment, but in the oil industry, it accounted for 99.9 percent.
China’s dominance resulted from the isolat-ing effect of U.S. sanctions, which drew other western allies away from Sudan (figure 2.6, ta-bles 2.1, 2.2). Although the U.S. share of Sudan’s trade was low even before sanctions, it contin-ued to decrease, and same trend appears for the European Union and other advanced econ-omies. At the same, Sudan has traded more with emerging markets and developing econ-omies (EMDEs). Among the EMDEs, China’s share of Sudan’s imports and exports increased greatly beginning in 1997.

23
Gro
win
g m
acro
econ
omic
imba
lanc
es |
Aft
er T
wo
Dec
ades
of “
Solit
ude”
: Tar
gete
d St
rate
gies
for Q
uick
Eco
nom
ic W
ins
S udan’s stable macroeconomic environ-ment, which, buoyed by oil revenues, prevailed for much of the late 1990s
and early 2000s, suffered seriously from the expanded sanctions regime of 2006 (box 3.1). The economy was already showing weakness, and oil revenues were less and less adequate
to support the transition following the 2005 South Sudan independence referendum. Non-oil revenues were also lower than pro-jected. Sudan’s fiscal position became severe-ly impaired. The macroeconomic imbalances carried over into the first quarter of 2007 and accumulated in later years.
CHAPTER 3
Growing�macroeconomic�imbalances
BOX�3.1�Sanctions,�war,�trade,�and�macroeconomic�conditions
Gravity modelThe sanctions imposed on Sudan mainly targeted fi-nancial transactions. Inevitably, their effect, including constraints on trade, would have been borne by the external sector. Before sanctions, the United States and Sudan enjoyed sound trade relations, though the volume of trade was generally low. Using data from 1980 to 2015, a gravity model is used to assess the im-pact of sanctions on trade and other macroeconomic indicators, conditioning for factors such as war and membership in multilateral trade organizations. Trade and GDP data come from the Statistics Department of the African Development Bank, supplemented by sta-tistics from the International Monetary Fund and the World Bank. Data on other variables such as popula-tion and geographical area are drawn from the Centre d’Etudes Prospectives et d’Informations Internatio-nales. Empirical estimates show that the marginal ef-fect of the sanctions on Sudan’s exports to the United States is only +0.3. This suggests that although trade continued between the two countries, it was small in magnitude. The dummy variable is also positive and significant, suggesting that oil, which constituted the bulk of Sudan’s exports, was used as a conflict com-modity: proceeds were used to finance arms pur-chases or defray the adverse impact on the Sudanese economy of constraints on financial transactions.
VAR analysisA system of unrestricted vector autoregressions (VARs) as well as a cointegrated VAR (CVAR) also examined the effects of the sanctions on selected macroeconomic variables in Sudan: gross domes-tic product, government consumption expenditure, government capital investments, the development of the inflation, and exchange rate dynamics. The simulation was a 40-year period to disentangle the short-term impacts of the sanctions (1 to 3 years), the medium-term impacts (4 to 6 years), and the long-term impacts (7 to 15 years). Two key results emerge. First, the imposition of the sanctions had a negative immediate impact on GDP, but the impact was short-lived, manifesting for around 1 to 5 years. Second, the impact of the sanctions shock is only significant in the short to medium-term. In the long term (after 10 years), it appears not only to lose sig-nificance and strength, but it even becomes positive. These results suggest that the sanctions on Sudan had short- to medium-term significant impacts, while in the long term, their effects dissipated, per-haps due to coping strategies and opportunities that emerged with other countries — for example, China and Arab countries.
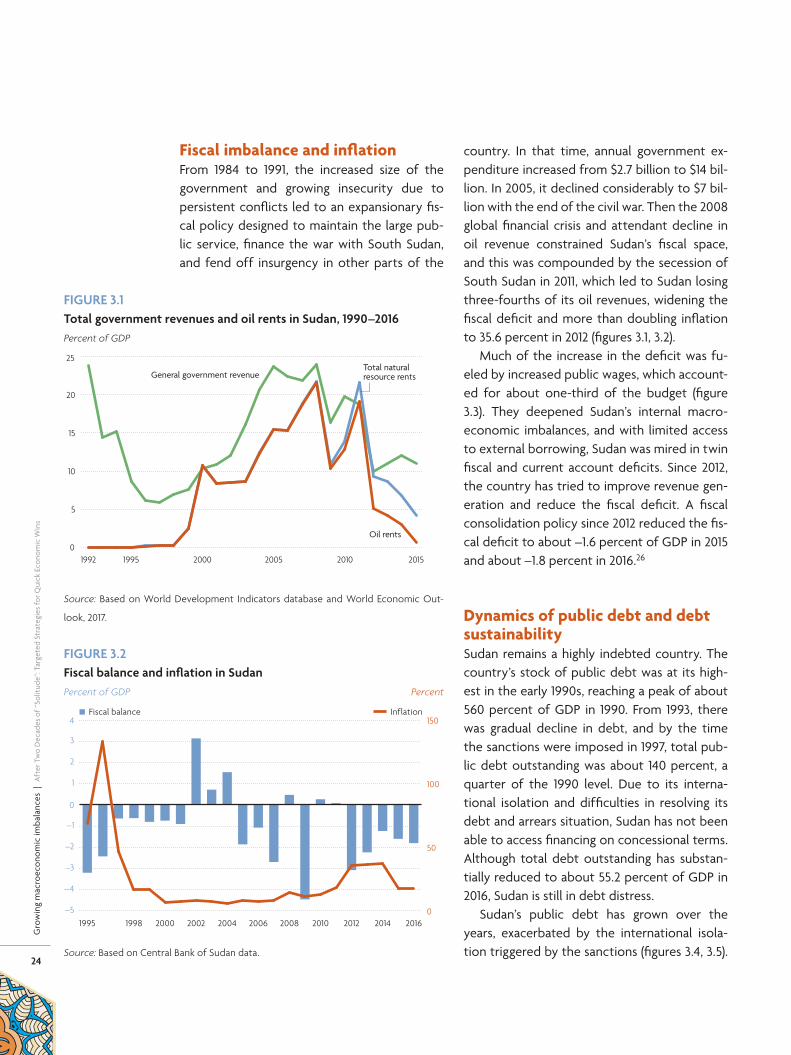
24
Gro
win
g m
acro
econ
omic
imba
lanc
es |
Aft
er T
wo
Dec
ades
of “
Solit
ude”
: Tar
gete
d St
rate
gies
for Q
uick
Eco
nom
ic W
ins
Fiscal imbalance and inflationFrom 1984 to 1991, the increased size of the government and growing insecurity due to persistent conflicts led to an expansionary fis-cal policy designed to maintain the large pub-lic service, finance the war with South Sudan, and fend off insurgency in other parts of the
country. In that time, annual government ex-penditure increased from $2.7 billion to $14 bil-lion. In 2005, it declined considerably to $7 bil-lion with the end of the civil war. Then the 2008 global financial crisis and attendant decline in oil revenue constrained Sudan’s fiscal space, and this was compounded by the secession of South Sudan in 2011, which led to Sudan losing three-fourths of its oil revenues, widening the fiscal deficit and more than doubling inflation to 35.6 percent in 2012 (figures 3.1, 3.2).
Much of the increase in the deficit was fu-eled by increased public wages, which account-ed for about one-third of the budget (figure 3.3). They deepened Sudan’s internal macro-economic imbalances, and with limited access to external borrowing, Sudan was mired in twin fiscal and current account deficits. Since 2012, the country has tried to improve revenue gen-eration and reduce the fiscal deficit. A fiscal consolidation policy since 2012 reduced the fis-cal deficit to about –1.6 percent of GDP in 2015 and about –1.8 percent in 2016.26
Dynamics of public debt and debt sustainabilitySudan remains a highly indebted country. The country’s stock of public debt was at its high-est in the early 1990s, reaching a peak of about 560 percent of GDP in 1990. From 1993, there was gradual decline in debt, and by the time the sanctions were imposed in 1997, total pub-lic debt outstanding was about 140 percent, a quarter of the 1990 level. Due to its interna-tional isolation and difficulties in resolving its debt and arrears situation, Sudan has not been able to access financing on concessional terms. Although total debt outstanding has substan-tially reduced to about 55.2 percent of GDP in 2016, Sudan is still in debt distress.
Sudan’s public debt has grown over the years, exacerbated by the international isola-tion triggered by the sanctions (figures 3.4, 3.5).
FIGURE�3.1�Total�government�revenues�and�oil�rents�in�Sudan,�1990–2016Percent of GDP
0
5
10
15
20
25
201520102005200019951992
Total naturalresource rents
Oil rents
General government revenue
Source: Based on World Development Indicators database and World Economic Out-
look, 2017.
FIGURE�3.2�Fiscal�balance�and�inflation�in�SudanPercent of GDP Percent
–5
–4
–3
–2
–1
0
1
2
3
4
20162014201220102008200620042002200019981995
Fiscal balance Inflation
0
50
100
150
Source: Based on Central Bank of Sudan data.

25
Gro
win
g m
acro
econ
omic
imba
lanc
es |
Aft
er T
wo
Dec
ades
of “
Solit
ude”
: Tar
gete
d St
rate
gies
for Q
uick
Eco
nom
ic W
ins
To finance the budget deficit, it increasingly built up domestic debt and nonconcessional debt (mainly from its Islamic partners). Foreign debt, estimated at $53.6 billion as of December 2016, weighs heavily on the economy.27 At end of 2016, 39 percent of Sudan’s external debt was owed to non-Paris Club creditors, 31 per-cent to the Paris Club, 13 percent to interna-tional financial institutions (the World Bank, African Development Bank, and Internation-al Monetary Fund), 12 percent to commercial banks, and 5 percent to foreign suppliers.
A 2016 debt sustainability analysis conduct-ed jointly by the World Bank and the Interna-tional Monetary Fund estimated the present value of Sudan’s debt-to-GDP ratio at 93 per-cent, far above the threshold of 30 percent. The present value of debts to exports, estimat-ed above 1,400 percent, is alarmingly above the indicative threshold of 100 percent — an un-precedented debt distress level never record-ed in any pre–Highly Indebted Poor Country initiative African country. At these levels, Su-dan’s external debt stock is unsustainable and therefore constrains the country’s economic recovery prospects.
Sudan’s main public debt challenge is the outstanding arrears (figure 3.6). In 2015, total interest arrears amounted to about $5 billion. The buildup of arrears includes new draws of $520 million from Arab multilateral and bi-lateral creditors, as well as from China and India, which have regularly supported Sudan’s development needs during sanctions. The newly contracted debt mainly financed proj-ects in the service, energy, and agricultural sectors. External debt increased from $385 mil-lion in 1970 to about $18 billion in 1995 and to $53.6 billion as at December 2016. About 88 percent of Sudan’s debt is accumulated ar-rears on loan repayments, including 59 percent penalties on delayed payments.
The official exchange rate of the Sudanese pound to the U.S. dollar has been relatively
stable over the past five decades; the pound was even stronger than the U.S. dollar for part of the post-independence period. But the strength of the Sudanese currency was largely artificial, propped up by high oil revenues and the government’s failure to make adjustments to reduce overvaluation. The 1996 sanctions curtailed external financial flows, exports, re-mittances, and foreign reserves, resulting in
FIGURE�3.3�Public�sector�wages�and�government�expenditure�in�SudanLog of government expenditure
2.75 3.00 3.25 3.50 3.75 4.00 4.25 4.503.0
3.5
4.0
4.5
5.0
y = 0.9959x + 0.5481R² = 0.9758
Log of wages
Source: Based on Central Bank of Sudan data.
FIGURE�3.4�Sudan’s�debt�profilePercent
0
50
100
150
200
250
20152010200520001995199019851980
Debt service (percent of exports)Debt/GDP ratio
Source: AfDB Statistics Department.

26
Gro
win
g m
acro
econ
omic
imba
lanc
es |
Aft
er T
wo
Dec
ades
of “
Solit
ude”
: Tar
gete
d St
rate
gies
for Q
uick
Eco
nom
ic W
ins
sharp depreciation of the Sudanese pound. Combined with increasing demand for imports, the depreciation put pressure on Sudan’s cur-rent account.
Continued pressure on the balance of pay-ments, stoked by reduced oil export revenues, led the authorities to maintain exchange re-strictions and multiple currencies and impose a cash margin requirement for most imports.28
The persistent overvalued nominal exchange rate led to a misalignment in the real exchange rate for most of the sanctions period (figure 3.7). During 1990–2016, real overvaluation has been associated with lower export perfor-mance, and real undervaluation has boosted exports (the correlation is 0.26). However, since overvaluation was fueled by high oil export revenues after the beginning of oil extraction in 1999),29 real overvaluation of the Sudanese pound was associated with marginal improve-ments in the terms of trade, which boosted total exports performance (figures 3.8, 3.9). But the misalignment was also damaging to the non-oil tradables sector.30 To reverse the trend, the authorities devalued the currency in 2007, but this devaluation had an unintended effect on external debt.31 It is expected that the re-cent tightening of monetary policy, reduction in gold purchases, and the export expansion will improve the exchange rate from 2017 and reduce the current account deficit.
Official external flows, foreign direct investment, and remittancesSudan is a large country and has immense de-velopment needs. For instance, in agriculture, investment requirements are estimated about $3.3 billion a year for 2014–20 and $6.1 billion a year for 2021–30 (at 2012 constant prices and ex-change rate). For the private sector, investment requirements will amount to about $275 billion a year of private fixed investment (net of for-eign direct investment inflows) during 2014–20. Infrastructure investment requirements during 2014–30 will be about $51 billion. Industrial sector investment requirements will increase from a projected $2.4 billion in 2014 to $14 bil-lion a year by 2030 (at 2012 constant prices) — equivalent to almost 9 percent of GDP.32
Such needs explain the country’s increased reliance on nontraditional donors during the sanctions era. China’s aid has been increasingly
FIGURE�3.5�Total�and�external�debt,�1990–2016Percent of GDP
201620102005200019951992
External debt
Government gross debt
0
100
200
300
400
500
Source: AfDB Statistics Department.
FIGURE�3.6�Interest�arrears,�1990–2016$ billion
0
2
4
6
8
201520102005200019951990
Interest arrears, private creditors
Interest arrears, official creditors
Interest arrears, long-term DOD
Source: AfDB Statistics Department.

27
Gro
win
g m
acro
econ
omic
imba
lanc
es |
Aft
er T
wo
Dec
ades
of “
Solit
ude”
: Tar
gete
d St
rate
gies
for Q
uick
Eco
nom
ic W
ins
important in financing critical development and social projects. Statistics on Chinese loans and aid to Africa — in particular to Sudan — are scanty, but early estimates put the share of loans as 99 percent of total Chinese financial support to Sudan (table 3.1). Only 1 percent was in form of grants.33 China also accounts for the bulk of foreign direct investment (FDI) in Sudan. Although China and other non-Western donors actively supported Sudan over the years of the sanctions, the United States has also been one of Sudan’s main contributors of development assistance.
U.S. support picked up in 2010 as prepara-tions for the secession of South Sudan gained momentum. Most U.S. assistance supported the victims of the war. It increased until 2014, when the European Union imposed its own sanctions (figure 3.10). Since the sanctions re-stricted financial transactions with Sudanese citizens, remittances from Sudanese in the diaspora to their families in Sudan have been channeled largely through informal, costly, and risky ways. Until the global financial crisis, diaspora remittances were rising, although of smaller size, both as share of GDP and in abso-lute terms (table 3.2, figure 3.11). Following the crisis, there was a short-lived recovery. Since the secession of South Sudan, remittances have fallen sharply.
Since early 2017, the inflow of FDI was $476.5 million in the first two quarters (com-pared with $557.9 million in 2016 despite the lifting of U.S. trade sanctions. Most of the FDI, coming from the Arab countries, targeted min-ing, agriculture, and infrastructure. With full re-vocation of sanctions, FDI is likely to increase. The current account deficit may widen as a re-sult due to high FDI-related imports but is ex-pected to narrow in the medium term pending ongoing reforms to stimulate exports and im-prove competitiveness.
During the second quarter of 2017, 58.9 per-cent of Sudan’s exports targeted the Arab
counties (compared with 53.4 percent in 2016), with 40 percent destined for the United Arab Emirates (UAE) due to rising gold exports. The Common Market for Eastern and Southern Africa’s (COMESA) share in Sudan exports de-clined by 6 percentage points to 12.9 percent. The sources of imports remain diverse. FDI in-flows slowed in 2017 by –0.8 percentage points
FIGURE�3.7�Real�exchange�rate�misalignment,�1990–2016
–100
0
100
200
300
201620102005200019951990
Real exchange rate misalignment(percent of long-term real exchange rate trend)
Real exchange rate index, long-term trend
Real exchange rate index
Source: Based on AfDB data.
Note: Negative (positive) numbers indicate real overvaluation (undervaluation).
FIGURE�3.8�Real�exchange�rate�misalignment�and�terms�of�trade,�1993–2016
–100
–50
0
50
100
201620102005200019951993
Real exchange rate misalignment(percent of long-term real exchange rate trend)
Terms of trade change(percent)
Source: Based on AfDB data and International Monetary fund direction of trade statis-
tics data.
Note: Negative (positive) numbers indicate real overvaluation (undervaluation).

28
Gro
win
g m
acro
econ
omic
imba
lanc
es |
Aft
er T
wo
Dec
ades
of “
Solit
ude”
: Tar
gete
d St
rate
gies
for Q
uick
Eco
nom
ic W
ins
to reach 1.2 percent of GDP, but they are pro-jected to increase to a 1.5 percent average for 2018–19, reflecting the sanctions revocation.
The exchange rate reform introduced in early 2018 is projected to raise exports by 20 percent, FDI by 13 percent, and remittances
by 15 percent, enhancing the contribution of the external sector to growth. The decline of remittances is also explained by the rise in out-ward-bound remittances since 2011 due to the recent high inflows of economic migrants from Egypt34 and by the large amount of money sent
FIGURE�3.9�Real�exchange�rate�misalignment�and�exports�performance,�1990–2016Percent of long-term trend Log of exports
–100
–50
0
50
100
201620102005200019951990
Log of totalexports
Log of other exports,excluding fuel
Real exchange ratemisalignment
0.0
2.5
5.0
7.5
10.0
Source: Based on AfDB data.
FIGURE�3.10�U.S.�aid�to�Sudan,�1990–2016$ billion
0.0
0.1
0.2
0.3
201620102005200019951990
Source: Based on World Development Indicators database,
2017.
TABLE�3.1�China’s�share�in�total�grants�and�loans�and�in�debt�of�Sudan,�1999–2007Percent
1999 2002 2003 2004 2005 2006 2007
China’s share in total loans and grants offered to Sudan
share of grants in total Chinese financial assistance to Sudan
2 1 13 3 0.3 19 1
share of loans in total Chinese financial assistance to Sudan
98 99 87 97 99.7 81 99
share of Chinese grants 9 0 0 20 0.1 11 0
share of Chinese loans 91 100 100 80 99.1 89 100
share of China in total loans and grants 17 7 8 7 76 24 73
share of China in total grants 100 0 0 54 36 14 0
share of China in total loans 16 7 9 6 76 26 74
China’s share in total debt of Sudan
share of China in total debt 0.09 0.11 10.23 9.20 0.17 13.88 13.45
Source: Yagoob, Hadia, and Zuo 2016.

29
Gro
win
g m
acro
econ
omic
imba
lanc
es |
Aft
er T
wo
Dec
ades
of “
Solit
ude”
: Tar
gete
d St
rate
gies
for Q
uick
Eco
nom
ic W
ins
out by the people of South Sudan and expatri-ate workers in the oil companies after the se-cession of South Sudan. The sanctions pushed Sudanese investment toward the neighboring region. For instance, Sudanese investment in Ethiopia peaked at $2.4 billion in 2014, making Sudan the second largest source of FDI in Ethi-opia after China. Sudanese investments in Ethi-opia mainly targeted tourism, mining, industry, agriculture, medical drugs, and information and communications technology.
Low aid flows, coupled with limited sourc-es of FDI, would have been expected to entail increased financing from the domestic finan-cial sector. However, exclusion from the in-ternational financial system meant that banks in Sudan could not access long-term financing from international counterparts. The banking sector in Sudan operates under Islamic princi-ples, so the financing of the private sector must conform to them.35 Prior to 1992, banks’ lending to the private sector was low (figure 3.12). This was mainly due to high liquidity from oil export earnings. The pickup of lending coincided with the onset of sanctions, suggesting that the fi-nancing gap left by established international
financial institutions may have been filled by Islamic ones.
Macroeconomic effects of sanctionsA simple econometric analysis of pre- and post- sanctions macroeconomic indicators should
TABLE�3.2�Financial�inflows�to�Sudan$ billions
Indicator1980–
901991–2000
2001–�11
2012–�16
Net bilateral aid flows from Development Assistance Committee donors 0.474 0.204 1.349 0.812
Net bilateral aid flows from United States 0.136 0.027 0.550 0.385
Net official development assistance received 0.635 0.295 1.156 1.133
Grants, excluding technical cooperation 0.480 0.248 1.352 1.010
Personal remittances received 0.231 0.333 1.101 0.405
Foreign direct investment inflows from all donors 0.003 0.134 1.480 1.608
Source: Based on World Development Indicators database, 2017.
FIGURE�3.11�Remittances�to�Sudan,�1990–2016$ billion Percent of GDP
0.0
0.4
0.8
1.2
1.6
201620102005200019951990
Remittances received as a share of GDPRemittances received
0
2
4
6
8
Source: Based on World Development Indicators database, 2017.
FIGURE�3.12�Domestic�credit�to�the�private�sector,�1980–2016Percent of GDP
–10
0
10
20
30
40
20162010200520001995199019851980
Domestic credit provided by financial sector
Domestic credit to private sector by banks
Source: Based on World Development Indicators database, 2017.

30
Gro
win
g m
acro
econ
omic
imba
lanc
es |
Aft
er T
wo
Dec
ades
of “
Solit
ude”
: Tar
gete
d St
rate
gies
for Q
uick
Eco
nom
ic W
ins
provide further insight into the effect of sanc-tions and other shocks. But such an approach has notable limitations. First, Sudan experi-enced multiple positive and negative shocks
at the time of sanctions that sometimes rein-forced their effect (in the case of secession of South Sudan) and sometimes cancelled them (the oil boom, the growth of investment and trade with other partners). Second, in a more robust analysis with synthetic control methods using countries that are similar in history, eco-nomic structure, and other considerations as control groups, the results were not statistical-ly robust and did not make much sense. Econ-omywide models, such as computable gen-eral equilibrium methods, could have helped but impose highly restrictive assumptions on household behavior and market clearing condi-tions, making impact analysis complex to cap-ture. But they provide a better insight among alternative approaches.
The analysis presented in this section focus-es largely on output growth, external sector in-dicators, and fiscal revenues, with and without additional shocks, captured through appropri-ate identification of dummy variables depicting the onset of the shocks. Besides the first wave of sanctions, Sudan experienced a strengthen-ing of sanctions in 2006 and 2012. Probably the single largest shock was the secession of South Sudan in 2011, which started with the transi-tion following the referendum of 2005. Table 3.3 presents results focusing on the first set of sanctions imposed in 1997. Table 3.4 includes a set of shocks captured through the dummy variables — 2006 denoting the second raft of sanctions and 2011 capturing the impact of the secession of South Sudan.
During the sanctions era, Sudan reduced its external indebtedness. A reduction of nearly 150 percent was realized during this period, fol-lowing an increase of 222 percent before it (see table 3.3, column 2), with the gains most felt through an improvement in the current account position. The effect on revenues was insignifi-cant. This is not particularly surprising, since Su-dan’s revenues were largely dominated by oil rev-enues, which were not affected by the sanctions.
TABLE�3.3�Macroeconomic�impact�of�1997�sanctions�(before�and�after�analysis)
Variables
(1) (2) (3) (4)
Real�GDP��growth
External�debt�(percent�of�GDP)
Current�account�balance��
(percent�of�GDP)
General�government�
revenues��(percent�of�GDP)
d1997 2.045(1.413)
–148.5***(44.31)
20.86***(6.528)
0.356(2.502)
Constant 2.554**(1.187)
222.3***(43.03)
–27.20***(6.483)
14.19***(2.106)
Observations 35 35 36 27
R-squared 0.064 0.283 0.271 0.001
*** p < 0.01, ** p < 0.05, * p < 0.1.
Note: Parentheses denote robust standard errors. d1997 is a dummy variable capturing
the marginal effect of the first wave of sanctions. The constant captures the conditional
mean of the dependent variable before the sanctions.
TABLE�3.4�Macroeconomic�impact�of�1997�and�2006�sanctions�and�2011�secession�of�South�Sudan�(impact�analysis�with�additional�major�shocks)
Variables
(1) (2) (3) (4)
Real�GDP��growth
External�debt�(percent�of�GDP)
Current�account�balance��
(percent�of�GDP)
General�government�
revenues��(percent�of�GDP)
d1997 3.561**(1.535)
–106.3**(45.47)
20.57***(6.796)
–1.482(3.055)
d2006 –0.765(1.523)
–74.86***(10.22)
1.007(2.006)
8.205***(2.475)
d2011 –3.652**(1.773)
–10.70***(3.407)
–0.893(2.032)
–8.918***(1.868)
Constant 2.554**(1.224)
222.3***(44.40)
–27.20***(6.683)
14.19***(2.196)
Observations 35 35 36 27
R-squared 0.198 0.329 0.272 0.311
*** p < 0.01, ** p < 0.05, * p < 0.1.
Note: Parentheses denote robust standard errors. The variable d1997 is a dummy variable
capturing the specific effects of the first of sanctions, d2006 covers the second wave,
and d2011 covers the secession of South Sudan. The constant captures the conditional
mean of the dependent variable before the sanctions and other shocks.

31
Gro
win
g m
acro
econ
omic
imba
lanc
es |
Aft
er T
wo
Dec
ades
of “
Solit
ude”
: Tar
gete
d St
rate
gies
for Q
uick
Eco
nom
ic W
ins
The secession of South Sudan, rather than the sanctions, explains a large and significant decrease in GDP growth (see table 3.4). South Sudan took away three-fourths of the oil rev-enues, thereby depriving its northern neighbor. Sudan’s revenues fell by about 9 percentage points in relative terms. The combination of the two sanctions impositions and the South Sudan secession magnifies the effect on rev-enues. The output effect of South Sudan’s secession is especially robust, accounting for about a 3.7 percentage point fall in real GDP. Surprisingly, the secession of South Sudan ap-pears to have had no significant effect on the current account position, as external debt fell sharply. In general, results from this naïve econometric exercise corroborate the obser-vations that growth improved under sanctions, and so did the debt profile. Revenues were al-ready on the upward trend, and the sanctions had an inelastic effect on oil revenues. Instead, the secession had the largest effect, which was significant, on fiscal revenues.
Evidence of the price effect of sanctionsThe U.S. prosecution of some banks in July 2012 for breaking the sanctions against Sudan and other countries tightened the foreign exchange market and significantly widened the gap be-tween the banks and free market exchange rates.36 Fear of huge fines and rigorous Office of Foreign Assets Control (OFAC) monitoring of transactions targeting sanctioned coun-ties caused the foreign correspondent banks (FCBs) to refuse processing transfers to and from Sudan. The IMF estimates that the paral-lel exchange market covered about 50 percent of imports in 2016, up from 30 percent in 2013 due to the withdrawal of FCB relations with Su-dan.37 With an estimated 30 percent weight of imports in the consumption basket underlying the consumer price index (CPI) and 50 percent
share of imported inputs, which averaged 45 percent of total imports in 2012–17, the pass-through from the import price to the CPI is ex-pected to be substantial.38
Developments in inflation and nominal ex-change rate dynamics are examined here by estimating the purchasing power parity model of inflation39 in the context of the cointegrat-ed vector autoregression and error correction model to identify major shifts in inflation per-sistence in the recent history of Sudan (annex tables A3.1 and A3.2). Over the last five de-cades (1970Q1–2017Q4), world inflation and the growth of nominal exchange rate depreciation significantly drove inflation acceleration, and the deviation of short-run inflation from equi-librium has slowly corrected (about 5 percent per quarter). More important, both the inter-cept and slope of inflation changed signifi-cantly in 1990Q1–1996Q4 and 2012Q3–2017Q4. The slope coefficients on inflation during these subperiods are near unity (estimated at 0.92 and 0.87), confirming the high inflation persistence.
Sudan faced similar macroeconomic chal-lenges during these two subperiods, in ad-dition to the fiscal effects of the civil war in both. In the former period, the main challenges were the IMF withdrawal of balance-of-pay-ments support in 1990, the reduced exports due to the meat export ban imposed by major importers in 1992, the cuts in concession-al borrowing, and the listing on the U.S. state sponsors of terrorism since 1993. In the latter period, the access to multilateral aid was lim-ited, and exports declined due to the loss of substantial proven oil reserves after secession and the strengthening of sanctions.
The withdrawal of FCBs represent new de-velopments and presented grave challenges after 2012 and until the revocation of sanc-tions in 2017. Thus, the time-varying param-eters version of the inflation error correc-tion model has been re-estimated by rolling

32
Gro
win
g m
acro
econ
omic
imba
lanc
es |
Aft
er T
wo
Dec
ades
of “
Solit
ude”
: Tar
gete
d St
rate
gies
for Q
uick
Eco
nom
ic W
ins
regression to discern changes in inflation persistence over the whole sample, including these subperiods. Figure A3.1 shows the roll-ing regression result, with 25 quarters as the window. Negligible before the mid-1980s, the coefficient of inflation persistence increased from a low value of –0.42 in 1990Q1 to reach 0.03 in 1996Q4 and then 0.55 in 1999Q3. With the rise in oil revenues in the economy in 1999, inflation persistence significantly dropped from this peak to –0.5 in 2012Q1. After the strengthening of sanctions in July 2012,
inflation persistence soared to 0.30 in the third quarter of that year and remained positive, av-eraging 0.22 in 2012Q4–2017Q4 — the longest episode of inflation persistence over the en-tire review period. These results confirm that Sudan was hurt by the sanctions through their risk spillover effects on FCB relations (as third party). That requires scaling up efforts to re-duce the FCB skepticism in the post-sanction era by strengthening the legal and institution-al framework to enhance the environment for doing business in and with Sudan.

33
Cha
rtin
g a
new
pat
h |
Aft
er T
wo
Dec
ades
of “
Solit
ude”
: Tar
gete
d St
rate
gies
for Q
uick
Eco
nom
ic W
ins
CHAPTER 4
Charting�a�new�path
For examining structural transformation in Sudan during the sanctions period and its evolution afterward, the country’s econ-
omy can be characterized as comprising three sectors — agriculture, services, and industry, with industry’s manufacturing component treated separately (figure 4.1). The data do not permit detailed sectoral disaggregations. Thus, the simplistic features of the Sudan economy presented here should be seen as more illustra-tive than comprehensive. Nonetheless, useful insights can be drawn.
Although a shift toward productive serv-ices and manufacturing would indicate struc-tural transformation for Sudan, it does not appear in the data. Rather, heavy dependence on oil has had a deleterious effect on the structure of the economy, resulting in the vir-tual neglect of other sectors. Agriculture has continued to decline since the 1990s, so that the services sector is the largest contributor to GDP, accounting for 47 percent. The once dominant agricultural sector, which contrib-uted over 60 percent of GDP in the pre-oil days of the 1960s–1980s, now contributes only 32 percent, while industry contributes 21 per-cent. The Dutch disease is especially evident in the composition of output. Growth has largely been driven by non-tradable services. Although this sector shrank by –0.6 percent a year on average between 1996 and 2000 during the first round of sanctions, it picked up in the early 2000s and has remained buoy-ant since, emerging as the strongest driver of growth. Between 2001 and 2005, growth in value added for the services sector aver-aged 10 percent a year and contributed about 40 percent to Sudan’s GDP.
The decline in agriculture’s contribution to GDP reflected slower growth in value added, which averaged only 1.8 percent during 1992–2016. Overall, the industrial sector’s contribu-tion to GDP grew during the sanctions era, but this was mainly due to strong activity in the oil sector. Manufacturing’s share of GDP remained small, around 9 percent, for most of the peri-od. In general, Africa experienced flat manu-facturing growth in what some have called an era of de-industrialization. Yet, Sudan has huge potential in light manufacturing, particularly in food processing, and textiles and leather. Sudan has the second largest population of camels in Africa after Egypt and has been self-sufficient in sugar production.
Sudan’s poor employment data hamper meaningful analysis of sectoral labor migration and how it may have contributed to structural change. According to the Sudanese Ministry of
FIGURE�4.1�Sectoral�contribution�to�GDP�in�SudanValue added (percent of GDP)
0
20
40
60
80
20162010200520001995199019851980
Industry
Manufacturing
Agriculture
Services
Source: Based on World Development Indicators database, 2016.
Note: Data on the manufacturing sector are limited to 2011.
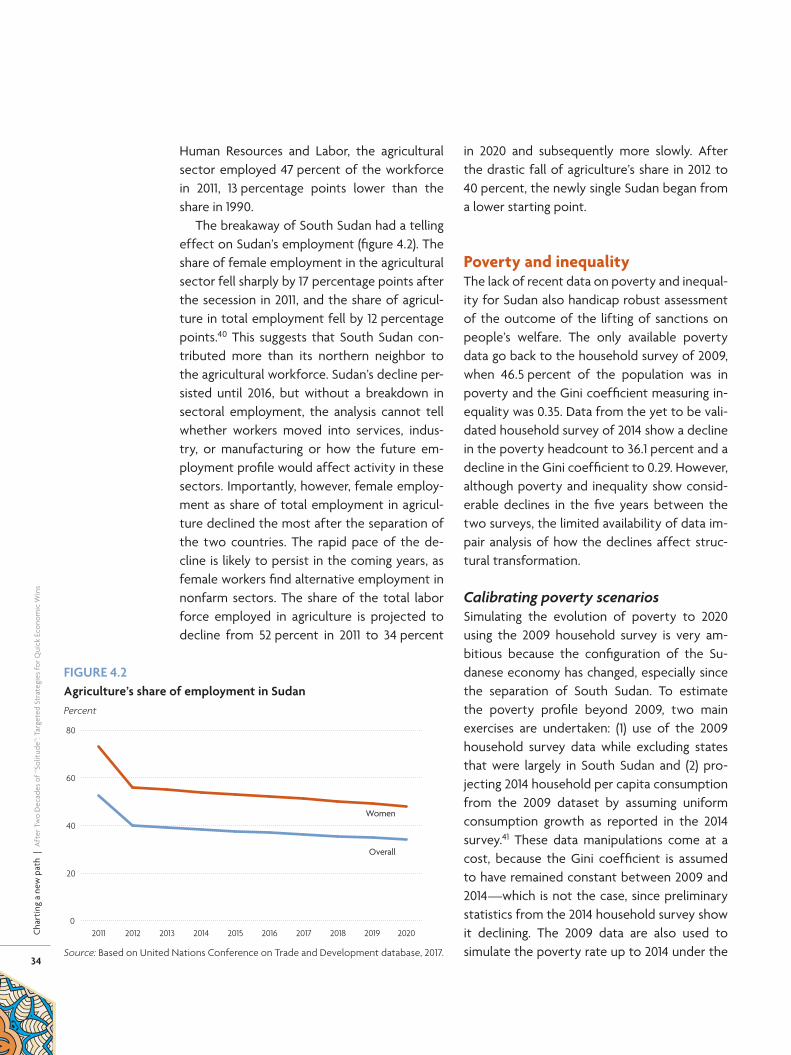
34
Cha
rtin
g a
new
pat
h |
Aft
er T
wo
Dec
ades
of “
Solit
ude”
: Tar
gete
d St
rate
gies
for Q
uick
Eco
nom
ic W
ins
Human Resources and Labor, the agricultural sector employed 47 percent of the workforce in 2011, 13 percentage points lower than the share in 1990.
The breakaway of South Sudan had a telling effect on Sudan’s employment (figure 4.2). The share of female employment in the agricultural sector fell sharply by 17 percentage points after the secession in 2011, and the share of agricul-ture in total employment fell by 12 percentage points.40 This suggests that South Sudan con-tributed more than its northern neighbor to the agricultural workforce. Sudan’s decline per-sisted until 2016, but without a breakdown in sectoral employment, the analysis cannot tell whether workers moved into services, indus-try, or manufacturing or how the future em-ployment profile would affect activity in these sectors. Importantly, however, female employ-ment as share of total employment in agricul-ture declined the most after the separation of the two countries. The rapid pace of the de-cline is likely to persist in the coming years, as female workers find alternative employment in nonfarm sectors. The share of the total labor force employed in agriculture is projected to decline from 52 percent in 2011 to 34 percent
in 2020 and subsequently more slowly. After the drastic fall of agriculture’s share in 2012 to 40 percent, the newly single Sudan began from a lower starting point.
Poverty and inequalityThe lack of recent data on poverty and inequal-ity for Sudan also handicap robust assessment of the outcome of the lifting of sanctions on people’s welfare. The only available poverty data go back to the household survey of 2009, when 46.5 percent of the population was in poverty and the Gini coefficient measuring in-equality was 0.35. Data from the yet to be vali-dated household survey of 2014 show a decline in the poverty headcount to 36.1 percent and a decline in the Gini coefficient to 0.29. However, although poverty and inequality show consid-erable declines in the five years between the two surveys, the limited availability of data im-pair analysis of how the declines affect struc-tural transformation.
Calibrating poverty scenariosSimulating the evolution of poverty to 2020 using the 2009 household survey is very am-bitious because the configuration of the Su-danese economy has changed, especially since the separation of South Sudan. To estimate the poverty profile beyond 2009, two main exercises are undertaken: (1) use of the 2009 household survey data while excluding states that were largely in South Sudan and (2) pro-jecting 2014 household per capita consumption from the 2009 dataset by assuming uniform consumption growth as reported in the 2014 survey.41 These data manipulations come at a cost, because the Gini coefficient is assumed to have remained constant between 2009 and 2014 — which is not the case, since preliminary statistics from the 2014 household survey show it declining. The 2009 data are also used to simulate the poverty rate up to 2014 under the
FIGURE�4.2�Agriculture’s�share�of�employment�in�SudanPercent
0
20
40
60
80
2020201920182017201620152014201320122011
Overall
Women
Source: Based on United Nations Conference on Trade and Development database, 2017.
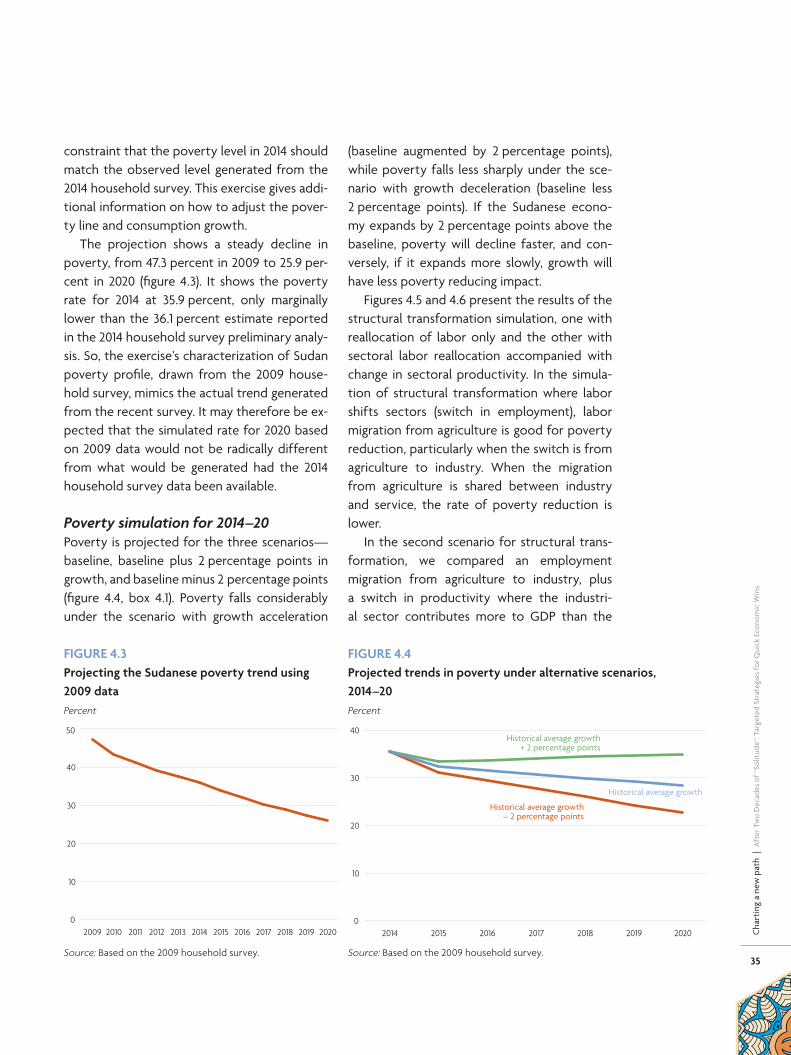
35
Cha
rtin
g a
new
pat
h |
Aft
er T
wo
Dec
ades
of “
Solit
ude”
: Tar
gete
d St
rate
gies
for Q
uick
Eco
nom
ic W
ins
constraint that the poverty level in 2014 should match the observed level generated from the 2014 household survey. This exercise gives addi-tional information on how to adjust the pover-ty line and consumption growth.
The projection shows a steady decline in poverty, from 47.3 percent in 2009 to 25.9 per-cent in 2020 (figure 4.3). It shows the poverty rate for 2014 at 35.9 percent, only marginally lower than the 36.1 percent estimate reported in the 2014 household survey preliminary analy-sis. So, the exercise’s characterization of Sudan poverty profile, drawn from the 2009 house-hold survey, mimics the actual trend generated from the recent survey. It may therefore be ex-pected that the simulated rate for 2020 based on 2009 data would not be radically different from what would be generated had the 2014 household survey data been available.
Poverty simulation for 2014–20Poverty is projected for the three scenarios — baseline, baseline plus 2 percentage points in growth, and baseline minus 2 percentage points (figure 4.4, box 4.1). Poverty falls considerably under the scenario with growth acceleration
(baseline augmented by 2 percentage points), while poverty falls less sharply under the sce-nario with growth deceleration (baseline less 2 percentage points). If the Sudanese econo-my expands by 2 percentage points above the baseline, poverty will decline faster, and con-versely, if it expands more slowly, growth will have less poverty reducing impact.
Figures 4.5 and 4.6 present the results of the structural transformation simulation, one with reallocation of labor only and the other with sectoral labor reallocation accompanied with change in sectoral productivity. In the simula-tion of structural transformation where labor shifts sectors (switch in employment), labor migration from agriculture is good for poverty reduction, particularly when the switch is from agriculture to industry. When the migration from agriculture is shared between industry and service, the rate of poverty reduction is lower.
In the second scenario for structural trans-formation, we compared an employment migration from agriculture to industry, plus a switch in productivity where the industri-al sector contributes more to GDP than the
FIGURE�4.3�Projecting�the�Sudanese�poverty�trend�using�2009�dataPercent
0
10
20
30
40
50
202020192018201720162015201420132012201120102009
Source: Based on the 2009 household survey.
FIGURE�4.4�Projected�trends�in�poverty�under�alternative�scenarios,��2014–20Percent
0
10
20
30
40
2020201920182017201620152014
Historical average growth
Historical average growth+ 2 percentage points
Historical average growth– 2 percentage points
Source: Based on the 2009 household survey.

36
Cha
rtin
g a
new
pat
h |
Aft
er T
wo
Dec
ades
of “
Solit
ude”
: Tar
gete
d St
rate
gies
for Q
uick
Eco
nom
ic W
ins
agricultural and services sectors. We observe that poverty reduction is faster with the switch in both employment and productivity. An im-portant message from this exercise is that, in Sudan, as in most countries in Africa, a substan-tial source of poverty can be traced to the ag-ricultural and services sectors, which are largely informal. Thus, structural transformation that leads to movement of labor from the agricul-tural sector to industry has a large poverty re-duction impact. The impact is even higher, if the shift is accompanied by improvements in sectoral productivity.
Opportunities for reengaging with the international communityThe transition to the post-sanctions era offers Sudan enormous opportunities to reengage with the international community and kick-start a flow of financial resources to stabilize the country’s external balance.42 It also pro-vides an opening for discussions on how to liquidate the country’s large stock of debt and dismantle the accumulated arrears. In the short to medium term, the lifting of sanctions will be reflected in increased aid, debt relief, improved terms of trade, and other features.
BOX�4.1�Setting�poverty�simulation�parameters
The baseline model: Uses the historical average growth rate between 2009 and 2016 as the rate from 2016 to 2020.
Two growth scenarios: The first growth scenario adds 2 percentage points to the historical average growth. The second subtracts 2 percentage points. The sim-ulation uses 2 percentage points because of Sudan’s highly volatile growth trajectory.
Two structural transformation scenarios: Employ-ment migration (from agriculture to services and in-dustry) and the same combined with a change in the sectors’ productivity.
Employment to GDP growth elasticity: Without data on employment to use for calculating employ-ment growth by sector for each of the scenarios, the simulation could use the employment elasticity to GDP growth or to sector value-added growth. The elasticity figures are from ILO (2005), which com-puted the employment elasticity to GDP growth and each sector’s value-added growth by region (Sub- Saharan Africa and North Africa). The structure
of Sudan’s economy resembles those of countries south of the Sahara, rather than those of its north-ern Arab neighbors, which are more sophisticated and relatively diversified. Hence, to simulate elas-ticity, parameters for the group of countries south of the Sahara are used. The employment-to-sector value-added growth elasticity is used because it is more precise than the employment to GDP growth elasticity.
Methodology for poverty projection: The projection is based on household unit record data extracted from the household survey, including household per capita consumption, size of household, sector of ac-tivity of household head, place of residence (urban or rural), and a sampling weight attributed to the household in order to have a national representative estimate. Poverty is estimated for each projected year using the Foster-Greer-Thorbecke (FGT) measures ap-plied on projected household per capita consumption adjusted for inflation. The household consumption projection is based on the household head sector — valued growth (by sector of activity) adjusted for intra sector inequality.

37
Cha
rtin
g a
new
pat
h |
Aft
er T
wo
Dec
ades
of “
Solit
ude”
: Tar
gete
d St
rate
gies
for Q
uick
Eco
nom
ic W
ins
Improvement in terms of tradeImprovement in the terms of trade can be ex-pected to raise GDP growth by 0.2 percentage points and raise domestic absorption by 0.4 per-centage points, according to simulation results conducted with the MAMS model43 up to 2030. Higher private consumption and investment are likely while the growth of government con-sumption and public investment continue at the same level. The growth in private consumption spending and private investment will create a virtuous cycle, resulting in lower unemployment and poverty rates than in the sanctions period. With higher growth generating higher tax reve-nues, the government will be able to reduce tax rates and tax intake (as a share of GDP).
Since government consumption and public investment are fixed in real terms, financing needs relative to GDP will decline. However, the appreciation of the exchange rate result-ing from better terms of trade could dampen the incentives for exports. The opening of the economy in the post-sanctions period could attract foreign capital, raising the productiv-ity and competitiveness of Sudan’s exports in the long term, in contrast to Sudan business-es’ dearth of foreign capital and technology during the sanctions period.44 The net effect of exchange rate appreciation and improved productivity could raise the competitiveness of Sudan’s non-oil exports, increase employ-ment, and hence reduce poverty.
Foreign aid and debt reliefSudan will need large investment and financial resources to diversify its economy. The lifting of sanctions could encourage inflows of offi-cial development assistance (ODA) to support the country’s development efforts, particu-larly investment in infrastructure, which bore the brunt of the sanctions. Foreign aid is ex-pected to increase, boosting real GDP growth and stabilizing the macroeconomy, according to the MAMS model. The lifting of sanctions
is also expected to initiate dialogue between Sudan and its creditors, leading to foreign debt relief. The expected foreign debt by 2030 is 37 percent of GDP, compared with an average of 114 percent during the sanctions period. A reduction in Sudan’s debt would immediately remove the country’s risk premium, creating confidence in the economy.
FIGURE�4.6�Projected�trends�in�poverty�where�structural�transformation�by�driven�by�switches�in�employment�and�productivityPercent
0
10
20
30
40
2020201920182017201620152014
Historical average growth + structural production switch(– 4 percentage points in agriculture, – 6 in services, + 10 in industry)
Historical average growth + structural production and employment switch(production: – 4 percentage points in agriculture, – 6 in services, + 10 in industry;
employment: – 10 percentage points in agriculture, + 10 in industry)
Historical average growth
Source: Based on the 2009 household survey.
FIGURE�4.5�Projected�trends�in�poverty�where�structural�transformation�is�driven�by�a�switch�in�employmentPercent
0
10
20
30
40
2020201920182017201620152014
Historical average growthHistorical average growth
+ structural employment switch(– 10 percentage points in
agriculture, + 10 in industry)
Historical average growth + structural employment switch(– 10 percentage points in agriculture,
+ 5 in industry, + 5 in services)
Source: Based on the 2009 household survey.

38
Cha
rtin
g a
new
pat
h |
Aft
er T
wo
Dec
ades
of “
Solit
ude”
: Tar
gete
d St
rate
gies
for Q
uick
Eco
nom
ic W
ins
Consequently, the increased aid, debt relief, and access to foreign borrowing could be used to raise spending, particularly for building in-frastructure and strengthening human capital and building skills. The normalization of rela-tions could also affect welfare, translating into a 16 percent increase in real household per cap-ita consumption in 2030, with the strongest im-pact emanating from improved terms of trade, followed by debt relief and increased aid. The increases in household consumption would bring about a 7 percentage point reduction in poverty in 2030 from the level in the base period.
The normalization of Sudan’s relations with the rest of the world would improve outreach to creditors to negotiate debt relief under the Heavily Indebted Poor Countries initiative. That would increase real growth, reduce poverty, and promote productivity and economic diver-sification, according to estimates by the World Bank (2015), the African Development Bank (AfDB) (2016), and the International Monetary Fund (IMF) (2017). Debt relief alone would be expected to improve GDP growth by 0.2 per-centage points and could also permit paying off accrued interest. A decline in the debt-to-GDP ratio and reduced net interest payments would be expected to improve the balance of payments position. The resulting lower interest payments would enable the government to re-duce taxes or, alternatively, to raise spending on critical social sectors — notably education and health — and address the legacies of the many years of civil conflict, particularly in pre-viously neglected regions. Access to interna-tional capital markets could, however, induce Sudan to contract more debt, creating a for-eign debt-to-GDP ratio of 46 percent in 2030. So, this debt management option is inferior to one restricted to debt relief, which would keep the debt-to-GDP ratio at 37 percent.
Intensified government efforts to inculcate fiscal discipline, increase debt management
capacity, and deepen institutional and gover-nance reforms are expected to improve the debt situation following the lifting of the eco-nomic sanctions. The AfDB-financed Debt Re-lief and Arrears Clearance Strategy will be used by the Tripartite Committee on Debt to reach out to creditors for debt relief.
In addition, exchange rate reforms and structural reforms to improve the business environment are critical for stimulating and sustaining growth. The delay of a complete exchange rate adjustment and the continued harm from rent seeking could worsen incen-tives and hence reduce growth regardless of the lifting of sanctions.
South–South development cooperation for structural transformationGlobal leaders and the international develop-ment community (multilateral and bilateral donors) are looking eastward for new ideas, new momentum, and new financing. Over the past 10 years, emerging economies, including nontraditional donor organizations such as Arab ones, have become major sources of in-frastructure investment, foreign direct invest-ment, and international development finance. The IMF finds that, “In recent years, China has become the largest single trading partner for Africa and a key investor and provider of aid.… [A] 1 percentage point increase in China’s real domestic fixed asset investment growth has tended to increase Sub- Saharan Africa’s ex-port growth rate on average by 0.6 percentage point.”45
China’s approach in South–South devel-opment cooperation differs from that of the established donors by combining aid, trade, and public and private investment to strive for mutual respect and mutual benefit in a win-win situation. Africa–China trade has been growing at approximately 20 percent a year since 2000. China’s FDI has grown 40 percent in the past ten years.46 Its ODA, as defined by

39
Cha
rtin
g a
new
pat
h |
Aft
er T
wo
Dec
ades
of “
Solit
ude”
: Tar
gete
d St
rate
gies
for Q
uick
Eco
nom
ic W
ins
the Organisation for Economic Co-operation and Development (OECD), is small compared with that of other OECD countries, but it is commensurable with the ODA of other coun-tries with per capita income similar to China’s $8,123.47 China has used its comparative ad-vantage in economy of scale for constructing infrastructure to help others investing in large development projects. It is the largest source of construction financing, supporting many of Africa’s most ambitious infrastructure projects in recent years, including roads, railways, and hydropower (McKinsey June 2017).
Notwithstanding data limitations, Dreher et al. (2017) find significant effects of Chinese ODA boosting economic growth in recipi-ent countries, using an instrumental variable approach.48 Based on a sample of recipient countries whose average growth rate is 2.8 per-centage points a year, an additional Chinese aid project increases economic growth by
0.7 percentage point two years after the aid project is committed. This result holds for ODA projects only, and there is no such effect for other official finance (OOF).49
In the autumn of 2013, Chinese President Xi Jinping proposed to build the Silk Road Eco-nomic Belt and the 21st Century Maritime Silk Road (One Belt and One Road, or the Belt and Road Initiative — BRI) (figure 4.7). During the inaugural BRI summit in May 2017, Xi commit-ted $124 billion to the initiative.50 On 24 Octo-ber 2017, the BRI was formally included in the charter of the Communist Party of China, sig-nifying the ruling party’s strong commitment to it.51 Through building both land bridges and ocean links, as well as Special Economic Zones (SEZs), this “transregional infrastructure for connectivity” not only links resource- and manufacturing-based economies with the two largest markets, Europe and Asia, but also helps to secure ocean shipping transport routes,
FIGURE�4.7�The�Belt�and�Road�Initiative�includes�a�“string�of�pearls”�in�East�Africa�—��Sudan�could�be�one�of�the�pearls
Source: Xinhua.

40
Cha
rtin
g a
new
pat
h |
Aft
er T
wo
Dec
ades
of “
Solit
ude”
: Tar
gete
d St
rate
gies
for Q
uick
Eco
nom
ic W
ins
benefiting people in Asia, Europe, and Africa. The three principles of the BRI are “wide con-sultation, joint construction, and shared bene-fits” to achieve multiple wins.
As China’s GNI and fiscal revenue contin-ue to grow, its development finance is rising dramatically, reaching an amount estimated at almost $100 billion in 2015–16. That amount includes grants, concessional loans, and ex-port buyer credits, as well as contributions to the Silk Road Fund, New Development Bank, Asian Infrastructure Investment Bank (AIIB), and other multilateral banks. China’s recent commitments at the Forum on China–Africa Cooperation (FOCAC),52 the Paris Climate Con-ference (COP21), and the May 2017 BRI summit show that:• China will gradually take on more respon-
sibilities and explore its new roles in global affairs. Its share of ODA in gross national income (GNI) is likely to grow from the cur-rent 0.1 percent to 0.3 percent.53 That large increase depends on the definition of ODA, OOF, and development financing.
• The pace of China’s increase depends on the global governance system. China has tried
to set up platforms for its contribution to global development by contributing to set-ting up the AIIB and other new institutions such as the FOCAC, Silk Road Fund, New Development Bank, and African Capacity Development Fund.
• The BRI is the right platform for China’s new role in the global economy. It reflects Chi-nese leaders’ vision of a world order guid-ed by shared prosperity, “peaceful coexis-tence with differences,” and commitments to sustainability, global public goods, and peace and security, drawing on China’s deep wealth of Confucianism.China’s outward FDI soared to more than
$183 billion in 2016, ahead of all other emerg-ing market economies and second only to the United States (figure 4.8). Much of China’s in-vestment is in the form of patient capital.
Sudan and China have a long history of friendly relations with mutual support, benefit, and cooperation. China has emerged as Sudan’s largest trading, investment, and South–South cooperation partner. Over 2003–14, China sup-ported at least 53 completed developmental projects or programs in Sudan for a total of $2.6 billion. They included infrastructure proj-ects, health and doctor teams, and education social programs.54 Some large projects are ODA (concessional), OOF (nonconcessional), and “vague official finance” loans. Of the 53 completed projects and programs, 21 percent were related to health, 15 percent to power generation and supply, 11 percent to emergen-cy response, 9.4 percent to transport and stor-age, 9.4 percent to debt reduction, 7.6 percent to agriculture, and 5.7 percent each to water, government, and education (figure 4.9). Many aid programs, such as technical assistance and medical teams, are not measurable in mone-tary terms.
Of the completed projects, 17 were for in-frastructure, with expenditure amounting to $2.36 billion (figure 4.10). These do not include
FIGURE�4.8�Outward�foreign�direct�investment�by�BRICS�countries,�2000–2016FDI outflows ($ billion)
201620142012201020082006200420022000
1. China
3. Republicof Korea
4. India5. South Africa 6. Brazil
2. RussianFederation
–50
0
50
100
150
200
Source: United Nations Conference on Trade and Development statistics on foreign di-
rect investment.

41
Cha
rtin
g a
new
pat
h |
Aft
er T
wo
Dec
ades
of “
Solit
ude”
: Tar
gete
d St
rate
gies
for Q
uick
Eco
nom
ic W
ins
recent commitments or a series of railway re-habilitation projects implemented by Chinese companies.55
If Sudan can build “Institutions that unite, construct infrastructure that connects, and provide interventions that target,” it could:• Grasp the opportunities provided by the
BRI.• Join existing global supply chains for food,
wool, cotton, leather, footwear, garments, and assembly lines of motorcycles, solar equipment, and farm machinery.
• Become one of the light manufacturing and construction–logistics centers of East Africa.
A macroeconomic strategy for the post-sanctions eraSudan has endured a prolonged economic blockade, which reduced its access to interna-tional capital and built up debt as it struggled to adjust. The easing of the sanctions provides a unique opportunity for the country’s author-ities to chart a new economic path for eco-nomic diversification and accelerated and in-clusive growth. This will require bold decisions on key macroeconomic and structural reforms to stimulate domestic activity and assure in-vestors of Sudan’s readiness for reengagement with the international community. The strat-egy to kick-start the economy should include a raft of measures covering fiscal, monetary, exchange rate, financial and external sector, business environment, and sectoral and other structural policies.
Fiscal consolidation and domestic resource mobilizationMeasures should increase fiscal revenue to cre-ate fiscal space for growth-enhancing social spending and public infrastructure, while re-ducing monetization of the deficit. Sudan’s tax revenues are among the lowest across low- and
FIGURE�4.10�Composition�of�China-sponsored�infrastructure�projects�by�percentage�of�projects…
Energy generationand supply85%
Transport and storage 3%Water supply and sanitation 3%
Communications 8%
�…�and�by�percentage�of�dollars�spent
Energy generationand supply47%
Water supplyand sanitation
18%
Transport andstorage 24%
Communications 6%
Other social infrastructure and services 6%
Source: Based on a subset of 17 completed infrastructure projects in Sudan provided by
aiddata.com.
FIGURE�4.9�Composition�of�China-sponsored�projects�and�programs�in�SudanPercent
Health21%
Transportand storage
9%
Action relatingto debt 9%
Agriculture,forestry and
fishing 8%
Education6%
Water supply andsanitation 6%
Government andcivil society 6%
Unallocated/unspecified 4%
Emergency response11%
Energygenerationand supply15%
Communications 2%Other multisector 2%Non-food commodity assistance 2%
Source: Based on a subset of completed projects and programs in Sudan provided by
aiddata.com.

42
Cha
rtin
g a
new
pat
h |
Aft
er T
wo
Dec
ades
of “
Solit
ude”
: Tar
gete
d St
rate
gies
for Q
uick
Eco
nom
ic W
ins
lower-middle income countries (LLMICs). 56 Tax revenues represented only 6.3 percent of GDP, compared with an average 12 percent of GDP in fragile LLMICs in 1995–2015, and the gap has been increasing. Despite efforts to strengthen tax administration, tax revenues increased only marginally as a percentage of GDP in 2015 due to low imports and an overvalued official ex-change rate. This limited fiscal space and con-strained pro-growth investment and pover-ty-reducing social spending.
Sudan has scope to raise tax revenues. Of 36 African LLMICs, Sudan ranked 34th in tax ef-fort, with a gap between taxes owed and taxes paid of 6.1 percent of GDP. According to the IMF, Sudan should be able to increase its tax-to-GDP ratio by 6 percent, especially by raising tax collections on income by 2.3 percent of GDP and on goods and services by 2.8 percent of GDP. Tax reforms should include reform-ing gold taxation, rationalizing exemptions, continuing to strengthen customs and tax ad-ministration, increasing personal and business income tax rates and their progressivity, and ceasing to grant new tax holidays (which can-not be justified on economic returns grounds) and phasing out existing ones. In a nutshell, Sudan should explore increasing tax revenues to match the levels of its peers by moving more to direct taxes, broadening the tax base, removing overgenerous tax exemptions, and rationalizing subsidies to benefit the most vul-nerable sections of the population.
Greater exchange rate flexibilitySudan has long had a fixed exchange rate sys-tem, with periodic devaluations that have proved inadequate to guarantee real exchange rate competitiveness. Adopting a more flexible system will facilitate both internal and external adjustment to shocks, improve the compet-itiveness of the tradable sector, and bolster exports and discourage imports, especially of nonessential goods. These advantages could
reduce the external trade deficit and control inflation.
Reducing the gap between the official and parallel market rates will require apply-ing further exchange rate flexibility, removing remaining restrictions on foreign exchange transactions, and taking measures to reduce the persistent overvaluation of the currency. Increasing exchange rate flexibility should be accompanied by a credible monetary policy aimed at lowering the rate of domestic infla-tion to less than 10 percent and stabilizing it. A timely and less expansionary monetary policy with adequate policy instruments can reduce persistent inflationary pressures while ensuring that the banking system has ample liquidity to support domestic demand for private sector credit. Exchange rate flexibility would help lib-eralize the foreign exchange market for banks, strengthen competitiveness, attract foreign direct investment, and thereby promote inclu-sive growth. To operate a more flexible foreign exchange regime would require developing an interbank market and strengthening the central bank’s reserve management.
Social safety nets to protect the most vulnerableRemoval of subsidies and other subventions and exchange rate adjustments could have unintended and inconsistent effects on the economy, hurting the poor in particular. Mea-sures to mitigate the impact on the poor are therefore critical for reforms to succeed. The revenue gains from improved tax collection and fiscal space created by fiscal consolidation could be used to provide social safety nets for the poor and most vulnerable segments of the population, including in particular women and children, while also investing in growth enhanc-ing projects. A first step in reducing subsidies could include better targeting fuel and wheat subsidies while liberalizing their prices. The people taking advantage of the subsidies are
43
Cha
rtin
g a
new
pat
h |
Aft
er T
wo
Dec
ades
of “
Solit
ude”
: Tar
gete
d St
rate
gies
for Q
uick
Eco
nom
ic W
ins
likely to be living in urban areas. This is impor-tant because Sudan cannot afford to subsidize the rich in urban areas on account of the limit-ed fiscal space. The savings from lifting subsi-dies could also be used to finance social safety net programs.
Improving the business environment and encouraging private investment and job creationReforms should include streamlining regula-tions, empowering the private sector, liberal-izing trade and foreign exchange markets, and unlocking entrepreneurship to complement public investment in infrastructure and public services. Steps include reforming the gover-nance structure to meet international stan-dards and codes and developing the expertise to design and implement full compliance, start-ing with self-assessments by private firms. In a high-quality regulatory environment, regulators and financial firms understand how to manage the risks the financial firms face. Policy makers should be clear about the roles of regulation and the market in ensuring that the efficiently management of financial risks. Improving the business environment and encouraging private investment and job creation also require estab-lishing an export promotion agency to organize the implementation of policies to promote exports. Such an agency could focus on ways to enhance exporters’ expertise in such basics as export packaging, quality management, and marketing skills to sell products and services in foreign markets.
Debt relief and public financial managementSudan is eligible for debt relief under the Heav-ily Indebted Poor Countries (HIPC) initiative. Debt relief hinges on normalizing relations with international creditors, including the IMF.57 The authorities should continue to reach out to creditors to garner support for debt relief
and should avoid selective servicing of bilateral debt. The Zero Option by which Sudan would take on the entire debt burden under certain conditions has been extended to September 2018 to avoid a complex and protracted appor-tionment of external debt.58
Public financial management should be strengthened by sustaining progress in the im-plementation of the treasury single account (TSA). This will entail (1) strengthening bud-get formulation and planning, with emphasis on revenue projections by the recently es-tablished macro-fiscal unit; (2) improving the preparation of the medium-term fiscal frame-work and incorporating it into budget planning; (3) expanding the coverage of the TSA; and (4) deploying an integrated financial management system.
Sectoral policies for agricultureEfficient sectoral policies include improving credit, land tenure, infrastructure, off-farm activities, technology transfer, and institu-tional reform. The agricultural sector needs a seed industry in conjunction with stepped-up research programs for developing new crop varieties suited to conditions in Sudan. It also needs effective research-extension-farmer linkages. And expanding access to credit pro-grams would include working capital for facil-itating yearly crop production and term loans for purchasing or leasing equipment.
A careful review of the land rental and ten-ancy system will allow long-term leases for smallholder farming and promote long-term investment in soil fertility and management. Industrialization policy should promote value chain development for agricultural capaci-ties, while giving more attention to standards, quality control, and packaging and product presentation to promote agro- industrial ex-ports. All these measures need effective gov-ernment budget allocations for agricultural services, including research, irrigation, and

44
Cha
rtin
g a
new
pat
h |
Aft
er T
wo
Dec
ades
of “
Solit
ude”
: Tar
gete
d St
rate
gies
for Q
uick
Eco
nom
ic W
ins
BOX�4.2�Gum�arabic�for�economic�recovery�and�environmental�sustainability�in�Sudan
Sudan holds huge private sector investment opportunities in small- and medium-scale forest enterprises involving gum arabic, one of its most important non-wood forest products. In recent years, the country has supplied 71 percent of the global market.
The gum arabic belt covers 13 of Sudan’s 15 states, an area of 520,000 square kilome-ters. Sudan’s traditional rainfed agriculture and animal husbandry, which occupy more than 70 percent of the country’s population, are highly vulnerable to climate change and variability. The farmers generally do not have access to insurance or other financial serv-ices that could help them cope with shocks. Strengthening the gum arabic value chain in Sudan will require building the organiza-tional, commercial, and technical capacity of an estimated 5,000 gum arabic producer associations (GAPAs) and their 5–6 million smallholder members. Grant funding and enhanced roles for governments, business service providers, financial service provid-ers, and development agencies are needed. The AfDB and other partners, such as FAO and IFAD, are currently supporting this ef-fort. Moreover, the Sudanese government is committed to eliminating concessions to export raw gum and ensuring financial and technical support to producers so they can benefit from liberalized trade, as well as ex-port processed gum arabic.
Export earnings from gum arabic were $134.2 million in 2013 — 17 percent of total Sudanese exports and 13–15 percent of foreign exchange. Gum arabic contributes 21 percent of household income. Thus, Sudan is highly dependent on forests, and forest products are part of food security,
household well-being and income genera-tion. Moreover, gum arabic trees in Sudan contribute to climate change adaptation and the resilience of communities, through the reliable income they provide to produc-ers and the fodder they provide for live-stock keepers. Gum trees sequester CO2, thus contributing to climate change mitiga-tion. In addition, the trees generate environ-mental and social co-benefits. They provide nectar for acacia honey production. And they fix nitrogen through the bacteria in their root systems, thus reducing the need for farmers to apply costly nitrogen fertiliz-ers, saving them an estimated $78/hectare.
The potential of gum arabic not yet been fully realized in Sudan. Weakness-es include a lack of appropriate collection tools, a low level of local processing, low prices paid to gum producers (15 percent of export prices), weak market infrastructure, and a shortage of financial support. The density of gum trees is low — 70–125 trees/hectare with a yield of 12.5 grams/tree in poorly managed gardens, but could go up to 150–625 trees/hectare and yield 55–100 grams/tree under good tending and man-agement, as happens in government-owned reserves. These shortcomings need to be circumvented to ensure that the Sudanese share in the world Gum market rebounds to its 80 percent pre-conflict level. To en-courage farmers to continue tapping gum arabic, the GAPAs must be reactivated, supported, and strengthened through basic services; better tapping, growing and tend-ing techniques; microfinancing and group support for inclusive green growth, and employment and economic diversification.

45
Cha
rtin
g a
new
pat
h |
Aft
er T
wo
Dec
ades
of “
Solit
ude”
: Tar
gete
d St
rate
gies
for Q
uick
Eco
nom
ic W
ins
crop protection. Finally, improving capacity and developing a comprehensive monitoring and evaluation program providing information to national and subnational governments on progress program implementation is crucial.
A new pathIn today’s increasingly dynamic, multipolar, yet interdependent world, Africa needs a “can do” mindset59 — to cooperate on structural trans-formation for job creation. Emerging and de-veloping countries now account for more than 57 percent of global GDP, while the advanced industrial countries account for less than 43 percent. Emerging and developing countries account for over two-thirds of global growth and are the main drivers of the global econ-omy. China alone accounts for 33 percent of global growth, due to its economic size and its 6.5 to 7 percent annual growth.
Sudan has an unprecedented opportunity to be a destination for firms relocating from China and other emerging donor countries (in-cluding Arabic ones). As real wages rise in China and other upper-middle-income countries, mil-lions of manufacturing jobs will move to other developing countries along with outward for-eign direct investment (OFDI). Improved con-nectivity from the construction of several spe-cial economic zones or agri-ecological parks near Port Sudan on the Red Sea would allow Sudan and other countries in northeast Africa to seize the opportunity provided by the in-dustrial upgrading of China, India, South Korea, Turkey, Saudi Arabia, South Africa, and other leading dragons.
Based on the analysis here, policy makers in Sudan may consider the following options:
Option 1. Promote deep openings for foreign direct investment by setting up special eco-nomic zones (SEZs) or agri-ecological parks, and making the zone the best place to attract
talent and the best place to invest. The govern-ment must invest resource rents innovatively in hard and soft infrastructure in and around the selected zones and offer time-limited incen-tives for foreign and domestic firms to invest — “building the nest to attract the phoenixes.” Further integration with the regional market would allow Sudan to seize some of the 85 mil-lion manufacturing jobs that China may have to relocate in the next decade. Sudan needs to compete for OFDI from China, India, Saudi Arabia, South Korea, UAE, and other emerg-ing countries to foster learning, reduce pover-ty, and generate employment for its growing young labor force.
Option 2. Augment natural capital such as land, pasture, and other assets by investing in higher value-added agriculture, horticulture, tree crops, and animal husbandry. Promote agri-business for green development to get green financing. And combat desertification following the Kubuqi model in Inner Mongolia. Sudan is endowed with abundant arable pasto-ral land but faces severe drought and desert-ification. Since most of the poor live in rural areas, the government should enable the pri-vate sector to invest in large-scale irrigated ag-riculture, dairy farming and animal husbandry, and the leather supply chain for regional and global export. The production of fertilizers and farming equipment could provide inputs for agriculture and agri-business. To increase rural employment, it might be desirable to attract workers into light manufacturing, such as foot-wear and garments.
This strategy would help Sudan to grasp unprecedented opportunities as firms from emerging market economies, such as from China, Egypt, Saudi Arabia, and South Africa, “go global.” With South Sudan and other neigh-bors, Sudan should jointly form cross-country supply chains for assembly of farm machinery and equipment through original equipment

46
Cha
rtin
g a
new
pat
h |
Aft
er T
wo
Dec
ades
of “
Solit
ude”
: Tar
gete
d St
rate
gies
for Q
uick
Eco
nom
ic W
ins
manufacturing or processing trade. Sudan should also seek synergies between its emerg-ing tourism and services opportunities and eco-friendly SEZ development in an inclusive model focused on people, providing training and capacity building and attracting talent for a learning and innovative society.
Currently more than 100 countries world-wide have SEZ programs operating sever-al thousand SEZs. As programs continue to
proliferate, Sudan’s policy makers must target SEZ sectors and locations (near the port) so that foreign and domestic investors are attract-ed and will generate jobs. The mindset must change from the traditional one of seeking the first and best solutions for improving the nationwide investment climate to focusing on institutions that unite, infrastructure that con-nects, and interventions that target, including the sectors and SEZs identified in this report.
47
Not
es a
nd re
fere
nces
| A
fter
Tw
o D
ecad
es o
f “So
litud
e”: T
arge
ted
Stra
tegi
es fo
r Qui
ck E
cono
mic
Win
s
Notes1. These costs are reflected in all transactions, even
where formal OFAC licenses have been obtained. Ul-
timately, all such costs are passed to Sudanese citi-
zens as opposed to the Sudanese government or any
other official body.
2. Though these macroeconomic indicators have im-
proved since due to fiscal consolidation and reforms
in 2012 and 2013, the fundamentals of the economy
are still very weak.
3. The milestones are (1) continued cessation of hostil-
ities in conflict areas, (2) humanitarian access, (3) co-
operation with South Sudan, (4) cooperation in com-
bating terrorism, and (5) cooperation in maintaining
regional peace and stability.
4. The Bank’s efforts in supporting Sudan’s debt relief
efforts include membership in the Technical Working
Group on Debt comprising the International Mone-
tary Fund, World Bank, and major creditors and as-
sisting Sudan to meet all the technical requirements
for HIPC debt relief, in close collaboration with the
World Bank and the IMF. These included: (1) debt
reconciliation, (2) debt sustainability analysis, (3) es-
tablishment of debt relief scenarios, (4) conducting
a nationwide poverty survey to prepare an Interim
Poverty Reduction Strategy Paper (I-PRSP), and (5)
preparation of a Debt Relief Strategy in 2013. This
left Sudan and South Sudan only to supply effective
political outreach to give traction to the debt relief
process. The Bank has also approved $1.0 million in
2014 to fight litigation cases against Sudan filed by its
secondary creditors.
5. The objective of this group is to provide factual in-
formation and objective analysis for the use of the in-
ternational community including Parties to the Com-
prehensive Peace Agreement signed in January 2005
by the Sudan People’s Liberation Movement (SPLM)
and the Government of Sudan in examining and un-
derstanding issues related to Sudan’s external debt.
6. Confidence in Africa is so important: an overwhelm-
ing 74 percent of Chinese firms are confident about
Africa’s future, so they plan to invest (McKinsey 2017).
7. Schultze 1983.
8. Lin and Monga 2011.
9. World Bank 2009, p. 31.
10. World Bank 2009, p.1.
11. See for example, Baldwin and Lopez-Gonzalez (2013)
“Supply-Chain Trade: A Portrait of Global Patterns
and Several Testable Hypotheses,” which argues that
reduced transport costs allow adopting I2E and join-
ing (rather than building) global supply chains as ways
of catch-up for developing countries. Many East
Asian countries are examples.
12. For example, Germany’s January 2017 Marshall Plan, the
High 5s of the AfDB, and China’s Belt and Road Initia-
tive. See also Felino and Pinto (2017) on “A Bridge to
African Self-reliance: The Big Bond,” the Addis Ababa
Action Agenda, and the follow-up United Nations
Conference on Trade and Development meeting to be
held on 8–10 November, on financing for development.
13. McKinsey 2017; Lin and Wang 2017a.
14. Lin 2012.
15. AfDB 2016a.
16. World Bank 2018.
17. Empowering Novel Agri-Business-Led Employment
for the Youth (ENABLE Youth).
18. AfDB Statistics.
19. Debt reconciliation, debt sustainability analysis, debt
relief scenarios; arrears clearance and debt relief
strategy, and implementation of an interim poverty
reduction strategy paper (I-PRSP) for two years.
20. They include cessation of hostilities, humanitarian
access, cooperation on South Sudan, counter terror-
ism, and cooperation in regional stability.
21. Ali and Elbadawi 2004.
22. Ali 2012.
23. In the 1980s, deficit financing was the major source
of inflation, so the government, in its attempts to
PART 1
Notes�and�references
48
Not
es a
nd re
fere
nces
| A
fter
Tw
o D
ecad
es o
f “So
litud
e”: T
arge
ted
Stra
tegi
es fo
r Qui
ck E
cono
mic
Win
s
reduce the budget deficit, partially removed the
subsidies on essential consumer goods such as sugar,
wheat, and petroleum products. In addition, mea-
sures to direct the liquidity into the banking system
have been taken to reduce the high rate of inflation
(Gangi and Mahran 1996).
24. AfDB 2016b.
25. Gadkarim 2012.
26. Expenditure side measures: 50 percent reduction of
government size, removal of 50 percent subsidies
on oil products, and reducing government-procured
goods and services. Revenue side measures: tax re-
form, tightening loopholes for corruption, and in-
creasing oil and gold production.
27. AfDB 2017.
28. The establishment of an official exchange rate (the
CBOS rate) for use in all government exchange trans-
actions, which in practice differs by more than 2 per-
cent from the rate commercial banks use.
29. To a lesser extent by improving the terms of trade.
30. The correlation between real exchange rate misalign-
ment and non-fuel exports is 0.16 during 1990–2016.
31. Total public debt continued to increase in recent
years. It reached SDG 137 billion (74 percent of GDP)
at end-2011, up from SDG 65 billion in 2005 and SDG
49 billion in 2000. This increase in total public debt
was mainly the result of an increase in the stock of
debt denominated in foreign currency, including a
devaluation effect.
32. AfDB 2016b.
33. Yagoob, Hadia, and Zuo 2016.
34. Assal 2010.
35. Sudan’s financial sector continues to be dominated
by banks operating under Islamic modes of finance.
Mobilizing and investing funds should both be in
accordance with the principles of Islamic Shari’a. Li-
quidity management is difficult because of the lim-
ited number of Islamic financial instruments and
relatively inactive secondary market, which tends
to undermine the Central Bank of Sudan’s ability
to control reserve money. The Central Bank, which
operates under the Shariat law, cannot use inter-
est-bearing debt instruments. It cannot discount
these instruments in the secondary markets, either.
It is thus left with three alternative instruments:
equity-based instruments, quantitative ceilings on
credit, or reserve ratios. Each has shortcomings. The
equity-based instrument cannot be priced efficient-
ly. Quantitative ceilings and reserve ratios cannot
guarantee full control of the supply of money. The
Central Bank thus has less effective instruments of
money control than banks in other countries operat-
ing under the traditional non-Shariat system.
36. UNESCWA 2015.
37. IMF 2017.
38. Sudan Central Bank.
39. Purchasing power parity is a key building block of
many models in international economics. It assumes
changes in foreign inflation and the nominal ex-
change rate can have immediate pass-through impact
on the level of domestic prices.
40. The estimate is based on ratio of total employment
to the adult population combined with the share of
each sector’s contribution to the overall employ-
ment and sorted by gender. The data were gleaned
from UNCTAD (2017).
41. Datasets for the 2014 household survey have not
been validated by the authorities and thus were not
available for this exercise.
42. Before sanctions were lifted, a number of back-
ground studies were commissioned as input to the
World Bank’s country economic memorandum for
Sudan (World Bank 2015). The analysis in this section
is based on Lofgren (2015), one of the studies.
43. Maquette for MDG (Millennium Development Goals)
Simulations. See Lofgren (2015).
44. O’Driscoll 2017.
45. IMF 2013, p. 5.
46. McKinsey 2017.
47. Lin and Wang 2014.
48. The annual production volume of Chinese steel in-
teracting with the recipient province’s probability of
receiving aid is used as an instrument variable (IV) to
address the endogeneity problem associated with
Chinese aid (Dreher et al. 2017. This recent paper
analyzes the effectiveness of Chinese aid, using a
media-based dataset that captures ODA (more con-
cessional) and OOF (other official flows, less or not
concessional) from China to 138 countries in five re-
gions in 2000–14.

49
Not
es a
nd re
fere
nces
| A
fter
Tw
o D
ecad
es o
f “So
litud
e”: T
arge
ted
Stra
tegi
es fo
r Qui
ck E
cono
mic
Win
s
Official data are not available on China’s aid and invest-
ment by country and by project. AidData builds a
new database from media-based sources covering
five regions: Africa, the Middle East, Asia and the Pa-
cific, Latin America and the Caribbean, and Central
and Eastern Europe. For China, four primary open
sources are: English, Chinese, and local-language
news reports; official statements from Chinese min-
istries, embassies, and economic and commercial
counselor offices; the aid and debt information man-
agement systems of finance and planning ministries
in counterpart countries; and case study and field
research by scholars and nongovernmental organiza-
tions. These project-level data from 4,304 officially
committed projects and 630 pledges of support are
standardized using AidData’s TUFF method. These
project-level data are categorized into three types:
ODA, other official flows (OOFs), and vague official
finance (OF). Vague official finance (OF) projects rep-
resent official financial flows where there is insuffi-
cient open-source information to clearly determine
whether the flows are more akin to ODA or to OOF.
Scholars have challenged its data limitations and
classifications
49. Dreher et al. 2017.
50. See Chinese President Xi Jinping’s speech at the
Summit for the Belt and Road Initiative, 14 May 2017.
http://news.xinhuanet.com/english/2017-05/14/
c_136282982.htm.
51. In the new charter, the Communist Party of China in-
tends “to promote the ‘One Belt and One Road’ con-
struction in accordance with the principles of ‘wide
consultation, joint construction, and shared bene-
fit.’” General Charter of CPC, Xinhua News Agency,
28 October 2017.
52. See annex 4 for commitments.
53. The indicator ODA/GNI is around 0.3 percent for the
United States and Japan. The level mandated by the
Organisation for Economic Cooperation and Devel-
opment–Development Assistance Committee is 0.7
percent of GNI. However, China is still a developing
country, with a per capita GDP around $8,000.
54. Detailed official data are not available on China’s
aid and investment by country and by project. Aid-
Data developed a media-based database, with cross
checks. This calculation is based on project data on
completed projects and programs from aiddata.com.
It does not include recent commitments to Sudan, or
projects yet to be completed.
55. For railway projects, see AfDB (2016b) annex 8, annex
table 8.3.
56. Sudan has one of the lowest direct tax revenues
among lower-middle–income countries, collecting
only 0.6 percent of GDP. This is explained by low per-
sonal and corporate income tax rates, multiple ex-
emptions and tax holidays, and low compliance due
to weak administration.
57. Sudan has satisfied almost all technical requirements
for debt relief including reconciling debt, establishing
debt scenarios, preparation and implementation of
the I-PRSP for two years, preparation of a debt re-
lief strategy with AfDB assistance, finalizing the full
PRSP with AfDB assistance, and implementing 13 staff
monitored programs.
58. Sudan would take the entire debt burden subject
to joint political outreach to creditors and access to
debt relief under the Heavily Indebted Poor Coun-
tries (HIPC) initiative within two years. Should this
approach fail, Sudan and South Sudan would resort
to debt apportionment, a challenging process that
could be volatile.
59. Confidence in Africa is so important: an overwhelming
74 percent of Chinese firms are confident about Afri-
ca’s future, so they plan to invest (McKinsey 2017, p.10).
ReferencesAfDB (African Development Bank). 2016a. “Sudan Country
Note.” Abidjan: Côte d’Ivoire.
———. 2016b. “Private Sector-Led Economic Diversifica-
tion and Development in Sudan.” African Development
Bank, Eastern Africa Regional Resource Centre, Nairobi.
———. 2017. African Economic Outlook 2017: Entrepre-
neurship and Industrialization. Abidjan: Côte d’Ivoire.
Ali, H. M. H. 2012. “Cointegration growth, poverty and in-
equality in Sudan.” Economic Research Guardian 2 (1):
70–98.
Ali, Gadir Ali, and I. Elbadawi. 2004. “Explaining Sudan’s
Economic Growth Performance.” Working Paper No.
9; Prepared as a component of the African Economic

50
Not
es a
nd re
fere
nces
| A
fter
Tw
o D
ecad
es o
f “So
litud
e”: T
arge
ted
Stra
tegi
es fo
r Qui
ck E
cono
mic
Win
s
Research Consortium (AERC) Collaborative Research
Project on “Explaining Africa’s Growth Performance.”
Assal, M. 2010. “Highly-skilled Sudanese migrants: Gain or
drain?” CARIM Analytic and Synthetic Notes 2010/13.
Bahram P., and M.H. Pesaran. 2009. Time Series Economet-
rics using Microfit 5.0 A User’s Manual. Oxford, UK:
Oxford University Press.
Baldwin, Richard, and Javier Lopez-Gonzalez. 2013. “Supply-
Chain Trade: A Portrait of Global Patterns and Several
Testable Hypotheses.” NBER Working Paper 18957, Na-
tional Bureau of Economic Research, Cambridge, MA.
Felino, L. T., and B. Pinto. 2017. “A Bridge to African Self-
reliance: The Big Bond.” Washington, DC: Brookings
Institution.
Dreher, Axel, Andreas Fuchs, Bradley Parks, Austin M.
Strange, and Michael J. Tierney, 2017. “Aid, China, and
Growth: Evidence from a New Global Development
Finance.” Working Paper 46, AidData, Williamsburg, VA.
Gadkarim, Hassan Ali. 2012. “Will the Sudanese paradox
continue? Insecure investment climate and substantial
foreign direct investment inflows.” Sudan Report, Chr.
Michelsen Institute (CMI).
Gangi, Yagoub, and Hatim Mahran. 1996. “The causes of
inflation in Sudan.” Eastern Africa Social Science Re-
search Review 7.
ILO (International Labour Organization). 2005. Employment
Strategy Paper. Geneva.
IMF (International Monetary Fund). 2013. Regional Econom-
ic Outlook: Sub-Saharan Africa. Washington, DC.
———. 2017. “Sudan: Article IV Consultation.” Country
Report No. 17/364, International Monetary Fund, Wash-
ington, DC.
Lin, J. Y. 2012. The Quest for Prosperity: How Developing
Economies Can Take Off. Princeton, NJ: Princeton Uni-
versity Press.
Lin, J. Y., and C. Monga. 2011. “Growth Identification and
Facilitation: The Role of the State in the Dynamics of
Structural Change.” Development Policy Review 29 (3):
264–90.
Lin, J. Y., and Y. Wang. 2014. “China-Africa Cooperation in
Structural Transformation: Ideas, Opportunities and
Finances.” Working Paper 2014/046, United Nations
University World Institute for Development Economics
Research, Helsinki. www.wider.unu.edu/publications/
working-papers/2014/en_GB/wp2014–046/.
———. 2017a. Going beyond Aid: Development Cooper-
ation for Structural Transformation. Cambridge Uni-
versity Press.
———. 2017b. “New Structural Economics: Patient Capi-
tal as a comparative advantage.” Journal of Infrastruc-
ture, Policy and Development 1 (1). http://systems.en-
press-publisher.com/index.php/jipd/article/view/28.
Lofgren, H. 2015. “External Environment and Domestic Poli-
cy: Alternative Scenarios for Sudan to 2030.”
McKinsey. 2017. Dance of the Lions and Dragons: How are
Africa and China engaging, and how will the partner-
ship involve? June 2017.
McNown, R., and M. Wallace. 1989. “National Price Levels,
Purchasing Power Parity, and Cointegration: A Test of
Four High Inflation Economies.” Journal of Internation-
al Money and Finance 8: 533–45.
O’Driscoll, D. 2017. “Impact of lifting economic sanctions
on poverty and growth.” K4D, HelpDesk Report, Insti-
tute of Development Studies.
Pesaran, M. H., and Y. Shin. 1996. “Cointegration and the
speed of Convergence to Equilibrium.” Journal of
Econometrics 71: 117–43.
Schultze, Charles. 1983. “Industrial Policy: A Dissent.”
Brookings Review (October): 3–12.
UNCTAD (United Nations Conference on Trade and Devel-
opment). 2017. World Investment Report 2017: Invest-
ment and the Digital Economy. Geneva.
UNESCWA (United Nations Economic and Social Commis-
sion for Western Asia). 2015. “Remittances in Sudan.”
Beirut, Lebanon.
World Bank. 2009. World Development Report 2009: Re-
shaping Economic Geography. Washington, DC.
———. 2015. Sudan Country Economic Memorandum:
Realizing the Potential for Diversified Development.
Washington, DC.
———. 2018. Trouble in Making? Future of Manufacturing-
Led Growth. Washington, DC.
———. World Development Indicators [database]. Wash-
ington, DC.
Yagoob, A., A. Hadia, and T. Zuo. 2016. “Evaluation of For-
eign Aid from China on Sudan’s Economic Develop-
ment Process.” Developing Country Studies 5 (8).

51
Not
es a
nd re
fere
nces
| A
fter
Tw
o D
ecad
es o
f “So
litud
e”: T
arge
ted
Stra
tegi
es fo
r Qui
ck E
cono
mic
Win
s
PA RT 2
Targeted strategies for quick economic wins


53
Suda
n’s
med
ium
-ter
m o
ptio
ns |
Aft
er T
wo
Dec
ades
of “
Solit
ude”
: Tar
gete
d St
rate
gies
for Q
uick
Eco
nom
ic W
ins
CHAPTER 5
Sudan’s�medium-term�options
Modern economic growth is a process of continuous structural change in technology, industries, and socio-
economic institutions. Except for a few oil-ex-porting countries, no country has achieved high-income status without industrialization and dynamic industrial upgrading. Countries need to make a structural transformation from reliance on a traditional agriculture- or resource-based economy to development of a fuller and longer value chain of production that includes processing, trade, light manufac-turing, heavy manufacturing, and services. Es-sentially, development is a process of learning, innovation, and upgrading along this spectrum, moving from land- and resource-intensive sec-tors to labor-intensive or capital- and technol-ogy-intensive sectors.
The manufacturing sector, in particular, of-fers boundless possibilities for the production of tradable goods — including technology itself — that enable countries to import what they do not produce and export what they are good at producing. In the first stage of economic catch-up, manufacturing firms can be instrumental in absorbing appropriate technologies from abroad and in transferring new technologies to non-manufacturing sectors of the economy. Manufacturing is credited with modernizing the agricultural and mining sectors that provide its raw materials through backward linkages and for spawning ancillary activities, particularly services, through forward linkages.
There is a positive and significant correla-tion between growth of manufacturing value added (MVA) and income growth in the world and in the Africa region specifically over 1990–2014 (figure 5.1). Countries with rapid MVA
FIGURE�5.1�Industrialization�is�an�engine�of�growth:�manufacturing�and�income�growth,�1990–2014World
GDP growth, 1990–2016 (annual percent)
–5 0 5 10 15–5
0
5
10
Manufacturing value added growth rate, 1990–2016 (annual percent)
Africa
GDP growth, 1990–2016 (annual percent)
–5 0 5 10 15–5
0
5
10
Manufacturing value added growth rate, 1990–2016 (annual percent)
Source: Calculated based on data from World Bank, World Development Indicators, 2017
and Lin and Wang 2017a, p. 28.

54
Suda
n’s
med
ium
-ter
m o
ptio
ns |
Aft
er T
wo
Dec
ades
of “
Solit
ude”
: Tar
gete
d St
rate
gies
for Q
uick
Eco
nom
ic W
ins
growth, such as Cambodia, China, Laos, Myan-mar, Uganda, and Vietnam, have seen their per capital GDP grow faster than in countries with slower MVA growth. In Sudan, although indus-trial development was progressing prior to the secession of South Sudan in 2011, driven largely by the oil sector, manufacturing activity de-clined from 8 percent of GDP in 1980–89 and the early 2000s to around 6 percent of GDP in 2015, trailing other countries at a similar income level (see figure 5.1)
As a fragile and post-conflict country, Sudan faces severe socioeconomic, environmental, and humanitarian challenges. So, the key ques-tions for Sudan are:• How to identify a few growth pillars or sec-
tors on which the country could focus its limited resources and potentially achieve quick developmental results (sector focus, vertical target)?
• In which areas should the country concen-trate its public and private investment in order to maximize the impact of foreign di-rect investment (FDI), knowledge spillovers, and agglomeration (zone focus, horizontal target)?
The Growth Identification and Facilitation FrameworkThe Growth Identification and Facilitation Framework provides a practical guide for iden-tifying Sudan’s latent comparative advantage — or what it could potentially do well (box 5.1).
Selecting sectors to targetIdentifying growth pillars or sectors is challeng-ing, as economic theory provides few clues for determining which industries are “right” and which are “wrong.” As some analysts caution, “[t]he first problem for the government in car-rying out an industrial policy is that we actu-ally know precious little about identifying … a ‘winning’ industrial structure. There is not a set
of economic criteria that determine what gives different countries preeminence in particular lines of business.”60
A pragmatic process for identifying growth pillars is to analyze latent comparative advan-tage, defined as the “comparative advantage of an economy that is embedded in the factor costs of production [which are] determined by the economy’s endowment structure.” 61 La-tent comparative advantage could lie in a new industry that is not yet successful in today’s economy, mostly likely because of high trans-action costs, logistics, and other unfavorable business conditions. If these conditions are im-proved, the economy could be competitive in the world market in this industry.
Reasons for targeting sectorsSudan has suffered conflicts and embargos and other internal and external shocks since the 1950s, exacerbated by the secession of South Sudan in 2011. In this context, policy makers may want to prioritize policies for grasping low hanging fruit to achieve quick wins that could boost investor confidence and enhance the momentum for development.
The first step is to identify the right target countries and the right industries as a precon-dition for successful catch up (see box 5.1). Gov-ernment must decide which infrastructure to improve and where these services should be provided to facilitate private sector activities. Developing country governments have limited resources to invest in the necessary hard and soft infrastructure, which are often sector spe-cific. Each developing country cannot be suc-cessful in all sectors, so individual sectors need to be targeted for attention. Identification is also important because specialization, agglom-eration, and industrial clustering are crucial for achieving economies of scale and reducing costs in any industry. Government needs to provide infrastructure services in certain locations, or incentives for first movers in certain sectors, so
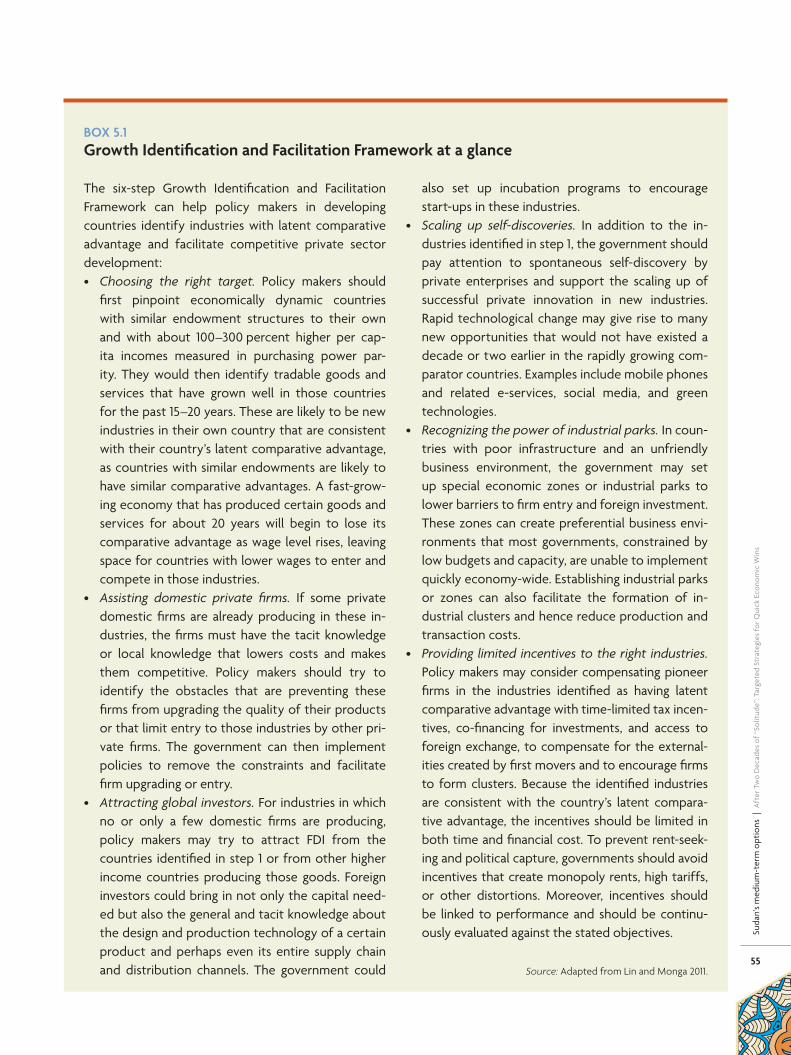
55
Suda
n’s
med
ium
-ter
m o
ptio
ns |
Aft
er T
wo
Dec
ades
of “
Solit
ude”
: Tar
gete
d St
rate
gies
for Q
uick
Eco
nom
ic W
ins
BOX�5.1�Growth�Identification�and�Facilitation�Framework�at�a�glance
The six-step Growth Identification and Facilitation Framework can help policy makers in developing countries identify industries with latent comparative advantage and facilitate competitive private sector development:• Choosing the right target. Policy makers should
first pinpoint economically dynamic countries with similar endowment structures to their own and with about 100–300 percent higher per cap-ita incomes measured in purchasing power par-ity. They would then identify tradable goods and services that have grown well in those countries for the past 15–20 years. These are likely to be new industries in their own country that are consistent with their country’s latent comparative advantage, as countries with similar endowments are likely to have similar comparative advantages. A fast-grow-ing economy that has produced certain goods and services for about 20 years will begin to lose its comparative advantage as wage level rises, leaving space for countries with lower wages to enter and compete in those industries.
• Assisting domestic private firms. If some private domestic firms are already producing in these in-dustries, the firms must have the tacit knowledge or local knowledge that lowers costs and makes them competitive. Policy makers should try to identify the obstacles that are preventing these firms from upgrading the quality of their products or that limit entry to those industries by other pri-vate firms. The government can then implement policies to remove the constraints and facilitate firm upgrading or entry.
• Attracting global investors. For industries in which no or only a few domestic firms are producing, policy makers may try to attract FDI from the countries identified in step 1 or from other higher income countries producing those goods. Foreign investors could bring in not only the capital need-ed but also the general and tacit knowledge about the design and production technology of a certain product and perhaps even its entire supply chain and distribution channels. The government could
also set up incubation programs to encourage start-ups in these industries.
• Scaling up self-discoveries. In addition to the in-dustries identified in step 1, the government should pay attention to spontaneous self-discovery by private enterprises and support the scaling up of successful private innovation in new industries. Rapid technological change may give rise to many new opportunities that would not have existed a decade or two earlier in the rapidly growing com-parator countries. Examples include mobile phones and related e-services, social media, and green technologies.
• Recognizing the power of industrial parks. In coun-tries with poor infrastructure and an unfriendly business environment, the government may set up special economic zones or industrial parks to lower barriers to firm entry and foreign investment. These zones can create preferential business envi-ronments that most governments, constrained by low budgets and capacity, are unable to implement quickly economy-wide. Establishing industrial parks or zones can also facilitate the formation of in-dustrial clusters and hence reduce production and transaction costs.
• Providing limited incentives to the right industries. Policy makers may consider compensating pioneer firms in the industries identified as having latent comparative advantage with time-limited tax incen-tives, co-financing for investments, and access to foreign exchange, to compensate for the external-ities created by first movers and to encourage firms to form clusters. Because the identified industries are consistent with the country’s latent compara-tive advantage, the incentives should be limited in both time and financial cost. To prevent rent-seek-ing and political capture, governments should avoid incentives that create monopoly rents, high tariffs, or other distortions. Moreover, incentives should be linked to performance and should be continu-ously evaluated against the stated objectives.
Source: Adapted from Lin and Monga 2011.
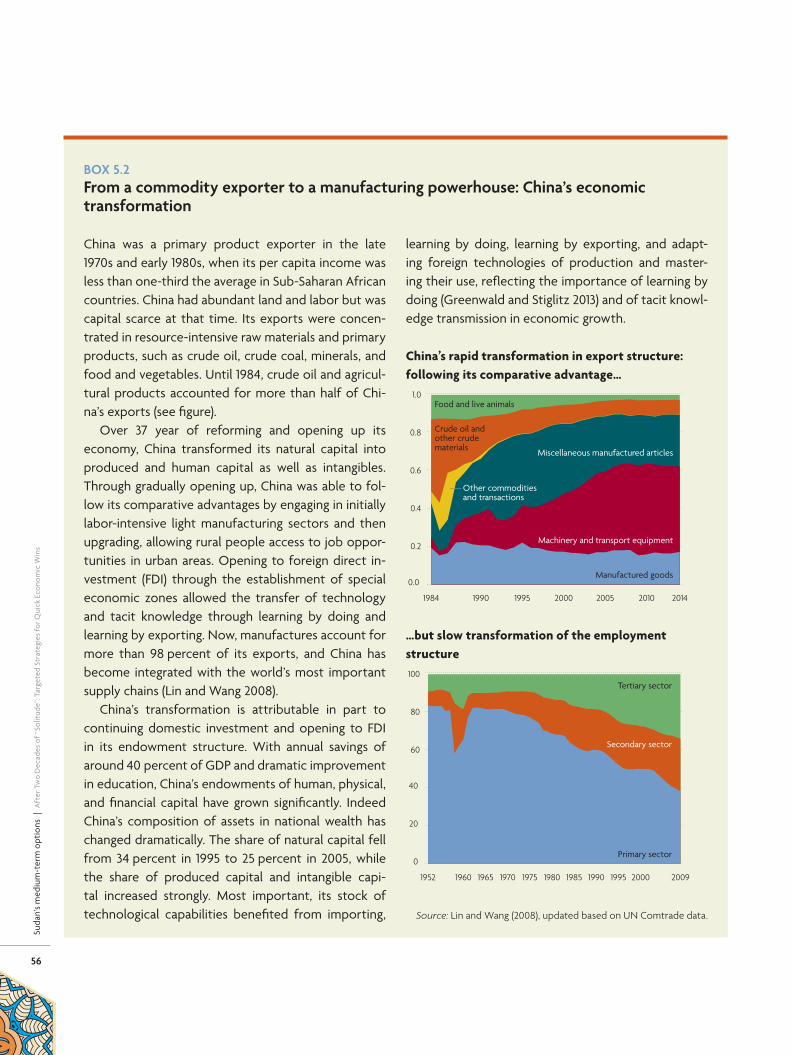
56
Suda
n’s
med
ium
-ter
m o
ptio
ns |
Aft
er T
wo
Dec
ades
of “
Solit
ude”
: Tar
gete
d St
rate
gies
for Q
uick
Eco
nom
ic W
ins
BOX�5.2�From�a�commodity�exporter�to�a�manufacturing�powerhouse:�China’s�economic�transformation
China was a primary product exporter in the late 1970s and early 1980s, when its per capita income was less than one-third the average in Sub- Saharan African countries. China had abundant land and labor but was capital scarce at that time. Its exports were concen-trated in resource-intensive raw materials and primary products, such as crude oil, crude coal, minerals, and food and vegetables. Until 1984, crude oil and agricul-tural products accounted for more than half of Chi-na’s exports (see figure).
Over 37 year of reforming and opening up its economy, China transformed its natural capital into produced and human capital as well as intangibles. Through gradually opening up, China was able to fol-low its comparative advantages by engaging in initially labor-intensive light manufacturing sectors and then upgrading, allowing rural people access to job oppor-tunities in urban areas. Opening to foreign direct in-vestment (FDI) through the establishment of special economic zones allowed the transfer of technology and tacit knowledge through learning by doing and learning by exporting. Now, manufactures account for more than 98 percent of its exports, and China has become integrated with the world’s most important supply chains (Lin and Wang 2008).
China’s transformation is attributable in part to continuing domestic investment and opening to FDI in its endowment structure. With annual savings of around 40 percent of GDP and dramatic improvement in education, China’s endowments of human, physical, and financial capital have grown significantly. Indeed China’s composition of assets in national wealth has changed dramatically. The share of natural capital fell from 34 percent in 1995 to 25 percent in 2005, while the share of produced capital and intangible capi-tal increased strongly. Most important, its stock of technological capabilities benefited from importing,
learning by doing, learning by exporting, and adapt-ing foreign technologies of production and master-ing their use, reflecting the importance of learning by doing (Greenwald and Stiglitz 2013) and of tacit knowl-edge transmission in economic growth.
China’s rapid transformation in export structure: following its comparative advantage…
0.0
0.2
0.4
0.6
0.8
1.0
2014201020052000199519901984
Manufactured goods
Machinery and transport equipment
Miscellaneous manufactured articles
Crude oil andother crude materials
Food and live animals
Other commoditiesand transactions
…but slow transformation of the employment structure
0
20
40
60
80
100
20092000199519901985198019751970196519601952
Primary sector
Secondary sector
Tertiary sector
Source: Lin and Wang (2008), updated based on UN Comtrade data.

57
Suda
n’s
med
ium
-ter
m o
ptio
ns |
Aft
er T
wo
Dec
ades
of “
Solit
ude”
: Tar
gete
d St
rate
gies
for Q
uick
Eco
nom
ic W
ins
that private firms are not spread too thinly over too many sectors, as that reduces the firms’ chances of surviving and gaining a competitive edge in the international market.
For developing countries whose economies depend heavily on natural resources, it is crit-ical to apply the rent generated from natural resources to facilitating diversification to other non-resource-based industries. Many develop-ing countries have abundant land and natural resources, so they are primary product ex-porters in the first stage of their development. To upgrade their industrial structure, they must first close their endowment gaps with advanced industrial countries by investing in human and institutional (intangible) capital and physical infrastructure.
The strategy to get there is to follow a country’s comparative advantage at each stage
of development. When firms choose to enter industries and adopt technologies that are consistent with the country’s comparative ad-vantage, the economy is most competitive. In these conditions, firms will claim the largest possible market shares and create the great-est possible economic surplus. Owing to the competitiveness of these industries, reinvest-ed surpluses can earn the highest return, which allows the economy to accumulate even more physical and human capital. This dynamic can lead to a virtuous circle: it can upgrade the country’s factor endowment structure as well as its industrial structure and, in addition, make domestic firms more competitive in more capital- and skill-intensive products over time. The Republic of Korea, China, and many other countries have been following their compara-tive advantages (see box 5.2).


59
Iden
tify
ing
sect
ors
wit
h la
tent
com
para
tive
adv
anta
ge |
Aft
er T
wo
Dec
ades
of “
Solit
ude”
: Tar
gete
d St
rate
gies
for Q
uick
Eco
nom
ic W
ins
CHAPTER 6
Identifying�sectors�with�latent�comparative�advantage
How can a country target the right countries and the right industries? The Growth Identification and Facilitation
Framework provides a practical guide (see box 5.1 in chapter 5). The first step is to choose the right countries — dynamically growing coun-tries with a similar endowment structure and a per capita income that is not too far ahead of the home country — and then to identify the tradable goods and services that they have been producing for 15–20 years and that are declining, thereby providing opportunities for the home country.
For Sudan, comparator countries were select-ed based on three criteria: they have a per capita income not exceeding 300 percent of Sudan’s, they have been growing consistently over the past 21 years (1995–2016), and they have good performance in manufacturing development as measured by manufacturing value added (MVA) in GDP (table 6.1). Sudan’s average annual in-come in purchasing power parity (PPP) measured in constant 2011 international dollars rose from $1,961 in 1995 to $4,385 in 2016, in part because of the global resource boom. But its structure of production is still that of a primary product ex-porter, similar to that of many countries in Africa. Its MVA was 6 percent of GDP in 2016, lower than in Egypt, Tunisia, and several other peer African countries, and much lower than in Xinjiang Au-tonomous Region of China.
For Sudan’s stage of transformation (low average annual income of $4,385 and low level of manufacturing development, with heavy reliance on oil and an urgent need for diversi-fication), the most relevant comparator coun-tries include the most dynamically growing ones, such as China (including Xinjiang), with an
MVA of 31 percent of GDP; Egypt with an MVA of 17 percent; Tunisia with an MVA of 16.9 per-cent; and Vietnam with an MVA of 15.9 per-cent. China and Egypt are also among the main sources of FDI to Sudan.
Egypt and Tunisia are selected because their physical and cultural proximity, as well as their successful industrialization and diversification. (See technical annex 1 for details of the meth-odology used in selecting the target coun-tries.) Xinjiang Autonomous Region of China, with similar natural endowments as Sudan — resource-rich but suffering from desertification and labor scarcity62 — is developing rapidly and has transformed and diversified successfully. It has a GDP per capita growth rate of 8.05 per-cent, an MVA of 13.9 percent of GDP in 2015, and an income level within 300 percent of that of Sudan. By developing a number of special economic zones and eco- agricultural and tech-nical innovation zones, Xinjiang has become a major exporter of processed food, light manu-factures, home appliances, and some high-tech products (see annex 5).
Sudan’s existing comparative advantageWhat is the best way to measure the compara-tive advantage of a country like Sudan? A wide-ly used measure for comparing one country’s export structure with that of other countries is revealed comparative advantage (RCA). If Sudan’s export of commodity A has a bigger share of Sudan’s total exports than commodity A’s share in world’s export, then Sudan has an RCA in commodity A (RCA > 1).63 This method is described in box 6.1.

60
Iden
tify
ing
sect
ors
wit
h la
tent
com
para
tive
adv
anta
ge |
Aft
er T
wo
Dec
ades
of “
Solit
ude”
: Tar
gete
d St
rate
gies
for Q
uick
Eco
nom
ic W
ins
TABLE�6.1�Sudan�and�identified�comparator�countries
Country
GDP�per�capita�in�purchasing�power�parity�(constant�2011�international�dollars) Average�GDP�
growth�per�capita�1995–2016
Manufacturing�as�share�of�
GDP�(%)�2016
1995��($)
Share�of�Sudan�(%)
2010��($)
Share�of�Sudan�(%)
2016��($)
Share�of�Sudan�(%)
Sudan 1,961 na 3366 na 4385 na 3.9 6.1a
Comparator economies
China 2,564 131 9,526 283 14,401 328 8.6 30.0
Egypt 6,293 321 9,857 293 10,319 235 2.4 17.1
Tunisia 6,131 313 10,436 325 10,752 245 2.6 16.9a
Vietnam 2,042 104 4,486 133 5,955 136 5.3 15.9
Peer economies
Angola 2,967 151 5,895 175 6,025 137 3.8 ..
Morocco 3,915 200 6,443 191 7,266 166 2.6 18.3
Nigeria 2,750 140 5,150 153 5,439 124 3.2 8.8
South Africa 9,177 468 12,029 357 12,260 280 1.4 13.4
Xinjiang Autonomous Region of China 1,728 88 7,563 224 11,537a 263a 8.05b 13.9
na is not applicable.
Source: Author’s calculation based on GIF methodology (Lin and Monga 2011) and World Bank World Development Indicators
database. Data on Xinjiang are based on Lin and Wang (2017a).
a. Data are for 2015. b. Average growth rate for 2001–16.
BOX�6.1�Measuring�revealed�comparative�advantage
Identifying existing comparative advantage is straightforward, as several established indicators can be used. One established in-dicator is revealed comparative advantage (RCA).
RCA is calculated as follows:
RCAij =
xij
xwj
Xit
Xwt
where xij and xwj are the values of country i’s exports of product j and world exports of product j, and where Xit and Xwt refer to the country’s total exports and world total exports. Thus, if RCA > 1, the country has a revealed comparative advantage in the product, and if RCA < 1, the country has a revealed comparative disadvantage in the product.

61
Iden
tify
ing
sect
ors
wit
h la
tent
com
para
tive
adv
anta
ge |
Aft
er T
wo
Dec
ades
of “
Solit
ude”
: Tar
gete
d St
rate
gies
for Q
uick
Eco
nom
ic W
ins
An analysis of comparative advantage of agricultural products in Sudan using RCA over 2000–13 reveals that Sudan has a comparative advantage in gum arabic (80 percent of world exports), cotton, and animal products (12 sub-sectors altogether; table 6.2).64 The analysis further showed that Sudan has the capability to produce and export other agricultural prod-ucts that may be competitive in the interna-tional market. A similar analysis of comparative advantage in producing gum arabic in West Kordofan State during 2010–15 also concluded that production is profitable and has a com-parative advantage, but the study called for reducing direct and indirect taxes on the com-modity to improve competitiveness.65
While Sudan exports many more products than the 12 shown in table 6.2, it is competitive
only in those 12. For example, even though crude petroleum is Sudan’s top export, ac-counting for 54 percent of exports ($3.09 bil-lion) in 2015, Sudan does not currently have a comparative advantage in this sector (though it may have a latent comparative advantage, which is discussed below). Sudan lost 75 per-cent of its oil revenues after the secession of South Sudan in 2011. Unless Sudan forms a close free trade relationship with South Sudan, the future of this industry, including oil pro-duction, refining, and exports of refined prod-ucts, looks bleak.
Sudan has a very strong comparative advan-tage in agriculture, animal husbandry, agro-pro-cessing, wool, and leather industries. All but three subsectors (gold, mineral tar and distillate products, and base metals) with a comparative
TABLE�6.2�Identified�subsectors�in�which�Sudan�has�a�revealed�comparative�advantage
Product�code Product�description
Sudan�2012
Sudan�2015 Products�at�the�four-digit�level�with�RCA�greater�than�1
0 Live animals except fish 88.213 68.552 Sheep and goats, live; bovine animals, live; other live animals
1 Meat and meat preparations 1.459 2.963
Beef, frozen; beef, chilled; meat of sheep/goat, chilled or frozen
6 Sugar, sugar preparations, honey 3.832 6.037
Raw sugars; molasses excluding sugar refined
8 Animal feed 1.734 1.988 Hay/fodder, green /dry; fodder bran, homogenized food preparations
21 Animal hide, skin, fur, raw 1.516 1.686
Sheepskin with wool, without wool, bovine hides; hide/skin
22 Oil seeds, oil fruits 12.402 31.983 Groundnuts; sesame seeds; oil seeds /oil fruits, not elsewhere specified
26 Textile fibers 2.350 3.134 Raw cotton, cotton, carded/combed
28 Base metal, ore
3.89 4.13
Aluminum ore, concentrate; base metal ore/concentrate, not elsewhere specified; waste/scrap cast iron; non-ferrous metal waste, not elsewhere specified
29 Crude animal or vegetable matter 6.883 0.341
Gum arabic/lac resins/balsams; pharmaceutical plants
33 Petroleum and petroleum products 0.530 6.514
Mineral tar /distillate products
61 Leather manufactures 6.432 2.764 Sheep leather with or without wool;goat/kid leather, no hair;
97 Gold 31.908 7.365 Gold non-monetary, excluding ore
Source: Calculated based on World Integrated Trade Solution (WITS) data (https://wits.worldbank.org/), for product classifications at
the one-, two-, and four-digit levels of the Standard International Trade Classification.
Note: RCA is revealed comparative advantage. Data for Sudan at the two-digit level are available only for 2012 and 2015. See annex
table A1.2 for the revealed comparative advantage of products at the four-digit level.

62
Iden
tify
ing
sect
ors
wit
h la
tent
com
para
tive
adv
anta
ge |
Aft
er T
wo
Dec
ades
of “
Solit
ude”
: Tar
gete
d St
rate
gies
for Q
uick
Eco
nom
ic W
ins
advantage are based on agriculture or animal husbandry. In particular, the country has huge potential in wool, leather, and processed leath-er products, such as travel bags and special garments.
Which sectors could Sudan potentially enter competitively?As labor and other costs are rising in emerging market economies, firms in those countries are seeking opportunities to relocate to lower cost countries. If Sudan has a latent comparative ad-vantage in any of these subsectors, with lower transaction and logistic costs, it can grasp this opportunity to attract foreign and domestic investors. In particular, as labor cost in China’s eastern coast regions is rising rapidly, large and medium-size firms in China are going global. They are looking for new destinations to re-locate their productive facilities, bringing with
them the needed capital, technology, tacit knowledge, and experience, as well as market channels. If Sudan can provide a stable and fa-vorable investment environment, with low cost land and good infrastructure in several special economic zones, it could attract multinational corporations from advanced economies as well as those from dynamic emerging market econ-omies such as China, India, Turkey, and others.
In step 1b, the sectors where RCAs are de-clining in comparator countries are identified by running regressions and picking sectors whose coefficients are negative and significant and by plotting changes in RCA over time. Sub-sectors with declining RCAs in at least two (of four) comparator countries and from which foreign enterprises are seeking to relocate to other countries with lower costs are then selected as subsectors that Sudan or other low-income countries could potentially enter (table 6.3).
However, because investors consider a country’s investment climate, as well as its geo-graphic location and accessibility to ports and roads, the results of step 1b must be checked against those of step 2, assessing domestic conditions (see chapter 7).
These preliminary results should be cor-roborated by examining current patterns of FDI inflows into Sudan and comparator coun-tries. Foreign investors can serve as a signal of a country’s existing and latent comparative ad-vantages, as in the case of Ethiopia, Tanzania, Uganda, and many others.
How does comparative advantage change over time?The experiences of catch-up countries re-veal changes in comparative advantage over time. Economists have used RCA analysis to explain the “flying geese” pattern of develop-ment (late developers can follow and emulate carefully selected lead economies, enabling
TABLE�6.3�Subsectors�in�which�revealed�comparative�advantage�is�declining�in�comparator�countries�and�which�Sudan�could�potentially�enter
Product
Declining�subsectors�(�=�1�) Total�(selected�if�2�
or�more)aChina Egypt Tunisia Vietnam
Apparel clothing /accessories 1 0 1 0 2
Cereals/cereal preparations 1 1 0 1 3
Crude fertilizer/minerals 1 0 0 1 2
Fish/shellfish/etc. 0 0 1 1 2
Footwear 1 0 1 1 3
Meat preparations 1 0 0 1 2
Metal ores, metal scrap 1 0 0 1 2
Miscellaneous food products 1 0 0 1 2
Oil seeds/oil fruits 1 0 0 1 2
Petroleum and petroleum products 0 0 1 1 2
Travel goods, handbags, etc. 1 1 0 0 2
Source: Calculated using methods and data described in technical annex 1.
Note: 1 = subsectors with a declining RCA, 0 = others.
a. Selected subsectors are those that Sudan could potentially enter (competing with
others) if there are declining RCAs in at least two countries.

63
Iden
tify
ing
sect
ors
wit
h la
tent
com
para
tive
adv
anta
ge |
Aft
er T
wo
Dec
ades
of “
Solit
ude”
: Tar
gete
d St
rate
gies
for Q
uick
Eco
nom
ic W
ins
them to catch up quicker) and global industrial relocation.
In early stages of development, latecomers are likely to engage in primary product ex-ports and labor-intensive light manufacturing. Consider Japan before World War II. It relied on labor-intensive industries, with textiles and other light industrial goods accounting for 60–75 percent of its exports. However, the trade pattern started to change after the war. By the 1960s, with a GDP per capita of about 35 percent that of the United States, Japan was targeting the more capital-intensive industries that were moving out of the United States. A rising share of labor in Japan’s manufacturing sector coincided with a declining share of labor in US manufacturing. In the 1970s, Japan’s RCA in labor-intensive industries such as clothing and footwear fell sharply, and its RCA in heavy manufacturing sectors was rising, notably in machinery and automobiles. In the 1980s and 1990s, just as the United States was upgrading its industries, Japan acquired market shares in home appliances, electronics, and computers. Similar flying-geese patterns have been ob-served in the Republic of Korea.66
China is now at the stage where western countries and Japan were in the 1970s and where the Republic of Korea; Singapore; and Taiwan, China were in the 1980s, with RCAs declining in some labor-intensive sectors (fig-ure 6.1). As labor-intensive industries matured, wages rose, and firms moved into more tech-nologically sophisticated industries in accord with the upgrading of their endowment struc-ture. China’s labor costs are rising rapidly, for example, from an average of $150 a month in 2005, to $500 a month in 2012, and to more than $600 a month in coastal regions in 2013 (rising 15 percent annually, plus an average an-nual currency appreciation of nearly 3 percent).
As labor costs rose, China’s revealed com-parative advantage declined in labor-intensive sectors such as garments/clothing, footwear,
handbags/travel goods, and textile, as well as in other resource-intensive sectors such as agri-culture, coal, and petroleum. At the same time, the country gained RCA in high tech, electron-ics, and machinery and equipment sectors.
Similar trends are evident in Egypt, Tunisia, and Vietnam (figure 6.2). This evidence corrob-orates the results shown in table 6.3 that there is international market space for low-income developing countries in subsectors where RCAs are declining in comparator countries. How-ever, low-income developing countries need to compete for investment and firms that are seeking new locations.
More and more enterprises in China and in other emerging market economies are facing pressure to seek low-cost locations in other countries, although this trend is not yet ap-parent in Tunisia or Vietnam. China alone has an estimated 124 million workers in man-ufacturing, most of them in labor-intensive sectors (85 million, compared with 9.7 mil-lion in Japan in 1960 and 2.3 million in the
FIGURE�6.1�China’s�revealed�comparative�advantage�is�declining�in�labor-intensive�export�sectors,�1984–2016Revealed comparative advantage
0
2
4
6
8
10
2016201020052000199519901984
Textile fibers, not manufactured
Travel goods, handbags,and similar products
Electric energy
Textile yarn, fabrics,made-up articles
Clothing
Footwear
Leather, leathermanufactures n.e.s.
Source: Calculated based on UN Comtrade data, SITC rev.1, two-digit.
Note: Revealed comparative advantage = share of an industry in the economy’s ex-
ports / its share in global export.
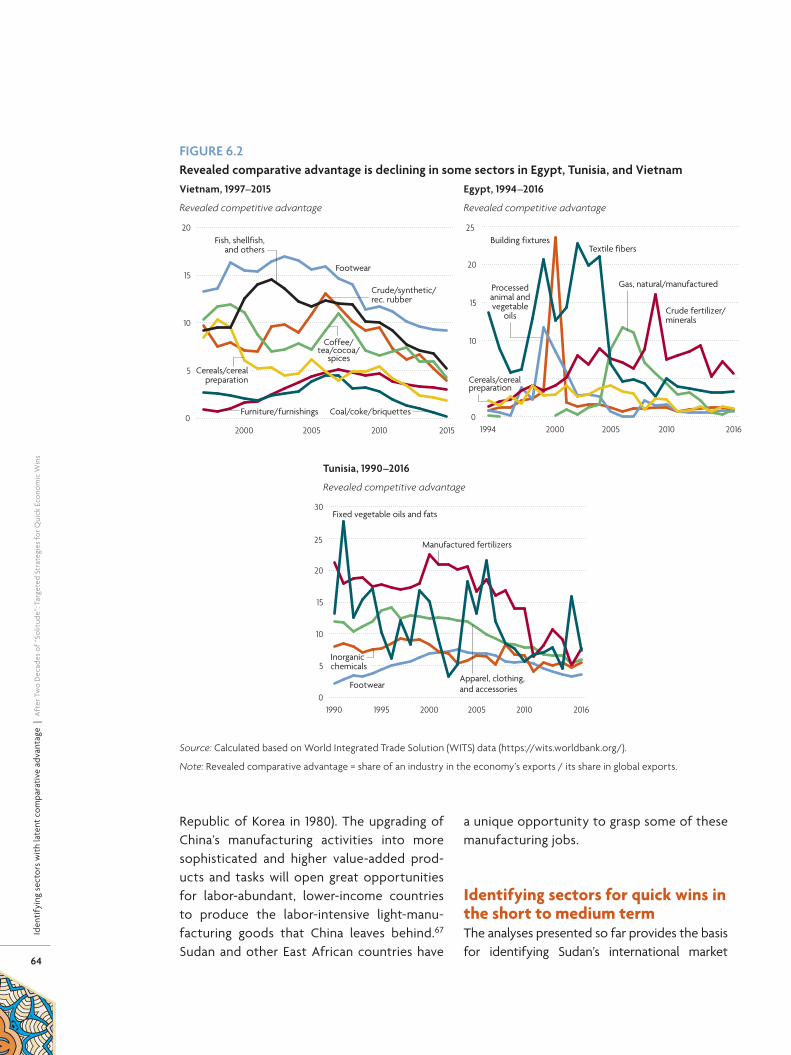
64
Iden
tify
ing
sect
ors
wit
h la
tent
com
para
tive
adv
anta
ge |
Aft
er T
wo
Dec
ades
of “
Solit
ude”
: Tar
gete
d St
rate
gies
for Q
uick
Eco
nom
ic W
ins
Republic of Korea in 1980). The upgrading of China’s manufacturing activities into more sophisticated and higher value-added prod-ucts and tasks will open great opportunities for labor-abundant, lower-income countries to produce the labor-intensive light-manu-facturing goods that China leaves behind.67 Sudan and other East African countries have
a unique opportunity to grasp some of these manufacturing jobs.
Identifying sectors for quick wins in the short to medium termThe analyses presented so far provides the basis for identifying Sudan’s international market
FIGURE�6.2�Revealed�comparative�advantage�is�declining�in�some�sectors�in�Egypt,�Tunisia,�and�VietnamVietnam,�1997–2015
Revealed competitive advantage
Fish, shellfish,and others
Coffee/tea/cocoa/
spices
Crude/synthetic/rec. rubber
Coal/coke/briquettesFurniture/furnishings
Footwear
0
5
10
15
20
2015201020052000
Cereals/cerealpreparation
Egypt,�1994–2016
Revealed competitive advantage
Crude fertilizer/minerals
Gas, natural/manufactured
Building fixturesTextile fibers
0
10
15
20
25
20162010200520001994
Processedanimal andvegetable
oils
Cereals/cerealpreparation
Tunisia,�1990–2016
Revealed competitive advantage
Apparel, clothing, and accessories
Manufactured fertilizers
Fixed vegetable oils and fats
Footwear0
5
10
15
20
25
30
201620102005200019951990
Inorganicchemicals
Source: Calculated based on World Integrated Trade Solution (WITS) data (https://wits.worldbank.org/).
Note: Revealed comparative advantage = share of an industry in the economy’s exports / its share in global exports.

65
Iden
tify
ing
sect
ors
wit
h la
tent
com
para
tive
adv
anta
ge |
Aft
er T
wo
Dec
ades
of “
Solit
ude”
: Tar
gete
d St
rate
gies
for Q
uick
Eco
nom
ic W
ins
opportunities and its latent comparative ad-vantage. The analyses must be complemented by an examination of major constraints and opportunities for the development of existing products and sectors. Four criteria are used to winnow down the list of identified subsectors:• Production requires low levels of capital,
and there is a significant domestic or region-al market.
• Domestic production does not require sig-nificant levels of power (electricity) or does not have high transport costs (no short-term need for substantial improvements in road and rail networks to move raw materials and output).
• Production in comparator countries is done by small and medium-size enterprises, which
shows the potential for job creation in Sudan.
• Sudan’s factor endowment is well suited for production — some elements of the supply chain are in place, RCA indices or export spe-cialization indicates potential, and labor skill requirements are low or easily transferable.
Priority subsectorsThe following industries/subsectors emerge as priorities in the short to medium term (1–5 years) and satisfy all four criteria (table 6.4):• Agriculture, animal husbandry, and
agri-business. Because there are thousands of products in these sectors, the specific products to be encouraged will depend on decisions made by firms in a self-discovery
TABLE�6.4�Priority�subsector�identification�using�the�four�criteria�for�identifying�subsectors�for�quick�wins�in�the�short�to�medium�term
Subsectors Criterion�1 Criterion�2 Criterion�3 Criterion�4 Decision
99 sectors from the standard WITS data. They are grouped in 12 rows by SITC code (1–99).
Production requires low level of capital and significant domestic or regional market
Domestic production does not require significant electricity or high transport costs
Production in comparator countries is done by small and medium enterprises
Sudan’s factor endowment is well-suited for production
Selected as priority sector or not
Agribusiness: Animal husbandry, meat preparation, dairy production, cereals and cereal production (code 0–4), sugar, coffee, animal feed (code 5–9), animal oil, processed vegetable oil (code 41–43)
Yes Yes Yes Yes Yes, existing RCA
Textile fibers, crude fertilizer, mineral and metal ores, scrap metal (code 25–29)
No (capital intensive) No (needs stable power)
No (large companies) No No
Petroleum and refined products, natural gas (code 32–34)
No (capital intensive) No (needs stable power)
No (large companies) No Depends on free trade with South Sudan
Chemicals, plastic, fertilizers, perfume, chemical materials/products (code 51–59)
No (capital intensive) No (needs stable power)
Some selected products
No No
Hide, skin, fur (code 11–24), leather manufactures, rubber, paper board (code 61–64)
Yes Yes Declining Yes Yes
Textile yarn, fabric, articles; iron and steel, non-ferrous metals (code 65–69)
No (capital intensive) No (needs stable power)
No, rising No No
Assembly operation of bicycles, other road vehicles, other machinery (code 71–79)
Yes (assembly only) Yes (assembly only) Yes Yes (assembly only) Yes (assembly only)
Apparel and clothing, travel goods, handbags (code 81–83)
Yes Yes Yes Yes Yes
Building fixtures (code 81–84) Yes Yes Yes Yes Yes
Footwear and accessories (code 85) Yes Yes Yes Yes Yes
Source: Based on steps 1a and 1b of the Growth Identification and Facilitation Framework and the four criteria described in the text.

66
Iden
tify
ing
sect
ors
wit
h la
tent
com
para
tive
adv
anta
ge |
Aft
er T
wo
Dec
ades
of “
Solit
ude”
: Tar
gete
d St
rate
gies
for Q
uick
Eco
nom
ic W
ins
process (see chapter 9). These sectors are Sudan’s current export focus and existing comparative advantage, with Sudan Kena-na Sugar as one example. The government should provide more support by establish-ing special agri-ecological zones (see chapter 10).
• Hides, skins, and leather value chain. Sudan is the second largest producer of livestock in Africa, after Ethiopia. Good natural pastures cover almost 24 million hectares, and the nomadic pastoral sector accounts for more than 90 percent of the huge animal popu-lation. Cattle, sheep, and goats are an im-portant capital asset and risk management tool for pastoralists and farmers in times of drought, and they are increasingly important in irrigated agricultural areas as well. Sudan is in a great position to develop the entire supply chain, from hides, skins, and leather to leather goods such as footwear and gar-ments. If the policies recommended in this report are implemented, this sector has the potential to create tens of thousands of jobs. Vietnam, Sudan’s main target country in this subsector, created 600,000 jobs in this sector.
• Clothing/garment sector. Exports are ex-panding in this sector, which has the poten-tial to create a large number of jobs. In just 10 years, Cambodia’s garment sector creat-ed 335,400 jobs. In Vietnam, the textile and garment sector employs 1 million workers. If Sudan can boost the sector’s growth rate to comparable levels, tens of thousands of jobs could potentially be created in the me-dium term.
• Assembly of farm tractors/machinery and motorcycles. At least two companies in Sudan assemble farm tractors, including Sutrac tractors operating under the DAL Group, and GIAD. Sutrac, a DAL Group Com-pany established in Sudan in 1952 as Sayer & Colley, represents Caterpillar, the world’s
leading manufacturer of machinery and en-gines for earthmoving, mining, and petro-leum industries; building and road construc-tion; electric power generation; materials handling; and farming applications. Sutrac has been involved mainly in servicing and supplying the large-scale industrial farming sector in Sudan. GIAD meets the country’s need for other agricultural equipment and machines. It uses modern production ma-chines and the comprehensive quality tech-nique in all its production. The company has a production line for Massey Ferguson trac-tors (MF 285–290) and GIAD tractors (GIAD 285), with a productive capacity of five units a day for a single shift. More such firms can be attracted and supported to assem-ble similar equipment, such as well drillers, tree planting drillers, solar water heaters, and solar equipment using complete knock-down kits.
• Building materials/fixtures and storage/logistic facilities. This sector has declined in Egypt, and there is huge demand for its products in Sudan and neighboring coun-tries. It is a labor–intensive sector that does not need high-skilled workers. Constructing a storage and logistic center near Khartoum would not be difficult. Several companies are operating in this sector, including El-barbary Building Materials, RAK Ceramics Sudanese Investment Co., and Ras al Elkhai-ma Sudanese Investment Co. Ltd. Elbarbary Group, established in 1906, has diversified its business and now operates in shipping, building materials, tire imports, lubricants, information technology products, automo-tives (both heavy and commercial), spare parts, transportation, warehousing, for-warding, finance, import of national strate-gic commodities, and export of Sudanese products. RAK manufactures and supplies tiles and related products in North Africa. The company was founded in 2004 and is

67
Iden
tify
ing
sect
ors
wit
h la
tent
com
para
tive
adv
anta
ge |
Aft
er T
wo
Dec
ades
of “
Solit
ude”
: Tar
gete
d St
rate
gies
for Q
uick
Eco
nom
ic W
ins
headquartered in Khartoum. Ras al Khaimah produces construction materials. A number of cement factories are also operating, in-cluding Berber, Atbara, Ahkam, and Rabak.
• Tourism and light manufacturing related to tourism. Sudan is one of the largest Arab nations. It is rich in history, dating back to
ancient Egypt and Nubia. Pyramids across Sudan attract tourists from Egypt, Jordan, Morocco, Syria, and other Arab countries and from Western countries as well. Sudan was ranked the eighth most popular Arab country to visit by the Council of Arab Eco-nomic Unity. Sudan also has many modern
BOX�6.2�Which�subsectors�create�greater�numbers�of�blue-collar�jobs?
The manufacturing sector is not monolithic. Industries vary in the extent to which they share five pro-de-velopment characteristics and in the number of jobs they create (see figure):• Low-skill labor-intensive tradables.• Commodity-based regional processing.• Capital intensive processing.• Medium-skill global innovators.• High-skill global innovators.
Industries in low-skill labor-intensive tradable ac-tivities, including textiles, garments, leather products, and furniture and manufacturing, employ a high share of blue-collar workers with high employment to out-put ratios. They are highly traded in international mar-kets. These industries also have the lowest output per worker. Light manufacturing, comprising goods such as apparel, toys, jewelry, and sports equipment, has typically required labor-intensive assembly and lim-ited fixed- capital investments. Such firms are often ready to move to new, lower labor cost locations when costs begin to rise.
Commodity-based regional processing includes food processing, wood products, paper products, basic metals, fabricated metal products, nonmetallic mineral products, and rubber and plastic products. These activities are closely linked to agriculture and mining. Output is typically less traded international-ly, either because the goods are bulky to transport or because they require proximity to raw materials (for example, for food processing industries). Among these sectors, food processing stands out for its high
share of total manufacturing jobs, second only to tex-tiles, garments, and leather products.
Capital-intensive regional processing, including chemical products and refined petroleum products, is more internationally traded but employs lower shares of blue-collar workers. Medium- and high-skill glob-al innovators, including manufacturers of transpor-tation equipment and other machinery, electronics, computing equipment, and pharmaceutical products, employ lower shares of blue-collar workers than the previous two categories.
Manufacturing subsectors with pro-development characteristics, 2013Average blue-collar share of total employment (percent)
0 20 40 60 8020
40
60
80
100
All other subsectors
Subsectors where labor productivity deviated significantly from others
Subsectors exhibiting greatest R&D intensity
Wood and wood products
Textiles, wearing apparel,and leather products
High-skill globalinnovators
Medium-skillglobalinnovators
Capital-intensiveregionalprocessing
Low-skilllabor-intensivetradables
Commodity-basedregional processing
Fabricated metalsproducts
Othernonmetallic
mineralproducts
Paper andpaper products;
publishingand printing
Food,beverage, and tobaccoproducts
Coke andrefined
petroleumproducts
Chemicals andchemical products
Electrical equipment
Basic metals
Rubberand plasticproducts
Machinery and equipment n.e.c.
Pharmaceutical products
Computing, electronicsand optical equipment
Transportation equipment
Furniture; manufacturing n.e.c.
Export value-to-output ratio (percent)
Source: Hallward-Driemeier and Nayyar 2017.

68
Iden
tify
ing
sect
ors
wit
h la
tent
com
para
tive
adv
anta
ge |
Aft
er T
wo
Dec
ades
of “
Solit
ude”
: Tar
gete
d St
rate
gies
for Q
uick
Eco
nom
ic W
ins
hotels including the five star Corinthia Hotel Khartoum. The government pledges $1 bil-lion a year to expand the tourism industry. Furthermore, Sudan has been known for its cotton production since the establishment of the Gezira scheme in the colonial era. There are vast numbers of producers of cot-ton and wool purses and other handicraft products in the main tourist areas such as the Marawe and Begrweya pyramids as well as in several historical sites, including Swakin and Omdurman.Some industries with good potential for
profitability and job creation are not listed as priority subsectors in Sudan because of their relatively large capital requirement, sophisti-cated technology, or demands for reliable elec-trical power, capital, and labor skills.
In sum, in the short to medium term (1–5 years), Sudan could benefit quickly if the gov-ernment concentrated support on these sub-sectors to achieve job creation.
Subsectors with pro-development characteristicsOnce priority subsectors have been identified, there are no guarantees of success. Success de-pends on many factors, including a country’s ability to respond to external demand, the na-ture of the value chain and the lead firm,68 the country’s commitment, the selection of sec-tors, the investment climate, and the policies in these sectors. A World Bank study presents some evidence on manufacturing subsectors that have the greatest potential for job cre-ation. Sixteen manufacturing subsectors were identified that can be grouped into categories based on the following five pro-development characteristics (see box 6.2):• Low-skill labor-intensive tradables.• Commodity-based regional processing.• Capital intensive processing.• Medium-skill global innovators.• High-skill global innovators.
For Sudan, a lower-middle-income country located far from the world’s largest markets and with a rapidly growing young, low-skill workforce and a weak human capital base, the most relevant subsectors are those in two of the five groups:• Low-skill labor-intensive tradables, includ-
ing garments and leather products, travel goods, and assembly of farm equipment and motorcycles, which requires large amounts of low-skilled labor.
• Commodity-based regional processing, es-pecially food processing, animal and vege-table oils, construction materials, and some building fixtures and other products.In this dynamic, globalized world, many busi-
nesses and investors are wary of entering into global supply chains of manufactures, especial-ly given the uncertainty introduced by modern technologies such as robotics and automation, 3-D printers, and artificial intelligence. But global value chains offer new opportunities for structural transformation in Africa. Countries can enter global value chains at a specific stage, usually at the assembly stage in manufactur-ing and commodity production in agriculture. Ideally this leads to opportunities to upgrade through knowledge transfers, product differ-entiation, and the addition of adjacent stages of the value chain.
Measures of trade in value added — as op-posed to traditional gross measures of trade — can provide insights into integration into global value chains and its benefits. Africa captures only a small share of global trade in value-added terms, but its overall integration into global value chain is high compared with other regions. However, a good part of that is forward integration of Africa’s commodity exports as inputs in foreign manufacturing, which creates relatively little additional value added in Africa. In terms of gains from global value chains, ex-port and productivity growth have been easier to achieve than employment growth.
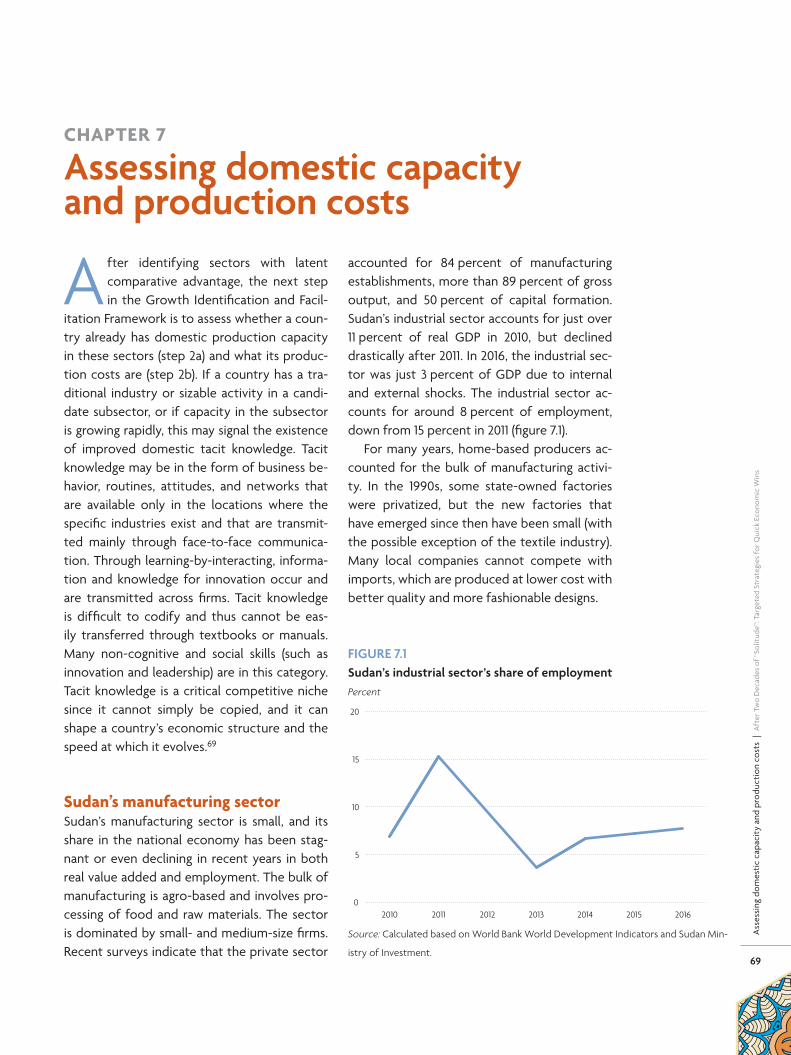
69
Ass
essi
ng d
omes
tic
capa
city
and
pro
duct
ion
cost
s |
Aft
er T
wo
Dec
ades
of “
Solit
ude”
: Tar
gete
d St
rate
gies
for Q
uick
Eco
nom
ic W
ins
A fter identifying sectors with latent comparative advantage, the next step in the Growth Identification and Facil-
itation Framework is to assess whether a coun-try already has domestic production capacity in these sectors (step 2a) and what its produc-tion costs are (step 2b). If a country has a tra-ditional industry or sizable activity in a candi-date subsector, or if capacity in the subsector is growing rapidly, this may signal the existence of improved domestic tacit knowledge. Tacit knowledge may be in the form of business be-havior, routines, attitudes, and networks that are available only in the locations where the specific industries exist and that are transmit-ted mainly through face-to-face communica-tion. Through learning-by-interacting, informa-tion and knowledge for innovation occur and are transmitted across firms. Tacit knowledge is difficult to codify and thus cannot be eas-ily transferred through textbooks or manuals. Many non-cognitive and social skills (such as innovation and leadership) are in this category. Tacit knowledge is a critical competitive niche since it cannot simply be copied, and it can shape a country’s economic structure and the speed at which it evolves.69
Sudan’s manufacturing sectorSudan’s manufacturing sector is small, and its share in the national economy has been stag-nant or even declining in recent years in both real value added and employment. The bulk of manufacturing is agro-based and involves pro-cessing of food and raw materials. The sector is dominated by small- and medium-size firms. Recent surveys indicate that the private sector
accounted for 84 percent of manufacturing establishments, more than 89 percent of gross output, and 50 percent of capital formation. Sudan’s industrial sector accounts for just over 11 percent of real GDP in 2010, but declined drastically after 2011. In 2016, the industrial sec-tor was just 3 percent of GDP due to internal and external shocks. The industrial sector ac-counts for around 8 percent of employment, down from 15 percent in 2011 (figure 7.1).
For many years, home-based producers ac-counted for the bulk of manufacturing activi-ty. In the 1990s, some state-owned factories were privatized, but the new factories that have emerged since then have been small (with the possible exception of the textile industry). Many local companies cannot compete with imports, which are produced at lower cost with better quality and more fashionable designs.
CHAPTER 7
Assessing�domestic�capacity�and�production�costs
FIGURE�7.1�Sudan’s�industrial�sector’s�share�of�employmentPercent
0
5
10
15
20
2016201520142013201220112010
Source: Calculated based on World Bank World Development Indicators and Sudan Min-
istry of Investment.

70
Ass
essi
ng d
omes
tic
capa
city
and
pro
duct
ion
cost
s |
Aft
er T
wo
Dec
ades
of “
Solit
ude”
: Tar
gete
d St
rate
gies
for Q
uick
Eco
nom
ic W
ins
The manufacturing industry depends main-ly on raw material from food and non-food crops, fisheries, and trees. The sugar industry is the most well-known component of the agro-food industry in Sudan, along with the wheat flour milling, bakery products, bever-ages, confections, canned foods, processed seeds, fruits and vegetables, spices, and edible oils. The manufacturing industry has been op-erating well below its production capacity be-cause of shortages of agricultural inputs, the
high cost of spare parts and energy, and the absence of efficient marketing chains between agriculture and manufacturing. Sudan also produces a range of leather products, from finished leather to the upper part of shoes, leather garments, and industrial gloves (see box 7.1 for a description of one leather goods producer). Among labor-intensive industries, clothing and footwear did not do well in the last decade due to internal conflicts and inter-national sanctions.
A review of options for the non-food in-dustry suggests that further development of a number of value chains based on increased private investment would contribute substan-tially to sustained strong growth in the decade ahead. The key value chains are as follows:• Textiles.• Ginning and spinning, yarn dyeing, weaving,
and knitting.• Clothing, including a wide range of garments.• Leather and skin tanning and processing and
leather goods.• Shoes and other footwear.
Foreign direct investment (FDI) in the gar-ment and leather industries has introduced better technologies and new tacit knowledge of production, management, and global mar-ket connections. Foreign investors who earlier negotiated land leases and utility connections and built their own factories are now consid-ered part of Sudan’s domestic capabilities for analyses of domestic capacity and production costs (table 7.1).
Sudan’s domestic capabilities in textiles, garments, leather, and leather products are at an incipient stage, and growth in the size and sophistication of these industries depends on steady inflows of capital and accumulation of tacit knowledge. The small size of the indus-tries and their moderate contributions to ex-ports also indicate that there are institutional and policy constraints that impede expansion, upgrading, and export.
BOX�7.1�Profile�of�a�local�leather�goods�producer
Khartoum Tannery Co. Ltd is the largest tannery in Sudan. Es-tablished in 2001, it employs 210 people. In addition to leath-er tanning, the company has established a workshop that produces leather goods. It specializes in crust leathers (leath-ers that have been tanned and dried but not yet dyed) and produces footwear, jackets, and belts. Khartoum Tannery is seeking cooperation in marketing and promoting its leather products in European markets and in new regional and other international markets. It recently established a garments and leather goods unit to expand its business.
TABLE�7.1�Foreign�direct�investment�in�Sudan’s�textiles�and�leather�industry,�1992–2015
IndustryNumber�of�
projectsCapital�
($�millions)Permanent�employees
Temporary�employees
Textiles 8 92 922 —
Share of total FDI (%) — — — —
Apparel, except fur 12 40 385 —
Share of total FDI (%) — — — —
Finished leather, leather products, and footwear 13 36 342 —
Share of total FDI (%) — — — —
— is not available. FDI is foreign direct investment.
Source: Sudan Ministry of Investment.

71
Ass
essi
ng d
omes
tic
capa
city
and
pro
duct
ion
cost
s |
Aft
er T
wo
Dec
ades
of “
Solit
ude”
: Tar
gete
d St
rate
gies
for Q
uick
Eco
nom
ic W
ins
Estimating direct production costsAfter determining whether a country has ca-pacity in identified sectors, the next step is to determine whether it is cost-effective to make the proposed products in Sudan. Production costs are a critical factor in investment deci-sions. Alongside security and political and so-cial stability, production costs are the most im-portant consideration when investors look for new opportunities in low-end, labor-intensive manufacturing. This review of production costs relies on available evidence and field interviews.
Sudan has relatively low labor costs, al-though detailed official data are not readily available by sector or industry. According to the Ministry of Investment, Sudan’s entry-lev-el monthly real wage in the industrial sector was $70 in 2016. While this is roughly one-tenth China’s averages and half Vietnam’s, it is high-er than Ethiopia’s and Kenya’s (table 7.2). To attract foreign and domestic investors, other policy support may be needed, including the removal of institutional constraints.
Easing institutional constraints to reduce costsTwo binding constraints were identified that could be alleviated in the medium run or ad-dressed gradually through partial solutions such as industrial parks and special economic zones (see chapter 10). These involve trade lo-gistics and customs clearance practices.
Trade logisticsOn the World Bank’s Logistics Performance Index (LPI), high-income economies domi-nate the top rankings and global and regional supply chains, while the 10 lowest performing economies are almost all among the low and lower income country groups.70 Nonetheless, the logistics performance of some developing countries transcends their per capita income.
Among the 10 strongest “over-performers” are China (which ranked 27 of 155 countries on lo-gistics), South Africa (28), Thailand (35), the Phil-ippines (44), India (47), Vietnam (53), and Uganda (66).71 Sudan can draw on the vast experiences of developed countries and these over-per-forming developing countries to enhance its own trade policies.
At a rank of 104, Sudan is behind China (27), India (35), Egypt (62), and Vietnam (64) on the Logistics Performance Index, largely because of constraints in trade logistics and customs services. In overall ranking in logistics, Sudan is neck-and-neck with Ethiopia, a landlocked country. Among comparator countries, only Tunisia (110) ranks lower than Sudan (table 7.3). This puts Sudan at a disadvantage in attract-ing foreign investment. Sudan has the fur-ther disadvantage of being located far from the world’s major markets in Europe, North America, and Asia, although it has the ad-vantage of being on a major shipping route. Sudan also has the advantage of 500 miles of coastline on the Red Sea, with its strategic
TABLE�7.2�Entry-level�blue�collar�labor�costs�in�Sudan�and�selected�countries
Country�and�year Entry-level�monthly�wage�or�minimum�wagea
Sudan $70
Bangladesh, 2013 $68 in garment industry and $19 in other sectors
China (southern coastal areas), 2017 $659b
India (varies by region and sector) $48–$116
Ethiopia, 2014 $35–$40 in garment and shoemaking industries
Kenya, 2014 $57 in rural areas and $139 in urban areas
Lesotho (varies by sector), 2014 $102–$112
Nigeria, 2011 $115
Turkey (gross wages), 2015 $479
Vietnam (varies by region), 2015 $101–$145
Source: Calculated based on data from en.wikipedia.org, Financial Times Confidential Re-
search (FTCR) China Labour Market Index for China, and staff estimates.
a. Except for China and Ethiopia, the official minimum monthly wage is used as a proxy for
entry-level labor costs.

72
Ass
essi
ng d
omes
tic
capa
city
and
pro
duct
ion
cost
s |
Aft
er T
wo
Dec
ades
of “
Solit
ude”
: Tar
gete
d St
rate
gies
for Q
uick
Eco
nom
ic W
ins
Port Sudan, while most of its neighbors are landlocked. However, the cost of shipping is still very high compared with costs in neigh-boring Egypt and Ethiopia (see table 7.3). This puts Sudan at a disadvantage in attracting foreign investment. On the plus side, how-ever, even though the trade distance is far-ther for Sudan, the lead time for Port Sudan
is shorter than that for Ethiopia. If further developed, Port Sudan could provide logis-tic services not only to Sudan but also to its landlocked neighbors such as Central African Republic, Chad, Niger, and South Sudan. Al-though the distance for exports and imports is greater than for Ethiopia, the lead time for Port Sudan is shorter.
TABLE�7.3�Performance�of�logistics�services�in�Sudan�and�comparator�countries
IndicatorSudan2014
Sudan��2016
China2016
Egypt2014
Ethiopia2014
India2016
Tunisia2014
Vietnam2016
Global ranking on Logistics Performance Index 2014 or 2016 153 103 27 62 104 35 110 64
Export time and cost (sea port or airport supply chain)
Distance (kilometers) 1,250 1,233 130 379 750 231 25 141
Lead time (days) 6 11 3 2 14 4 1 3
Cost ($) of a 40-foot dry container or a semi-trailer (total freight including agent fees, port, airport, and other charges) 5,000 — — 419 1,500 — 500 —
Export time and cost (land supply chain)
Distance (kilometers) 1250 1872 402 755 750 729 25 249
Lead time (days) 7 18 6 2 13 6 1 3
Cost ($) of a 40-foot dry container or a semi-trailer (total freight including agent fees, port, airport, and other charges) 5,000 — — 740 2,236 — 500 —
Import time and cost (sea port or airport supply chain)
Distance (kilometers) 2,000 924 187 426 750 322 25 102
Lead time (days) 5 12 5 3 13 5 2 3
Cost ($) of a 40-foot dry container or a semi-trailer (total freight including agent fees, port, airport, and other charges) 5,000 — — 665 1,500 — 866 —
Import time and cost (land supply chain)
Distance (kilometers) 2000 1673 649 673 750 473 25 230
Lead time (days) 6 16 9 2 11 6 3 3
Cost ($) of a 40-foot dry container or a semi-trailer (total freight including agent fees, port, airport, and other charges) 5,000 — — 875 2,739 — 1,000 —
Share of shipments meeting quality criteria (%) 92.50 67.90 71.64 66.79 40 68.70 57.45 57.38
Clearance time without physical inspection (days) 2 3 2 2 3 2 2 1
Clearance time with physical inspection (days) 3 5 3 6 2 3 4 3
Share of shipments receiving physical inspection (%) 75.00 34.14 9.68 24.07 75.00 21.90 61.24 16.71
Share of shipments receiving multiple inspections (%) 2.50 48.27 3.38 5.75 75.00 3.61 10.61 9.38
— is not available.
Source: The World Bank Logistics Performance Index (LPI) 2014 and 2016.
Note: The LPI includes six components: customs, infrastructure, international shipments, logistics competence, tracking and
tracing, and timeliness.

73
Ass
essi
ng d
omes
tic
capa
city
and
pro
duct
ion
cost
s |
Aft
er T
wo
Dec
ades
of “
Solit
ude”
: Tar
gete
d St
rate
gies
for Q
uick
Eco
nom
ic W
ins
Customs clearance practicesIn addition to production costs and logistics services, industrial manufacturing companies and their international buyers consider bor-der procedures as an important factor in in-vestment and location decisions. The Revised Kyoto Convention of the World Customs Or-ganization recognizes swift and predictable customs clearance as a prerequisite for nation-al prosperity and economic development. In a high-inflationary environment, fast border clearance is a much more effective incentive to exporters than fiscal incentives such as duty drawbacks. Customs control is a sovereign power, and duties and fees collected by the customs are an important source of govern-ment revenue.
In 2016, Sudan ranked 103 of 158 countries on the Logistics Performance Index (LPI)72 (see table 7.3), lagging behind all its neighbors ex-cept Chad and Eritrea. Its LPI deteriorated from 2.92 in 2007 to 2.53 in 2016 on a scale of 1, low, to 5, high. Sudan’s performance on LPI components shows considerable room for improvement: customs (2.23), infrastructure (2.20), international shipments (2.57), logistics competence (2.36), tracking and tracing (2.49), and timeliness (3.28).
Infrastructure developmentAcknowledging these weaknesses, the gov-ernment has invested heavily in infrastructure development since the early 2000s. Thanks to support from emerging market economies such as China, India, and Saudi Arabia, Sudan registered one of the fastest growth rates in electricity generation in Sub- Saharan Africa over 2004–14.73 For example, 85 percent of China’s development cooperation finance in Sudan was concentrated in electricity genera-tion and transmission. Power generation capac-ity more than tripled from about 1,000 mega-watts in 2005 to almost 4,000 megawatts in 2012. As a consequence, access to electricity is
higher in Khartoum than in Nairobi and several other capital cities in Africa (table 7.4).
The Merowe power project, at a cost of €1.2 billion, is a good example. Five regional de-velopment funds provided 47 percent of the funding, the government of Sudan provided 33 percent, and the China Export Import Bank provided 20 percent. Various power projects that are under construction or about to break ground have committed funding of $1,006 mil-lion. Over the longer term, Sudan has the po-tential to export hydropower if additional ca-pacities are developed and transmission links to other Nile Basin countries are strengthened.
Sudan has also made strides in other infra-structure sectors. Liberalization of the infor-mation and communication technology sector has attracted large amounts of private capital. Mobile phone penetration increased from less than 1 percent in 2000 to 74 percent in 2012. Recent connection to an undersea fiber-optic cable has expanded access, improved quality, and reduced cost.74 More than 700 kilome-ters of roads are under construction. In con-trast to the heavy financing of power, $13 mil-lion is being spent on ongoing rail projects. The private sector has funded most of the information and communication technology
TABLE�7.4�Access�to�infrastructure�in�selected�capital�cities�in�Sub-�Saharan�Africa�(percent�of�households�with�access)
City�(year) ElectricityImproved��
waterImproved�sanitation
Fixed-line�telephone
Maputo (2003) 28.8 82.8 48.8 5.2
Kampala (2006) 59.0 92.6 100.0 5.4
Dar es Salaam (2004)
59.8 81.1 55.6 43.4
Nairobi (2003) 71.4 93.3 82.9 44.4
Harare (2005) 86.3 99.2 98.4 17.5
Addis Ababa (2005) 96.9 99.9 71.8 46.1
Khartoum (2014) 82.2 86.9 85.4 3.0
Source: AfDB and UN Habitat 2010. The data for Khartoum were from an earlier edition.

74
Ass
essi
ng d
omes
tic
capa
city
and
pro
duct
ion
cost
s |
Aft
er T
wo
Dec
ades
of “
Solit
ude”
: Tar
gete
d St
rate
gies
for Q
uick
Eco
nom
ic W
ins
infrastructure and is rehabilitating some sec-tions of rail lines.
However, Sudan’s infrastructure develop-ment has had an almost exclusively nation-al focus.75 For example, while internal road corridors have been developed, there is lit-tle connectivity with neighbors. Sudan has a gateway to the sea through Port Sudan, but the port’s performance is severely hampered by long dwell times, high costs, and capacity constraints. Addressing Sudan’s infrastructure challenges will require sustained expenditures of almost $4.2 billion a year for a decade.76 Cur-rently, Sudan spends about $1.5 billion a year on infrastructure, $580 million of it lost each year to inefficiencies. Even if the inefficiencies were eliminated, Sudan would still face an in-frastructure funding gap of $2.7 billion a year. The gap could be reduced by half by choosing lower-cost water, sanitation, and road-surfacing
technologies and could be closed by increasing financing from the private sector and abroad.77
For the near and medium term, at least, the main challenges for infrastructure develop-ment are to improve access to quality services in water and transport, to mobilize the large amount of funding required for expansion and upgrade, and to expand national capacity to design, formulate, manage, and implement projects and programs.78
* * *
In sum, the analysis of domestic capacity and production costs does not change the target-ed sectors identified in step 1, as summarized in tables 6.3 and 6.4 in chapter 6. The next chap-ter looks at how to achieve quick wins, by rais-ing financing for development and identifying the kind of capital needed (patient capital).

75
Att
ract
ing
finan
cing
for e
cono
mic
dev
elop
men
t |
Aft
er T
wo
Dec
ades
of “
Solit
ude”
: Tar
gete
d St
rate
gies
for Q
uick
Eco
nom
ic W
ins
CHAPTER 8
Attracting�financing�for�economic�development
The international development com-munity and national governments are focusing on achieving the Sustainable
Development Goals by 2030 and combating climate change, as agreed by the Conference of Parties during the 2015 United Nations Cli-mate Change Conference in Paris (COP21, and the soon to be COP23 in Berlin). Achieving both objectives will require huge amounts of resources. Governments and multilateral de-velopment banks need to go well beyond aid to use all financial modes available (aid, trade, and investment) and introduce new modes to meet the challenges of eliminating poverty and shifting industrial structures toward green and emission-reducing development. These tasks are daunting. This chapter presents global fi-nancing options and then considers financing within Sudan under step 3 of the Growth Iden-tification and Facilitation Framework.
Sudan’s advantages as a member of international organizationsSudan’s membership in several internation-al organizations can also be leveraged by en-terprises in competitive industries to access finance. Sudan is a member of the World As-sociation of Investment Promotion Agencies, the Multilateral Investment Guarantee Agency, and the International Finance Corporation, the private sector investment arm of the World Bank Group, whose mission is to promote sus-tainable private sector investment in develop-ing countries in coordination with the Foreign Investment Advisory Services. These organiza-tions are all viable sources of finance for enter-prises in competitive industries in Sudan.
Sudan is also a member of the Islamic Devel-opment Bank, the Inter-Arab Investment Guar-antee, and the Agreement on Promotion and Guarantee of Investment among the member states of the Organization of the Islamic Con-ference. It is also a full member of the Com-mon Market for Eastern and Southern Africa and the Nile Basin Initiative. These member-ships help Sudan’s export-oriented enterpris-es to be more competitive in international markets.
New forms of development financingSome donor countries are constrained in ex-tending development aid by heavy debt bur-dens and slow growth in recent years. Conse-quently, development finance will need to “go beyond aid” to combine aid, trade, and invest-ment. Financing will come less from official de-velopment assistance79 and more from other official flows, including loans and investments from development banks, sovereign wealth funds, and new strategic investment funds in emerging market economies.80
Global leaders are looking to emerging mar-ket economies and developing countries to find new sources of development financing. Some of these countries have much higher sav-ings rates and thus will have higher investment rates over 2015–30. The share of developing countries (including China) in global investment is projected to overtake that of high-income countries over that period (figure 8.1). And much of the finance will come in the form of patient capital — long-term investment with a maturity of 10 years or more.

76
Att
ract
ing
finan
cing
for e
cono
mic
dev
elop
men
t |
Aft
er T
wo
Dec
ades
of “
Solit
ude”
: Tar
gete
d St
rate
gies
for Q
uick
Eco
nom
ic W
ins Patient capital
China and many East Asian economies rank high on long-term orientation.81 Justin Lin and Yan Wang propose the concept of “patient capital” to refer to capital that is invested in a long-term “relationship,” in which the investor is willing to take a stake in the host country’s development, aiming for a win-win.82 Owners of patient cap-ital are equity-like investors who are willing to invest money for as long as 10 years or more in the real sector or in unlisted infrastructure projects. And they are willing and able to take risks. Patient capital, unlike “impatient capital,” can be used to finance the huge infrastructure gaps in Africa and elsewhere.
Patient capital has several important charac-teristics:• It is highly dependent on the domestic
banking sector and on institutional investors that can turn the long-term savings of citi-zens into loanable funds. Therefore, Sudan and other developing countries should en-courage the development of commercial and investment banks, institutional investors such as sovereign wealth funds (Sudan has saved part of its resource rent from the oil
boom), pension funds, and strategic invest-ment funds.
• International multilateral financial institu-tions, regional development banks, and bi-lateral donor-funded development banks play critical roles in turning domestic pub-lic savings into international long-term de-velopment funds (a part of patient capital). Therefore, countries should support the es-tablishment of new institutions such as the Asian Infrastructure Investment Bank, the New Development Bank, Silk Road Funds, and other infrastructure funds, which are among the providers of patient capital.
• Patient capital is highly correlated with entrepreneurial capital and direct invest-ment from the private sector. Therefore, governments everywhere should improve the investment climate to attract foreign direct investment (FDI) and to encourage the private sector to invest directly in infra-structure (through public–private-partner-ships and other mechanisms). Among other ways to do this, they can establish special economic zones, eco-industrial parks, and eco-cities to improve conditions in the manufacturing sector.
How much patient capital has been invested in developing economies?External financing flows to developing econ-omies totaled $1.4 trillion in 2016. The largest share was from FDI (45 percent), followed by remittances (28 percent), official development assistance (12 percent), foreign portfolio flows (9 percent), and other investments (mainly bank lending; 6 percent) (figure 8.2).83 Of these flows, FDI is the most stable and resilient, while foreign portfolio flows are the most volatile, fluctuating greatly over the years.
Assuming that half of bank lending was long term (10 years or longer), the share of patient capital flows in 2016 would be around 60 percent of total external financing flows to
FIGURE�8.1�Shares�of�world�investment�from�developing�country�groups�will�overtake�shares�from�developed�countries�after�2015,�1965–2030Share of global investment (percent)
0
25
50
75
100
20302025202020152010200520001995199019851980197519701965
Developed countries
Developing countries, including China
Developing countries, excluding China
Source: World Bank, World Development Indicators.

77
Att
ract
ing
finan
cing
for e
cono
mic
dev
elop
men
t |
Aft
er T
wo
Dec
ades
of “
Solit
ude”
: Tar
gete
d St
rate
gies
for Q
uick
Eco
nom
ic W
ins
developing economies, for an estimated total of $840 billion.84 FDI, official development assistance, and half of bank loans are catego-rized as patient capital. It is assumed that most foreign portfolio investment is impatient (less than 10 years). Remittances may finance con-sumption or investment, but no information is available to distinguish the two.
Using patient capital to invest in infrastructurePatient capital plays an important role in infra-structure financing. Successful countries with a strong future orientation85 have better financed infrastructure. Other evidence of patient capi-tal can be seen in the rising number of sovereign wealth funds and government-sponsored stra-tegic investment funds established by countries including Kazakhstan, Malaysia, Mexico, Mo-rocco, Nigeria, Philippines, Senegal, South Afri-ca, and Vietnam.86 The number of multilateral strategic investment funds, including those for infrastructure, are rising as well. The World Bank recently established a new private sector investment window using International Devel-opment Association funding and implemented by the International Finance Corporation. In effect, this instrument is using public money to finance private equity (an approach that is simi-lar to what China has been doing), an innovative approach worth further consideration.
Sudan could identify the owners of patient capital and actively seek to attract it, includ-ing FDI, public–private partnerships, long-term lending from development banks, and equi-ty-like strategic investment funds. These equi-ty-like investors are willing to invest money for a long time and take more risks. Sudan could also benefit by seeking investment from green financing funds.
To attract patient capital, Sudan could consider:• Establishing special economic zones in the
area around Port Sudan and agri-ecological
zones to attract foreign and domestic firms in targeted subsectors to invest and settle in for the long haul (see chapter 10).
• Using a payment for ecoservices approach to combat desertification and to rehabili-tate damaged areas by developing fruit and vegetable products, herbal medicine plants, and other processed food (see box 8.1 for an example).
• In the medium to long term, developing large renewable energy plants such as solar energy plants combined with farming below the solar panels and establishing logistics centers for multinational corporations.Because this report focuses on the short
to medium term, it is beyond its scope to dis-cuss long term investment in infrastructure, such as in Port Sudan and the railway and road systems.
Combating desertification through eco-friendly zonesNearly two-thirds of the land in Sudan (64 per-cent) is in danger of desertification. With glob-al climate change and drought in Africa, it is critical for Sudan and neighboring countries seek green financing to combat the threat of desertification.
FIGURE�8.2�Composition�of�external�financing�flows�to�developing�economies,�$1.4�trillion�in�total,�2016
Remittances28%
Officialdevelopment
assistance12%
Portfolio investments9%
Other investments,including bank lending6%
Foreign directinvestment45%
Source: Calculated based on UNCTAD 2017, p.13.

78
Att
ract
ing
finan
cing
for e
cono
mic
dev
elop
men
t |
Aft
er T
wo
Dec
ades
of “
Solit
ude”
: Tar
gete
d St
rate
gies
for Q
uick
Eco
nom
ic W
ins
BOX�8.1�Combating�desertification�through�public–private�partnerships:�The�Kubuqi�business�model
The United Nations Environmental Program (UNEP) published a report on the Kubuqi business model, which has created wealth through eco-restoration in Ordos City, Inner Mongolia Autonomous Region. It is the first eco-wealth report published by a UN agency and the first case report recognizing China’s work in eco-restoration.
Spanning more than 118,000 square kilometers, the Kubuqi Desert is the seventh largest desert in China and was once a significant source of dust storms in northern China. However, for the last three decades, the Elion Group has been restoring degraded land to support local economic growth, such as the compa-ny’s licorice plantations, by adopting the public–pri-vate partnership (PPP) mode of cooperation and also engaging the local population.
The UNEP report, prepared from multiple surveys and field research over several years, reveals stunning statistics on the wealth created from Elion’s ecolog-ical restoration business. Total accountable wealth reached 500,863 million yuan ($72 billion). The resto-ration business has had big impacts in many ways, in-cluding poverty alleviation; per capita annual income rose from 747 yuan to 17,000 yuan (an average annual increase of 11.5 percent over the survey period) for a population of 100,000 people, with Elion creating one million job opportunities.
Data from a social survey show that Elion con-tributed about a third of the annual growth in local incomes of 8.4 billion yuan. The company also devel-oped 243 patented technologies that cut reforesta-tion costs by 2 billion yuan. Elion also reclaimed and is currently restoring 4,475 square kilometers of land, sequestered 14.5 million tons of carbon, produced 18.3 million tons of oxygen, improved the habitats for plants and animals, and established 5,391 square kilo-meters of windbreaks.
UNEP Executive Director Erik Solheim, speaking at a press conference to launch the report, said that the Kubuqi business model is a role model for China and the world in fighting desertification. “The desert is not seen as a problem, but an opportunity for change,” he said. “[The Kubuqi business model] can lift peo-ple out of poverty, provide prosperity, develop the place while at the same time taking care of the desert and making it greener. This is such a fantastic result.” The Kubuqi model may not be completely transfer-able to other countries experiencing desertification, but they could learn and draw on its experiences and technologies.
Wang Wenbiao, chair of Elion Group, said the Kubuqi business model was about combining envi-ronmental protection with wealth making, combining ecology with industry, and combining enterprise de-velopment with combating the expansion of deserts. “Through the PPP partnership mode, the environment is improved, enterprise profits, and overall develop-ment becomes sustainable,” Wang said.

79
Att
ract
ing
finan
cing
for e
cono
mic
dev
elop
men
t |
Aft
er T
wo
Dec
ades
of “
Solit
ude”
: Tar
gete
d St
rate
gies
for Q
uick
Eco
nom
ic W
ins
BOX�8.1�(CONTINUED)�Combating�desertification�through�public–private�partnerships:�The�Kubuqi�business�model
The Kubuqi model has become a byword for Chi-na’s desertification control efforts. To promote and share the experience of combating desertification, the Kubuqi International Desert Forum was estab-lished in 2007. It has been held five times since then, with the support of governments at all levels, the United Nations, and the UN Convention to Com-bat Desertification Secretariat. More than 2,000 political leaders, experts, and ecological entrepre-neurs from around the world have participated in field trips, professional exchanges, and experience sharing.
Source: UNEP 2017; Zhang 2017.

81
Scal
ing
up s
elf-
disc
over
y by
priv
ate
firm
s |
Aft
er T
wo
Dec
ades
of “
Solit
ude”
: Tar
gete
d St
rate
gies
for Q
uick
Eco
nom
ic W
ins
CHAPTER 9
Scaling�up�self-discovery�by�private�firms
In addition to the industries identified in step 1, the government needs to pay atten-tion to spontaneous self-discovery by pri-
vate enterprises and support the scaling up of successful private innovation in new industries (step 4 of the Growth Identification and Facili-tation Framework). This is because every indus-try requires some highly specific inputs, such as knowledge, physical assets, intermediate inputs, and labor skills. The existence of some private firms in the industry indicates that the economy possesses at least some of those cru-cial inputs.
Examples of successful self-discovery by private firms in other countriesGovernments can support industries where the private sector is already active and where successful self-discovery has taken place, helping them to scale up. In Nigeria, for exam-ple, successful self-discovery has taken place in sectors including light manufacturing, food processing, wholesale and retail, construction and car parts, meat and poultry, oil palm, and cocoa. While none of these industries yet produces for export, all of them have signifi-cant employment and growth potential and could be upgraded for exports. Or consider the case of suitcases. Production of suitcases has recently started In Nigeria and is expand-ing rapidly, with 60 percent of the required parts being produced domestically (allowing unit costs to plummet) and domestic pro-duction meeting 50 percent of domestic de-mand. A further area of successful self-discov-ery is TV assembly, which began as recently
as December 2010. Both areas of production could be further rapidly expanded, including for exports, if the government provided assis-tance toward scaling up, e.g., through better access to finance.
Similarly, when local firms in Bangladesh, China, Japan, and the Republic of Korea had no historical knowledge in an industry in which some successful firms were beginning to emerge, the state often attracted foreign di-rect investment and promoted joint ventures. After China’s transition to a market economy in the 1980s, the government invited foreign direct investment (FDI) from Hong Kong China, Taiwan China, Korea, and Japan. Bangladesh’s vi-brant garment industry started with FDI from Daiwoo, a Korean manufacturer, in the 1970s. After a few years, enough knowledge transfer had taken place that production was expanding — the FDI had served as a sort of incubator. Garment plants mushroomed in Bangladesh, and most of them could be traced back to that first Korean firm.87
India’s information technology (IT) indus-try is another example. Indian professionals in Silicon Valley helped Indian companies take advantage of expanding opportunities for out-sourced IT work in the 1980s. Once the poten-tial of software exports was demonstrated, the Indian government helped build a high-speed data-communications infrastructure that al-lowed many Indians in the diaspora to return home and set up offshore sites for U.S. clients. The Indian software industry grew more than 30 percent annually for 20 years, with 2008 ex-ports close to $60 billion.88
Chile’s change from a negligible wine ex-porter to the world’s fifth largest exporter in

82
Scal
ing
up s
elf-
disc
over
y by
priv
ate
firm
s |
Aft
er T
wo
Dec
ades
of “
Solit
ude”
: Tar
gete
d St
rate
gies
for Q
uick
Eco
nom
ic W
ins
the 1970s benefited greatly from the govern-ment’s programs to disseminate foreign tech-nology to local farmers and vineyards to im-prove the quality and promote Chilean wine abroad through the Export Promotion Office, ProChile, to change the foreign consumer’s perception of Chilean wine.89
Support by the government of SudanThe government of Sudan also encourages and supports FDI for emerging industries, prais-ing its constructive effect on the economy through added technological, managerial, and financial wealth. In addition, the government is well positioned to support competitive in-dustries through an enhanced infrastructure program in line with its energy master plan, which seeks to boost access to energy from 35 percent to about 60 percent by 2030. Sudan has also recognized the value of public–pri-vate partnerships to finance firms in young industries.
Public–private partnershipsSudan has established a public–private part-nership unit in the Ministry of Finance and Economic Planning. Legislation in 2016 called for improving the private sector operational environment and investment climate and main-taining long-term macroeconomic stability. A public–private dialogue forum has been estab-lished under the chairmanship of the vice pres-ident to promote private sector led–growth as laid out in the Economic Reform Program 2017–19. The program seeks to create the conditions for peace and security through sustainable and inclusive growth with a focus on macro-economic stability; value chain development in the productive sectors, especially agriculture, with an enhanced role for the private sector in creating jobs; and reducing poverty and in-equality by improving access to basic social
services. It ascribes 83 percent of economic ac-tivities to the private sector.
National Agency for Insurance and Finance of ExportsIn 2005, the government established the Na-tional Agency for Insurance and Finance of Ex-ports as an independent legal entity to provide support to emerging, export-oriented small and medium-scale enterprises and promote exports. Shareholders of the agency include the Ministry of Finance and Economic Planning, the Central Bank of Sudan, commercial banks, and insurance companies.
The agency’s board of directors is respon-sible for formulating policies and regulations; its chair is elected by the members. In addi-tion, its governing structure includes a gen-eral manager, two members representing commercial bank shareholders, two members representing insurance company sharehold-ers, one member representing the Ministry of Finance and Economic Planning, one member representing the Ministry of Trade, one mem-ber representing the Central Bank of Sudan, and two members with expertise in the agen-cy’s activities.
It aims to become a leading agency in insur-ing and reinsuring export credits and providing finance, guarantees, and promotional support to enhance the competitiveness of Sudan’s ex-ports, especially non-oil exports. Its objectives include the following:• Insure and reinsure export credits to en-
hance the competitiveness, volume, and value of Sudan’s exports.
• Conduct market research and studies on Sudan’s products and services in foreign markets.
• Promote Sudan’s exports globally.• Provide short- and medium-term finance
and guarantees and pre- and post-shipping finance for exports of goods, services, and intellectual property.
83
Scal
ing
up s
elf-
disc
over
y by
priv
ate
firm
s |
Aft
er T
wo
Dec
ades
of “
Solit
ude”
: Tar
gete
d St
rate
gies
for Q
uick
Eco
nom
ic W
ins
• Provide short- and medium-term finance to firms and projects that produce export-ori-ented goods, to expand their capacity.
• Finance the import needs of export-orient-ed goods and raw materials.The agency’s resources come from the Cen-
tral Bank. The bank invests the resources in Is-lamic bonds, which serve as insurance in case foreign importers default on paying the ex-porters. The agency finances exports, including animal resources, seeds, and others, through syndication.
The services offered by the agency contribute to:• Enhancing the competitiveness of Sudan’s
exports.• Assisting in providing better and diverse
payment terms and facilities for foreign buyers.
• Transferring risks (commercial and non-com-mercial risks) to the agency.
• Working with banks to provide financial re-sources to export sectors.
• Developing businesses in addition to in-creasing and diversifying exports.The agency’s major challenge is access to fi-
nance. The Central Bank, which is supposed to provide the financing, is primarily concerned with macroeconomic stability and insists that
exporters provide collateral, which few have. The agency’s export promotion arm does only training and capacity building. The follow-ing recommendations could make the agency more effective:• Move the agency under the Ministry of Fi-
nance instead of the Central Bank, and place its promotional arm under the Ministry of Finance and Economic Planning.
• Separate financing and insurance from promotion.
• Give the private sector a seat on the board of directors.
• Set up an export-import bank to finance the operations of importers and exporters.
• Bring financing support for different sectors under a single ministry, such as the Minis-try of Finance and Economic Planning, to streamline operations. Right now, various ministries (Industry, Agriculture and Animal Resources) provide funds in their respective areas, but these facilities are fragmented.Support, from infrastructure provision to
training and capacity building and access to finance, should be merit-based and provided within a sound and transparent policy frame-work to prevent capture by vested interest groups.


85
Reco
gniz
ing
the
pow
er o
f ind
ustr
ial p
arks
| A
fter
Tw
o D
ecad
es o
f “So
litud
e”: T
arge
ted
Stra
tegi
es fo
r Qui
ck E
cono
mic
Win
s
CHAPTER 10
Recognizing�the�power�of�industrial�parks�and�providing�limited�incentives
Governments that are unable to quickly implement the economy-wide reforms needed to create a conducive environ-
ment for industry growth and expansion, be-cause of budget and capacity constraints, may try to create a preferential environment on a smaller scale by setting up industrial parks or special economic zones and by introducing in-centives that compensate for negative external-ities. Thus, step 5 in the Growth Identification and Facilitation Framework is to recognize the power of industrial parks and special economic zones in countries with poor infrastructure and an unfriendly business environment, while step 6 focuses on providing limited incentives to in-dustries in sectors identified as having latent comparative advantage (see chapter 6).
Recognizing the power of industrial parks and export processing zonesThe binding constraints to trade in Sudan relate to trade logistics and custom services, as rec-ognized by industrial manufacturing companies and their international buyers. Swift and pre-dictable customs clearance is a priority for na-tional prosperity and economic development. In a high-inflationary environment, fast border clearance is an especially effective incentive for exporters. The government may set up spe-cial economic zones or industrial parks to over-come institutional, policy, and infrastructure barriers to firm entry and foreign investment. Establishing industrial parks or zones can also facilitate the formation of industrial clusters, which can reduce production and transaction costs.
Facilitating trade and economic developmentThe government of Sudan’s support to private enterprises will be especially catalytic consider-ing Sudan’s resource endowments, particularly its vast tracts of arable land (1.13 million square kilometers), coupled with the opportunities arising with the lifting of US trade sanctions and the improved national policy environment. The easing of sanctions is expected to help Sudan finalize negotiations on an Everything But Arms trade agreement with the European Union and facilitate accession to the World Trade Organization, which should significantly benefit competitive industries.
In addition, Sudan’s 2013 Investment Policy focuses on simplification of trade procedures, tax and customs exemptions for inputs used in production, and relaxation of restriction on repatriating profits. There is no discrimination between local and foreign invested capital. In-vestors are guaranteed against nationalization or expropriation of their projects and confis-cation or sequestration of profits. Investors are also buffered from fluctuations in ex-change rates by rules allowing them to trans-fer employee savings, re-export machinery and equipment, and repatriate profits at the market rate at the time of deposit irrespective of the current value of the Sudanese pound. Industri-al projects are subject to a 10 percent tax on business profits and enjoy full exemption from custom duties on capital goods.
In addition, the government’s Roadmap 2017–21 offers a common vision for trade fa-cilitation stakeholders in the public and pri-vate sectors, to support the continuity of re-form policies over time and to ensure that all

86
Reco
gniz
ing
the
pow
er o
f ind
ustr
ial p
arks
| A
fter
Tw
o D
ecad
es o
f “So
litud
e”: T
arge
ted
Stra
tegi
es fo
r Qui
ck E
cono
mic
Win
s
stakeholders are moving in the same direction. International donors can use the Roadmap as a reference point when providing financial and technical assistance to trade facilitation projects. If implemented, Roadmap measures would reduce the time needed for imports and exports by 40 percent and remove unneces-sary costs for traders, leading to an estimated 25 percent increase in export volume by the end of 2021.
Establishing special economic zonesFor a country like Sudan that is facing logis-tics constraints, establishing special economic zones or industrial parks is one way to over-come barriers to firm entry and foreign direct investment (FDI) and encourage industrial clus-ters. Special economic zones have often been used effectively by latecomer developers (such as Ireland, China, the Republic of Korea, Mau-ritius, and Taiwan, China) to emulate leading countries and even catch up with them in the race to economic prosperity. When economy- wide barriers to business start-up and expan-sion remain, special economic zones can pro-vide policy incentives and infrastructure in specific locations to firms that make it easier to open a business, attract FDI, create jobs, expand and diversify exports, increase foreign exchange earnings, and even serve as “experi-mental laboratories” for new pricing, financial, and labor policies.90 The expectation is that the knowledge spillovers from these activities will eventually result in broader private sector development, increased productivity, and sus-tained growth and other benefits for the entire economy.
In 1995, the government established two special economic zones: one at the Red Sea coast in Port Sudan and the other at Garri. The Duty-Free Zones and Shops Act of 2009 amended the original legislation. The zone on the Red Sea coast, with a total area of 26 square kilometers, is located between Port
Sudan and Port Sawakin, 38 kilometers south of Port Sudan and 17 kilometers south of Port Sudan International Airport. The zone at Garri, which is about 26 square kilometers, is 70 ki-lometers west of the Sudanese oil refiner in Khartoum. Plans are underway to establish new zones in Agreen, Merowe Kassala, Kosti, Gala-bat, Genenah, and Nyala. The Sudanese Free Zones and Markets Co. Ltd. manages the free trade zones and infrastructure development areas. It also arranges for trade shows and fairs.
The objectives of these special zones are to:• Increase national income and foreign ex-
change earnings by promoting exports of manufactured and semi-manufactured goods
• Diversify the export base and export markets.
• Facilitate the transfer of technology, man-ufacturing, storage, and marketing informa-tion and skills to other entrepreneurs and enterprises in Sudan.
• Attract national and foreign capital and de-ploy them in investment activities.The 1994 Free Zones and Free Markets Law
1994 conferred the following incentives and benefits on business activities in the zones:• 100 percent ownership.• 100 percent repatriation of capital and
profits.• No personal income tax or corporate in-
come tax.• No currency restrictions.• No restrictions on staff recruitment.
In addition, the Duty-Free Zones and Shops Regulations of 2013 applied the following guar-antees to the zones:• Freedom of projects from nationalization,
seizure, confiscation, or appropriation, and freedom of funds from confiscation, freez-es, or seizure unless by judicial order.
• Freedom of re-transmission of the invest-ed capital in case of non-execution of the project or its liquidation and disposal of the

87
Reco
gniz
ing
the
pow
er o
f ind
ustr
ial p
arks
| A
fter
Tw
o D
ecad
es o
f “So
litud
e”: T
arge
ted
Stra
tegi
es fo
r Qui
ck E
cono
mic
Win
s
funds in any provided that all obligations have been satisfied.
• Freedom of re-export of machinery, equip-ment, goods, devices, means of transport, and other material imported for the proj-ect provided that all obligations have been satisfied.
• Freedom from undue exchange rate risk, with funds invested in the project specified in foreign currency and its components val-ued and registered in one of the banks li-censed to work inside the zone.There are 2,700 registered companies with
3,000 permanent employees in the Garri Free Zone and 1,500 registered companies with 400 permanent employees in the Red Sea Free Zone. Overall, the experience of these zones has not been very encouraging. The main challenge facing the zones is lack of coordination among entities, including the Department of Customs. Other challenges include:• Poor governance and regulatory environ-
ment, including ease of doing business.• Poor business environment — including lack
of a one-stop shop where businesses can get all the services they need in one place.
• Inefficient zone management arrangements.• Unreliable utilities infrastructure — including
power supply problems.• Poor quality transport infrastructure, in-
cluding port/airport capacity.Several steps could be taken to upgrade the
functioning of the special economic zones:• Improving the quality of inputs and prod-
ucts to promote competitive industries.• Modernizing and expanding industrial
infrastructure.• Adopting investment policies that encour-
age production and productivity in compet-itive industries.
• Concentrating on mass industries rather than on small industries (adopting the “Big Push” approach).
• Offering financing on concessionary terms for competitive industries.
• Adopting an industrial cluster model for the zones that includes producers, import-ers, marketing channels, centers of finance, technical assistance, and producers of com-plementary products to improve value added, reduce costs, and increase quality.
• Adopting production strategies that take into account the demand and supply side elements.
• Scaling up infrastructure investments.• Improving the business climate.
Providing limited incentives to industries having a latent comparative advantageStep 6 in the Growth Identification and Facili-tation Framework focuses on providing limited incentives to industries in sectors identified as having latent comparative advantage (see chap-ter 6). Policy makers may consider supporting pioneer firms in those industries with limited and time-bound tax incentives, co-financing for investments, or access to foreign exchange. However, incentives should be limited in size and extent and time-bound to avoid corrup-tion and rent seeking. Monopoly rents, high tariffs, and other distortions should be avoid-ed.91 The award of incentives should be open, transparent, and merit based and overseen by an independent panel of experts.
There are several reasons why the govern-ment should limit the amount and duration of subsidies to private firms that are already engaged in competitive industries.92 The main reason is that excessive incentives will not cre-ate optimal business conditions for Sudanese firms to reach their full potential. Rather, they lead to contentious issues of coordination and externalities faced by firms engaged in the in-dustries that are consistent with the country’s comparative advantage. They also impede
88
Reco
gniz
ing
the
pow
er o
f ind
ustr
ial p
arks
| A
fter
Tw
o D
ecad
es o
f “So
litud
e”: T
arge
ted
Stra
tegi
es fo
r Qui
ck E
cono
mic
Win
s
new industries in the necessary aligning with the country’s comparative advantage so that its factor costs of production and transaction costs can be at the lowest level possible.
In addition to the incentives offered in ex-port processing zones, the government offers various tax exemptions and subsidies. While it may make sense in theory to provide tax incen-tives and subsidies to competitive industries, in Sudan’s case they have led to inefficien-cies, rent seeking, and corruption. For exam-ple, Sudan subsidizes gasoline and diesel fuel, which has led to fuel smuggling into nearby markets with higher prices. Similarly, compet-itive industries in the agriculture sector enjoy indirect support in the form of subsidies and tax exemptions on agricultural inputs. To keep prices low, there are no taxes on raw agricultur-al products, no export taxes on raw agricultural commodities, no custom duties on exports of agricultural commodities, and no credit ceil-ing, and there is a maximum 3 percent duty
on imported inputs. As a consequence, DAL Group, one of the largest business entities in Sudan, which has been importing wheat at the subsidized exchange rate, now has a virtual mo-nopoly enabling it to earn enormous profits. Similarly, the sugar and edible oil industries tend to be protected against foreign compe-tition. Furthermore, a lack of transparency in Sudan’s tax administration has resulted in com-panies engaging in unethical practices, such as bribery and political influence.93
Conflict of interest is another pitfall, and party affiliations and political patronage tend to override the national interest. A substantial number of civil servants own companies that are engaged in business activities with the gov-ernment and that take advantage of subsidies and tax exemptions. It is difficult to hold these government employees accountable since their companies are never audited. Government rev-enue suffers as a consequence, and respect for government lessens.
89
Not
es a
nd re
fere
nces
| A
fter
Tw
o D
ecad
es o
f “So
litud
e”: T
arge
ted
Stra
tegi
es fo
r Qui
ck E
cono
mic
Win
s
Notes60. Schultze 1983.
61. Lin and Monga 2011.
62. Xinjiang is surrounded by mountains in the north and
west and deserts in the middle with less than 10 per-
cent of land suitable for human habitation. The major
religion in Xinjiang is Islam among the Uyghurs and
the Hui Chinese minority.
63. This definition was developed by Balassa (1965).
64. Elryah 2015. These products were recently consid-
ered by the Central Bank as the main exports for Su-
dan’s Three-Year Development Program for 2012–14.
65. Yasseen and Ali 2016.
66. Chandra, Lin, and Wang 2013.
67. Lin 2012d; Chandra, Lin, and Wang 2013.
68. AfDB 2014.
69. Hausmann 2013.
70. Monga and Wang 2012.
71. World Bank Logistics Performance Index 2016.
72. The Logistics Performance Index (LPI) is a measure
of the extent of trade facilitation as an interactive
benchmarking tool created to help countries identify
the challenges and opportunities they face in their
performance on trade logistics and what they can do
to improve their performance. The LPI components
include customs, infrastructure, international ship-
ments, logistics competence, tracking and tracing,
and timeliness.
73. National Energy Research Center, Khartoum, Sudan.
74. AfDB 2016b.
75. Ranganathan Briceño-Garmendia 2011; World Bank
2009.
76. Ranganathan and Briceño-Garmendia 2011.
77. AfDB 2015.
78. AfDB 2016b.
79. According to the OECD definition, ODA includes
grants or loans undertaken by the official sector,
with promoting economic development and welfare
as the main objective, and are concessional in char-
acter and with a grant element of at least 25 per-
cent (calculated at a discount rate of 10 percent).
See www.oecd.org/dac/stats/officialdevelopment
assistancedefinitionandcoverage.htm. Lin and
Wang (2014; 2017a) suggested an expansion of the
definition.
80. Lin and Wang 2017a.
81. Hofstede et al. 1990.
82. Lin and Wang 2017b.
83. UNCTAD 2017.
84. Lin and Wang 2017a. Admittedly, these assumptions
are strong, and these estimates rough. Future studies
using micro data are needed for developing the exact
measure of patient capital flows.
85. Commission on Growth and Development 2008.
86. Halland et al. 2016.
87. Mottaleb and Sonobe 2009; Rhee and Belot 1990.
88. Bhatnagar 1997.
89. Benavente 2006.
90. Monga and Wang 2012.
91. Monga and Wang 2012.
92. Lin 2012a.
93. U4 Anti-Corruption Resource Centre 2012.
PART 2
Notes�and�references
ReferencesAfDB (African Development Bank). 2014. African Economic
Outlook 2014: Global Value Chains and Africa’s Indus-
trialization. Abidjan: Côte d’Ivoire.
———. 2015. African Economic Outlook 2015: Region-
al Development and Spatial Inclusion. Abidjan: Côte
d’Ivoire.
———. 2016a. “Sudan Country Note.” Abidjan: Côte
d’Ivoire.
———. 2016b. “Private Sector-Led Economic Diversifica-
tion and Development in Sudan.” African Development
Bank, Eastern Africa Regional Resource Centre, Nairobi.

90
Not
es a
nd re
fere
nces
| A
fter
Tw
o D
ecad
es o
f “So
litud
e”: T
arge
ted
Stra
tegi
es fo
r Qui
ck E
cono
mic
Win
s
AfDB and UN-Habitat. 2010. The State of African Cities.
Nairobi, Kenya.
Balassa, Bela. 1965. “Trade Liberalization and Revealed
Comparative Advantage.” Manchester School of Eco-
nomic and Social Studies 33: 99–123.
Benavente, J. M. 2006. “The role of research and innovation
in promoting productivity in Chile.” Economics of Inno-
vation and New Technology 15 (4–5): 301–15.
Bhatnagar, S. C. 1997. “The Indian software industry: moving
towards maturity.” Journal of Information Technology
12 (4): 277–88.
Chandra, V., J.Y. Lin, and Y. Wang. 2013. “Leading Dragon
Phenomenon: New Opportunities for Catch-up in
Low- Income Countries.” Asian Development Review 30
(1): 52–84.
Commission on Growth and Development. 2008. The
Growth Report: Strategies for Sustained Growth and
Inclusive Development. Washington, DC: World Bank.
Elryah, Y. 2015. “Back to the Agriculture: The Development
of the Comparative Advantage of Sudan’s Commodi-
ties.” Journal of Finance and Economics 3 (1): 1–5.
Greenwald, B. and J. E. Stiglitz. 2013. “Industrial Policies, the
Creation of a Learning Society, and Economic Develop-
ment.” In J. E. Stiglitz and J. Y. Lin (eds.), The Industrial
Policy Revolution I: The Role of Government Beyond
Ideology. Palgrave Macmillan.
Halland, H., M. Noel, S. Tordo, and J. Kloper-Owens. 2016.
“Strategic Investment Funds: Opportunities and Chal-
lenges.” Policy Research Working Paper 7851, World
Bank, Washington, DC.
Hallward-Driemeier, Mary, and Gaurav Nayyar. 2017. Trouble
in the making? The Future of Manufacturing-Led De-
velopment. Washington, DC: World Bank.
Hausmann, Ricardo. 2013. “The Tacit Knowledge Economy.”
Project Syndicate, October 30.
Hofstede, G., B. Neuijen, D. Ohayv, and G. Sanders. 1990.
“Measuring Organizational Cultures: A Qualitative and
Quantitative Study Across Twenty Cases.” Administra-
tive Science Quarterly 35 (2): 286–316.
Lin, J. Y. 2012a. The Quest for Prosperity: How Developing
Economies Can Take Off. Princeton, NJ: Princeton Uni-
versity Press.
———. 2012b. New Structural Economics: A Framework
for Rethinking Development and Policy. Washington,
DC: World Bank.
Lin, J. Y., and C. Monga. 2011. “Growth Identification and
Facilitation: The Role of the State in the Dynamics of
Structural Change.” Development Policy Review 29 (3):
264–90.
Lin, J. Y., and Y. Wang. 2014. “China-Africa Cooperation in
Structural Transformation: Ideas, Opportunities and
Finances.” Working Paper 2014/046, United Nations
University World Institute for Development Economics
Research, Helsinki. www.wider.unu.edu/publications/
working-papers/2014/en_GB/wp2014–046/.
———. 2017a. Going beyond Aid: Development Cooper-
ation for Structural Transformation. Cambridge Uni-
versity Press.
———. 2017b. “New Structural Economics: Patient Capi-
tal as a comparative advantage.” Journal of Infrastruc-
ture, Policy and Development 1 (1). http://systems.en-
press-publisher.com/index.php/jipd/article/view/28.
Monga, Célestin, and Yan Wang 2012. “Creating New Jobs
in Tanzania: a Growth Identification and Facilitation Ap-
proach.” Unpublished manuscript for the World Bank.
Mottaleb, K. A., and T. Sonobe. 2009. “An Inquiry into the
Rapid Growth of the Garment Industry in Bangladesh.”
Economics Working Paper 21, National Graduate Insti-
tute for Policy Studies, Tokyo.
Ranganathan, Rupa, and Cecilia M. Briceño-Garmendia.
2011. “Sudan’s Infrastructure: A Continental Perspec-
tive.” Policy Research Working Paper 5815, World Bank,
Washington, DC.
Rhee, Y. W., and T. Belot. 1990. “Export catalysts in low-
income countries: a review of eleven success stories.”
World Bank Discussion Paper 72, World Bank, Washing-
ton, DC.
Schultze, Charles. 1983. “Industrial Policy: A Dissent.”
Brookings Review (October): 3–12.
U4 Anti-Corruption Resource Centre. 2012. “Corruption
and Anti-corruption in Sudan.” U4 Expert Answer 342,
Bergen, Norway.
UNCTAD (United Nations Conference on Trade and Devel-
opment). 2017. World Investment Report 2017: Invest-
ment and the Digital Economy. Geneva.

91
Not
es a
nd re
fere
nces
| A
fter
Tw
o D
ecad
es o
f “So
litud
e”: T
arge
ted
Stra
tegi
es fo
r Qui
ck E
cono
mic
Win
s
UNEP (United Nations Environmental Programme). 2017. “Re-
view of Kubuqi Ecological Restoration Project: A Desert
Green Economy Pilot Initiative.” Nairobi, Kenya. Available
at: https://wedocs.unep.org/rest/bitstreams/14738/
retrieve.
World Bank. 2009. Sudan: The Road Toward Sustainable
and Broad-Based Growth. Washington, DC.
———. Logistics Performance Index [database]. Washing-
ton, DC.
———. World Development Indicators [database]. Wash-
ington, DC.
Yasseen, G. A. M., and A. Y. E. Ali. 2016. “Comparative Ad-
vantage and Protection of Gum Arabic Production in
West Kordofan State, Sudan (2010–2015).” Scientific
Papers Series: Management, Economic Engineering in
Agriculture and Rural Development 16 (2).
Zhang, Hui. 2017. “UNEP publishes Kubuqi model report on
desert eco-wealth.”


93
Not
es a
nd re
fere
nces
| A
fter
Tw
o D
ecad
es o
f “So
litud
e”: T
arge
ted
Stra
tegi
es fo
r Qui
ck E
cono
mic
Win
s
Annexes


95
Ann
ex 1
| A
fter
Tw
o D
ecad
es o
f “So
litud
e”: T
arge
ted
Stra
tegi
es fo
r Qui
ck E
cono
mic
Win
s
ANNEX 1
Background�information
FIGURE�A1.1�Sudan’s�young�labor�force�and�population�premiumPopulation (millions)
High variant
Medium variant
Low variant
21002075205020252000197519500
50
100
150
200
Population (millions)
Ages 15–64
Under age 15
Age 65 and older
21002075205020252000197519500
20
40
60
80
100
Source: UN Population Projection database. Accessed October 18, 2017.
TABLE�A1.1�Population�density:�Sudan�and�its�comparatorsPopulation density (persons per square km), as of 1 July
Country 2000 2010 2020 2030 2040 2050
China 136.7 144.8 151.7 153.5 151.0 145.3
Egypt 70.2 84.5 103.4 120.3 137.7 154.1
Morocco 64.6 72.6 83.1 91.6 97.9 102.3
Nigeria 134.3 174.1 226.3 289.9 365.8 450.9
South Africa 37.7 42.5 48.4 53.1 56.9 60.0
South Sudan 11.0 16.5 22.3 28.2 34.7 41.5
Sudan 15.4 19.5 24.7 31.1 38.2 45.5
Thailand 123.2 131.6 135.9 136.3 133.8 128.0
Tunisia 62.4 68.5 76.6 82.7 86.5 89.4
Turkey 82.2 94.0 108.9 114.9 120.8 124.3
Vietnam 258.9 285.3 317.2 342.8 358.7 369.7
Source: UN Population Projections.
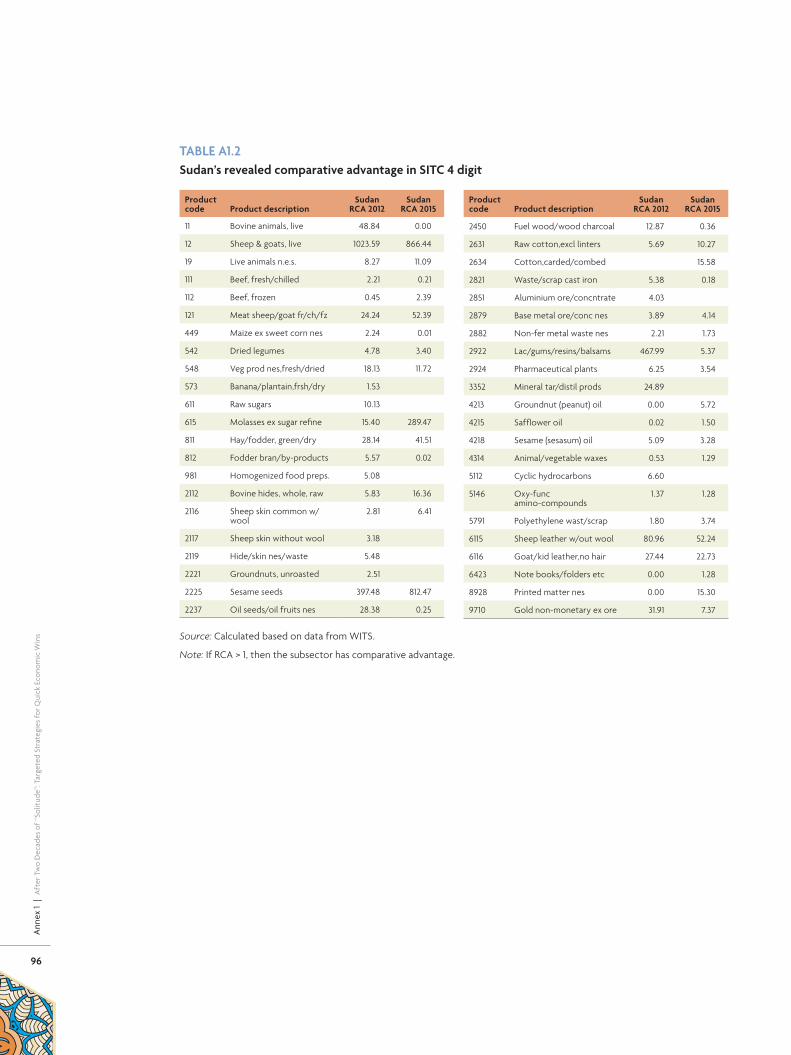
96
Ann
ex 1
| A
fter
Tw
o D
ecad
es o
f “So
litud
e”: T
arge
ted
Stra
tegi
es fo
r Qui
ck E
cono
mic
Win
s
TABLE�A1.2�Sudan’s�revealed�comparative�advantage�in�SITC�4�digit
Product�code Product�description
Sudan�RCA�2012
Sudan�RCA�2015
11 Bovine animals, live 48.84 0.00
12 Sheep & goats, live 1023.59 866.44
19 Live animals n.e.s. 8.27 11.09
111 Beef, fresh/chilled 2.21 0.21
112 Beef, frozen 0.45 2.39
121 Meat sheep/goat fr/ch/fz 24.24 52.39
449 Maize ex sweet corn nes 2.24 0.01
542 Dried legumes 4.78 3.40
548 Veg prod nes,fresh/dried 18.13 11.72
573 Banana/plantain,frsh/dry 1.53
611 Raw sugars 10.13
615 Molasses ex sugar refine 15.40 289.47
811 Hay/fodder, green/dry 28.14 41.51
812 Fodder bran/by-products 5.57 0.02
981 Homogenized food preps. 5.08
2112 Bovine hides, whole, raw 5.83 16.36
2116 Sheep skin common w/wool
2.81 6.41
2117 Sheep skin without wool 3.18
2119 Hide/skin nes/waste 5.48
2221 Groundnuts, unroasted 2.51
2225 Sesame seeds 397.48 812.47
2237 Oil seeds/oil fruits nes 28.38 0.25
Product�code Product�description
Sudan�RCA�2012
Sudan�RCA�2015
2450 Fuel wood/wood charcoal 12.87 0.36
2631 Raw cotton,excl linters 5.69 10.27
2634 Cotton,carded/combed 15.58
2821 Waste/scrap cast iron 5.38 0.18
2851 Aluminium ore/concntrate 4.03
2879 Base metal ore/conc nes 3.89 4.14
2882 Non-fer metal waste nes 2.21 1.73
2922 Lac/gums/resins/balsams 467.99 5.37
2924 Pharmaceutical plants 6.25 3.54
3352 Mineral tar/distil prods 24.89
4213 Groundnut (peanut) oil 0.00 5.72
4215 Safflower oil 0.02 1.50
4218 Sesame (sesasum) oil 5.09 3.28
4314 Animal/vegetable waxes 0.53 1.29
5112 Cyclic hydrocarbons 6.60
5146 Oxy-func amino-compounds
1.37 1.28
5791 Polyethylene wast/scrap 1.80 3.74
6115 Sheep leather w/out wool 80.96 52.24
6116 Goat/kid leather,no hair 27.44 22.73
6423 Note books/folders etc 0.00 1.28
8928 Printed matter nes 0.00 15.30
9710 Gold non-monetary ex ore 31.91 7.37
Source: Calculated based on data from WITS.
Note: If RCA > 1, then the subsector has comparative advantage.

97
Ann
ex 1
| A
fter
Tw
o D
ecad
es o
f “So
litud
e”: T
arge
ted
Stra
tegi
es fo
r Qui
ck E
cono
mic
Win
s
FIGURE�A1.2�Sudan’s�total�exports�in�2015�were�$5.7�billionPercent of total exports
1.7%
PostageStamps
RawCotton
12%
Gold
ScrapCopper
9.6%
Sheep andGoats
0.80%
OtherAnimals
1.8%
Sheep and Goat MeatDried Legumes
7.4%
Other Oily Seeds
Locust Beans,Seaweed, Sugar…
Forage Crops
2.1%
InsectResins
1.4%
Raw Sugar
54%
Crude Petroleum
Source: OEC: http://atlas.media.mit.edu/rw9v8e.
FIGURE�A1.3�Sudan’s�total�imports�in�2015�were�$10.5�billionPercent of total exports
Light PureWoven Cotton
Light SyntheticCotton Fabrics
Knit Women'sSuits
Non-Knit Men'sSuits
Non-Knit Men'sShirts
Felt or CoatedFabric Garments
Packing Bags
RubberFootwear
Semi-Finished Iron
0.68%
Hot-RolledIron
0.94%
Cold- RolledIron
Iron Railway Products
IronStovetops
Liquid Pumps
Air Pumps
1.1%
Large ConstructionVehicles
0.97%
Excavation Machinery
ElectricBatteries
1.6%
Telephones
1.7%
Tractors
Buses
1.6%
Cars
Delivery Trucks
1.1%
Vehicle Parts
6.8%
Planes, Helicopters, and/or Spacecraft
1.0%
ConcentratedMilk
0.71%
1.2%
DriedLegumes
Coffee
Tea
2.5%
Wheat
Wheat Flours Lard
1.0%
Seed Oils
4.6%
Raw Sugar
Yeast
Animal Food
0.74%
RefinedPetroleum
Petroleum Gas
1.3%
Human or Animal Blood
2.6%
UnpackagedMedicaments
3.0%
PackagedMedicaments
0.80%
Ethylene Polymers
Plastic Lids
1.1%
Rubber Tires
SawnWood
NitrogenousFertilizers
FermentedMilkProducts
Source: OEC: http://atlas.media.mit.edu/3jwu94.

98
Ann
ex 2
| A
fter
Tw
o D
ecad
es o
f “So
litud
e”: T
arge
ted
Stra
tegi
es fo
r Qui
ck E
cono
mic
Win
s
ANNEX 2
Economic�performance
FIGURE�A2.1�Sudan’s�share�in�regional�gross�domestic�productsPercent
0
10
20
30
40
2016201020052000199519901985198019751970
Share of Eastern Africa GDP Share of Africa GDP
Source: AfDB calculations based on UNCTAD database.
FIGURE�A2.2�Domestic�investments�in�Sudan$ billion
0
5
10
15
20
201620102005200019951990198519801975197019651960
Source: AfDB calculations based on WDI database (2017).

99
Ann
ex 2
| A
fter
Tw
o D
ecad
es o
f “So
litud
e”: T
arge
ted
Stra
tegi
es fo
r Qui
ck E
cono
mic
Win
s
FIGURE�A2.3�Oil�rents�and�gross�domestic�product�in�Sudan$ billion
0
20
40
60
80
100
20152010200520001996
GDP
Oil rent
Source: AfDB calculations based on WDI (2017) and UNCTAD database.
FIGURE�A2.4�Total�oil�rents�and�net�product�taxes�in�Sudan$ billion
Net taxes on productsOil rents
2015
2014
2013
201220
1120
1020
0920
0820
0720
0620
0520
0420
0320
022001
2000199
9199
8199
7199
60
5
10
15
20
Source: AfDB calculations based on WDI database (2017).

100
Ann
ex 2
| A
fter
Tw
o D
ecad
es o
f “So
litud
e”: T
arge
ted
Stra
tegi
es fo
r Qui
ck E
cono
mic
Win
s
FIGURE�A2.5�Net�taxes�on�products�in�Sudan$ billion
0
5
10
15
20
25
20162010200520001995199019851980197519701965
Source: AfDB calculations based on WDI database (2017).
FIGURE�A2.6�Trends�in�agricultural�trade�in�Sudan$ billion
Agricultural imports
Agricultural trade balance
Agricultural exports
–2
–1
0
1
2
3
Source: AfDB calculations based on UNCTAD database.

101
Ann
ex 2
| A
fter
Tw
o D
ecad
es o
f “So
litud
e”: T
arge
ted
Stra
tegi
es fo
r Qui
ck E
cono
mic
Win
s
FIGURE�A2.7�Total�external�financing�flows�in�Sudan$ billion
2015201020052000199519901985198019751970
Net official development assistance
Net financial flows, bilateral
Total foreign direct investment
–1
0
1
2
3
Source: AfDB calculations based on WDI database (2017).
FIGURE�A2.8�Decomposition�of�external�financial�flows�in�Sudan$ billion
201520102005200019951990198519801975197019651960
Net official development assistance and official aid received
Grants, excluding technical cooperation
Net bilateral aid flows from the U.S.
–1
0
1
2
3
Total foreign direct investment
Source: AfDB calculations based on WDI database (2017).
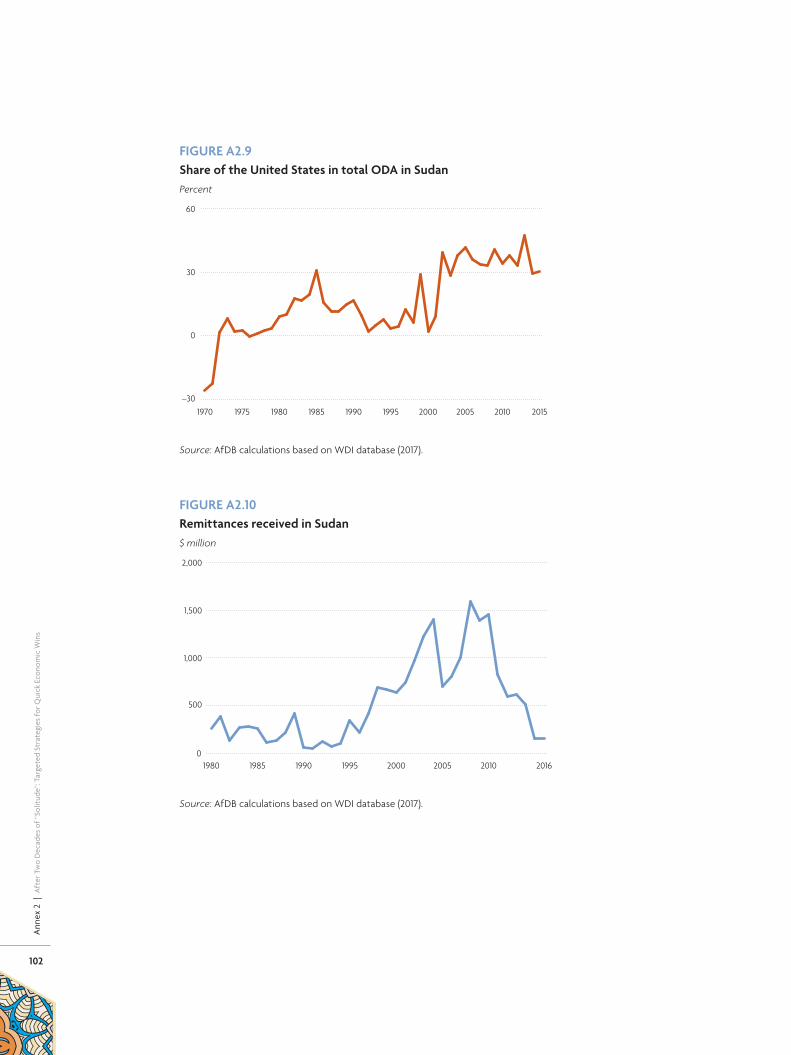
102
Ann
ex 2
| A
fter
Tw
o D
ecad
es o
f “So
litud
e”: T
arge
ted
Stra
tegi
es fo
r Qui
ck E
cono
mic
Win
s
FIGURE�A2.9�Share�of�the�United�States�in�total�ODA�in�SudanPercent
2015201020052000199519901985198019751970–30
0
30
60
Source: AfDB calculations based on WDI database (2017).
FIGURE�A2.10�Remittances�received�in�Sudan$ million
0
500
1,000
1,500
2,000
20162010200520001995199019851980
Source: AfDB calculations based on WDI database (2017).

103
Ann
ex 2
| A
fter
Tw
o D
ecad
es o
f “So
litud
e”: T
arge
ted
Stra
tegi
es fo
r Qui
ck E
cono
mic
Win
s
FIGURE�A2.11�Remittance�growth�and�share�in�GDP�in�SudanPercent
–100
0
100
200
300
20162010200520001995199019851980
Remittances received
0
2
4
6
8
Remittance growth
Source: AfDB calculations based on WDI database (2017).
FIGURE�A2.12�Institutional�efficiency�indices�in�SudanIndex
0
1
2
3
201620152014201320122011201020092008200720062005
Transparency and corruptionBusiness regularory environment
Source: AfDB calculations based on WDI database (2017).

104
Ann
ex 2
| A
fter
Tw
o D
ecad
es o
f “So
litud
e”: T
arge
ted
Stra
tegi
es fo
r Qui
ck E
cono
mic
Win
s
TABLE�A2.1�Structural�transformation�(or�the�lack�of)�in�Africa�and�AsiaPercent of GDP
Value�added�by�sector
1980–1989
1990–1999
2000–2009
2010–2015 2016
Botswana
Agriculture 8.7 4.3 2.7 2.6 ..
Industry 57.5 51.6 44.8 36.5 ..
Manufacturing 6.0 5.7 6.3 6.5 ..
Services 33.8 44.1 52.5 60.9 ..
All three sectors 100.0 100.0 100.0 100.0 ..
Egypt
Agriculture 19.8 17.2 15.1 12.1 11.9
Industry 30.6 31.8 36.1 38.0 32.9
Manufacturing 14.4 17.5 17.9 16.4 17.1
Services 49.7 51.0 48.8 49.9 55.2
All three sectors 100.0 100.0 100.0 100.0 100.0
Kenya
Agriculture 32.4 30.8 27.5 29.9 35.6
Industry 19.4 17.8 19.2 20.2 19.0
Manufacturing 12.0 11.5 12.3 11.9 10.0
Services 48.2 51.5 53.3 50.0 45.4
All three sectors 100.0 100.0 100.0 100.0 100.0
Value�added�by�sector
1980–1989
1990–1999
2000–2009
2010–2015 2016
Lesotho
Agriculture 18.3 9.3 6.7 5.9 ..
Industry 18.1 31.9 39.1 32.7 ..
Manufacturing 8.5 10.3 22.1 12.1 ..
Services 63.7 58.8 54.2 61.4 ..
All three sectors 100.0 100.0 100.0 100.0 ..
Nigeria
Agriculture 36.3 33.4 35.3 21.7 21.2
Industry 33.6 43.0 40.4 25.4 18.5
Manufacturing 8.7 5.5 3.1 8.3 8.8
Services 30.1 23.6 24.3 52.9 60.4
All three sectors 100.0 100.0 100.0 100.0 100.0
Sudan
Agriculture 35.3 42.1 34.0 35.3 39.5
Industry 15.3 13.5 25.2 11.5 2.6
Manufacturing 8.1 7.2 7.0 6.1 ..
Services 49.4 44.5 40.8 53.2 57.9
All three sectors 100.0 100.0 100.0 100.0 100.0
FIGURE�A2.13�Trade�facilitation�indices�in�Sudan$ per container
0
1,000
2,000
3,000
4,000
2014201320122011201020092008200720062005
Cost to importCost to export
Source: AfDB calculations based on WDI database (2017).

105
Ann
ex 2
| A
fter
Tw
o D
ecad
es o
f “So
litud
e”: T
arge
ted
Stra
tegi
es fo
r Qui
ck E
cono
mic
Win
s
Value�added�by�sector
1980–1989
1990–1999
2000–2009
2010–2015 2016
Uganda
Agriculture 57.6 47.9 25.6 27.1 24.4
Industry 9.4 14.9 25.4 20.8 19.7
Manufacturing 5.5 7.2 7.5 9.8 8.8
Services 33.0 37.2 49.1 52.1 55.8
All three sectors 100.0 100.0 100.0 100.0 100.0
Comparator countries in Asia
Bangladesh
Agriculture 33.7 26.7 20.3 16.8 14.8
Industry 20.7 23.1 24.7 27.1 28.8
Manufacturing 13.5 14.6 15.7 17.1 17.9
Services 45.6 50.2 55.0 56.1 56.5
All three sectors 100.0 100.0 100.0 100.0 100.0
Cambodia
Agriculture .. 47.0 34.2 33.9 26.7
Industry .. 16.1 25.6 25.9 31.7
Manufacturing .. 11.2 18.3 16.5 17.2
Services .. 37.0 40.3 40.3 41.6
All three sectors .. 100.0 100.0 100.0 100.0
China
Agriculture 28.9 20.1 12.0 9.3 8.6
Industry 44.1 45.0 46.1 44.4 39.8
Manufacturing 35.7 32.6 31.9 30.8 ..
Services 27.0 34.9 42.0 46.4 51.6
All three sectors 100.0 100.0 100.0 100.0 100.0
Value�added�by�sector
1980–1989
1990–1999
2000–2009
2010–2015 2016
India
Agriculture 32.9 28.4 20.5 18.3 17.4
Industry 30.5 31.2 32.6 31.2 28.8
Manufacturing 18.9 18.6 18.1 16.9 16.5
Services 36.6 40.5 46.9 50.5 53.8
All three sectors 100.0 100.0 100.0 100.0 100.0
Myanmar
Agriculture .. .. 48.0 30.7 28.2
Industry .. .. 16.8 31.9 29.5
Manufacturing .. .. 12.2 20.0 ..
Services .. .. 35.2 37.4 42.3
All three sectors .. .. 100.0 100.0 100.0
Sri Lanka
Agriculture 27.5 23.8 14.1 8.8 8.2
Industry 27.3 26.6 28.9 30.6 29.6
Manufacturing 14.2 14.2 17.9 19.4 16.9
Services 45.2 49.6 57.0 60.6 62.2
All three sectors 100.0 100.0 100.0 100.0 100.0
Vietnam
Agriculture .. .. .. 20.5 18.1
Industry .. .. .. 36.9 36.4
Manufacturing .. .. .. 14.9 15.9
Services .. .. .. 42.6 45.5
All three sectors .. .. .. 100.0 100.0
.. is [explain]
TABLE�A2.1�(continued)�Structural�transformation�(or�the�lack�of)�in�Africa�and�AsiaPercent of GDP
Source: World Bank, World Development Indicators.

106
Ann
ex 3
| A
fter
Tw
o D
ecad
es o
f “So
litud
e”: T
arge
ted
Stra
tegi
es fo
r Qui
ck E
cono
mic
Win
s
ANNEX 3
Cointegration�results
TABLE�A3.1�Relative�purchasing�power�parity�(RPPP),�1971Q1–2017Q4
Part�A
Null hypothesis, rank (αβ′) = r r = 0 vs. r = 1 r ≤ 1 vs. r = 2
λ-max 27.471* 12.151
95 percent critical values 24.214 16.327
90 percent critical values 21.663 13.801
Trace-statistics 39.621* 12.151
95 percent critical values 32.030 16.327
90 percent critical values 28.654 13.801
Part�B
Normalized cointegrating vector Ln Sudan CPI1
(0.000)
Ln Exchange rate–0.848***(0.101)
Ln World CPI–0.176(0.264)
Time trend–0.021***(0.009)
Over-identifying restrictionsa 1(0.000)
–1.064***(0.093)
–1.000(0.000)
0.004(0.004
*** Significant at 1 percent; ** significant at 5 percent; * significant at 10 percent. Numbers in parentheses are symptomatic stan-
dard errors.
Note: Data properties are assessed by applying the standard augmented Dickey Fuller testing procedure to the logarithms of
Sudan CPI, the nominal exchange rate and the world CPI (measured by U.S. CPI). The test includes intercept and trend in the
log level of a given variable with five lags; but without intercept and trend in its first difference. The choice of lag length is
determined by Schwarz Bayesian Criterion (SBC). The results, not reported to conserve space, reject the null of no unit root in
the levels of all variables; but confirm their stationarity in first difference. Accordingly, the RPPP relation is estimated using the
standard CVAR of the included variables together with a linear trend, and two-step dummies: D90s and D2010s, capturing infla-
tion acceleration taking the value of one in 1990Q1–1996Q4 and 2012Q3–2017Q4 and zero otherwise. The lag length of the VAR
underlying the cointegration analysis is based on the SBC, which selects two lags. The dummies are estimated unrestricted into
the cointegration space, while the world CPI is entered as an exogenous forcing variable.
As seen in the table, both the λ-max and Trace eigenvalues statistics reject the null of no cointegration at the 5 percent signifi-
cance level and confirm the presence of at most one cointegrating vector, which normalized in the top of part B of the table.
The analysis of the persistence profile due to Pesaran and Shin (1996) confirmed that estimated cointegrating vector is genuine.
a. CHSQ. (1) statistic = 6.416, P-value = (0.011) and further overidentification restrictions in line with the purchasing power parity
theory reject the law of one price for Sudan.
Source: Authors’ calculations based on data from the IMF financial statistics, Pick Currency Year Book. Various editions. New
York: Pick Publishing Co. and the Central Bank of Sudan.

107
Ann
ex 3
| A
fter
Tw
o D
ecad
es o
f “So
litud
e”: T
arge
ted
Stra
tegi
es fo
r Qui
ck E
cono
mic
Win
s
TABLE�A3.2�Inflation�error�correction�model�1970Q1-2017Q4
ΔLnSudanCPI�is�the�dependent�variable Ordinary�least�squares�model�(1) AR�(1)�corrected�model�(2)
Regressors
(ΔLn exchange rate) 0.091***(2.965)
0.104***(3.487)
ΔLnWorldCPI 1.046**(2.058)
1.065**(2.321)
The error correction term (ECT)t–1 –0.056***(3.481)
–0.050***(-3.525)
D90s –0.049***(-2.053)
–0.047**(2.006)
D2010s –0.053**(-2.174)
–0.051**(-2.287)
ΔLnSudanCPI*D90s 0.937***(7.961)
0.922***(7.863)
ΔLnSudanCPI*D2010s 0.867***(2.965)
0.873***(3.135)
μ̂t–1 –.0147**(-2.051)
Constant 0.007(0.622)
0.009(0.919)
*** Significant at 1 percent; ** significant at 5 percent; * significant at 10 percent. Numbers in parentheses are p-values.
Note: Δ denotes the first log difference; ΔLnSudanCPI*D90s and ΔLnSudanCPI*D2010s stand for inflation growth interacted
with the D90s and 2010s dummy (see table A3.1).
Diagnostic tests model (1):
R 2 = .56. LMS CHSQ (4) =41.052 (0.000) ***.
R 2 = 0.54. RESET CHSQ (1). = 1.6070 (205).
F-statistic (7,183) = 33.0423***. NORM CHSQ (2) = 24.8674 (.000) ***.
DW-statistic = 2.262. HET CHSQ (1) = 1.8257 (.177).
LMS: Lagrange multiplier test of residual serial correlation
RESET: Ramsey’s RESET uses the square of the fitted values to test the functional form.
NORM: Jarques-Bera test for normality of residuals
HET: Test for heteroscedasticity based on squared residuals.
Model (2) is estimated to correct for the presence of residual serial correlation.
R 2 = .57. R 2 = 0. 55.
F-statistic (8,182) = 29.781***. DW-statistic = 2.034.
Log-likelihood ratio test of AR (1) versus OLS CHISQ (1) = 3.7475 (0.053) *; which selects model (2).
Source: See source for table A3.1.
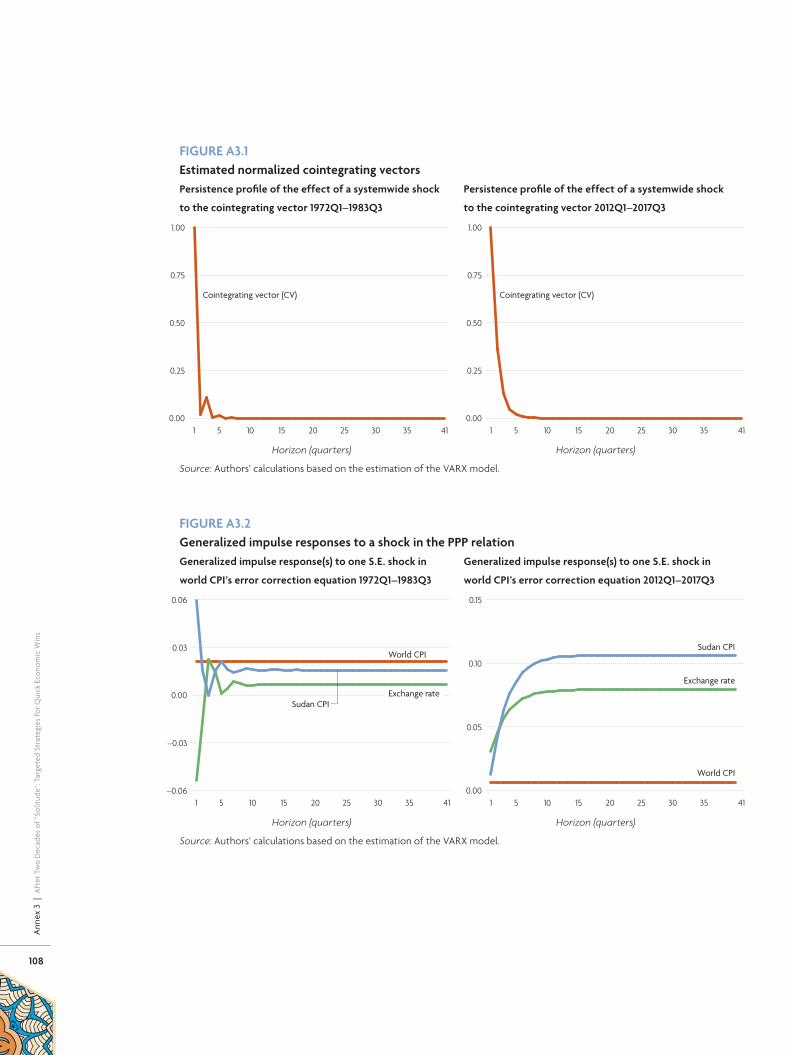
108
Ann
ex 3
| A
fter
Tw
o D
ecad
es o
f “So
litud
e”: T
arge
ted
Stra
tegi
es fo
r Qui
ck E
cono
mic
Win
s
FIGURE�A3.1�Estimated�normalized�cointegrating�vectorsPersistence�profile�of�the�effect�of�a�systemwide�shock�
to�the�cointegrating�vector�1972Q1–1983Q3
Cointegrating vector (CV)
0.00
0.25
0.50
0.75
1.00
4135302520151051
Horizon (quarters)
Persistence�profile�of�the�effect�of�a�systemwide�shock�
to�the�cointegrating�vector�2012Q1–2017Q3
Cointegrating vector (CV)
0.00
0.25
0.50
0.75
1.00
4135302520151051
Horizon (quarters)
Source: Authors’ calculations based on the estimation of the VARX model.
FIGURE�A3.2�Generalized�impulse�responses�to�a�shock�in�the�PPP�relationGeneralized�impulse�response(s)�to�one�S.E.�shock�in�
world�CPI’s�error�correction�equation�1972Q1–1983Q3
Sudan CPI
World CPI
–0.06
–0.03
0.00
0.03
0.06
4135302520151051
Exchange rate
Horizon (quarters)
Generalized�impulse�response(s)�to�one�S.E.�shock�in�
world�CPI’s�error�correction�equation�2012Q1–2017Q3
Sudan CPI
World CPI
0.00
0.05
0.10
0.15
4135302520151051
Exchange rate
Horizon (quarters)
Source: Authors’ calculations based on the estimation of the VARX model.

109
Ann
ex 3
| A
fter
Tw
o D
ecad
es o
f “So
litud
e”: T
arge
ted
Stra
tegi
es fo
r Qui
ck E
cono
mic
Win
s
FIGURE�A3.3�Generalized�impulse�responses�to�shock�in�PPP�relation�with�broad�moneyGeneralized�impulse�response(s)�to�one�S.E.�shock�in�
world�CPI’s�error�correction�equation�1972Q1–1983Q3
World CPI
Broad moneyExchange rate
Sudan CPI
–0.08
–0.04
0.00
0.04
0.08
4135302520151051
Horizon (quarters)
Generalized�impulse�response(s)�to�one�S.E.�shock�in�
world�CPI’s�error�correction�equation�2012Q1–2017Q3
World CPI
Sudan CPI
Exchange rate
Broad money
0.00
0.02
0.04
0.06
0.08
0.10
4135302520151051
Horizon (quarters)
Source: Authors’ calculations based on the estimation of the VARX model.

110
Ann
ex 4
| A
fter
Tw
o D
ecad
es o
f “So
litud
e”: T
arge
ted
Stra
tegi
es fo
r Qui
ck E
cono
mic
Win
s
ANNEX 4
Forums�and�commitments�for�cooperation�with�Africa
Africa’s�partnershipsYear�of�creation�and�frequency
Highest�number�of�participations�at�head�of�state�level�from�Africa Major�announcements�at�the�most�recent�event
Forum on China-Africa Cooperation (FOCAC)
2000–2015, Triennial. 45 heads of state and government (2015).
China committed to support Africa by investing $60 billion (tripling commitments in 2012) in the next three years, including $5 billion for grants and no-interest loans, $35 billion for concessional loans and export buyers’ credit, and the rest as commercial financing.
Tokyo International Conference on African Development (TICAD)
1993, every 5 years. 41 heads of state (2008). Contribute to the growth of Africa with private and public means of up to $32 billion in the next five years.
US–Africa Leaders’ Summit
2014 45 heads of state and government (2014)
$7 billion financing to promote American exports to and investment in Africa; $14 billion private sector investment in clean energy, aviation, banking and construction; $12 billion Power Africa Initiative.
France–Africa Summit 1973. Annual until 1990, biennial since.
Around 40 heads of state and government (2013)
Double trade with Africa in the next five years; donations and projects to reach €20 billion (about $21 billion) in the next five years.
India–Africa Forum Summit
2008, 2011, 2015 41 heads of state and government (2015)
$10 billion concessional credit over the next five years; $600 million grant assistance including $100 million India–Africa Development Fund and $100 million India–Africa Health Fund; 50,000 scholarships over the next five years.
Africa–Turkey Cooperation Summit
2008, 2014 7 presidents (2014) Tariff preferences and duty-free privileges to expand trade and investment from $30 billion in 2013 to $50 billion by 2019.
Korea–Africa Forum; Forum on Economic Cooperation; Forum on Industry Cooperation
KAF: 2006, triennial. KOAFEC: 2006, biennial. KOAFIC: 2008, annual.
5 heads of state (2006) Increase official development assistance to Africa; expand scholarship programs for African students.
Source: South–South Policy Team at UNDP. Issue Brief No. 14, December 2015.

111
Ann
ex 5
| A
fter
Tw
o D
ecad
es o
f “So
litud
e”: T
arge
ted
Stra
tegi
es fo
r Qui
ck E
cono
mic
Win
s
China’s Xinjiang Uyghur Autonomous Re-gion, on the Silk Road to Central Asia, has been identified as a priority region
in China’s new development strategy of “Going West and Linking East.” The strategy aims to shift the economic gravity from China’s more advanced coastal regions toward less devel-oped inland provinces, transforming Xinjiang into a modern manufacturing and energy pro-duction base as well as a trading hub to pro-mote regional integration with countries in Central Asia.
To accelerate the development of manufac-turing and energy sectors, an array of public financed investment projects and targeted in-dustrial policies have been implemented in Xin-jiang since the early 2000s (Wang et al. 2014). These include public financing of major infra-structure projects, direct financial and institu-tional development (R&D institutions, financial services, and cross-border customs manage-ment), establishing cross-border free trade zones, and a range of targeted industrial polic-es, particularly special economic zones (SEZs).
The central government has invested heav-ily in transportation, logistics capacity, and in-formation management systems to improve connectivity between Xinjiang and countries in Central Asia. The investment in transporta-tion capacity (railway, highway, and aviation) increased more than fourfold over 2000–12. The New Eurasian Land Bridge — coming into operation in 2013, starting from Chongqing (and Zhengzhou) to Hamburg, Germany — is one of the most important rail routes passing through Xinjiang and Kazakhstan. The local govern-ments in Xinjiang implemented the “five ac-cesses plus one leveling” policy in all SEZs and
industrial parks, to ensure that firms have ac-cess to basic facilities, including water, electric-ity, gas, telecommunication, and roads, and lev-eling the SEZ sites for constructions (Ge 2010).
Key features of SEZs in XinjiangThe special economic zones have been one of the most important industrial policies to attract investment, technology, and human capital from inland provinces and overseas to Xinjiang province. SEZ development in Xinjiang differs markedly from that in coastal provinces in several key aspects.• First, it recognized Xinjiang’s special loca-
tion, a landlocked region far from China’s large domestic market, and bordering coun-tries in Central Asia, all with small domestic markets.94
ANNEX 5
Xinjiang’s�successful�targeted�industrial�policies
CHINA
XINJIANG
MONGOLIA
PDRKOREA
KOREA,REP.
RUSSIAN FEDERATION
KAZAKHSTAN
INDIA NEPAL
MYANMARLAOPDR
THAI.
VIET.
BHUTAN
KYRGYZREP.
UZBEK.
PAKISTAN
AFG.
TAJIKISTAN
BANGLADESH

112
Ann
ex 5
| A
fter
Tw
o D
ecad
es o
f “So
litud
e”: T
arge
ted
Stra
tegi
es fo
r Qui
ck E
cono
mic
Win
s
• Second, Xinjiang is rich in natural resourc-es, with oil, natural gas, and coal account-ing for 30–40 percent of China’s reserves. But it faces severe water shortage due to its climate, with total water reserve at a level of about 3.5 percent of China’s total water volume.
• Third, it is China’s only province with the largest ethnic minority population, current-ly facing escalation of ethnic conflicts, and
one of least developed regions, with short-ages of skilled labor force.So, SEZs in Xinjiang focused on developing
production networks and regional supply value chains, high value-added services using in-formation and communication technology, and regional economic integration through cross-border free trade zones and value chain development. To speed China’s economic in-tegration with countries in Central Asia, two cross-border free trade zones, Khorgors and Kashgar, were established in the early 2000 along Xinjiang’s border with Kazakhstan, Tajik-istan, and Kyrgyzstan.95
These SEZs cover free trade zones, logistics parks, export-process zones, industrial parks, and high technology development zones. By 2012, there were about 70 technological devel-opment areas in Xinjiang, 16 sponsored by the national government and 54 by the provincial government. The majority of firms registered in SEZs originated in inland and coastal provinces (Ge 2010).
The development of SEZs has targeted sev-eral pillar industrial sectors considered com-patible with local endowment structure. The targeted pillars include high technology manu-facturing sectors, agribusiness, mining and en-ergy, chemicals and textiles, manufacturing and machinery, building materials, food processing, and tourism. Within the identified industries, policy support was given to firms from inland provinces that promote private local firms al-ready in those industries.
Major development outcomes
Rapid growth and structural change
The rapid development of SEZs, together with targeted investment in infrastructure and re-gional economic integration, has been the driving force in spurring economic growth and transformation in Xinjiang. Between 2000 and 2015, total GDP increased sevenfold in constant
FIGURE�A5.1�Structural�change�by�sector�and�employment:�1990–2015Shift�of�employment�share�across�industry
Percent of GDP
0
25
50
75
TertiarySecondaryPrimary
2015201220001990
Structural�change�in�sectoral�share�of�GDP
Percent of GDP
0
10
20
30
40
Wholesale/retailTransportConstructionIndustryAgriculture
2015201220001990
Source: Xinjiang Statistics Yearbooks, 1991, 2001, 2013, and 2016.

113
Ann
ex 5
| A
fter
Tw
o D
ecad
es o
f “So
litud
e”: T
arge
ted
Stra
tegi
es fo
r Qui
ck E
cono
mic
Win
s
prices. The economic growth also improved living standards, with household per capita disposal income increasing fivefold, from 3,631 yuan in 2000 to 16,859 in 2015.
Xinjiang also saw transformation from an agricultural economy to one more balanced across primary, secondary, and tertiary sectors. Industrial value added in GDP rose to about 30 percent in 2015 from just over a quarter in 1990 (figure A5.1). Xinjiang’s economic structure had converged to that of the China’s national economic structure, indicating its catching up in overall economic development.
The structural change of the economy had been accompanied by a large-scale labor re-location both across sectors and between urban and rural areas (figure A5.2). The share of employment in the agricultural sector dropped by about 16 percentage points, with the surplus labor released from the agricul-tural sector being largely absorbed in the in-dustrial and tertiary sector. Xinjiang also saw rapid urbanization, with the urban share rising from 34 percent in 2000 to more than 45 per-cent in 2015.
Industrial upgradingLooking at the level and composition of indus-trial structure (measured by value added of 4 SITC sub-sector) between 2000–15. All sub-sectors saw fast growth. But investment from firms registered in SEZs focused primarily on resource and capital-intensive industries while labor-intensive (textile) was less prominent. Food processing and beverages saw rapid ex-pansion, as did technology- intensive sectors, including machinery and equipment manu-facturing and oil processing, coking, smelting, medicine, plastic, and chemical products.
Regional economic integration: trade and supply value chainXinjiang has become a much more open economy over the past two decade, with the trade-to-GDP ratio increasing from 10 per-cent in 1990 to about 22 percent in 2012 (see figure A5.2). Border trade rose to more than 50 percent of total trade in Xinjiang in 2012, from only 15 percent in 1990. Xinjiang has also become the major FDI destination, with its FDI flows accounting for over 18 percent of Chi-na’s total FDI in 2012, up from only 4 percent in 1990.
The complementarity of resource endow-ment between China and Central Asia has been the driving force for the recent surge in trade between the two regions (Tang 2002; Tian 2010). Trade patterns between China and Cen-tral Asia are dominated by oil and natural gas, which accounted for more than 80 percent of Central Asia’s exports to China, underscoring Xinjiang’s crucial role as a pivotal hub for Chi-na’s energy imports. Trade between Xinjiang and Kazakhstan, Xinjiang’s largest trading part-ner, increased 45-fold between 2000 and 2013.
The Khorgors free trade zone, which start-ed in 2010, boosted economic integration be-tween Xinjiang and Kazakhstan. Between 2010 and 2012, total trade increased 49 percent, dominated by cross-border trade.
FIGURE�A5.2�Xinjiang:�Trade�openness�and�border�tradePercent of GDP
0
20
40
60
2012201020001990
Border trade shareTrade/GDP
Source: Xinjiang Statistics Yearbooks.

114
Ann
ex 5
| A
fter
Tw
o D
ecad
es o
f “So
litud
e”: T
arge
ted
Stra
tegi
es fo
r Qui
ck E
cono
mic
Win
s
The SEZs brought financial resource, tech-nology, know-how, and human capital to Xin-jiang through investments by firms in devel-oped inland provinces. Together with increased intergovernmental economic cooperation in Central Asia focusing on infrastructure devel-opment and trade facilitation, they have fos-tered regional production networks and supply value chains among countries in Central Asia.
The Xinjiang SEZs, combined with well de-signed and targeted investment, can catalyze transformational change even in less devel-oped regions with myriad economic and loca-tional disadvantages.
ReferencesGe, Y. 2010. “Development strategies of logistic system in
China’s western regions to promote economic integra-
tion of Central Asia.” Report commissioned by Korea
Maritime Institute.
Che, C. B., J. Zhu, H. L. Yang, and D. Y. Zhang. 2008. “Re-
search on Xinjiang’s strategy on sustainable develop-
ment of natural resources.” Mandaluyong, Philippines:
Asian Development Bank.
Wang, L., Y. Ge, and J. Y. Lin. 2014. “Assessing Xinjiang’s In-
dustrial Policies: Special economic zones as an instru-
ment to promote regional integration and sustainable
development.” Mandaluyong, Philippines: Asian Devel-
opment Bank.
Lin, J. Y., and Y. Wang. 2014. “Kazakhstan and Regional Inte-
gration: Joining Global Supply Chains via Growth Iden-
tification and Facilitation.” Mandaluyong, Philippines:
Asian Development Bank.
Notes94. The eight countries sharing borders with Xinjiang in-
clude Russia and Mongolia in the north, Kazakhstan,
Azerbaijan, Kyrgyz Republic, Tajikistan, and Uzbeki-
stan in the west, and Afghanistan and Pakistan in the
south.
95. The Kashgar SEZ in Yili prefecture is a pivotal freight
transportation hub in western Xinjiang, with a bor-
der of 888 kilometers and four entry ports connect-
ing China with six neighboring countries, including
Tajikistan, Afghanistan, Pakistan, Kyrgyzstan, Uzbeki-
stan, and India (a combined international market with
a population of 1.3 billion). The Khorgors SEZ, bor-
dered with Kazakhstan, includes a free trade zone, a
financial trading district, and about 35 manufacturing
firms.

Sud
an Eco
no
mic R
ep
ort�
AFRIC
AN
�DEV
ELOPM
ENT�BA
NK�G
ROU
P
The Sudanese economy was under sanctions
for more than two decades. The permanent
removal of these sanctions creates an incentive
for policy makers and development stakeholders
in Sudan to deepen economic reforms. The
removal of sanctions also bodes well for the fairly
resilient private sector, which is now looking for
opportunities to transform an already resilient
and dynamic economy.
This Sudan Economic Report, the second in a
new series, analyzes the impact of sanctions and
suggests a pragmatic policy framework and set of
targeted policies to achieve quick economic wins.
Avenue Joseph Anoma01 BP 1387 Abidjan 01Côte d’Ivoirewww.afdb.org