successful first half of commerzbank 4.0 net result of 865m · › expenses of €6.9bn in line...
TRANSCRIPT

Commerzbank 4.0
simple – digital – efficient
Successful first half of Commerzbank 4.0 – net
result of €865m
All figures in this presentation are subject to rounding
Analyst conference – Q4 2018 / FY 2018 preliminary and unaudited results
Stephan Engels | CFO | Frankfurt | 14 February 2019

Commerzbank 4.0
simple – digital – efficient
Growth on the back of successful strategy implementation
Stephan Engels | CFO | Frankfurt | 14 February 2019 1
PSBC
› Consumer Finance business on
own balance sheet
› Setup of market segment Small
Business Customers within PSBC
CC
› Integration of all corporate client
activities in one segment
› Sale of EMC business
Run-down legacy portfolios
› Legacy portfolios cleaned up
› Ship finance <€500m
PSBC
› 1m net new customers (GER)
› +€46bn Assets under Control (GER)
› Underlying revenue growth of €234m
in 2018
CC
› 8.9k net new corporate customers
› Loan growth of €7bn with corporates
› RWA efficiency of 3.9%
... business model transformation … … and growth in core segments
based on high quality balance sheet
Balance sheet quality
› Clean balance sheet with NPL <0.9%
› Capital reallocated to growth in core
segments
Simple
› We will focus on businesses in two
operating segments: PSBC and CC
› We will discontinue non-core
activities
Digital
› We will transform the bank into a
digital enterprise
› We will digitalise 80% of all relevant
processes until 2020
Efficient
› We will simplify the bank, creating
efficiency
› We will generate additional
competitive advantages
Commerzbank 4.0 drives…

Commerzbank 4.0
simple – digital – efficient
› Full roll-out of integrated business and IT teams
with Campus 2.0
› More efficient and faster IT delivery model
› New delivery model contributes cost savings
Payments Trade Fin. &
Services Securities
Retail
Credit
Corporate Mortgages
Significant progress in digitalisation – roll out of new delivery model
Stephan Engels | CFO | Frankfurt | 14 February 2019 2
Digitalising our core processes – our roadmap to a digital enterprise
2016
2017 2018
Digital Campus
Campus 2.0
Achieved digitalisation ratio
Target ratio
Commerzbank 4.0
› New agile working methods established
› 4 Master Journeys completed
› 59% digitalisation ratio reached
Consumer
Credit Accounts &
CLM Corp.
Accounts &
CLM Retail Credit SME
simple
digital
efficient
36%
48% 59%
75% 80%
2019 2020

Commerzbank 4.0
simple – digital – efficient
Stephan Engels | CFO | Frankfurt | 14 February 2019 3
Sound and robust compliance framework established – Commerzbank
recognised as reliable partner
2015 2019 2017 2020 2018 2016
Next steps:
Continuous
improvement
Further
automation
Usage of big
data
Substantial investment of approx. €600m Increase of global headcount in compliance
department to over 700
Initiatives to strengthen Compliance
› Stringent implementation of the “Three Lines of Defense” model and a culture of
integrity
› Establishment of global robust and sustainable AML and Sanctions compliance
program
› State-of-the-art transaction monitoring and sanctions screening systems
› Definition and roll-out of consistent global KYC processes
› US Monitorship instrumental in implementing a sound and robust global
compliance – following strict US regulatory requirements

Commerzbank 4.0
simple – digital – efficient
Full year operating profit of €1.2bn and net result of €865m
Improved underlying revenues and benign risk result › FY underlying revenues increased by 5% vs. 2017
› Q4 underlying revenues remain stable vs. Q3 despite challenging markets
› Risk Result of €-446m significantly (43%) below 2017 LLPs thanks to reduced ship finance
Highlights 2018
Costs in line with guidance › Expenses of €6.9bn in line with full year guidance of €7.1bn when adding back €200m from
discontinued operations (EMC)
› Cost management largely compensating effects of strong investments
Net RoTE of 3.4% in second transformation year › Q4 contributing €240m to FY operating result of €1.2bn
› Ongoing loan demand reflected in FY RWA growth of 6% and CET1 ratio of 12.9%
› Dividend of €20ct per share planned for AGM
4 Stephan Engels | CFO | Frankfurt | 14 February 2019

Commerzbank 4.0
simple – digital – efficient
Exceptional revenue items
2017 2018 Revenues
› Hedging & valuation adjustments
› Polish group insurance business (PSBC)
› PPA Consumer Finance (PSBC)
1 -24
52
-27
Revenues (€m)
Q1
Q2
Q3
Q4
FY -78
5
› Hedging & valuation adjustments 108 108
8 › Hedging & valuation adjustments 8
502
› Hedging & valuation adjustments
› Concardis (PSBC)
› Consumer Finance Joint Venture - thereof PPA (PSBC)
› Property sales gains (O&C)
28
89
160 -16
225
› Hedging & valuation adjustments
› PPA Consumer Finance (PSBC)
-32
-29 -60
557
Stephan Engels | CFO | Frankfurt | 14 February 2019
(€m)
› Hedging & valuation adjustments
› PPA Consumer Finance (PSBC) 18 42
-25
› Hedging & valuation adjustments
› PPA Consumer Finance (PSBC) 18 41
-23
› Hedging & valuation adjustments
› PPA Consumer Finance (PSBC) -115 -95
-21

Commerzbank 4.0
simple – digital – efficient
Key financial figures at a glance
Group Financial Results Group Capital2
Operating result (€m)
Net result1
(€m) Leverage ratio fully phased-in (% end of period)
B3 CET1 ratio fully phased-in
(%)
1) Consolidated result attributable to Commerzbank shareholders
2) 01 Jan 2018 after application of IFRS 9; 31 Dec 2018 includes net result of FY
2018 reduced by dividend accrual
592
1,323
1,245
557
FY 2017
-78
FY 2018
1,149
128
865
FY 2017 FY 2018
13.3 12.9
01 Jan 18 31 Dec 18
4.8 4.8
01 Jan 18 31 Dec 18
Exceptional Revenue Items
6 Stephan Engels | CFO | Frankfurt | 14 February 2019

Commerzbank 4.0
simple – digital – efficient
4,613 4,847
FY 2018
-44
4,803
210
FY 2017
4,823
Exceptional Revenue Items
Revenues and operating results of Commerzbank divisions
7
Private and Small Business Customers (€m)
Others & Consolidation Asset & Capital Recovery
Corporate Clients
Operating Result 858
Revenues
(€m)
(€m) (€m)
Revenues
Operating Result
Operating Result Operating Result -344 -151
-122
FY 2018 FY 2017
222 -2
-153 -359
34 96
FY 2017 FY 2018
12
-264
22
3,584 3,495
-43
29 3,451
3,613
FY 2017 FY 2018
Stephan Engels | CFO | Frankfurt | 14 February 2019
735 676 629

Commerzbank 4.0
simple – digital – efficient
278
141
609
122
258
401 346
240
Q3 Q2 Q4 Q1 Q4 Q1 Q3 Q2
Operating result with substantially increased revenue quality
Group operating result (€m)
Group P&L
2017 2018
1) Consolidated result attributable to Commerzbank shareholders 8 Stephan Engels | CFO | Frankfurt | 14 February 2019
› Significantly improved revenue quality (+€441m) – largely compensating for exceptional items (-€635m)
› FY 5% increase in underlying revenues driven by NII while NCI and NFV slightly lower
› Low risk result due to further balance sheet improvement drives increased operating result
› Discontinued operations reflect agreement on sale of EMC
Highlights
in €m Q4 2017 Q3 2018 Q4 2018 FY 2017 FY 2018
Revenues 2,105 2,140 2,035 8,764 8,570
Exceptional items -60 18 -115 557 -78
Revenues excl. exceptional items 2,165 2,122 2,151 8,208 8,648
o/w Net interest income 1,169 1,243 1,254 4,370 4,828
o/w Net commission income 778 771 754 3,192 3,089
o/w Net fair value result 69 53 17 456 410
o/w Other income 149 55 126 189 321
Risk result (2017: LLP) -251 -133 -154 -781 -446
Operating expenses 1,731 1,661 1,641 6,834 6,879
Operating profit 122 346 240 1,149 1,245
Restructuring expenses - - - 808 -
Pre-tax profit discontinued operations 16 -15 -30 118 -15
Pre-tax profit Commerzbank Group 137 331 210 459 1,230
Taxes on income 35 89 75 237 262
Minority interests 27 24 22 94 103
Net result ¹ 75 218 113 128 865
CIR (%) 82.3 77.6 80.6 78.0 80.3
Net RoTE (%) 1.2 3.5 1.8 0.5 3.4
Operating RoCET (%) 2.0 6.0 4.1 4.9 5.4

Commerzbank 4.0
simple – digital – efficient
Positive trajectory of NII throughout 2018 – reflecting growth in PSBC
and CC
Stephan Engels | CFO | Frankfurt | 14 February 2019 9
643 668 672 688
425 444 466 486
94 105 80
57
Q4 18 Q1 18
CC
Q2 18 Q3 18
PSBC
ACR/O&C
1,124 1,207
1,243 1,254
Net Interest Income (excluding exceptional items) (€m)
Loans and deposits as well as markets business in CC contributed to increase

Commerzbank 4.0
simple – digital – efficient
Cost development in line with FY guidance
10
2017 vs. 2018 cost transition based on restatement as of Jan 15, 2019 (€m)
66
2017
3,441
Costs of
Investments
& Growth
3,493
3,341
25
Regulatory &
Compliance
16
Compulsory
contribution1) 2018 Cost
management
13
Other
3,438
6,834 6,879 49
Personnel expenses
Operating expenses
1) Bank Levy, Polish banking tax & Deposit guarantee scheme
› Continued strategic investments in digitalisation and growth peaked in mid 2018 as planned
› Higher costs for regulatory requirements and compulsory contributions – 12M overall compulsory contribution of €420m
› Cost Management driven by staff reduction and sourcing
For reference: 2018 costs of €6,879m correspond to guided €7.1bn when adding €246m from discontinued EMC business
Highlights
Stephan Engels | CFO | Frankfurt | 14 February 2019

Commerzbank 4.0
simple – digital – efficient
Further cost savings through increased efficiency and FTE reductions
11
0.2
0.2
0.2
Efficiencies new
IT delivery model 2020 2018
6.9
EMC disposal 2017 FTE reduction
0.1
Other cost
management
0.1
Cost inflation
and growth
7.1
6.5
› Targeted cost reduction to <€6.8bn in 2019 and €6.5bn in 2020
– FTE reductions based on efficiency gains including digitisation
– Efficiencies from new Campus 2.0 delivery model including benefits of internalisation
– Other ongoing cost management measures offset effects from cost inflation and growth
› Growth, sourcing and internalisation in IT lead to revised expected FTE of >38k
Highlights
Stephan Engels | CFO | Frankfurt | 14 February 2019
(€bn)
Drivers of cost development

Commerzbank 4.0
simple – digital – efficient
Continued low risk result
Risk Result (Provisions for loan losses in 2017) (€m)
Risk Result divisional split
› PSBC and CC reflect healthy risk profile based on prudent lending standards and stable German economy
› Underlying credit losses stable throughout 2018 with H1 benefitting from write backs – H2 run-rate baseline going forward
› PSBC reflects transferred consumer finance portfolio on own balance sheet since Q3 2017
-195 -167 -168
-251
-77 -82
-133 -154
Q2 Q1 Q4 Q1 Q4 Q2 Q3 Q3
2017 2018
12 1) NPL ratio = Default volume loans held at Amortised Cost and Fair Value OCI;
Exposure at Default (in 2017 LaR loans)
2) Cost of Risk (CoR) = Risk Result / Exposure at Default (in 2017 Loan Loss Provisions)
Stephan Engels | CFO | Frankfurt | 14 February 2019
Risk Result in €m Q4 2017 Q3 2018 Q4 2018 FY 2017 FY 2018
Private and Small Business Customers -24 -69 -49 -154 -233
Corporate Clients -172 -60 -71 -295 -194
Asset & Capital Recovery -59 2 -23 -336 -8
Others & Consolidation 4 -4 -10 4 -11
Group -251 -133 -154 -781 -446
NPL in €bn
Private and Small Business Customers 1.9 1.8 1.8 1.9 1.8
Corporate Clients 2.6 1.7 1.7 2.6 1.7
Asset & Capital Recovery 1.1 0.2 0.4 1.1 0.4
Others & Consolidation - - - -
Group 5.6 3.8 3.8 5.6 3.8
Group NPL ratio (in %) ¹ 1.3 0.9 0.9 1.3 0.9
Group CoR (bps) ² 18 9 10 18 10
Highlights

Commerzbank 4.0
simple – digital – efficient
155 177 160
81 88
96
100
109 126
>400
2016 2017
382
2018 2020 2019
374
336
>390
Private and Small Business Customers: net new customer acquisition
on target – lower securities volume due to weak Q4 markets
0.1
0.6
1.0
1.5
2.0
2017 2016 2018 2020 2019
Net new customers (GER) (m cumulative)
Assets under Control (GER)
+1.0m
(€bn eop)
+18bn
Targets
Deposits
Loans
Securities
+0.4m
+46bn
13
+0.5m
Stephan Engels | CFO | Frankfurt | 14 February 2019

Commerzbank 4.0
simple – digital – efficient
191 140
380
147
203 174 186 172
Q2 Q1 Q2 Q1 Q3 Q4 Q4 Q3
Private and Small Business Customers: underlying revenue growth in
2018
Operating result
(€m)
Segmental P&L
2017 2018
in €m Q4 2017 Q3 2018 Q4 2018 FY 2017 FY 2018
Revenues 1,188 1,204 1,163 4,823 4,803
o/w Private Customers 598 610 581 2,243 2,392
o/w Small Business Customers 199 200 206 775 804
o/w mBank 260 265 257 998 1,040
o/w comdirect 103 95 95 378 389
o/w Commerz Real 56 56 46 219 222
o/w exceptional revenue items -29 -22 -23 210 -44
Revenues excl. exceptional items 1,216 1,226 1,185 4,613 4,847
Risk result (2017: LLP) -24 -69 -49 -154 -233
Operating expenses 1,016 949 941 3,811 3,835
Operating profit 147 186 172 858 735
RWA (end of period in €bn) 38.5 40.5 41.4 38.5 41.4
CIR (%) 85.6 78.8 81.0 79.0 79.8
Operating return on equity (%) 12.5 15.5 14.1 19.0 15.5
14 Stephan Engels | CFO | Frankfurt | 14 February 2019
› FY €234m (5%) increase of underlying revenues with all subdivisions contributing
› Q4 underlying revenues below Q3 – increased NII (+€17m) more than offset by lower NCI impacted by weak markets and fair
value result
› YoY loan volume in German mortgage business up 9% to €75.6bn and consumer finance book at €3.6bn
Highlights

Commerzbank 4.0
simple – digital – efficient
Corporate Clients: Further customer growth and increased loan volume
1.3
5.4
8.9
2016 2017 2018
>10.0
2019
>9.4
2020
1) Calculation based on RWA and operating revenues before Risk Result (LLP in 2016, 2017), XVA and OCS
– both excluding discontinued EMC business
2) Volumes Mittelstand and International Corporates
Net new customers (k cumulative)
+1.1k
+4.1k
Loan Volume Corporates2
(€bn)
15
+3.5k
Q4
2016
Q4
2018
>85
Q4
2017
Dec
2019
Dec
2020
75
78
82 >83
Stephan Engels | CFO | Frankfurt | 14 February 2019
Revenues/RWA1
(%)
2017
3.8
2016 2018 2019 2020
3.7
3.9 3.9
4.2
+30bp
+20bp
+7bn
+3bn

Commerzbank 4.0
simple – digital – efficient
221 197
223
34
102
221 184
122
Q4 Q1 Q2 Q3 Q1 Q3 Q4 Q2
Corporate Clients: solid result considering ongoing margin pressure
Operating result (€m)
Segmental P&L
2017 2018
16 Stephan Engels | CFO | Frankfurt | 14 February 2019
› Underlying revenues in Q4 slightly above Q3 in a challenging market environment driven by slightly higher NII reflecting the
resilient business model
› Loan growth based on prudent lending standards
› Financial Institutions continues positive development
› FY International Corporates and Mittelstand reflecting margin competition and subdued demand for capital markets products
Highlights
in €m Q4 2017 Q3 2018 Q4 2018 FY 2017 FY 2018
Revenues 893 865 808 3,613 3,451
o/w Mittelstand 463 456 449 1,864 1,766
o/w International Corporates 215 206 232 889 877
o/w Financial Institutions 103 116 121 458 474
o/w others 115 73 54 373 377
o/w exceptional revenue items -3 15 -49 29 -43
Revenues excl. exceptional items 896 850 857 3,584 3,495
Risk result (2017: LLP) -172 -60 -71 -295 -194
Operating expenses 687 620 615 2,642 2,628
Operating profit 34 184 122 676 629
Pre-tax profit discontinued operations 16 -15 -30 118 -15
RWA (end of period in €bn) 88.1 97.4 97.6 88.1 97.6
CIR (%) 76.9 71.7 76.1 73.1 76.2
Operating return on equity (%) 1.3 6.6 4.3 6.0 5.8

Commerzbank 4.0
simple – digital – efficient
-33
-82 -94
-54
16
60
14
-56
Q2 Q4 Q3 Q1 Q2 Q4 Q1 Q3
Asset & Capital Recovery: operating result driven by valuation effects
Operating result (€m)
Segmental P&L
› Operating result reflecting reduced portfolio size and valuation effects
› Reduction of legacy positions progressing with an EaD reduction of €5bn in 2018
› Well marked Shipping portfolio below €500m and fewer than 60 ships financed
2017 2018
17 Stephan Engels | CFO | Frankfurt | 14 February 2019
in €m Q4 2017 Q3 2018 Q4 2018 FY 2017 FY 2018
Revenues 24 28 -20 170 114
Revenues excl. exceptional items 54 2 22 75 103
Risk result (2017: LLP) -59 2 -23 -336 -8
Operating expenses 19 16 12 98 72
Operating profit -54 14 -56 -264 34
RWA (end of period in €bn) 18.0 12.6 12.1 18.0 12.1
CRE (EaD in €bn) 1.5 0.9 0.9 1.5 0.9
Ship Finance (EaD in €bn) 2.6 0.8 0.4 2.6 0.4
Public Finance (EaD in €bn) 10.0 7.5 7.7 10.0 7.7
Group Ship Finance (EaD in €bn) 3.4 1.1 0.5 3.4 0.5
Highlights

Commerzbank 4.0
simple – digital – efficient
Capital ratio of 12.9% due to growth and increased capital deductions
› Stable Market Risk RWA in line with business model
› Higher Credit RWA driven by increased lending in PSBC and CC
› Capital change driven by lower discount rate and reduced valuations of pension plan assets due to weak Q4 markets
› Capital incorporates €0.20 per share dividend accrual
0.2
0.1
Capital
change
RWA
change
01 Jan 181 Q3 2018 Q4 2018
12.9
13.3 13.2
18 Stephan Engels | CFO | Frankfurt | 14 February 2019 1) After application of IFRS 9
Highlights
Transition of CET1 ratio (%) (€bn eop)
135 144 147
22 21 21
171 13
Q3 2018
2
180
Q4 2017
12 12
Q4 2018
178
Market Risk
Operational Risk
Credit Risk
Pro forma IFRS 9 effect
RWA development by RWA classification

Commerzbank 4.0
simple – digital – efficient
Objectives and expectations for 2019
2019 – Outlook
We continue our growth strategy and expect higher underlying revenues
We plan to maintain a dividend at level comparable to 2018
We expect a Risk Result not below €550m
We target a cost base below €6.8bn
Stephan Engels | CFO | Frankfurt | 14 February 2019 19
We target a CET1 ratio ≥12.75% in line with anticipated SREP requirements

Commerzbank 4.0
simple – digital – efficient
We continue with the implementation of Commerzbank 4.0 – Strategic
outlook towards 2020
We further intensify our digitalisation efforts with
Campus 2.0 – contributing to our targeted cost
base of €6.5bn in 2020
We pursue our strategy based on a simplified
business model and high quality balance sheet
Stephan Engels | CFO | Frankfurt | 14 February 2019 20
We continue our growth strategy in a challenging
macro environment – targeting average revenue
growth of 3% p.a.

Commerzbank 4.0
simple – digital – efficient
Commerzbank 4.0
simple – digital – efficient
21 Stephan Engels | CFO | Frankfurt | 14 February 2019

Commerzbank 4.0
simple – digital – efficient
Appendix
Commerzbank Group
Risk & Capital Management
Funding & Rating
P&L Tables
Other Information
Commerzbank financials at a glance 24
Key figures Commerzbank share 25
Key execution indicators 26
Digitalisation progress 27
Loan and Deposit volumes 28
Scenario: NII sensitivity 29
IAS 19 32
Exchange rate development effects on capital 33
Group equity composition 43
Glossary – capital allocation & return calculation 44
Funding structure 30
Rating overview 31
Commerzbank Group 36
Private and Small Business Customers 37
Corporate Clients 38
Asset & Capital Recovery 39
Others & Consolidation 40
mBank 41
Exceptional Revenue Items 42
German economy 23
Residential mortgage business 34
Corporate responsibility 35
22 Stephan Engels | CFO | Frankfurt | 14 February 2019

Commerzbank 4.0
simple – digital – efficient
German economy 2019 – ongoing upswing
› In the course of 2018 the German economy significantly lost momentum, and
the ongoing downward trend of the sentiment indicators signals that this soft
patch is not yet over.
› The main reasons are probably the temporarily stronger Euro and less
dynamic demand from Asia. The US trade policy and the Brexit might have
been an additional burden for the economy.
› In contrast, the internal demand has grown further driven by the ECB’s still
very expansionary monetary policy.
Current
development
› As long as risks do not materialise, e.g. no global trade war, a recession is
unlikely because of the still expansionary stance of monetary policy.
› In the further course of the year somewhat stronger demand in some parts of
the world economy (especially in China based on the government’s stimulus
measures) will probably even lead to a little bit higher QoQ growth rates of
the German economy. This should be signalled by an improvement of
sentiment indicators starting in spring.
› On average the German economy will expand by 1.2% in 2019 (after 1.5% in
2018) which would be roughly in line with the long-term growth potential.
Our expectation
for 2019
› The export oriented German economy could suffer especially from rising
protectionism initiated by the US government.
› In the medium term EMs – a very important market for German exports –
could grow more slowly than in the past.
› Germany’s price and non-price competitiveness within the Euro area has
eroded since 2009.
› Economic policy has been geared more towards redistribution of wealth than
support for growth, and this will not change with the current government.
Risks in the
long-run
DAX (avg. p.a.)
Euribor (avg. p.a. in %)
GDP (change vs. previous year in %)
23 Stephan Engels | CFO | Frankfurt | 14 February 2019
10,957 10,196 12,431 12,272
11,800
2016 2015 2017 2019e 2018
-0.02
-0.32 -0.32 -0.30 -0.26
2017 2015 2019e 2016 2018
1.7 1.9 2.2 1.5 1.2
2.0 1.8 2.6
1.9 1.4
2019e 2015 2016 2017 2018
Germany
Eurozone

Commerzbank 4.0
simple – digital – efficient
Commerzbank financials at a glance
24 Stephan Engels | CFO | Frankfurt | 14 February 2019
Group Q4 2017 Q3 2018 Q4 2018 FY 2017 FY 2018
Operating result (€m) 122 346 240 1,149 1,245
Net result (€m) 75 218 113 128 865
CET1 ratio Basel 3 fully phased-in (%)¹ 14.1 13.2 12.9 14.1 12.9
Total assets (€bn) 452 493 462 452 462
RWA B3 fully phased-in (€bn) 171 178 180 171 180
Leverage ratio fully phased-in (%) 5.1 4.5 4.8 5.1 4.8
Cost/income ratio (%) 82.3 77.6 80.6 78.0 80.3
Net RoE (%) 1.0 3.1 1.6 0.4 3.1
Net RoTE (%) 1.2 3.5 1.8 0.5 3.4
Total capital ratio fully phased-in (%)¹ 17.5 16.4 15.9 17.5 15.9
NPL ratio (in %) 1.3 0.9 0.9 1.3 0.9
CoR (bps) 18 9 10 18 10
1) Includes net result of Q4 2018 reduced by dividend accrual

Commerzbank 4.0
simple – digital – efficient
1.1
0.9 1.0
0.2 0.1
0.7
FY 2018 FY 2016 FY 2017
Operating result per share
EPS
Key figures Commerzbank share
Stephan Engels | CFO | Frankfurt | 14 February 2019 25
Figures per share (€)
ytd as of 31 Dec 2016 31 Dec 2017 31 Dec 2018
Number of shares issued (in m) 1,252.4 1,252.4 1,252.4
Market capitalisation (in €bn) 9.1 15.7 7.2
Net asset value per share (in €) 21.69 21.88 21.34
Low/high Xetra intraday prices YtD (in €) 5.16/9.50 6.97/12.96 5.50/13.82

Commerzbank 4.0
simple – digital – efficient
Key Execution Indicators
26
Growth
Digitali-
sation
PSBC
CC
2016 2018
Net new customers
(GER)1
(m cumulated)
Target 2020
Assets under Control
(GER) (€bn eop)
Net new customers2
(k cumulated)
Loan Volume
Corporates (€bn)
Digitalisation ratio (%)
Group
1) Since 10/2016
2) Since 01/2016
0.1
1.0 1.5
2.0
Target 2019
382 >400 >390
336
1.3
8.9 >10.0 >9.4
75
>85 82 >83
36
59 75 80
+7.6
+46
+0.9
+7
+23
eop = end of period Stephan Engels | CFO | Frankfurt | 14 February 2019

Commerzbank 4.0
simple – digital – efficient
Digitalisation progress in Commerzbank 4.0
27 CLM = Customer Lifecycle
Management
Master Journeys
Support Journeys
Payment Transactions / Trade Finance Loans Asset Management
Yellow Harvey balls = planned
progress by YE 2019
Grey Harvey balls = planned
progress by YE 2020
Digitalisation of end-to-end processes in Digital Campus
Credit
Corporate Securities
Retail
Payments Consumer
Credit Mortgages
2019 2020
Big Data &
Adv. Analytics
Digital
Authorisation
API Banking
Credit SME
Journey
completed
Cross Channel
Banking
Stephan Engels | CFO | Frankfurt | 14 February 2019
Global Digital
Archive
Trade Finance
& Services
Trade Finance
& Services
Accounts &
CLM Corp
Accounts
& CLM Retail
2020 2019 2020 2019
2019 2020 2019
2020 2019 2019 2020

Commerzbank 4.0
simple – digital – efficient
98 97 83 83
Dec-18 Sep-18
112 115
141 145
Sep-18 Dec-18
Continuing loan and deposit growth
PSBC Corporate Clients (€bn) (€bn)
Loan volume
Deposit volume
Loan volume
Deposit volume
› Loan growth in Private and Small Business Customers mainly driven by mortgage business in Germany and mBank’s loan
book
› Corporate Clients loan volume slightly lower with growth in corporate customers more than balanced by reductions with
Financial Institutions and legacy books
28 Stephan Engels | CFO | Frankfurt | 14 February 2019
Highlights

Commerzbank 4.0
simple – digital – efficient
500-550
900-1,000
Significant NII potential in scenario of rising interest rates
100 bp parallel up-shift in rates yield curve Scenario impact on NII (€m) (as of 31 December 2018, in %)
› Year 1 effect of €500-550m driven by short-end rates due to large stock of overnight (excess) deposits
› Thereof ~1/3 stem from leaving the negative interest rate territory
› Year 4 effect of €900-1,000m driven by higher reinvestment yield of modelled deposits used to refinance longer term loans
Year 1 Year 4 0Y 2Y 4Y 6Y 8Y 10Y
0.0
-0.5
1.0
0.5
2.0
1.5
29 Stephan Engels | CFO | Frankfurt | 14 February 2019
Highlights
Commerzbank 4.0
simple – digital – efficient
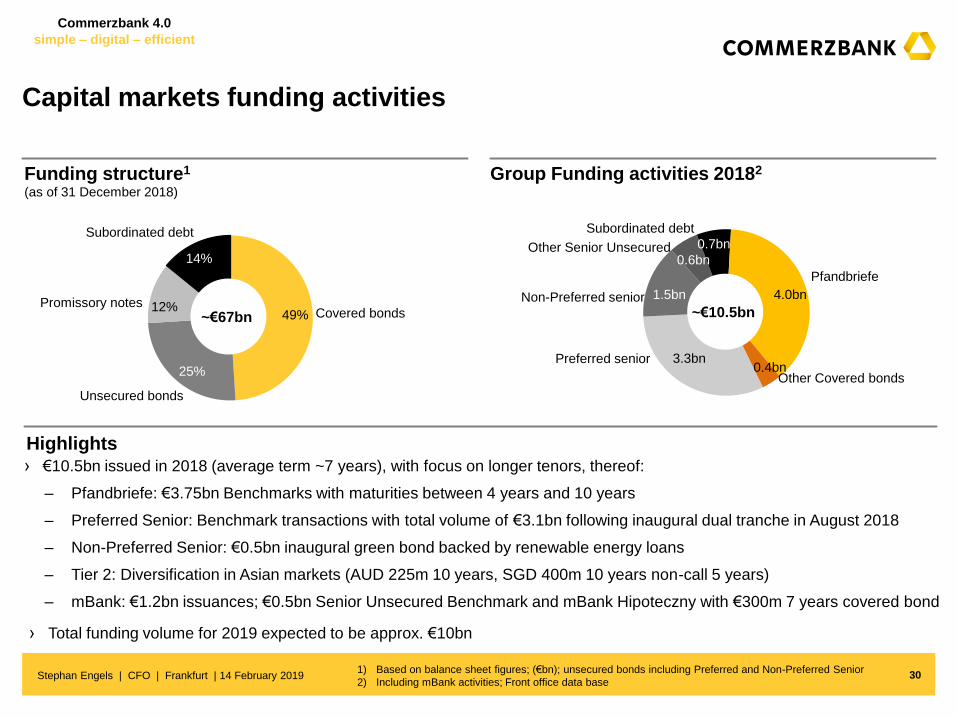
Capital markets funding activities
Funding structure1
› €10.5bn issued in 2018 (average term ~7 years), with focus on longer tenors, thereof:
– Pfandbriefe: €3.75bn Benchmarks with maturities between 4 years and 10 years
– Preferred Senior: Benchmark transactions with total volume of €3.1bn following inaugural dual tranche in August 2018
– Non-Preferred Senior: €0.5bn inaugural green bond backed by renewable energy loans
– Tier 2: Diversification in Asian markets (AUD 225m 10 years, SGD 400m 10 years non-call 5 years)
– mBank: €1.2bn issuances; €0.5bn Senior Unsecured Benchmark and mBank Hipoteczny with €300m 7 years covered bond
Group Funding activities 20182
Promissory notes 12%
14%
Unsecured bonds
25%
Covered bonds 49%
Subordinated debt
~€67bn
(as of 31 December 2018)
1) Based on balance sheet figures; (€bn); unsecured bonds including Preferred and Non-Preferred Senior
2) Including mBank activities; Front office data base 30 Stephan Engels | CFO | Frankfurt | 14 February 2019
Highlights
› Total funding volume for 2019 expected to be approx. €10bn
3.3bn
1.5bn
0.6bn
0.7bn
4.0bn
0.4bn
~€10.5bn
Pfandbriefe
Other Covered bonds
Subordinated debt
Preferred senior
Non-Preferred senior
Other Senior Unsecured

Commerzbank 4.0
simple – digital – efficient
Rating overview Commerzbank
Rating events 2018
As of 14 February 2019
Bank Ratings S&P Moody’s Fitch Scope
Counterparty Rating/ Assessment1 A A1/ A1 (cr) A- (dcr) -
Deposit Rating2 A- negative A1 stable A- -
Issuer Credit Rating (long-term debt) A- negative A1 stable BBB+ stable A stable
Stand-alone Rating (financial strength) bbb+ baa2 bbb+ -
Short-term debt A-2 P-1 F2 S-1
Product Ratings (unsecured issuances)
Preferred senior unsecured debt A- negative A1 stable A- A stable
Non-preferred senior unsecured debt BBB Baa1 BBB+ stable A- stable
Subordinated debt (Tier 2) BBB- Baa3 BBB BBB stable
1) Includes client business (i.e. counterparty for derivatives)
2) Includes corporate and institutional deposits 31 Stephan Engels | CFO | Frankfurt | 14 February 2019
› Q2 2018: Moody’s assigned the new Counterparty Risk Rating of “A2”. S&P Global assigned the new Resolution Counterparty
Rating of “A”
› Q3 2018: Moody’s upgraded counterparty risk rating, deposit rating and “preferred” senior unsecured debt rating to “A1” and
subordinated debt rating to “Baa3” triggered by an uplift of the stand-alone Rating by 1 Notch to “baa2”
Methodical change: issuer credit rating positioned at “preferred” senior unsecured rating level and increased therefore by 3
notches to “A1”
› Fitch confirmed Commerzbank’s ratings in a regular rating review in January 2019
Rating events 2019
Commerzbank 4.0
simple – digital – efficient
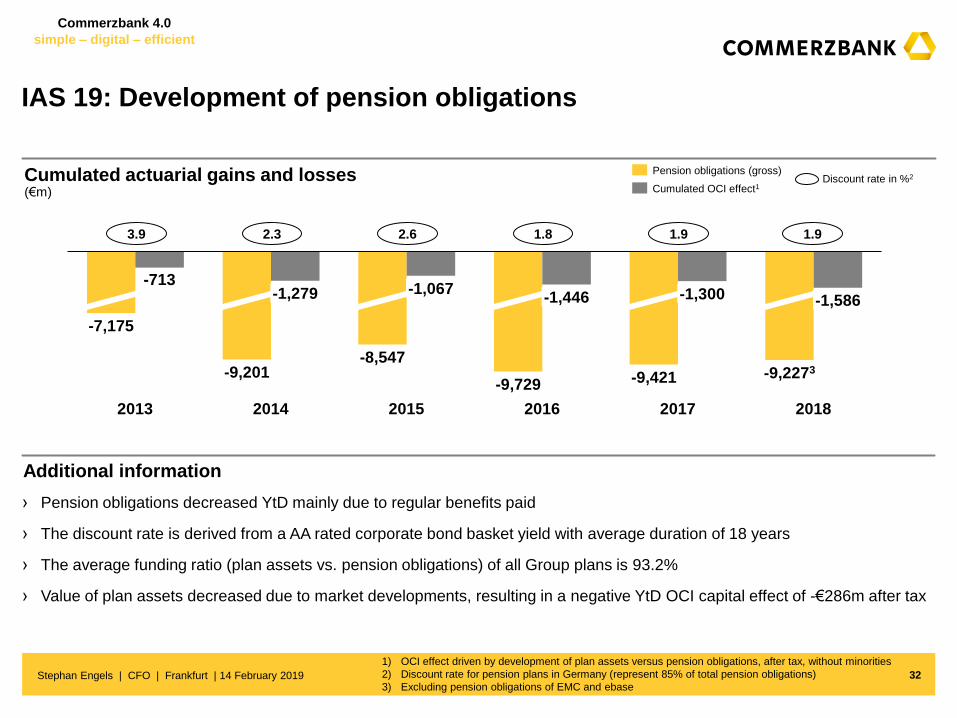
IAS 19: Development of pension obligations
(€m)
› Pension obligations decreased YtD mainly due to regular benefits paid
› The discount rate is derived from a AA rated corporate bond basket yield with average duration of 18 years
› The average funding ratio (plan assets vs. pension obligations) of all Group plans is 93.2%
› Value of plan assets decreased due to market developments, resulting in a negative YtD OCI capital effect of -€286m after tax
Cumulated OCI effect1
Pension obligations (gross)
3.9 2.6 2.3 1.8 1.9
Discount rate in %2
1) OCI effect driven by development of plan assets versus pension obligations, after tax, without minorities
2) Discount rate for pension plans in Germany (represent 85% of total pension obligations)
3) Excluding pension obligations of EMC and ebase
-713
2013 2014 2018 2015 2016 2017
-7,175
-9,201
-1,279
-8,547
-1,067
-9,729
-1,446
-9,421
-1,300
-9,2273
-1,586
Cumulated actuarial gains and losses
32
1.9
Stephan Engels | CFO | Frankfurt | 14 February 2019
Additional information

Commerzbank 4.0
simple – digital – efficient
Strengthening of USD with net negative impact on capital ratio
33
QoQ Change in FX capital position
› QoQ the EUR weakened by -1.1% against the USD resulting in +€0.3bn higher Credit Risk RWA
› Due to USD strengthening the currency translation reserve for USD increased by +€10m impacting the CET1 ratio
› Negative impact of USD strengthening on CET1 ratio due to higher Credit Risk RWA not compensated by increasing currency
translation reserve in USD
Credit RWA1
( QoQ in €m)
Currency
translation reserve
( QoQ in €m)
-85
-62
+309
-5
-13
+10
Credit RWA
(Q4 2018 €bn)
26.4
11.5
10.4
9.7
88.7
146.7
PLN
Other
EUR
GBP
USD
FX rates 09/18 12/18
EUR/ GBP 0.887 0.895
EUR/ PLN 4.277 4.301
EUR/ USD 1.158 1.145
1) Change in RWA solely based on FX not on possible volume effects since 09/18
Explanation
Stephan Engels | CFO | Frankfurt | 14 February 2019
Commerzbank 4.0
simple – digital – efficient
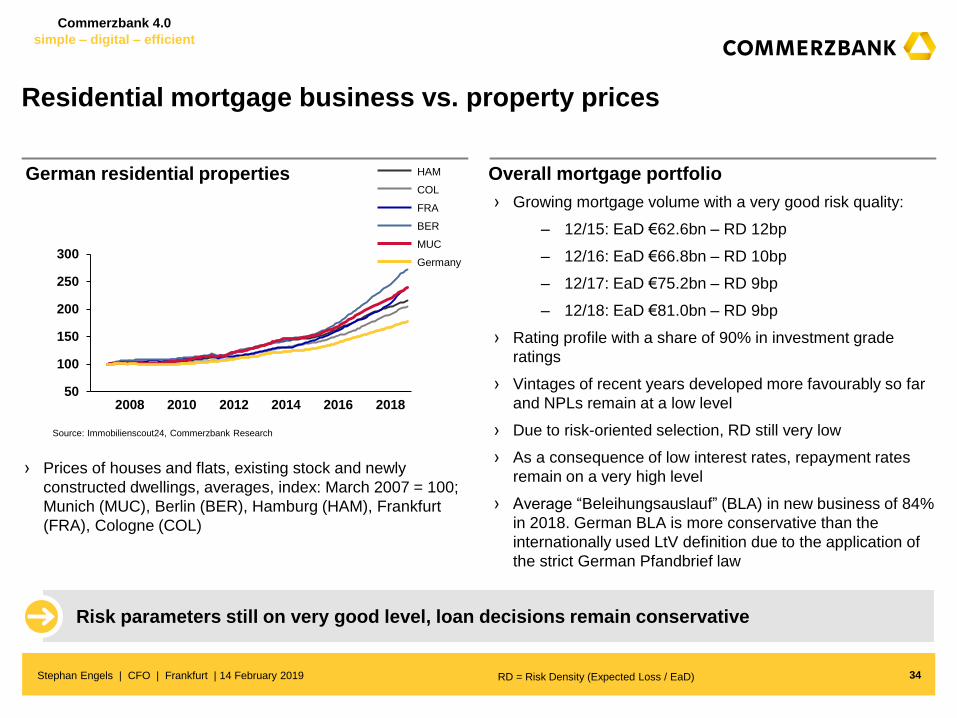
Residential mortgage business vs. property prices
RD = Risk Density (Expected Loss / EaD)
German residential properties Overall mortgage portfolio
50
100
150
200
250
300
2008 2014 2010 2012 2018 2016
HAM
COL
FRA
MUC
BER
Germany
Source: Immobilienscout24, Commerzbank Research
› Growing mortgage volume with a very good risk quality:
– 12/15: EaD €62.6bn – RD 12bp
– 12/16: EaD €66.8bn – RD 10bp
– 12/17: EaD €75.2bn – RD 9bp
– 12/18: EaD €81.0bn – RD 9bp
› Rating profile with a share of 90% in investment grade
ratings
› Vintages of recent years developed more favourably so far
and NPLs remain at a low level
› Due to risk-oriented selection, RD still very low
› As a consequence of low interest rates, repayment rates
remain on a very high level
› Average “Beleihungsauslauf” (BLA) in new business of 84%
in 2018. German BLA is more conservative than the
internationally used LtV definition due to the application of
the strict German Pfandbrief law
› Prices of houses and flats, existing stock and newly
constructed dwellings, averages, index: March 2007 = 100;
Munich (MUC), Berlin (BER), Hamburg (HAM), Frankfurt
(FRA), Cologne (COL)
Risk parameters still on very good level, loan decisions remain conservative
34 Stephan Engels | CFO | Frankfurt | 14 February 2019

Commerzbank 4.0
simple – digital – efficient
We are a leading German provider of Renewable Energy Project Finance
funding and will become Germany’s most sustainable commercial bank
Stephan Engels | CFO | Frankfurt | 14 February 2019
3.5 3.8 4.0 4.1 4.2 4.2
2018 2016 2014 2013 2015 2017
+20%
69%
invested in Germany
31%
invested globally
35
Renewable Energy Project Finance Portfolio (Exposure at Default, €bn end of period)
Portfolio Breakdown
Commerzbank’s Sustainability Ratings1
1) ISS QualityScore as of 3 December 2018
A B
Prime
(C)
Outper-
former
Low
Risk
(75 / 100 points) Sector Average: D+ Environment: 1
Social: 1
69%
12%
19%
1%
Wind Onshore Wind Offshore Solar Others
€4.2bn

Commerzbank 4.0
simple – digital – efficient
Commerzbank Group
€mQ1
2017
Q2
2017
Q3
2017
Q4
2017
FY
2017
Q1
2018
Q2
2018
Q3
2018
Q4
2018
FY
2018
Total clean revenues 2,160 1,956 1,926 2,165 8,208 2,216 2,160 2,122 2,151 8,648
Exceptional items 108 8 502 -60 557 1 18 18 -115 -78
Total revenues 2,268 1,964 2,428 2,105 8,764 2,217 2,178 2,140 2,035 8,570
o/w Net interest income 1,064 1,035 1,065 1,132 4,295 1,098 1,190 1,223 1,237 4,748
o/w Net commission income 889 786 739 778 3,192 802 763 771 754 3,089
o/w Net fair value result 266 149 137 46 598 203 200 85 -121 366
o/w Other income 49 -5 486 149 679 115 25 62 166 367
o/w Dividend income 28 27 17 34 106 14 6 9 6 36
o/w Net income from hedge accounting -33 -53 -7 8 -85 -16 36 6 22 48
o/w Other result from realisation and measurement (2017 only) -3 -14 -29 -29 -76 - - - - -
o/w Other f inancial result 47 25 83 89 244 -19 3 6 35 26
o/w At equity result 7 9 5 2 23 6 3 1 2 12
o/w Other net income 3 1 417 45 466 129 -24 40 101 245
Risk result (2017: Provision for possible loan losses) -195 -167 -168 -251 -781 -77 -82 -133 -154 -446
Operating expenses 1,795 1,656 1,652 1,731 6,834 1,882 1,694 1,661 1,641 6,879
o/w European bank levy / Polish banking tax 179 37 22 18 256 209 23 17 23 273
Operating profit 278 141 609 122 1,149 258 401 346 240 1,245
Restructuring expenses - 807 - - 808 - - - - -
Pre-tax profit discontinued operations 49 39 14 16 118 42 -12 -15 -30 -15
Pre-tax profit Commerzbank Group 326 -628 623 137 459 301 389 331 210 1,230
Taxes on income 81 -13 134 35 237 5 94 89 75 262
Minority Interests 20 25 21 27 94 34 23 24 22 103
Consolidated Result attributable to Commerzbank shareholders 226 -640 467 75 128 262 272 218 113 865
Total Assets 490,262 487,266 489,925 452,495 452,495 470,013 487,518 493,203 462,369 462,369
o/w Discontinued operations - - - - - - - - 12,996 12,996
Average capital employed 23,375 23,390 23,463 24,074 23,609 22,468 22,640 23,097 23,399 22,886
RWA credit risk (end of period) 144,074 140,530 138,204 136,155 136,155 136,014 141,648 142,633 145,229 145,229
RWA market risk (end of period) 19,159 16,395 14,333 12,090 12,090 10,987 10,673 11,507 10,801 10,801
RWA operational risk (end of period) 21,669 20,549 22,722 21,041 21,041 21,090 21,297 21,685 21,393 21,393
RWA (end of period) continued operations 184,903 177,474 175,259 169,285 169,285 168,091 173,618 175,825 177,423 177,423
RWA (end of period) discontinued operations 1,259 989 1,338 1,734 1,734 1,999 1,890 2,535 3,075 3,075
RWA (end of period) 186,162 178,464 176,597 171,019 171,019 170,090 175,508 178,360 180,498 180,498
Cost/income ratio (%) 79.2% 84.3% 68.0% 82.3% 78.0% 84.9% 77.8% 77.6% 80.6% 80.3%
Operating return on CET1 (%) 4.8% 2.4% 10.4% 2.0% 4.9% 4.6% 7.1% 6.0% 4.1% 5.4%
Operating return on tangible equity (%) 4.1% 2.1% 9.1% 1.8% 4.3% 4.0% 6.1% 5.3% 3.6% 4.8%
Return on equity of net result (%) 3.2% -8.9% 6.6% 1.0% 0.4% 3.8% 3.9% 3.1% 1.6% 3.1%
Net return on tangible equity (%) 3.5% -9.8% 7.3% 1.2% 0.5% 4.2% 4.3% 3.5% 1.8% 3.4%
36 Stephan Engels | CFO | Frankfurt | 14 February 2019

Commerzbank 4.0
simple – digital – efficient
Private and Small Business Customers
€mQ1
2017
Q2
2017
Q3
2017
Q4
2017
FY
2017
Q1
2018
Q2
2018
Q3
2018
Q4
2018
FY
2018
Total clean revenues 1,165 1,108 1,123 1,216 4,613 1,211 1,225 1,226 1,185 4,847
Exceptional items - 1 237 -29 210 25 -25 -22 -23 -44
Total revenues 1,165 1,110 1,360 1,188 4,823 1,236 1,200 1,204 1,163 4,803
o/w Net interest income 567 574 583 627 2,351 616 644 649 667 2,576
o/w Net commission income 543 476 464 488 1,971 508 471 483 465 1,927
o/w Net fair value result 39 36 37 36 148 32 54 48 26 160
o/w Other income 16 24 277 36 354 80 32 24 4 140
o/w Dividend income 4 7 4 9 24 2 2 7 -1 10
o/w Net income from hedge accounting - -1 -1 -1 -2 - -1 -1 1 -1
o/w Other result from realisation and measurement (2017 only) - -3 -1 -8 -12 - - - - -
o/w Other f inancial result 6 6 93 16 119 11 20 9 8 48
o/w At equity result - 2 - - 2 - 1 -1 - -
o/w Other net income 7 14 182 21 224 67 10 10 -5 83
Risk result (2017: Provision for possible loan losses) -33 -43 -55 -24 -154 -49 -66 -69 -49 -233
Operating expenses 941 927 926 1,016 3,811 984 961 949 941 3,835
o/w European bank levy / Polish banking tax 63 27 22 23 136 71 23 24 24 141
Operating profit 191 140 380 147 858 203 174 186 172 735
Restructuring expenses - - - - - - - - - -
Pre-tax profit 191 140 380 147 858 203 174 186 172 735
Total Assets 120,494 123,068 125,528 128,280 128,280 130,561 131,846 136,646 138,409 138,409
Liabilities 143,656 147,131 149,196 152,028 152,028 155,262 160,259 164,992 169,933 169,933
Average capital employed 4,327 4,389 4,619 4,704 4,509 4,633 4,676 4,787 4,902 4,751
RWA credit risk (end of period) 28,604 30,927 32,351 32,591 32,591 32,897 33,529 34,643 35,523 35,523
RWA market risk (end of period) 845 786 831 851 851 876 782 802 780 780
RWA operational risk (end of period) 6,424 6,010 6,023 5,092 5,092 5,024 5,012 5,033 5,111 5,111
RWA (end of period) 35,873 37,722 39,205 38,534 38,534 38,797 39,323 40,478 41,414 41,414
Cost/income ratio (%) 80.8% 83.6% 68.0% 85.6% 79.0% 79.6% 80.0% 78.8% 81.0% 79.8%
Operating return on CET1 (%) 17.7% 12.8% 32.9% 12.5% 19.0% 17.5% 14.8% 15.5% 14.1% 15.5%
Operating return on tangible equity (%) 16.9% 12.3% 31.8% 12.2% 18.4% 17.2% 14.6% 15.1% 13.8% 15.1%
37 Stephan Engels | CFO | Frankfurt | 14 February 2019

Commerzbank 4.0
simple – digital – efficient
Corporate Clients
38 Stephan Engels | CFO | Frankfurt | 14 February 2019
€mQ1
2017
Q2
2017
Q3
2017
Q4
2017
FY
2017
Q1
2018
Q2
2018
Q3
2018
Q4
2018
FY
2018
Total clean revenues 953 853 882 896 3,584 872 916 850 857 3,495
Exceptional items 32 -8 9 -3 29 -1 -8 15 -49 -43
Total revenues 985 845 891 893 3,613 871 908 865 808 3,451
o/w Net interest income 498 437 444 458 1,837 426 444 464 484 1,818
o/w Net commission income 351 321 281 305 1,258 300 298 295 299 1,191
o/w Net fair value result 125 64 161 126 475 108 193 101 21 422
o/w Other income 11 23 4 4 42 38 -28 5 5 21
o/w Dividend income 18 3 2 2 25 10 -3 5 3 14
o/w Net income from hedge accounting -1 -2 - 2 - -1 2 -1 3 3
o/w Other result from realisation and measurement (2017 only) -7 -4 -9 -18 -38 - - - - -
o/w Other f inancial result -1 5 -1 10 12 1 -2 -5 -16 -22
o/w At equity result 7 7 5 2 21 6 2 2 2 12
o/w Other net income -5 14 7 5 21 22 -27 5 13 14
Risk result (2017: Provision for possible loan losses) -43 -33 -47 -172 -295 -25 -37 -60 -71 -194
Operating expenses 720 614 620 687 2,642 744 650 620 615 2,628
o/w European bank levy 83 4 - -5 82 91 - -7 - 84
Operating profit 221 197 223 34 676 102 221 184 122 629
Restructuring expenses - - - - - - - - - -
Pre-tax profit discontinued operations 49 39 14 16 118 42 -12 -15 -30 -15
Pre-tax profit (total) 270 236 237 50 794 144 209 169 92 614
Total Assets 208,694 198,179 189,753 173,011 173,011 176,752 187,193 189,891 179,330 179,330
o/w Discontinued operations - - - - - - - - 12,996 12,996
Liabilities 235,082 231,222 215,009 196,709 196,709 195,180 196,613 193,378 178,988 178,988
o/w Discontinued operations - - - - - - - - 12,375 12,375
Average capital employed 12,099 11,256 10,938 10,664 11,254 10,414 10,648 11,127 11,346 10,870
RWA credit risk (end of period) 78,444 75,213 74,690 72,332 72,332 72,449 76,507 78,247 78,493 78,493
RWA market risk (end of period) 8,442 7,217 5,862 4,614 4,614 4,635 4,702 5,007 4,566 4,566
RWA operational risk (end of period) 9,765 9,552 10,230 9,469 9,469 10,092 10,338 11,562 11,449 11,449
RWA (end of period) continued operations 96,651 91,982 90,782 86,415 86,415 87,176 91,547 94,817 94,507 94,507
RWA (end of period) discontinued operations 1,259 989 1,338 1,734 1,734 1,999 1,890 2,535 3,075 3,075
Cost/income ratio (%) 73.1% 72.7% 69.6% 76.9% 73.1% 85.4% 71.6% 71.7% 76.1% 76.2%
Operating return on CET1 (%) 7.3% 7.0% 8.2% 1.3% 6.0% 3.9% 8.3% 6.6% 4.3% 5.8%
Operating return on tangible equity (%) 6.7% 6.4% 7.5% 1.2% 5.5% 3.6% 7.7% 6.2% 4.1% 5.4%

Commerzbank 4.0
simple – digital – efficient
Asset & Capital Recovery
39 Stephan Engels | CFO | Frankfurt | 14 February 2019
€mQ1
2017
Q2
2017
Q3
2017
Q4
2017
FY
2017
Q1
2018
Q2
2018
Q3
2018
Q4
2018
FY
2018
Total clean revenues 24 22 -25 54 75 68 10 2 22 103
Exceptional items 91 16 18 -29 96 -23 52 26 -43 12
Total revenues 115 39 -7 24 170 45 62 28 -20 114
o/w Net interest income 34 47 27 75 183 14 16 18 12 61
o/w Net commission income - - - 1 2 - - 1 - 1
o/w Net fair value result 72 8 -11 -41 28 67 51 -6 -78 35
o/w Other income 8 -16 -24 -10 -42 -37 -6 16 45 17
o/w Dividend income - - - - - - - 1 -1 -
o/w Net income from hedge accounting -4 -17 -7 -6 -34 -5 3 2 1 1
o/w Other result from realisation and measurement (2017 only) -1 -5 -22 -5 -32 - - - - -
o/w Other f inancial result - - - 4 4 -40 -14 6 40 -7
o/w At equity result - - - - - - - - - -
o/w Other net income 13 5 5 -3 21 7 5 6 5 23
Risk result (2017: Provision for possible loan losses) -119 -92 -65 -59 -336 -2 16 2 -23 -8
Operating expenses 29 28 22 19 98 27 17 16 12 72
o/w European bank levy 5 3 - - 7 10 - - - 10
Operating profit -33 -82 -94 -54 -264 16 60 14 -56 34
Restructuring expenses - - - - - - - - - -
Pre-tax profit -33 -82 -94 -54 -264 16 60 14 -56 34
Total Assets 25,905 24,876 23,583 24,374 24,374 21,374 19,446 18,365 18,904 18,904
o/w Assets excl repos, collaterals and trading assets 11,143 9,670 8,804 9,222 9,222 9,632 8,841 8,215 7,985 7,985
Liabilities 19,599 19,368 19,264 19,903 19,903 18,735 17,040 16,316 17,034 17,034
Exposure at default 16,107 15,253 14,278 14,039 14,039 10,794 9,827 9,226 8,916 8,916
Average capital employed 3,165 3,182 2,916 2,751 2,982 2,483 2,254 2,054 1,883 2,174
RWA credit risk (end of period) 15,384 13,710 12,809 12,538 12,538 10,717 9,778 9,319 8,806 8,806
RWA market risk (end of period) 5,598 4,649 4,288 3,302 3,302 2,802 2,203 2,060 1,965 1,965
RWA operational risk (end of period) 1,786 1,720 1,968 2,127 2,127 2,334 2,386 1,263 1,305 1,305
RWA (end of period) 22,768 20,079 19,064 17,967 17,967 15,853 14,367 12,643 12,075 12,075

Commerzbank 4.0
simple – digital – efficient
Others & Consolidation
40 Stephan Engels | CFO | Frankfurt | 14 February 2019
€mQ1
2017
Q2
2017
Q3
2017
Q4
2017
FY
2017
Q1
2018
Q2
2018
Q3
2018
Q4
2018
FY
2018
Total clean revenues 18 -28 -54 -1 -65 65 9 43 86 204
Exceptional items -15 -1 238 1 222 - - -1 -1 -2
Total revenues 3 -29 184 - 158 66 8 43 85 202
o/w Net interest income -35 -22 10 -28 -75 42 85 93 73 293
o/w Net commission income -5 -12 -6 -15 -38 -7 -6 -8 -10 -30
o/w Net fair value result 30 41 -49 -75 -53 -4 -98 -58 -90 -251
o/w Other income 14 -36 229 118 325 34 27 16 112 189
o/w Dividend income 6 17 12 22 57 3 8 -4 5 12
o/w Net income from hedge accounting -28 -34 1 13 -49 -11 33 6 17 46
o/w Other result from realisation and measurement (2017 only) 5 -3 2 2 6 - - - - -
o/w Other f inancial result 43 14 -9 60 109 9 - -4 3 7
o/w At equity result - - - - - - - - - -
o/w Other net income -12 -31 223 22 201 33 -13 18 87 125
Risk result (2017: Provision for possible loan losses) - - - 4 4 -1 5 -4 -10 -11
Operating expenses 105 86 84 9 284 127 67 76 73 344
o/w European bank levy 28 2 - 1 31 37 - - - 37
Operating profit -102 -115 100 -5 -122 -62 -54 -38 2 -153
Restructuring expenses - 807 - - 808 - - - - -
Pre-tax profit -102 -922 100 -6 -929 -62 -54 -38 2 -153
Total Assets 135,169 141,143 151,060 126,831 126,831 141,326 149,033 148,301 125,727 125,727
Liabilities 91,924 89,545 106,456 83,856 83,856 100,836 113,606 118,517 96,415 96,415
Average capital employed 3,783 4,563 4,989 5,956 4,864 4,941 5,061 5,129 5,268 5,091
RWA credit risk (end of period) 21,643 20,680 18,354 18,694 18,694 19,950 21,834 20,423 22,408 22,408
RWA market risk (end of period) 4,274 3,743 3,352 3,323 3,323 2,674 2,986 3,638 3,490 3,490
RWA operational risk (end of period) 3,695 3,267 4,502 4,352 4,352 3,640 3,561 3,827 3,529 3,529
RWA (end of period) 29,612 27,690 26,207 26,369 26,369 26,264 28,381 27,887 29,427 29,427

Commerzbank 4.0
simple – digital – efficient
mBank Part of Segment Private and Small Business Customers
€mQ1
2017
Q2
2017
Q3
2017
Q4
2017
FY
2017
Q1
2018
Q2
2018
Q3
2018
Q4
2018
FY
2018
Total clean revenues 241 243 254 260 998 253 265 265 257 1,040
Exceptional items - - - - - 52 - - -1 52
Total revenues 241 243 254 261 998 305 265 266 257 1,092
o/w Net interest income 143 151 160 166 619 158 167 172 176 673
o/w Net commission income 59 61 62 58 239 65 59 56 52 233
o/w Net fair value result 36 32 33 34 135 31 40 38 22 131
o/w Other income 3 -1 -1 4 5 51 - -1 6 55
o/w Dividend income - 1 - - 1 - 1 - - 1
o/w Net income from hedge accounting - -1 -1 -1 -2 - -1 -1 1 -1
o/w Other result from realisation and measurement (2017 only) - -3 - - -3 - - - - -
o/w Other f inancial result - -1 -2 4 1 1 - - 2 4
o/w At equity result - - - - - - - - - -
o/w Other net income 2 4 2 - 9 49 1 - 2 52
Risk result (2017: Provision for possible loan losses) -19 -28 -38 -33 -119 -18 -48 -35 -20 -121
Operating expenses 155 146 142 152 595 173 149 154 149 625
o/w European bank levy / Polish banking tax 44 26 22 23 116 47 23 24 24 117
Operating profit 66 69 74 75 285 113 68 77 88 346
Restructuring expenses - - - - - - - - - -
Pre-tax profit 66 69 74 75 285 113 68 77 88 346
Total Assets 30,708 30,564 30,745 31,381 31,381 31,505 31,734 34,408 33,802 33,802
Liabilities 27,674 27,401 27,636 29,001 29,001 29,621 29,881 32,075 32,048 32,048
Average capital employed 1,807 1,842 1,897 1,945 1,874 1,956 2,028 2,094 2,129 2,049
RWA credit risk (end of period) 13,255 13,579 14,108 14,246 14,246 14,553 14,880 15,681 15,694 15,694
RWA market risk (end of period) 401 369 389 404 404 453 419 367 411 411
RWA operational risk (end of period) 1,477 1,491 1,598 1,449 1,449 1,702 1,707 1,777 1,524 1,524
RWA (end of period) 15,133 15,439 16,095 16,100 16,100 16,707 17,005 17,825 17,629 17,629
Cost/income ratio (%) 64.6% 59.9% 55.8% 58.4% 59.6% 56.8% 56.4% 58.1% 57.9% 57.3%
Operating return on CET1 (%) 14.6% 15.0% 15.6% 15.5% 15.2% 23.2% 13.4% 14.6% 16.6% 16.9%
Operating return on tangible equity (%) 14.0% 14.6% 15.4% 15.4% 14.9% 23.0% 13.3% 14.2% 16.3% 16.6%
41 Stephan Engels | CFO | Frankfurt | 14 February 2019

Commerzbank 4.0
simple – digital – efficient
Commerzbank Group Exceptional Revenue Items
€mQ1
2017
Q2
2017
Q3
2017
Q4
2017
FY
2017
Q1
2018
Q2
2018
Q3
2018
Q4
2018
FY
2018
Exceptional Revenue Items 108 8 502 -60 557 1 18 18 -115 -78
o/w Net interest income -9 -5 -24 -37 -75 -26 -17 -20 -17 -80
o/w Net fair value result 117 13 36 -23 142 14 50 31 -139 -44
o/w Other income - - 490 - 490 14 -14 7 40 46
o/w FVA, CVA / DVA, OCS, Other ACR valuations (NII, NFVR) 108 8 28 -32 111 -24 43 41 -95 -36
PSBC - 1 237 -29 210 25 -25 -22 -23 -44
o/w Net interest income - - -28 -29 -57 -27 -25 -23 -21 -95
o/w Net fair value result - 1 1 - 2 - - 1 -2 -2
o/w Other income - - 265 - 265 52 - - - 52
o/w FVA, CVA / DVA (NII, NFVR) - 1 1 - 2 - - 1 -2 -2
CC 32 -8 9 -3 29 -1 -8 15 -49 -43
o/w Net interest income 3 -5 - -8 -10 1 - -2 -2 -3
o/w Net fair value result 29 -3 9 5 39 -1 -8 16 -47 -40
o/w Other income - - - - - - - - - -
o/w FVA, CVA / DVA, OCS (NII, NFVR) 32 -8 9 -3 29 -1 -8 15 -49 -43
ACR 91 16 18 -29 96 -23 52 26 -43 12
o/w Net interest income - - -1 - -1 - 7 5 6 17
o/w Net fair value result 91 16 18 -29 96 15 59 15 -89 -
o/w Other income - - - - - -38 -14 7 40 -6
o/w FVA, CVA / DVA, Other ACR valuations (NII, NFVR) 91 16 18 -29 96 -23 52 26 -43 12
O&C -15 -1 238 1 222 - - -1 -1 -2
o/w Net interest income -12 - 5 - -7 - - - - -
o/w Net fair value result -3 -1 8 1 5 - - -1 -1 -2
o/w Other income - - 225 - 225 - - - - -
o/w FVA, CVA / DVA (NII, NFVR) -15 -1 1 1 -15 - - -1 -1 -2
Description of Exceptional Revenue Items
2017 €m 2018 €m 2018 €m
Q3 Concardis (PSBC) 89 Q1 PPA Consumer Finance (PSBC) -27 Q3 PPA Consumer Finance (PSBC) -23
Q3 Consumer Finance Joint Venture incl PPA (PSBC, O&C) 160 Q1 Polish group insurance business (PSBC) 52 Q4 PPA Consumer Finance (PSBC) -21
Q3 Property sales gains (O&C) 225 Q2 PPA Consumer Finance (PSBC) -25
Q4 PPA Consumer Finance (PSBC) -29
42 Stephan Engels | CFO | Frankfurt | 14 February 2019
Commerzbank 4.0
simple – digital – efficient
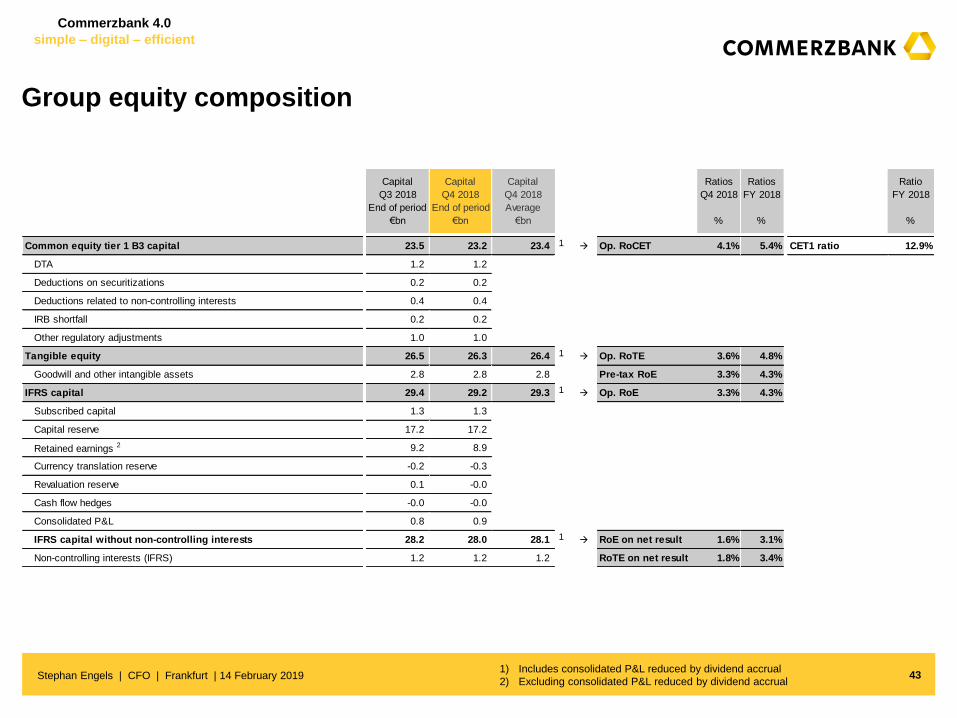
Group equity composition
1) Includes consolidated P&L reduced by dividend accrual
2) Excluding consolidated P&L reduced by dividend accrual 43 Stephan Engels | CFO | Frankfurt | 14 February 2019
Capital Capital Capital Ratios Ratios Ratio
Q3 2018 Q4 2018 Q4 2018 Q4 2018 FY 2018 FY 2018
End of period End of period Average
€bn €bn €bn % % %
Common equity tier 1 B3 capital 23.5 23.2 23.4 1 Op. RoCET 4.1% 5.4% CET1 ratio 12.9%
DTA 1.2 1.2
Deductions on securitizations 0.2 0.2
Deductions related to non-controlling interests 0.4 0.4
IRB shortfall 0.2 0.2
Other regulatory adjustments 1.0 1.0
Tangible equity 26.5 26.3 26.4 1 Op. RoTE 3.6% 4.8%
Goodwill and other intangible assets 2.8 2.8 2.8 Pre-tax RoE 3.3% 4.3%
IFRS capital 29.4 29.2 29.3 1 Op. RoE 3.3% 4.3%
Subscribed capital 1.3 1.3
Capital reserve 17.2 17.2
Retained earnings 2 9.2 8.9
Currency translation reserve -0.2 -0.3
Revaluation reserve 0.1 -0.0
Cash flow hedges -0.0 -0.0
Consolidated P&L 0.8 0.9
IFRS capital without non-controlling interests 28.2 28.0 28.1 1 RoE on net result 1.6% 3.1%
Non-controlling interests (IFRS) 1.2 1.2 1.2 RoTE on net result 1.8% 3.4%

Commerzbank 4.0
simple – digital – efficient
Glossary – Capital Allocation / RoE, RoTE & RoCET1 Calculation
Capital Allocation
› Amount of average capital allocated to business segments is calculated by multiplying the
segments current YtD average RWA (PSBC €39.6bn, CC €92.8bn, O&C €27.2bn, ACR €14.5bn)
by a ratio of 12% (and 15% for ACR respectively) - reflecting current regulatory and market
standard
› Excess capital reconciling to Group CET1 Basel 3 fully phased-in is allocated to Others &
Consolidation
› CET1 capital allocation is disclosed in the business segment reporting of Commerzbank Group
› For the purposes of calculating the segmental RoTE, average regulatory capital deductions
(excluding Goodwill and other intangibles) are allocated to the business segments additionally
(PSBC €0.1bn, CC €0.8bn, O&C €2.0bn, ACR €0.4bn)
RoE, RoTE,
RoCET1 Calculation
› RoE is calculated on an average level of IFRS capital on Group level and on an average level of
12% (and 15% for ACR respectively) of the RWAs on segmental level
› RoTE is calculated on an average level of IFRS capital after deduction of goodwill and other
intangible assets on Group level and on an average level of 12% (and 15% for ACR respectively)
of the RWAs after addition of capital deductions (excluding goodwill and other intangible assets) on
segmental level
› RoTE calculation represents the current market standard
› RoCET1 is calculated on average CET1 capital
44 Stephan Engels | CFO | Frankfurt | 14 February 2019

Commerzbank 4.0
simple – digital – efficient
For more information, please contact Commerzbank’s IR team
Christoph Wortig (Head of Investor Relations)
P: +49 69 136 52668
Investors and Financial Analysts
Michael H. Klein
P: +49 69 136 24522
Jutta Madjlessi
P: +49 69 136 28696
Dirk Bartsch (Head of Strategic IR / Rating Agency Relations / ESG)
P: +49 69 136 22799
Mail: [email protected]
www.ir.commerzbank.com
Financial calendar
2019 22 May
Annual General Meeting
Ansgar Herkert (Head of IR Communications)
P: +49 69 136 44083
45 Stephan Engels | CFO | Frankfurt | 14 February 2019
08 May
Q1 2019 results
07 Aug
Q2 2019 results
07 Nov
Q3 2019 results

Commerzbank 4.0
simple – digital – efficient
This presentation contains forward-looking statements. Forward-looking statements are statements that are not historical facts; they include, inter alia, statements about Commerzbank’s beliefs and expectations and the assumptions underlying them. These statements are based on plans, estimates, projections and targets as they are currently available to the management of Commerzbank. Forward-looking statements therefore speak only as of the date they are made, and Commerzbank undertakes no obligation to update any of them in light of new information or future events. By their very nature, forward-looking statements involve risks and uncertainties. A number of important factors could therefore cause actual results to differ materially from those contained in any forward-looking statement. Such factors include, among others, the conditions in the financial markets in Germany, in Europe, in the United States and elsewhere from which Commerzbank derives a substantial portion of its revenues and in which it hold a substantial portion of its assets, the development of asset prices and market volatility, potential defaults of borrowers or trading counterparties, the implementation of its strategic initiatives and the reliability of its risk management policies.
In addition, this presentation contains financial and other information which has been derived from publicly available information disclosed by persons other than Commerzbank (“external data”). In particular, external data has been derived from industry and customer-related data and other calculations taken or derived from industry reports published by third parties, market research reports and commercial publications. Commercial publications generally state that the information they contain has originated from sources assumed to be reliable, but that the accuracy and completeness of such information is not guaranteed and that the calculations contained therein are based on a series of assumptions. The external data has not been independently verified by Commerzbank. Therefore, Commerzbank cannot assume any responsibility for the accuracy of the external data taken or derived from public sources.
Copies of this document are available upon request or can be downloaded from https://www.commerzbank.de/en/hauptnavigation/aktionaere/investor_relations.html
Disclaimer
46 Stephan Engels | CFO | Frankfurt | 14 February 2019