success with the tsp - improve your project …
TRANSCRIPT
SUCCESS WITH THE TSP - IMPROVE YOUR PROJECT ESTIMATIONS WITH STATISTICAL ANALYSIS TOOLS Michael J. Mowle 17-Sep-2013

2 © 2013 Urban Science

3 © 2013 Urban Science
THE POWER OF 4™
The power to overcome mission-critical challenges. The power to increase sales, improve customer loyalty and drive profits simultaneously. Expert people, intelligent data, innovative process, and proven technology all working together to produce exponentially more effective solutions that create unparalleled results. This is the Power of 4™

4 © 2013 Urban Science
CLIENT SHOWCASE

5 © 2013 Urban Science
A GLOBAL PERSPECTIVE
Beijing
Detroit (HQ)
Frankfurt
London
Los Angeles
Madrid
Melbourne
Mexico City
Moscow
Mumbai
Munich
Nashville
New York
Paris
Rome
Sao Paulo
Shanghai
Tokyo
Washington, D.C.
Urban Science serves clients in over 150 countries through our 19 global offices.

“There are lies, there are damn lies, and then there are statistics…” – Unknown, though popularized by Mark Twain

7 © 2013 Urban Science
PURPOSE OF THIS PRESENTATION
Learning Application Benefits Reminders
Learn more about a set of three estimation tools that can improve estimation accuracy
Understand how to use these three tools individually or in concert
Discuss the concrete benefits to capturing accurate time and size data
Discover important reminders when dealing with statistics

8 © 2013 Urban Science
THREE TOOLS WE WILL DISCUSS
Proxy Size Analysis PROBE in Excel Multi-Language Estimation
Creates Relative Size tables for team work products Assesses the sample data’s fit to a normal distribution Measures the the size and effort correlation Allows examination of the data for outliers
A spreadsheet that mimics the PROxy Based Estimation tool (“A” method only) from the PSPSM* methodology to potentially improve estimates
Calculate an effort estimate for components that are written with multiple coding languages
*PSPSM is a service mark of Carnegie Mellon University
9 © 2013 Urban Science
WHAT’S IN IT FOR YOU?
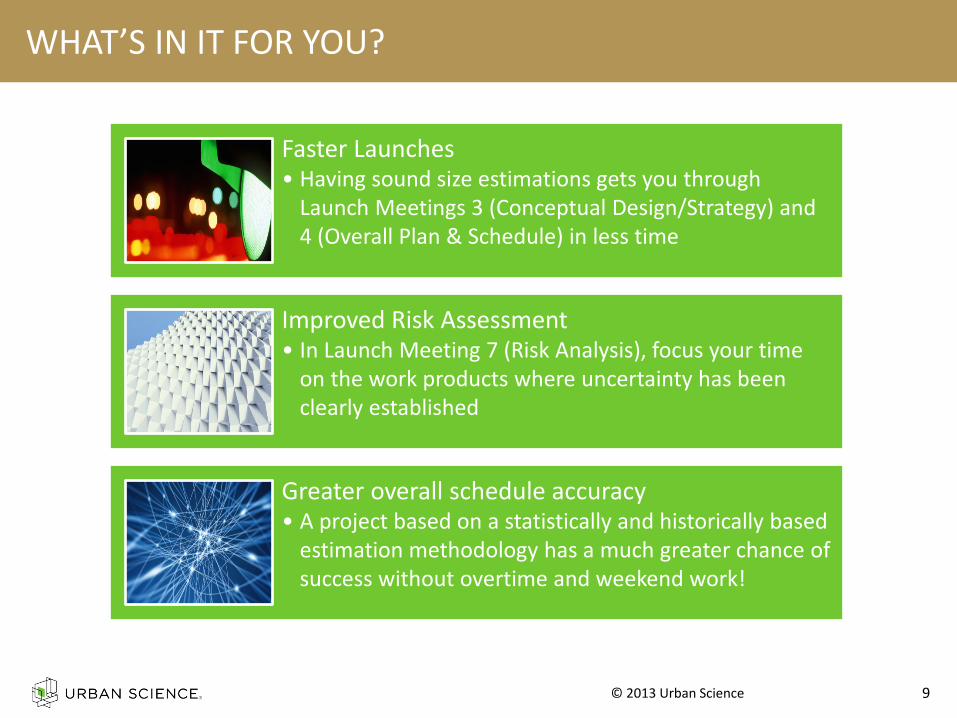
Faster Launches • Having sound size estimations gets you through
Launch Meetings 3 (Conceptual Design/Strategy) and 4 (Overall Plan & Schedule) in less time
Improved Risk Assessment • In Launch Meeting 7 (Risk Analysis), focus your time
on the work products where uncertainty has been clearly established
Greater overall schedule accuracy • A project based on a statistically and historically based
estimation methodology has a much greater chance of success without overtime and weekend work!

THE ESTIMATION TOOLS: PROXY SIZE ANALYSIS

11 © 2013 Urban Science
OVERVIEW
Tool is only as good as the data it is provided
You need:
– Discipline
– Patience
The Proxy Size Analysis tool allows a team to:
– Maintain data for a multitude of component types
– Assess the fitness of the data for planning
– Allows rapid determination of a productivity rates and proxy sizing in Launch Meetings #3 and #4 (Strategy and Overall Project Plan Meetings)
The statistics generate predictions not guarantees!
12 © 2013 Urban Science
FIBONACCI SEQUENCE
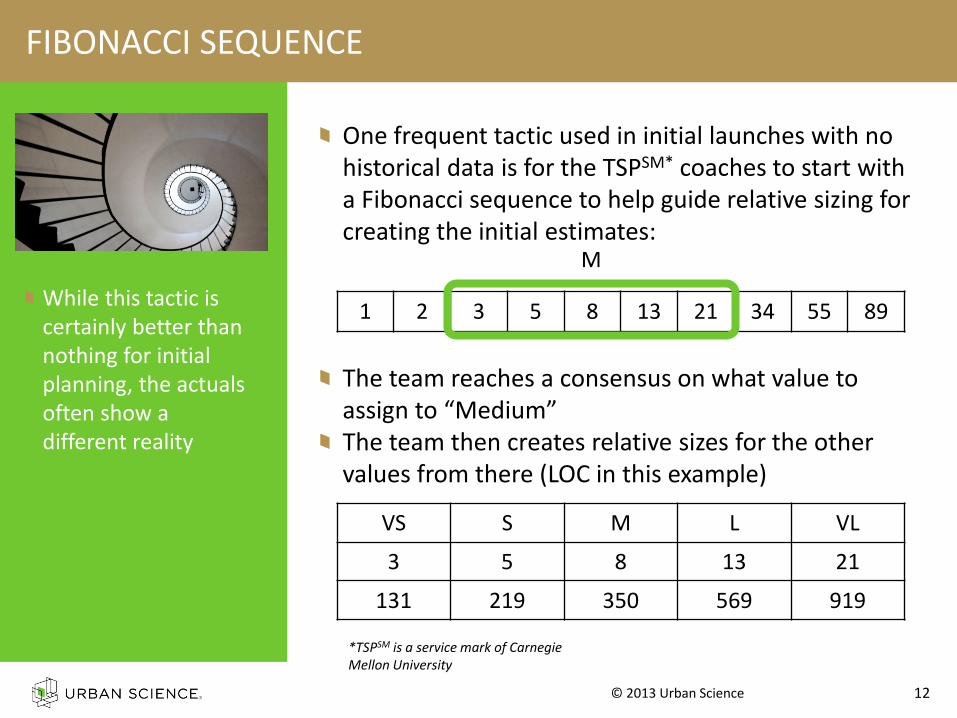
One frequent tactic used in initial launches with no historical data is for the TSPSM* coaches to start with a Fibonacci sequence to help guide relative sizing for creating the initial estimates:
The team reaches a consensus on what value to assign to “Medium” The team then creates relative sizes for the other values from there (LOC in this example)
While this tactic is certainly better than nothing for initial planning, the actuals often show a different reality
1 2 3 5 8 13 21 34 55 89
VS S M L VL
3 5 8 13 21
131 219 350 569 919
M
*TSPSM is a service mark of Carnegie Mellon University

13 © 2013 Urban Science
WORK PRODUCTS
Different types of work products, even in the same category such as requirements documents, code, or test cases, may prove to have different relative sizes computed at different intervals
Work products, even of the same category, may need to be measured in different terms to achieve a strong correlation
Knowing how strong your relative sizing is and the strength of the correlation between size and effort will assist in assessing project risk and allow for contingency time based on actual data rather than a base bucket of hours or a percentage

So let’s take a look at the Proxy Size Analysis tool and see what it can do for us…

15 © 2013 Urban Science
This tool consists of two parts, the front page, shown on this slide, with as many category tabs as your team deems necessary for the work it performs
Items of note…
Now let’s look at one of the supporting pages…
PROXY SIZE ANALYSIS – SUMMARY PAGE
Some Documents are measured in Pages, others in Lines of Text
Different types of Code have different relative sizes and production rates
Tabs for every work product type

16 © 2013 Urban Science
NameActual Size
(LOC)Actual Effort
(HRS)RSV
Rate (Size/Hr)
Total 8542 853.4 10.01abc 202 18.3 S 11.04 Count MidPoints Size Observed Expecteddef 684 75.3 L 9.08 15 54.5 VS 1 1.00 R2 Value 0.92ghi 135 18.2 S 7.42 143.3 S 4 3.63 Significance 0.00jkl 270 20.4 M 13.24 376.5 M 5 5.74mno 305 33.6 M 9.08 989.5 L 4 3.63pqr 318 24.7 M 12.87 2600.6 VL 1 1.00stu 186 13.1 S 14.20 χ2 Value 0.979vwx 1892 225.6 VL 8.39yz1 763 52.8 L 14.4523f 1598 122.4 L 13.0623b 65 15 VS 4.3379X 504 60.6 M 8.3230c 515 63.4 M 8.1218x 980 97 L 10.10gg3 125 13 S 9.62
InstructionsEnter work items under name below. For size, add a size type in parenthesis in the column name (for example, use LOT or Lines of Text, POT or Pages of Text, or LOC or Lines of Code). Enter the size number and number of hours for the work items.
Correlation Values
0
1
2
3
4
5
6
7
VS S M L VL
Obs
erve
d/Ex
pect
ed
Size Category
Normal Distribution vs. Observed
0
50
100
150
200
250
0 500 1000 1500 2000
Effo
rt
Size
Actual Effort to Actual Size Correlation
PROXY SIZE ANALYSIS – DETAIL PAGE
This is one of the supporting pages and we’ll highlight each section of the page in its own slide
Section for comparing your data’s fit to a normal distribution (χ2) and to identify possible outliers
Section for analyzing the correlation of your data and possible outliers
Section for entering Actual Sizes and Actual Effort

17 © 2013 Urban Science
PROXY SIZE ANALYSIS – SAMPLE DATA SECTION
In this section the name of the item, its actual size and measure, actual effort to produce, and relative size value (RSV) are listed. These values roll up to provide an average productivity rate. This sample data is meant to show a near perfect case for illustrative purposes.
NameActual Size
(LOC)Actual Effort
(HRS)RSV
Rate (Size/Hr)
Total 8542 853.4 10.01abc 202 18.3 S 11.04def 684 75.3 L 9.08ghi 135 18.2 S 7.42jkl 270 20.4 M 13.24mno 305 33.6 M 9.08pqr 318 24.7 M 12.87stu 186 13.1 S 14.20vwx 1892 225.6 VL 8.39yz1 763 52.8 L 14.4523f 1598 122.4 L 13.0623b 65 15 VS 4.3379X 504 60.6 M 8.3230c 515 63.4 M 8.1218x 980 97 L 10.10gg3 125 13 S 9.62

18 © 2013 Urban Science
MidPoints Size Observed Expected54.5 VS 1 1.00
143.3 S 4 3.63376.5 M 5 5.74989.5 L 4 3.63
2600.6 VL 1 1.00
χ2 Value 0.979
PROXY SIZE ANALYSIS – RELATIVE SIZE AND ANALYSIS

19 © 2013 Urban Science
MidPoints Size Observed Expected54.5 VS 1 1.00
143.3 S 4 3.63376.5 M 5 5.74989.5 L 4 3.63
2600.6 VL 1 1.00
χ2 Value 0.979
PROXY SIZE ANALYSIS – CHI SQUARED TEST

20 © 2013 Urban Science
PROXY SIZE ANALYSIS – DISTRIBUTION CURVES
This chart will assist you to better visualize what the previous table was describing:

21 © 2013 Urban Science
PROXY SIZE ANALYSIS – SIZE/EFFORT CORRELATION
R2 Value 0.92Significance 0.00
Correlation Values
0
50
100
150
200
250
0 500 1000 1500 2000
Effo
rt
Size
Actual Effort to Actual Size Correlation

22 © 2013 Urban Science
PROXY SIZE ANALYSIS – REAL LIFE EXAMPLES
MidPoints Size Observed Expected2.0 VS 1 1.74 R2 Value 0.454.5 S 6 6.28 Significance 0.00
10.0 M 10 9.9622.5 L 8 6.2850.3 VL 1 1.74
χ2 Value 0.871
Correlation Values
0
2
4
6
8
10
12
VS S M L VL
Normal Distribution vs. Observed
0102030405060708090
0 10 20 30 40 50
Effo
rt
Size
Actual Effort to Actual Size Correlation

23 © 2013 Urban Science
PROXY SIZE ANALYSIS – REAL LIFE EXAMPLES
MidPoints Size Observed Expected126.8 VS 0 0.40 R2 Value 0.73206.5 S 3 1.45 Significance 0.03336.4 M 1 2.30548.0 L 1 1.45892.7 VL 1 0.40
χ2 Value 0.620
Correlation Values
0
0.5
1
1.5
2
2.5
3
3.5
VS S M L VL
Normal Distribution vs. Observed
0102030405060708090
0 200 400 600 800
Effo
rt
Size
Actual Effort to Actual Size Correlation

24 © 2013 Urban Science
PROXY SIZE ANALYSIS
The natural instinct is to remove “outliers” and this tool can help guide the selection process as simply trying to remove Normal Distribution bias could result in a lowering of Size/Effort correlation or vice-versa Removing outliers from an analysis sheet requires their movement to another analysis sheet – do the outliers perhaps belong in the same category or separate categories? Avoid creating numerous “outlier” tables
25 © 2013 Urban Science
PROXY SIZE ANALYSIS – CONCLUSIONS
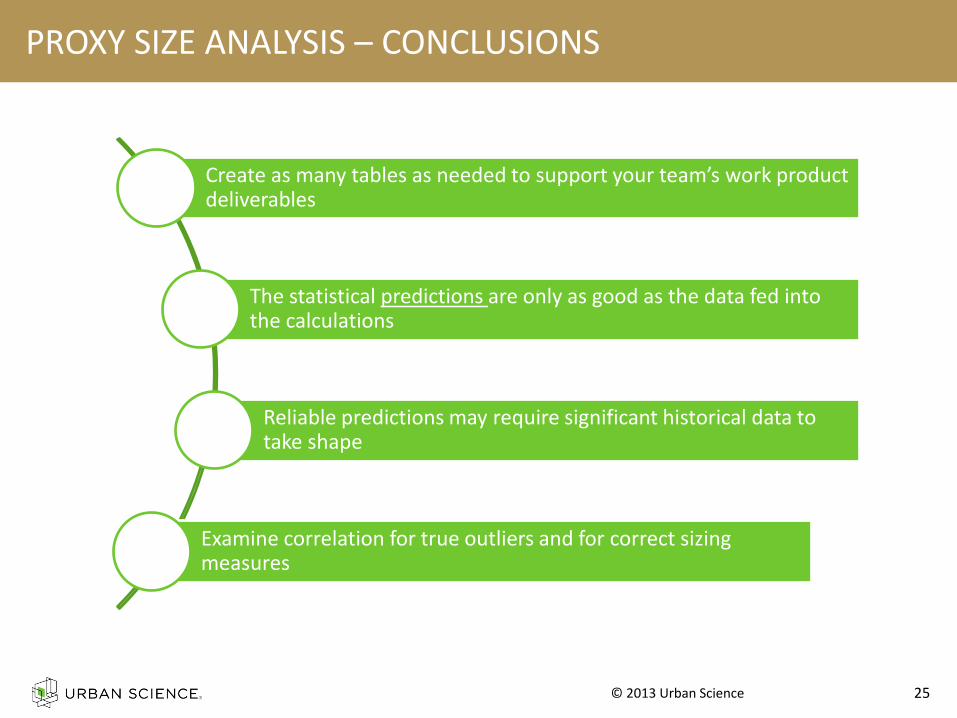
Create as many tables as needed to support your team’s work product deliverables
The statistical predictions are only as good as the data fed into the calculations
Reliable predictions may require significant historical data to take shape
Examine correlation for true outliers and for correct sizing measures

THE ESTIMATION TOOLS: PROBE IN EXCEL

27 © 2013 Urban Science
OVERVIEW - WHAT IS PROBE?
PROxy Based Estimation
Linear Regression model used to improve estimates based on historical trends
Corrects for tendencies to over or under estimate work product size or effort
Our spreadsheet tool only simulates PROBE “A”

28 © 2013 Urban Science
OVERVIEW
Tool is only as good as the data it is provided
You need:
– Discipline
– Patience
Proxy Based Estimation is such a powerful concept that we had to make it as accessible to everyone as possible Can improve any size/effort based estimation Can further refine degrees of risk present in an estimate to aid in contingency planning The statistics generate predictions not guarantees!

So let’s take a look at the PROBE in Excel tool and see what it can do for us…

30 © 2013 Urban Science
PROBE IN EXCEL
The spreadsheet consists of three tabs – a data entry tab plus two charts
This is what the data entry tab looks like:
Let’s explain what we’re looking at…
Program #
Estimated Proxy Size
Actual Added and Modified
Size
Actual Development
TimeProxy Size
Sample Size
1 135 188 8.8 244 10 R 0.975 R 0.9912 734 693 71.4 R2 0.950 R2 0.9823 88 137 11.3 Significance 0.000 Significance 0.0004 163 268 21.6 β0 -20.082 β0 -2.3865 142 298 22 68.268% β1 1.372 β1 0.1206 305 322 31.4 P 315 P 277 154 209 18.2 Range 171 Range 98 1236 1903 157 UPI (68.268%) 485 UPI (68.268%) 369 665 766 71.6 LPI (68.268%) 144 LPI (68.268%) 18
10 1204 1635 142
LOC Estimate Effort Estimate
Prediction Interval

31 © 2013 Urban Science
Program #
Estimated Proxy Size
Actual Added and Modified
Size
Actual Development
TimeProxy Size
Sample Size
1 135 188 8.8 244 10 R 0.975 R 0.9912 734 693 71.4 R2 0.950 R2 0.9823 88 137 11.3 Significance 0.000 Significance 0.0004 163 268 21.6 β0 -20.082 β0 -2.3865 142 298 22 68.268% β1 1.372 β1 0.1206 305 322 31.4 P 315 P 277 154 209 18.2 Range 171 Range 98 1236 1903 157 UPI (68.268%) 485 UPI (68.268%) 369 665 766 71.6 LPI (68.268%) 144 LPI (68.268%) 18
10 1204 1635 142
LOC Estimate Effort Estimate
Prediction Interval
The spreadsheet will also provide you a range which allows the calculation of the Upper and Lower Prediction Intervals
Based, then, on the statistical analysis of your historical data, the spreadsheet will provide you with a recommended LOC size and effort estimate
PROBE IN EXCEL
Enter the requested values in the first three columns
The L.P.I. for the Estimates are not limited to positive numbers. With small total sample sizes, or small actual A&M sizes, the LPI could be a negative number (Calling for rejection of the estimate or refinement of the P.I. value) Enter the desired
Prediction Interval for this estimate here
These sections contain the statistical analysis of your data and provide the Predictive value and the Upper and Lower Prediction Intervals for your work
The R2 Value determines the “strength” of your correlation. At a minimum an R2 Value should be above 0.50, ideally 0.85 or higher
Significance measures the likelihood that the correlation is “real” or coincidence. Values should be lower than 0.20, ideally 0.05 or lower
Enter the estimated Proxy Size for the component to be created here
The β0 and β1 Values describe/define the regression line your historical data creates that your Proxy Size estimate will be evaluated against

32 © 2013 Urban Science
PROBE IN EXCEL – SIZE/SIZE CORRELATION CHART

33 © 2013 Urban Science
PROBE IN EXCEL – SIZE/EFFORT CORRELATION CHART
34 © 2013 Urban Science
PROBE IN EXCEL – CONCLUSIONS
This tool is useful in assisting in the refinement of estimates
Only performs PROBE “A” calculations
The statistical predictions are only as good as the data fed into the calculations
Reliable predictions may require significant historical data to take shape
Should be used only for like items produced by like processes

THE ESTIMATION TOOLS: MULTI-LANGUAGE ESTIMATION

36 © 2013 Urban Science
OVERVIEW
Tool is only as good as the data it is provided
You need:
– Discipline
– Patience
Components that consist of parts written in different coding languages is a common situation in modern day software development Multiple Linear Regression works best when the majority of items in the sample have values for all categories in scope as well as the estimate to be evaluated The more categories, the broader and more generalized the results will be without a significantly large sample of data so treat the predictions with caution

37 © 2013 Urban Science
PROGRAM HOURS (z) C# A&M (w) HTML A&M (x) JavaScript A&M (y)A 197 1201 986 332 C# HTML JavaScriptB 104 841 1002 0 803 1243 99C 173 998 3198 48D 60 564 0 0 68.268%E 145 922 2533 185F 64 307 552 99
LPI EST UPI96.38 120.11 143.84
±23.73
Prediction Interval:
EFFORT ESTIMATE
A&M PROXY VALUES
This simplified view assumes only three languages. The actual spreadsheet will allow up to five
MULTI-LANGUAGE ESTIMATION TOOL
Note that the majority of the fields have actual values
The L.P.I. for the Effort Estimate is not limited to positive numbers. With small total sample sizes, or small actual A&M sizes, or significant numbers of fields set to Zero, the LPI could be a negative number (Calling for rejection of the estimate or a refinement of the P.I. Value)
Provides Effort Estimates only, not Size Estimates
Enter your Proxy Sizes Here
Enter your P.I. Here

38 © 2013 Urban Science
MULTI-LANGUAGE ESTIMATION TOOL – CONCLUSIONS
This tool is useful in assisting in the refinement of multiple proxy sizes when needed
Limited to effort estimates only
The statistical predictions are only as good as the data fed into the calculations
Reliable predictions may require significant historical data to take shape

39 © 2013 Urban Science
FINAL THOUGHTS Usage of these tools can make for faster and better estimates
Areas of risk can be more easily identified
Accurate data collection requires high levels of personal and professional discipline
The payoff will not come overnight – many data points must be collected, analyzed, and categorized
Never lose sight that the outputs of any of these tools are predictions.
Contact me at [email protected]

Questions?

Thank you for your time!
The End