subtlex-pl: subtitle-based word frequency estimates for polishcrr.ugent.be/papers/subtlex-pl.pdf ·...
TRANSCRIPT

Subtlex-pl: subtitle-based word frequency estimates for Polish
Paweł Mandera & Emmanuel Keuleers &
Zofia Wodniecka & Marc Brysbaert
# Psychonomic Society, Inc. 2014
Abstract We present SUBTLEX-PL, Polish word frequen-cies based on movie subtitles. In two lexical decision exper-iments, we compare the new measures with frequency esti-mates derived from another Polish text corpus that includespredominantly written materials. We show that the frequen-cies derived from the two corpora perform best in predictinghuman performance in a lexical decision task if used in acomplementary way. Our results suggest that the two corporamay have unequal potential for explaining human perfor-mance for words in different frequency ranges and that cor-pora based on written materials severely overestimate fre-quencies for formal words. We discuss some of the implica-tions of these findings for future studies comparing differentfrequency estimates. In addition to frequencies for wordforms, SUBTLEX-PL includes measures of contextual diver-sity, part-of-speech-specific word frequencies, frequencies ofassociated lemmas, and word bigrams, providing researcherswith necessary tools for conducting psycholinguistic researchin Polish. The database is freely available for research pur-poses and may be downloaded from the authors’ universityWeb site at http://crr.ugent.be/subtlex-pl.
Keywords Word frequencies . Polish language . Lexicaldecision . Visual word recognition
Word frequency estimates derived from film and televisionsubtitles have proved to be particularly good at predictinghuman performance in behavioral tasks. Since lexical decisionlatencies are particularly sensitive to word frequency (e.g.,Balota, Cortese, Sergent-Marshall, Spieler, & Yap, 2004),correlating human performance in this task with various wordfrequency estimates became a standard method of validatingtheir usefulness. Word frequencies derived from subtitle cor-pora were shown to outperform estimates based on writtentexts for French (New, Brysbaert, Veronis, & Pallier, 2007),English (Brysbaert & New, 2009), Dutch (Keuleers,Brysbaert, & New, 2010), Chinese (Cai & Brysbaert, 2010),Spanish (Cuetos Vega, González Nosti, Barbón Gutiérrez, &Brysbaert, 2011), German (Brysbaert et al., 2011), and Greek(Dimitropoulou, Duñabeitia, Avilés, Corral, & Carreiras,2010).
Following these developments, we present SUBTLEX-PL,a new set of psycholinguistic resources for Polish, whichincludes frequency estimates for word forms, associated partsof speech, and lemmas. To our knowledge, this it is the firstsubtitle word frequency validation study for a Slavic lan-guage. In terms of number of speakers, Polish is the largestlanguage in theWest Slavic group and the second largest of allSlavic languages after Russian (Lewis, Simons, & Fennig,2013). It is a highly inflected language and, as compared withmost Germanic languages, has a much richer inflection ofnouns, adjectives, verbs, pronouns, and numerals. Polish iswritten in the Latin alphabet, with several additional lettersformed with diacritics. In contrast to English, Polish has atransparent orthography: In most cases, letters or theircombinations correspond to phonemes of spoken Polishin a consistent way.
Even though the collection of text corpora of considerablesize is easier than ever before, the standard way of validatingthe quality of the word frequencies based on these corpora hastypically involved collection of data for thousands of words in
Electronic supplementary material The online version of this article(doi:10.3758/s13428-014-0489-4) contains supplementary material,which is available to authorized users.
P. Mandera (*) : E. Keuleers :M. BrysbaertDepartment of Experimental Psychology, Ghent University, HenriDunantlaan 2, 9000 Gent, Belgiume-mail: [email protected]
Z. WodnieckaInstitute of Psychology, Jagiellonian University, Kraków, Poland
Behav ResDOI 10.3758/s13428-014-0489-4

strictly controlled laboratory settings (Balota et al., 2007;Keuleers, Diependaele, & Brysbaert, 2010; Keuleers, Lacey,Rastle, & Brysbaert, 2011). In order to compare frequencyestimates derived from two corpora, it may be more efficientto use words for which the two corpora give diverging esti-mates, rather than a random set of words. This idea is based onthe observation that the words for which the frequency esti-mates between two corpora differ most are also the sources ofpotential difference in performance of these frequency normswhen predicting behavioral data. This approach can increasethe statistical power of the experiment; if only randomlysampled words are included in the study, due to very highcorrelation between different frequency estimates, it is moredifficult to detect differences in performance of these esti-mates without including a very large number of words in theexperiment. Dimitropoulou et al. (2010) approached this prob-lem by using a factorial design in which the critical conditionsincluded words with a high frequency in one corpus and a lowfrequency in the other. In the present study, we will use anapproach based on continuous sampling over the full range ofword frequencies.
Although using words for which the two corpora give themost diverging estimates may help to detect differences be-tween their performance in predicting behavioral data, there isa possibility that this approach may bias the experiment infavor of one of the frequency estimates. For instance, words inthe formal register tend to have a much higher frequency inwritten corpora than in spoken corpora. Stimulus selectionbased solely on a criterion of maximum divergence wouldlead to a large selection of words from the formal register,while the formal register may represent just a small part of thecorpus. To account for this possibility, in Experiment 1, weincluded an additional set of words that were randomly sam-pled from all word types observed in the compared corpora. InExperiment 2, we included only randomly sampled words.
Current availability of frequency norms for Polish
For a long time, the only available word frequency norms forPolish were based on a corpus compiled between 1963 and1967 (containing about 500,000 words) and published byKurcz, Lewicki, Sambor, Szafran, and Woroniczak (1990).More recently, several other Polish text corpora have beencompiled, and resources such as concordances and colloca-tions have been made available to researchers. This is the casefor the IPI PAN Corpus of about 250 million words(Przepiórkowski & Instytut Podstaw Informatyki, 2004), theKorpus Języka Polskiego Wydawnictwa Naukowego PWN(n.d.), containing about 100 million words, and the PELCRACorpus of Polish (~100 million words; http://korpus.ia.uni.lodz.pl/). To our knowledge, none of them provides an easilyaccessible list of word frequencies.
The largest of the Polish corpora contains over 1.5 billionwords (National Corpus of Polish [NCP]; Przepiórkowski,2012). It is based mainly on press and magazines (~830million tokens), material downloaded from the Internet(~600 million tokens), and books (~100 million tokens). Italso contains a small sample of spoken, conversational Polish(~2 million tokens). In addition to the full corpus, a significanteffort has been invested in creating a subcorpus that is repre-sentative of the language exposure of a typical native speakerof Polish. This balanced subcorpus (BS–NCP) contains about250 million words. Spoken materials (conversational andrecorded from media) constitute about 10 % of the subcorpus.The remaining 90 % is based on written texts (mainly fromnewspapers and books).
Since the word frequencies derived from the NCP balancedsubcorpus seem to be the most appropriate existing wordfrequencies for psycholinguistic research in Polish, we decid-ed to compare them with the new SUBTLEX-PL frequencies.
SUBTLEX-PL
Corpus compilation, cleaning, and processing
We processed about 105,000 documents containing film andtelevision subtitles flagged as Polish by the contributors ofhttp://opensubtitles.org. All subtitle-specific text formattingwas removed before further processing.
To detect documents containing large portions of text inlanguages other than Polish, we first calculated preliminaryword frequencies on the basis of all documents and thenremoved from the corpus all files in which the 30 mostfrequent types did not cover at least 10 % of a total count oftokens in the file. Using this method, 5,365 files were removedfrom the corpus.
Because many documents are available in multiple ver-sions, it was necessary to remove duplicates from the corpus.To do so, we first performed a topic analysis using LatentDirichlet Allocation (Blei, Ng, & Jordan, 2003), assigningeach file to one of 600 clusters. If any pair of files within acluster had an overlap of at least 10 % unique word-trigrams,the file with the highest number of hapax legomena (wordsoccurring only once) was removed from the corpus, sincemore words occurring once would indicate more misspellings.
After removing duplicates, 27,767 documents remained,containing about 146 million tokens (individual strings, in-cluding punctuation marks, numbers, etc.), out of which 101million tokens (449,300 types) were accepted as correctlyspelled Polish words by the Aspell spell-checker (http://aspell.net/; Polish dictionary available at ftp://ftp.gnu.org/gnu/aspell/dict/pl/) and consisted only of legal Polish,alphabetical characters. All words were converted tolowercase before spell-checking. Because Aspell rejects
Behav Res

proper names spelled with lowercase, this number does notinclude proper names.
Frequency measures
Word frequency
In addition to raw frequency counts, it is useful for researchers tohavemeasures of word frequency that are independent of corpussize. First, we report word frequencies transformed to the Zipfscale1 (van Heuven, Mandera, Keuleers &Brysbaert 2014). TheZipf scale was proposed as a more convenient scale on whichword frequencies may bemeasured. In order to reflect the natureof the frequency effect, it is a logarithmic scale (like the decibelscale of sound intensity), but, in contrast to the logarithm offrequency permillionwords, it does not result in negative valuesfor corpora of up to 1 billion words. In order to make interpre-tation of the frequency values easier, the middle of the scaleseparates low-frequency from high-frequency words, and, for amajority of words, the measure takes a value between 1 to 7,which resembles a Likert scale. Another compelling property ofthe Zipf scale is that it allows assigning a value to words thatwere not observed in a corpus by incorporating Laplacesmoothing, as recommended by Brysbaert and Diependaele(2013); without the transformation, such words pose aproblem, since the logarithm of 0 is undefined, which makes itimpossible to estimate log10 of word frequency per million forthese words. In addition to the raw frequency and the Zipf scalefrequencies, we also provide the more traditional logarithm offrequency per million words.
Contextual diversity
Adelman, Brown, and Quesada (2006) proposed that thenumber of contexts in which a word appears may be moreimportant than word frequency itself and that the number ofdocuments in which a word occurs may be a good proxymeasure for the number of contexts (contextual diversity[CD]). According to this view, even words with equalfrequency would be processed faster if they occur in morecontexts. Brysbaert and New (2009) observed that CD ac-counts for 1 %–3 % more variance than does word frequency.
Part-of-speech-specific frequencies
For languages with a rich inflectional system, such as Polish, itis crucially important to provide researchers with information
above the level of individual word forms. For each word inSUBTLEX-PL, we also provide the lemma and the dominantpart of speech and their frequencies.
Providing the lemma associated with each given word formallows us to group inflected forms of the sameword. This maybe useful when investigating the specific contributions ofsurface and lemma frequencies in word processing(Schreuder & Baayen, 1997) or in order to avoid includinginflections of the same word when creating a stimulus set foran experiment.
Information about the dominant part of speech allowsresearchers to choose words of a particular grammatical class(e.g., when a researcher wants to include only nouns in astimulus list).
To obtain part-of-speech and lemma information for words,we used TaKIPI, a morphosyntactic tagger for Polish (Piasecki,2007) supplied with the morphological analyzer Morfeusz(Woliński, 2006). The resulting tag set was too detailed forour purposes, so we translated the original tags to a simplerform that includes only information about parts of speech anddiscards other details.2 The tagging process assigned each of theword forms consisting of legal Polish alphabetical charactersand accepted by the spell-checker to 1 of 78,361 lemmas.
Bigram frequencies
Although in this article we focus on unigram frequencies, wealso provide frequency estimates for word bigrams, which areof increasing interest to researchers (Arnon & Snider, 2010;Siyanova-Chanturia, Conklin, & van Heuven, 2011).
Experiment 1
Method
Stimuli
We selected stimuli from the list of words common to bothBS–NCP and SUBTLEX-PL.3 All stimuli considered forselection contained only alphabetical characters and occurredwithout an initial capital in most cases. We used the list of 1-grams (available at http://zil.ipipan.waw.pl/NKJPNGrams) togenerate the BS–NCP frequency list used in the present study.We processed the raw list by summing frequencies of all formsthat were identical after removing punctuation marks attachedto some of the forms in the original list.
1 zi ¼ log10ð ciþ1
∑k¼1
n
ckþn
Þ þ 9 (van Heuven, Mandera, Keuleers &
Brysbaert 2014)Where zi is a Zipf value for word i, ci is its raw frequency,and n is the size of the vocabulary.
2 For mapping between original and simplified tags, see supplementarymaterials.3 A nonfinal version of SUBTLEX-PL, based on nearly 50 milliontokens, was used when choosing stimuli for the experiment.
Behav Res

To make the experiment maximally informative, we chosestimuli for which BS–NCP and SUBTLEX-PL gave highlydivergent frequency estimates. We performed a linear regres-sion on the SUBTLEX-PL frequencies, using the BS–NCPfrequencies as a predictor. All frequencies were transformed tothe Zipf scale. We then ordered the words according to theirresidual error and chose 155 words from both extremes of theresulting list, ensuring that different forms of the same lemmawere not selected more than once. Words at one extreme (witha large positive residual error value) were much more frequentin SUBTLEX-PL than would be expected on the basis of BS–NCP, while words at the other extreme (with a large negativeresidual error value) occurred much less often in SUBTLEX-PL than would be expected on the basis of BS–NCP. Inaddition, we randomly sampled 155 words from the remainingwords, with the probability of each word being selected equalto its probability in the subtitle corpus.
Figure 1 illustrates the frequency distribution of stimuliaccording to this procedure. As the top panel of Fig. 1 shows,it is important to note that the regression line on which theresidual error values are based is pulled downward by a largenumber of words with a low frequency in SUBTLEX-PL.While this seems to indicate that SUBTLEX-PL contains ahigher proportion of low-frequency forms, it is an artifact ofselecting words from corpora of unequal size.4
Words that had a much higher frequency in one corpus thanin the other may be categorized into several groups. Forexample, words related to the Polish administrative and leg-islative system (e.g., “województwo,” district; “urzędowym,”administrative), as well as those occurring mostly in fairlysophisticated contexts (e.g., “pejzażu,” landscape) are muchmore frequent in the BS–NCP corpus. On the other hand,words with much higher frequency in SUBTLEX-PL includ-ed those used mostly in dialogues (e.g., “skarbie,” honey),swear words (“pierdol,” fuck), those related to (American)film themes (e.g., “kowboju,”cowboy), and function words(e.g., “ale,” but; “się,” self).
For each word that was included in the experimental set, acorresponding nonword was generated using Wuggy, a mul-tilingual pseudoword generator (Keuleers & Brysbaert, 2010).
For the full set of words included in the experiment, thestandard deviation (SD) in word frequency (Zipf scale) was1.14 (mean = 4.09) for BS–NCP and 1.76 (mean = 3.63) forSUBTLEX-PL. The two variances were significantly differ-ent, F(464, 464) = 0.42, p < .001, and Welsch’s t-test hasshown significant differences in the mean frequency derived
from the two corpora, t(794) = 4.7, p < .001, for this set ofstimuli.
For the 155 word stimuli that were randomly sampled fromthe words common to both word frequency lists, SD was 1.08(mean = 4.44) for BS–NCP and 1.19 (mean = 4.11) forSUBTLEX-PL. The difference between variances was notstatistically significant, F(154, 154) = 0.82, p = .23, but themean frequencies were significantly different according toWelsch’s t-test, t(308) = 2.6, p = .01.
Participants
Twenty-six students from the Jagiellonian University inKraków participated in the experiment (20 female, 6 male;mean age=23.76, SD = 2.06) either on a voluntary basis or inexchange for course credit.
Design
Words and nonwords were randomly assigned to 10 blocks.Nine blocks contained 50words and 50 nonwords in a randomorder; 1 block contained the remaining 15 words and non-words in a random order. Ten different permutations of blockorders were generated, and each participant was randomlyassigned to one of the permutations. Due to a coding error,10 words were not presented to the first 10 participants.Further analysis is therefore based on 455 words, instead of465 words.
Within each block, stimuli were presented in a randomorder in white characters on a black background.Presentation of each stimulus was preceded by a blank screen.After 500 ms, a vertical line was displayed above and belowthe center of the screen. Finally, after another 500 ms, thestimulus was presented between the vertical lines.
A standard QWERTY PC keyboard was used to collectresponses. Participants were instructed to press “/” (the right-most key on the second row) if they saw a word and “Z” (theleftmost key on the second row) if they saw a nonword. Thetime-out for giving the response was 2,000 ms. After sixtraining trials, the experimental blocks were presented. Theexperiment took about 30 min.
Results
Of the trials on which reaction times (RTs) were outside of arange of whiskers of a boxplot adjusted for skewed distribu-tions (calculated separately for words and nonwords for eachparticipant in each block; Hubert & Vandervieren, 2008),5.2 % were removed from the data set.
Accuracy and RTs were the two dependent variables in allanalyses. Three stimuli with less than one-third correct an-swers were excluded from the data set. The analyses arereported first for the full set of words included in the
4 As an example, consider a list of 200,000 words and a list of 400,000words. A typical characteristic of word frequency distributions is thatabout half of the words in each list will have a frequency of one. In thatcase, the base probability that any word found in both lists would have afrequency of 1 in the first list would be 1/100,000, while it would be1/200,000 for the second list.
Behav Res

experiment and then separately only for the 155 word stimulithat were randomly sampled from the words common to bothword frequency lists.
For the full set of word stimuli, the mean RT was 592.00(SD = 67.34), and the mean accuracy was .94 (SD = .08).Words occurring less often in SUBTLEX-PL than in BS–NCPhad ameanRTof 652.19 (SD = 52.23) and a mean accuracy of.96 (SD = .06), while words occurring more often inSUBTLEX-PL than in BS–NCP had a mean RT of 551.02(SD = 48.74) and a mean accuracy of .91 (SD = .11). Therandomly selected words had a mean RT of 574.00 (SD =54.00) and a mean accuracy of .96 (SD = .07).
For nonwords, the mean RTwas 666.88 (SD = 70.23), andthe mean accuracy was .94 (SD = .09).
To estimate the reliability of the RTand accuracymeasures,we computed split-half correlations for 100 random splits ofthe data across participants. The resulting correlations werecorrected with the Spearman–Brown prediction formula(Brown, 1910; Spearman, 1910), giving an average correctedreliability of .81 (SD = .013) for RTs and .72 (SD = .021) foraccuracy.
AdjustedR2 was used as a measure of explained variance inall analyses. The percentage of variance in RT and accuracy
accounted for by linear regression models using differentfrequency measures is summarized in Table 1. All frequencymeasures were transformed to the Zipf scale (van Heuvenet al., 2014). Because it was shown that the frequency effectis not completely linear (Balota et al., 2004), we added a termwith squared word frequency (Zipf scale) to the linear regres-sion. To control for word length, we also included number ofletters in a word in the regression model.
The relationship between word frequencies and RTs isshown in Fig. 2. As is shown in Table 1, when all words wereincluded in the analysis, the BS–NCP word frequencies ex-plained 39.09 % of variance in RTs and 8.90 % of variance inaccuracy. For this set of words, SUBTLEX-PL frequenciesexplained 58.64 % of variance in RTs and 19.07 % in accura-cy, which is 19.55 % more for RTs and 10.17 % more foraccuracy in comparison with BS–NCP frequencies. To testfor statistical difference between models, we applied theVuong test for nonnested models (Vuong, 1989). Thedifferences in performance of the two models were statis-tically significant for both RTs (z = −6.11. p < .001) andaccuracy (z = −2.5, p = .012).
When only words that were randomly sampled fromthe corpus were included in the analysis, the frequencies
2
4
6
2 4 6
BS−NCP word frequency (Zipf scale)
SU
BT
LEX
−P
L w
ord
freq
uenc
y (Z
ipf s
cale
)
2
4
6
2 4 6BS−NCP word frequency (Zipf scale)
SU
BT
LEX
−P
L w
ord
freq
uenc
y (Z
ipf s
cale
)
Fig. 1 Frequencies of words in the BS–NCP and SUBTLEX-PL corporafor all words (upper panel; the red line shows a regression line predictingSUBTLEX-PL frequencies based on BC–NCP frequencies) and words
included in Experiment 1 (bottom panel) showing randomly sampledwords (red) and words with higher frequency (green) and lower frequen-cy (blue) in SUBTLEX-PL than in BS–NCP
Behav Res

derived from the BS–NCP corpus explained 45.53 % ofthe variance in RTs and 20.58 % in accuracy. In thiscase, the difference between the BS–NCP and SUBTLEX-PLcorpora was smaller, and word frequencies derived fromthe SUBTLEX-PL corpus explained 8.35 % more vari-ance for RTs but 2.15 % less variance for accuracy. The
difference was not significant for RTs (z = −1.84, p = .065)or accuracy (z = 0.45, p = .65).
For the full set of words, CD measures calculated on thebasis of SUBTLEX-PL accounted for the largest part of thevariance for both RTs and accuracy, explaining 59.72 % and20.81% of variance, respectively. This improvement of model
Table 1 Percentages of variance accounted for by the various frequency measures in Experiment 1
Model RT (%; all words) Accuracy (%; all words) RT (%; sampled words) Accuracy (%; sampled words)
Length + WFBS − NCP + WFBS − NCP2 39.09 8.90 45.53 20.58
Length + WFSUB − PL + WFSUB − PL2 58.64 19.07 53.88 18.43
Length + CDSUB − PL + CDSUB − PL2 59.72 20.81 54.35 19.26
Length + WFSUB − PL + WFSUB − PL2 + DLF 58.80 20.16 53.59 18.52
Length + CDSUB − PL + CDSUB − PL2 + DLF 59.77 21.64 54.10 19.20
Length + WFSUM + WFSUM2 50.99 19.14 51.01 22.01
Length + WFAVG + WFAVG2 58.36 21.38 55.46 21.77
Note. Columns 2 and 3 show the results for all words in the experiment; columns 4 and 5 show the results for randomly sampled words. WF = wordfrequency (Zipf scale), DLF = log10 of dominant lemma frequency, BS–NCP =Balanced Subcorpus–National Corpus of Polish, SUB-PL = PolishSubtitle Corpus, WFSUM = normalized (Zipf scale) sum of word frequencies in SUBTLEX-PL and BS–NCP, WFAVG = averaged Zipf scale frequency inthe two corpora
BS−NCP SUBTLEX−PL
500
600
700
800
0 2 4 6 0 2 4 6Word frequency (Zipf scale)
Rea
ctio
n tim
e [m
s]
Fig. 2 Reaction times in Experiment 1 for words and their frequencies inthe BS–NCP (left) and SUBTLEX-PL (right) corpora. Reaction times forwords that had much higher frequencies in BS–NCP, as compared withSUBTLEX-PL (blue), are shifted upward from the regression line, whilewords that have higher frequencies in SUBTLEX-PL than in BS–NCP(green) tend to be responded to faster than would be predicted on the basis
of BS–NCP frequencies. Reaction times predicted on the basis ofSUBTLEX-PL line up much closer to the regression line. For words thatwere randomly sampled from the full set of words (red), this difference isless apparent, but it is still reflected in R2. Red lines represent predictionsof a linear model with word frequency and its square term as predictors(with standard error in the shaded area)
Behav Res

predictions, relative to the one based onword frequencies, wasstatistically significant for both RTs (z = 2.41, p = .016) andaccuracy (z = 2.57, p = .010).When only randomly selectedwords were included in the analysis, CD explained 54.35 % ofvariance for RTs and 19.26 % for accuracy. This was notsignificantly better than the model based on subtitle wordfrequencies for RTs (z = 0.86, p = .39) or for accuracy (z =1.15, p = .25).
To examine the importance of lemma frequency, we con-ducted further analyses including dominant lemma frequencyas an additional predictor. This predictor turned out to addvery little to the total amount of explained variance. TheVuong test has not indicated in any case that the modelincluding this predictor should be preferred over a simplermodel.
In addition to analyses based on frequencies derived fromSUBTLEX-PL and BS–NCP, we also calculated compoundmeasures of word frequency, taking into account frequenciesin the two corpora simultaneously: their summed frequency(transformed to the Zipf scale after summation) and theiraveraged normalized (Zipf scale) frequency. In the case ofthe full set of word stimuli, in comparison with BS–NCPfrequencies, the summed frequency measure explained11.89 % more variance in RTs (z = 6.38, p < .001) and10.24 % more variance in accuracy (z = 2.97, p = .003). Incomparison with subtitle frequencies, it explained 7.66 % lessvariance in RTs (z = −2.93, p = .003) and a similar amount ofvariance in accuracy (z = 0.016, p = .99). The averagedfrequency explained 7.3 % more variance in RTs than didthe summed frequency (z = 4.40, p < .001) and a comparableamount of variance to subtitle frequencies (z = −0.16, p = .87).For accuracy, its predictions were not significantly betterthan summed frequencies (z = 0.84, p = .40) or subtitlefrequencies (z = 1.03, p = .30) and outperformed onlyBS–NCP-based frequencies (by 12.50 % of explainedvariance; z = 4.157, p < .001).
For a randomly sampled set of words, the compoundmeasures performed particularly well: The model using esti-mates based on averaged normalized frequency in the twocorpora accounted for 1.1 %more variance in RTs than did thenext best model (based on SUBTLEX-PL contextual diversi-ty), but the difference between the two models was not statis-tically significant (z = 0.38, p = .70). In comparison with themodel based on BS–NCP word frequencies, both summedfrequency (z = 2.86, p = .004) and averaged frequency (z =3.65, p < .001) performed significantly better in predictingRTs. As compared with the model based on SUBTLEX-PLfrequencies, the difference was not statistically significant foreither of the compound measures (for summed word frequen-cy, z = −0.073, p = .46; for averaged word frequency z = 0.57,p = .57). The two compound measures were also best atpredicting accuracy, but none of the differences in accuracyreached the level of statistical significance (z < 1.96).
Discussion
In Experiment 1, we found a general advantage ofSUBTLEX-PL frequencies. The difference was larger whenstimuli with extremely divergent frequency estimates wereincluded in the analyzed data set. At first sight, these resultssuggest that the SUBTLEX-PL word frequencies are morebalanced than the BS–NCP word frequencies: RTs for thethree different groups of stimuli are in line with the predictionsfrom SUBTLEX-PL. On the other hand, the BS–NCP fre-quencies seem to severely underestimate RTs for words thathave a much lower occurrence in SUBTLEX-PL (shown inblue in Fig. 2). This could indicate that the BS–NCP corpushas inflated frequency estimates for these words, of whichmost could be characterized as belonging to a very formalregister.
However, we should note that the frequency range of thesample of words for which BS–NCP makes the worst predic-tions is very restricted, making a general conclusion about theglobal suitability of the BS–NCP frequencies premature.Researchers will not often encounter a situation where anexperiment requires exactly this register of words. Moreover,when only randomly sampled words were included in the dataset, the difference between performance of the two frequencyestimates was smaller, and the advantage of SUBTLEX-PLwas no longer statistically significant.
In additional analyses, we have shown that compoundfrequency estimates, taking into account both corpora simul-taneously, can be particularly good predictors of performancein a lexical decision task. This can be due to the fact thatconsidering the two corpora simultaneously involves a signif-icant increase in the overall size of a sample of a language onwhich frequency estimates are based. In addition to that,compounding word frequency estimates may help reduce biasfor certain registers that may be present in the individualcorpora.
In Experiment 2, we propose a comparison of the two wordfrequency measures in which the entire frequency distributionis examined and undue bias from a particular register isavoided.
Experiment 2
Method
Participants
For the second experiment, 43 female participants and 15male participants took part in an online experiment. Meanage of the participants was 27.07 (SD = 4.08; 1 of the partic-ipants did not give information about age).
Behav Res

Stimuli
Three hundred word stimuli were selected using a two-stepsampling procedure. First, simple Good-Turing Smoothing(e.g., Gale & Sampson, 1995) was applied to the wordf requenc ies f rom BS–NCP and SUBTLEX-PL(Brysbaert & Diependaele, 2013). Words that were pres-ent in both word frequency lists and had a length of atleast three letters were considered for further selection ifthey were included in the PWN dictionary (http://sjp.pwn.pl). The probability of a word being selected forthe experiment was proportional to its simple Good-Turing Smoothed probability, averaged over BS–NCPand SUBTLEX-PL. Once a word had been selected,other words forms of the same lemma were ignored,avoiding including different inflections of the sameword in the stimulus list. Three hundred nonwords weregenerated using Wuggy (Keuleers & Brysbaert, 2010)on the basis of an independent sample of words fromthe SUBTLEX-PL and BS–NCP corpora.
Figure 3 shows the relationship between the BS–NCPand SUBTLEX-PL word frequencies for the stimuli inExperiment 2. Standard deviation in word frequency(Zipf scale) was 1.46 (mean=3.81) for BS–NCP and1.59 (mean=3.72) for SUBTLEX-PL. There were no
statistically significant differences between frequenciesderived from the two corpora in means (Welsh’s t-test), t(594) = −0.74, p = .46, or their variances,F(299, 299) = 1.2, p = .14.
Design
The experiment was administered in a Web browser, usingcustom-designed software, taking into account timing(Crump, McDonnell, & Gureckis, 2013). Participants wereinstructed to respond by pressing “J” if they thought that thepresented stimulus was a word and “F” if they thought that itwas not a word. After a short training block with 4 words and4 nonwords, during which feedback was given after each trial,experimental stimuli were presented in five blocks. For eachblock, 60 words and 60 nonwords were chosen at random.After each block, feedback was given about performance(mean RT for words and overall accuracy in the precedingblock). Participants were allowed to take a short break be-tween blocks. Stimuli were presented in black font on a whitebackground until the participant gave a response, after whichthe screen would be blank for 500 ms before the next stimuluswas displayed. During the experiment, a continuous progressbar was presented in the upper part of the screen.
2
4
6
2 4 6BS−NCP word frequency (Zipf scale)
SU
BT
LEX
−P
L w
ord
freq
uenc
y (Z
ipf s
cale
)
Fig. 3 Frequencies in the BS–NCP and SUBTLEX-PL corpora for words included in Experiment 2
Behav Res

Results
To exclude outliers from the analyzed data set, a two-stepprocedure was applied. First, we excluded all trials with RTslonger than 3,000 ms. Next, all observations in which RTswere outside a range of whiskers of a boxplot adjusted forskewed distributions (calculated separately for words andnonwords for each participant in each block; Hubert &Vandervieren, 2008) were removed from the data set. In total,8 % of trials were removed.
The mean accuracy was .96 for words and .97 for non-words. Mean RT was 893.97 (SD = 188.03) for words and1,043.79 (SD = 174.63) for nonwords. On average, the RTswere substantially longer than in the first experiment, mostlikely because of the lack of a time-out and the fact that mostparticipants in Experiment 1 were used to taking experimentsfor course credit.
Reliability of the RTand accuracy measures was computedin the same way as for Experiment 1. The mean correctedreliability was .94 (SD = .005) for RTs and .88 (SD = .013) foraccuracy.
In Experiment 2, as compared with SUBTLEX-PL fre-quencies, the BS–NCP frequencies accounted for 2.4 % morevariance in RTs and for 3 % more variance in accuracy (seealso Table 2 and Fig. 4); however, the difference in perfor-mance of the two models was not statistically significant forRTs (z = 1.12, p = .26) or for accuracy (z = 1.00, p = .32). Thecompound frequency estimates turned out to give the mostaccurate predictions of RTs. Although, in comparison with themodel based on BS–NCP word frequencies, this differencewas not statistically significant for summed frequencies (z =1.49, p = .14) or for averaged frequencies (z = 0.83, p = .40),in comparison with the model based on movie subtitles, bothcompound measures performed significantly better: Thesummed frequencies explained 3.4 % more variance (z =2.02, p = .043) and averaged frequencies 3.2 % more variance(z = 2.66, p = .008) in RTs. The model, which includeddominant lemma frequencies in addition to subtitle
frequencies, significantly outperformed the model without thispredictor (z = 2.11, p = .035).
For accuracy, the measures derived from BS–NCP follow-ed these based on SUBTLEX-PL contextual diversity anddominant lemma frequency in explained percentage of thevariance. None of the differences in accuracy reached the levelof statistical significance (z < 1.96).
Discussion
In Experiment 2, the compound measures again performedbest in predicting behavioral data. Interestingly, for modelsbased on frequency estimates derived from BS–NCP andSUBTLEX-PL, we observed a reversed pattern, relative toExperiment 1: The SUBTLEX-PL frequencies were nowworse at predicting RTs, as compared with the compoundmeasures, but this was not the case for BS–NCP frequencies.Even more surprisingly, the randomly sampled words inExperiment 1 showed the reverse pattern. We suspected thatthis was caused by different means and standard deviations infrequencies between the two experiments. The average fre-quency was higher in the first experiment (for both corpora)than in the second experiment. Hence, the two corpora maydiffer in their potential to explain variance in RTs in variousfrequency ranges. To test this hypothesis, we performed anadditional analysis using a linear regression model with num-ber of letters, word frequency in BS–NCP, word frequency inSUBTLEX-PL, and the interaction between the frequencies ofboth corpora. Table 3 shows the results of this analysis.Because the interaction between the two frequency measuresturned out to be highly significant, we decided to conduct anadditional analysis. We split the set of words in Experiment 2at the median point of average word frequency in the twocorpora (3.8, Zipf scale). We observed (see Table 4) that theBS–NCP frequencies are better in predicting RTs and accura-cy in the lower part of the frequency range, while SUBTLEX-PL frequencies are better in predicting these variables in thehigher part of the frequency range. The difference in perfor-mance of the models based on frequencies derived fromindividual corpora was not significant in the upper part ofthe frequency range (z = 1.72, p = .086) or in the lower part ofthe frequency range (z = 1.34, p = .18), but the model based onaveraged frequencies was best in both frequency ranges. Itsignificantly outperformed BS–NCP-based frequencies in thehigher range (z = 2.34, p = .019) and the model based onsubtitle frequencies in the lower range (z = 2.03, p = .042). Foraccuracy, the Vuong test did not show preference for any ofthe models (z < 1.96).
In order to verify whether a similar interaction betweenfrequency estimates derived from primarily written-text andsubtitle-based corpora can be found in other languages, weconducted an additional analysis using RTs collected in theBritish Lexicon Project (BLP; Keuleers et al., 2011). We used
Table 2 Percentages of variance accounted for by the various frequencymeasures in Experiment 2
Model RT (%) Accuracy (%)
Length + WFBS − NCP + WFBS − NCP2 70.48 19.05
Length + WFSUB − PL + WFSUB − PL2 68.06 16.02
Length + CDSUB − PL + CDSUB − PL2 68.32 17.4
Length + WFSUB − PL + WFSUB − PL2 + DLF 70.71 18.96
Length + CDSUB − PL + CDSUB − PL2 + DLF 70.72 19.55
Length + WFSUM + WFSUM2 71.45 18.37
Length + WFAVG + WFAVG2 71.31 18.51
Note. WF = word frequency, BS–NCP = Balanced Subcorpus–NationalCorpus of Polish, SUB-PL = Polish Subtitle Corpus
Behav Res

frequency estimates from the British National Corpus (BNC;Kilgarriff, 2006), which consists mostly of written languageand contains about 100 million words, and SUBTLEX-UK(van Heuven et al., 2014). To emulate the setup of the exper-iment reported in the present article and to better balance thenumber of words from different frequency ranges, we ran 1,000simulations in which we randomly chose 300 words from theBLP with weights proportional to the averaged word frequency(Zipf scale) of the BNC and SUBTLEX-UK. For each sample,we fitted a linear model with number of letters, word frequency
in the BNC, word frequency in SUBTLEX-UK, and the inter-action between the word frequencies of both corpora.
We found that the interaction between the two frequencymeasures was highly significant (p < .001) in all 1,000 simu-lations. At the same time, we did not find an advantage ofBNC word frequencies in the lower part of the frequencyspectrum when the stimuli in each of the samples was splitat the median point (mean median point=3.21, SD = 0.061,Zipf scale). Across all the samples, in the lower part of the
BS−NCP SUBTLEX−PL
750
1000
1250
1500
2 4 6 2 4 6Word frequency (Zipf scale)
Rea
ctio
n tim
e [m
s]
Fig. 4 Reaction times for words and their frequencies in the BS–NCP (left) and SUBTLEX-PL (right) corpora. The red lines represent predictions of alinear model with word frequency and its square term
Table 3 Regression model for predicting reaction times using length of aword, frequencies derived from BS–NCP and SUBTLEX-PL, and inter-action term between the two corpora
Estimate SE t-value p
Intercept 772.67 21.07 36.67 <2e-16
Length 15.46 2.58 5.99 6.1e-09
WFBS-NCP −105.87 13.28 −7.97 3.5e-14
WFSUB − PL −101.47 14.75 −6.88 3.6e-10
WFSUB − PL * WFBS-NCP 17.05 2.61 6.54 2.7e-10
Adjusted R2 = .71; F(4, 295) = 186.00, p < 2e-16
Note. The frequencies were centered before being entered into the linearregression
Table 4 Percentage of variance explained by frequency estimates de-rived from the two corpora (the data set fromExperiment 2 was split at themedian)
Frequency Model RT (%) Accuracy(%)
> median length + WFBS − NCP + WFBS − NCP2 27.49 9.65
> median length + WFSUB − PL + WFSUB − PL2 33.89 11.72
> median length + WFSUM + WFSUM2 31.89 11.63
> median length + WFAVG + WFAVG2 33.79 12.17
≤ median length + WFBS − NCP + WFBS − NCP2 45.70 14.05
≤ median length + WFSUB − PL + WFSUB − PL2 38.38 12.92
≤ median length + WFSUM + WFSUM2 46.20 13.89
≤ median length + WFAVG + WFAVG2 45.45 14.38
Behav Res
range, SUBTLEX-UK frequencies accounted for 9.59% of thevariance (SD = 5.00), and BNC frequencies for 6.61 % (SD =4.23) of the variance. In the upper part of the frequency range,SUBTLEX-UK frequencies accounted for 29.73 % (SD = 6.9)of the variance, and BNC frequencies for 24.59 % (SD = 6.26)of the variance. Interestingly, averaged word frequencyaccounted for slightly more variance than did SUBTLEX-UK in both lower (mean=10.53 %, SD = 5.00) and upper(mean=30.25 %, SD = 6.58) ranges. The averaged wordfrequency was also slightly better at predicting RTs for the fullset of words (mean=44.04 %, SD = 4.74) than were individualfrequency measures (SUBTLEX-PL, mean=43.23 %, SD =4.77; BNC, mean=40.34 %, SD = 4.66). We compared R2
values obtained in the simulations using the Welsh t-test. Dueto the large number of simulations, all reported differenceswere statistically significant, except for the difference betweenaveraged word frequencies and SUBTLEX-UK frequencies inthe upper part of the frequency range.
Conclusions
We presented new word frequency estimates for Polish basedon film and television subtitles and, in two lexical decisionexperiments, validated their usefulness by comparing themwith estimates derived from BS–NCP, as well as with com-pound frequency estimates derived from the two text corpora.
We found a large advantage of SUBTLEX-PL over BS–NCP when words for which estimates given by the twocorpora differed most were used as stimuli. In contrast, whenwe sampled words randomly, the advantage became lesspronounced (Experiment 1) or tended to favor the BS–NCP-derived frequencies (Experiment 2).
These results suggest that the relationship between frequen-cy estimates derived from different corpora and human per-formance in behavioral tasks may be complex. In particular,this shows that the stimulus selection procedure may affect theoutcome of a validation experiment. For a comparative study
to be informative, it is essential to find an unbiased method ofstimulus selection. Although it is reasonable to assume that themore words included in a validation study, the more relevantits results, it has to be taken into account that even selectingwords from a megastudy for validation (e.g., Keuleers et al.,2010) may introduce bias and make it easier for one of thecorpora to provide good frequency estimates than do othercorpora. For instance, if only mono- and disyllabic words areincluded in a study, the mean frequency may be shifted,relative to the mean in the full lexicon, because of a negativecorrelation between word frequency and word length. In sucha case, a corpus that does better in predicting behavioralmeasures in higher parts of the frequency range would befavored. Using the BLP data, we failed to replicate the advan-tage of a written text corpus in the lower frequency range,although we found a similar overall interaction between wordfrequency measures. Also, the small total amount of explainedvariance in the range below the median point in this analysismay suggest that mono- and disyllabic words do not representthe lexicon well in that frequency range.
Moreover, it should be considered whether including a full setof words in validation studies is an optimal choice. If a wordfrequency distribution of a full lexicon were reflected in astimulus set of a validation study, due to properties of a Zipfiandistribution, the vast majority of words would have to be on thelow extreme of the possible frequency range, and, because inlinear regression all observations contribute equally to the results,R2 would be determined mostly in the very low part of thefrequency distribution. In this case, the results of linear regressionwould not be very informative for high-frequency words.
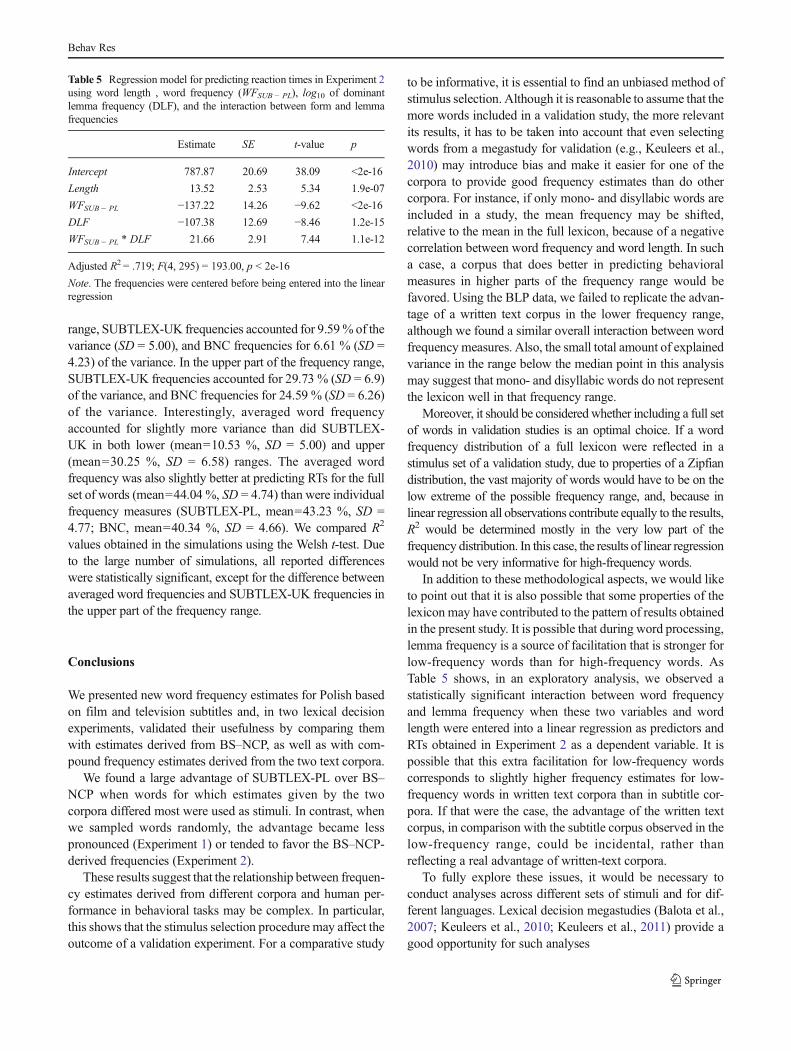
In addition to these methodological aspects, we would liketo point out that it is also possible that some properties of thelexicon may have contributed to the pattern of results obtainedin the present study. It is possible that during word processing,lemma frequency is a source of facilitation that is stronger forlow-frequency words than for high-frequency words. AsTable 5 shows, in an exploratory analysis, we observed astatistically significant interaction between word frequencyand lemma frequency when these two variables and wordlength were entered into a linear regression as predictors andRTs obtained in Experiment 2 as a dependent variable. It ispossible that this extra facilitation for low-frequency wordscorresponds to slightly higher frequency estimates for low-frequency words in written text corpora than in subtitle cor-pora. If that were the case, the advantage of the written textcorpus, in comparison with the subtitle corpus observed in thelow-frequency range, could be incidental, rather thanreflecting a real advantage of written-text corpora.
To fully explore these issues, it would be necessary toconduct analyses across different sets of stimuli and for dif-ferent languages. Lexical decision megastudies (Balota et al.,2007; Keuleers et al., 2010; Keuleers et al., 2011) provide agood opportunity for such analyses
Table 5 Regression model for predicting reaction times in Experiment 2using word length , word frequency (WFSUB − PL), log10 of dominantlemma frequency (DLF), and the interaction between form and lemmafrequencies
Estimate SE t-value p
Intercept 787.87 20.69 38.09 <2e-16
Length 13.52 2.53 5.34 1.9e-07
WFSUB − PL −137.22 14.26 −9.62 <2e-16
DLF −107.38 12.69 −8.46 1.2e-15
WFSUB − PL * DLF 21.66 2.91 7.44 1.1e-12
Adjusted R2 = .719; F(4, 295) = 193.00, p < 2e-16
Note. The frequencies were centered before being entered into the linearregression
Behav Res

Nevertheless, even with a validation using a limited set ofwords, the results of the two experiments suggest that bothSUBTLEX-PL and BS–NCP are valuable sources of wordfrequency estimates. In most cases, we would advise re-searchers to use the averaged compound measure derivedfrom the two corpora whenever possible. At the same time,we do not have enough evidence to strongly suggest the samepractice in other languages. It must also be kept in mind thatfor certain classes of words, one of the corpora may givestrongly biased frequency estimates. We have shown that forBS–NCP, a subset of low-frequency words used mostly informal communication may belong to such a category.
Availability
SUBTLEX-PL frequencies and compound SUBTLEX-PL/BS–NCP frequencies are available for research purposes andcan be downloaded in RData and csv formats from http://crr.ugent.be/subtlex-pl. They can also be accessed online using aWeb interface. Frequencies for words with contextual diversityabove 2 are also available in the xlsx (Microsoft Excel) format.
The whole word frequency data set for individual words iscontained in two files. The first file includes all strings found inthe text corpus with rich information about their part-of-speechtags. The columns give information about the following:
& spelling& spellcheck—whether the string was accepted as a correct
word by the Aspell spell-checker& alphabetical—whether the word contains only alphabeti-
cal characters& nchar—number of characters in the string
SUBTLEX–PL frequency measures:
& freq—count of how many times the type appears in thesubtitles
& capit.freq—count of how many times the type wascapitalized
& cd—percentage of film subtitles in which the type appears& cd.count—count of film subtitles in which the type appears& dom.pos—most frequent part of speech assigned to the type& dom.pos.freq—how many times this part of speech was
assigned to the type& dom.lemma.pos—dominant lemma5 for the type& dom.lemma.pos.freq—how many times this lemma was
assigned to the type& dom.lemma.pos.total.freq—total frequency of the most
frequent lemma for the type (across all types)
& all.pos—list of all part-of-speech assignments for the type& all.pos.freq—list of frequencies for all corresponding part-
of-speech assignments in all.pos for the type& all.lemma.pos—list of all lemma assignments for the type& all.lemma.pos.freq—list of frequencies for corresponding
lemmas in all.lemma.pos for the type& all.lemma.pos.total.freq—total frequencies (across all
types) of all corresponding lemmas in all.lemma.pos& lg.freq—log10 of subtitle word frequency& lg.mln.freq—log10 of subtitle word frequency per million& zipf.freq—Zipf scale word frequency& lg.cd—log10 of contextual diversity
Compound frequency measures:
& freq.sn.sum—sum of SUBTLEX-PL and BS–NCP wordfrequencies
& zipf.freq.sn.sum—normalized (Zipf scale) sum ofSUBTLEX-PL and BS–NCP word frequencies
& avg.zipf.freq.sn—averaged Zipf frequencies inSUBTLEX-PL and BS–NCP
The second file contains detailed information about lemmafrequencies and particular forms for which this lemma wasassigned. The columns in this file are the following:
& lemma—spelling of a base form of a lemma& pos—part-of-speech tag assigned to a lemma& spelling—word form assigned to a lemma& freq—total frequency of a lemma or its inflected form& cd.count—count of unique film subtitles in which the
lemma or its inflected form appears& cd—percentage of unique film subtitles in which the
lemma or one of its inflected forms appears
Frequencies for word bigrams are included in a third filegiving information about bigram frequency, contextual diver-sity, and all punctuation marks separating the words and theirfrequencies.
Acknowledgments This study was supported by an Odysseus grantawarded by the Government of Flanders to M.B. and a subsidy from theFoundation for Polish Science (FOCUS program) awarded to Z.W. Wethank Jon Andoni Duñabeitia, Gregory Francis, and an anonymous re-viewer for insightful comments on an earlier draft of the manuscript, AdamPrzepiórkowski for providing access to the BS–NCPword frequencies, andJakub Szewczyk for his help with syllabification of Polish words.
References
Adelman, J. S., Brown, G. D. A., & Quesada, J. F. (2006). Contextualdiversity, not word frequency, determines word-naming and lexicaldecision times. Psychological Science, 17(9), 814–823. doi:10.1111/j.1467-9280.2006.01787.x
5 For practical reasons, we assume that lemma is equivalent to a concat-enation of a base form of a word and an associated part of speech tag.
Behav Res

Arnon, I., & Snider, N. (2010). More than words: Frequency effects formulti-word phrases. Journal of Memory and Language, 62(1), 67–82. doi:10.1016/j.jml.2009.09.005
Balota, D. A., Cortese, M. J., Sergent-Marshall, S. D., Spieler, D. H., &Yap, M. (2004). Visual word recognition of single-syllable words.Journal of Experimental Psychology: General, 133(2), 283–316.doi:10.1037/0096-3445.133.2.283
Balota, D. A., Yap, M. J., Hutchison, K. A., Cortese, M. J., Kessler, B.,Loftis, B., … Treiman, R. (2007). The english lexicon project.Behavior Research Methods, 39(3), 445–459. Retrieved fromhttp://link.springer.com/article/10.3758/BF03193014
Blei, D. M., Ng, A. Y., & Jordan, M. I. (2003). Latentdirichlet allocation. The Journal of Machine LearningResearch, 3, 993–1022.
Brown, W. (1910). Some experimental results in the correlation ofmental abilities. British Journal of Psychology, 3(3), 296–322.
Brysbaert, M., Buchmeier, M., Conrad, M., Jacobs, A. M., Bölte, J., &Böhl, A. (2011). The word frequency effect: A review of recentdevelopments and implications for the choice of frequency estimatesin German. Experimental Psychology (formerly Zeitschrift fürExperimentelle Psychologie), 58(5), 412–424. doi:10.1027/1618-3169/a000123
Brysbaert, M., & New, B. (2009). Moving beyond Kučera and Francis: Acritical evaluation of current word frequency norms and the intro-duction of a new and improved word frequency measure forAmerican English. Behavior Research Methods, 41(4), 977–990.doi:10.3758/BRM.41.4.977
Brysbaert, M., & Diependaele, K. (2013). Dealing with zero word fre-quencies: A review of the existing rules of thumb and a suggestionfor an evidence-based choice. Behavior Research Methods, 45(2),422–430. doi:10.3758/s13428-012-0270-5
Cai, Q., & Brysbaert, M. (2010). SUBTLEX-CH: Chinese word andcharacter frequencies based on film subtitles. PLoS One, 5(6),e10729. Retrieved from doi:10.1371/journal.pone.0010729
Crump, M. J. C., McDonnell, J. V., & Gureckis, T. M. (2013). EvaluatingAmazon’s mechanical turk as a tool for experimental behavioralresearch. PLoS ONE, 8(3), e57410. doi:10.1371/journal.pone.0057410
Cuetos Vega, F., González Nosti, M., Barbón Gutiérrez, A., & Brysbaert,M. (2011). SUBTLEX-ESP: Spanish word frequencies based onfilm subtitles. Psicológica: Revista de metodología y psicologíaexperimental, 32(2), 133–143. Retrieved from http://dialnet.unirioja.es/servlet/articulo?codigo=3663992
Dimitropoulou, M., Duñabeitia, J. A., Avilés, A., Corral, J., & Carreiras,M. (2010). Subtitle-BasedWord Frequencies as the Best Estimate ofReading Behavior: The Case of Greek. Frontiers in Psychology, 1.doi:10.3389/fpsyg.2010.00218
Gale, W., & Sampson, G. (1995). Good-Turing frequency estimationwithout tears. Journal of Quantitative Linguistics, 2, 217–237.Retrieved from http://www.grsampson.net/AGtf.html
Hubert, M., & Vandervieren, E. (2008). An adjusted boxplot for skeweddistributions. Comput. Stat. Data Anal., 52(12), 5186–5201. doi:10.1016/j.csda.2007.11.008
Keuleers, E., & Brysbaert, M. (2010). Wuggy: A multilingualpseudoword generator. Behavior Research Methods, 42(3), 627–633. doi:10.3758/BRM.42.3.627
Keuleers, E., Brysbaert, M., & New, B. (2010a). SUBTLEX-NL: A newmeasure for Dutch word frequency based on film subtitles. BehaviorResearch Methods, 42(3), 643–650. doi:10.3758/BRM.42.3.643
Keuleers, E., Diependaele, K., & Brysbaert, M. (2010). Practice effects inlarge-scale visual word recognition studies: A lexical decision studyon 14,000 Dutch mono- and disyllabic words and nonwords.Frontiers in Psychology, 1. doi:10.3389/fpsyg.2010.00174
Keuleers, E., Lacey, P., Rastle, K., & Brysbaert, M. (2011). The Britishlexicon project: Lexical decision data for 28,730 monosyllabic anddisyllabic English words. Behavior Research Methods, 44(1), 287–304. doi:10.3758/s13428-011-0118-4
Kilgarriff, A. (2006). BNC database and word frequency lists. RetrievedMay 25, 2014, from http://www.kilgarriff.co.uk/bnc-readme.html
Korpus Języka Polskiego Wydawnictwa Naukowego PWN. (n.d.).Retrieved January 9, 2014, from http://korpus.pwn.pl/
Kurcz, I., Lewicki, A., Sambor, J., Szafran, K., & Woroniczak, J. (1990).Słownik frekwencyjny poszczyzny współczesnej. Kraków: InstytutJęzyka Polskiego PAN.
Lewis, M. P., Simons, G., & Fennig, C.D. (Eds.). (2013). Ethnologue:Languages of the World, Seventeenth edition. Dallas, Texas: SILInternational. Online version: http://www.ethnologue.com
New, B., Brysbaert, M., Veronis, J., & Pallier, C. (2007). The use of filmsubtitles to estimate word frequencies. Applied Psycholinguistics,28(04). doi:10.1017/S014271640707035X
Piasecki, M. (2007). Polish tagger TaKIPI: Rule based construction andoptimisation. Task Quarterly, 11(1–2), 151–167.
Przepiórkowski, A. (2012). Narodowy Korpus Jezyka Polskiego: pracazbiorowa. Warszawa: Wydawnictwo Naukowe PWN.
Przepiórkowski, A., & Instytut Podstaw Informatyki. (2004). The IPIPAN corpus: preliminary version. Warszawa: IPI PAN.
Schreuder, R., & Baayen, R. H. (1997). How complex simplex words canbe. Journal of Memory and Language, 37(1), 118–139. doi:10.1006/jmla.1997.2510
Siyanova-Chanturia, A., Conklin, K., & van Heuven, W. J. B. (2011).Seeing a phrase “time and again” matters: The role of phrasalfrequency in the processing of multiword sequences. Journal ofExperimental Psychology: Learning, Memory, and Cognition,37(3), 776–784. doi:10.1037/a0022531
Spearman, C. (1910). Correlation calculated from faulty data. BritishJournal of Psychology, 3(3), 271–295.
Woliński, M. (2006). Morfeusz— a Practical Tool for the MorphologicalAnalysis of Polish. In M. Kłopotek, S. Wierzchoń, & K.Trojanowski (Eds.), Intelligent Information Processing and WebMining (Vol. 35, pp. 511–520). Springer Berlin Heidelberg.Retrieved from doi:10.1007/3-540-33521-8_55
van Heuven, W. J. B., Mandera, P., Keuleers, E., & Brysbaert, M. (2014).Subtlex-UK: A new and improved word frequency database forBritish English. The Quarterly Journal of ExperimentalPsychology, 0(ja), 1–36. doi:10.1080/17470218.2013.850521
Vuong, Q. H. (1989). Likelihood ratio tests for model selection and non-nested hypotheses. Econometrica, 57(2), 307–333.
Behav Res