subsurface characterization of the pembina-wabamun acid
TRANSCRIPT

ERCB/AGS Special Report 093
Subsurface Characterization of the Pembina-Wabamun Acid-Gas Injection Area

Subsurface Characterization of the Pembina-Wabamun Acid-Gas Injection Area
Stefan Bachu Maja Buschkuehle
Kristine Haug Karsten Michael
Alberta Geological Survey
Alberta Energy and Utilities Board

©Her Majesty the Queen in Right of Alberta, 2008ISBN 978-0-7785-6950-3
The Energy Resources Conservation Board/Alberta Geological Survey (ERCB/AGS) and its employees and contractors make no warranty, guarantee or representation, express or implied, or assume any legal liability regarding the correctness, accuracy, completeness or reliability of this publication. Any digital data and software supplied with this publication are subject to the licence conditions. The data are supplied on the understanding that they are for the sole use of the licensee, and will not be redistributed in any form, in whole or in part, to third parties. Any references to proprietary software in the documentation, and/or any use of proprietary data formats in this release, do not constitute endorsement by the ERCB/AGS of any manufacturer's product.
If this product is an ERCB/AGS Special Report, the information is provided as received from the author and has not been edited for conformity to ERCB/AGS standards.
When using information from this publication in other publications or presentations, due acknowledgment should be given to the ERCB/AGS. The following reference format is recommended:
Bachu, S., Buschkuehle, M., Haug, K., Michael, K. (2008): Subsurface characterization of the Pembina-Wabamun acid-gas injection area; Energy Resources Conservation Board, ERCB/AGS Special Report 093, 60 p.
Published March 2008 by:Energy Resources Conservation BoardAlberta Geological Survey4th Floor, Twin Atria Building4999 – 98th AvenueEdmonton, AlbertaT6B 2X3Canada
Tel: (780) 422-1927 (Information Sales)Fax: (780) 422-1918E-mail: [email protected]: www.ags.gov.ab.ca This report is the AGS release of a 2003 client report prepared for the Acid Gas Management Committee, a consortium of provincial and federal agencies and industry partners. Financial support to conduct this study was received from Environment Canada, Alberta Environment, Climate Change Central, Alberta Energy Research Institute, Western Economic Development, British Columbia Ministry of Energy, Mines and Petroleum Resources, Saskatchewan Industry and Resources, Keyspan Energy, and Total.
ERCB/AGS Special Report 093 (March 2008) i

Contents
1 Introduction…………………………………………….……………………………...………..1
2 Selection of an Acid-Gas Injection Site……………...……………………………….………..3
2.1 Acid Gas Properties……………………….……………………………………..……3
2.2 Criteria for Site Selection.…………………………………………………………..…4
2.3 Issues ………………………………………………………………………………….6
3 Basin-Scale Setting of the Pembina-Wabamun Acid-Gas Injection Sites…………………..7
3.1 Basin Geology and Hydrostratigraphy…...……….……………………………......…7
3.2 Basin-Scale Flow of Formation Water……………..…..…………………………....12
4 Regional-Scale Setting of the Pembina-Wabamun Acid-Gas Injection Sites…………..….17
4.1 Geology of the Wabamun Group in West-Central Alberta………………………….17
4.2 Hydrogeology of the Wabamun Group in West-Central Alberta.……………...……20
5 Local-Scale Setting of the Pembina-Wabamun Acid-Gas Injection Sites…………………26
5.1 Geology of the Wabamun Group….…………………..……………………………..27
5.2 Lithology and Mineralogy of the Graminia-Wabamun-Banff/Exshaw Interval……..27
5.3 Rock Properties of the Wabamun Group...….…………………………..…...………32
5.4 Chemistry of Formation Water in the Wabamun Group…………………………….36
5.5 Pressure Regime in the Wabamun Group………………….…………...……………36
5.6 Flow of Formation Water in the Wabamun Group…….…..…….…………………..40
5.7 Stress Regime and Geomechanical Properties………….……………………………41
5.8 Site Specific Characteristics of the Acid Gas Operations……………………………44
6 Discussion………………………………………………………………………………………46
6.1 Acid Gas Migration……………………………………………………………..……46
6.2 Acid Gas Leakage………...……………………………………………………….…47
7 Conclusions…………….…………………………..……………………………………..……49
8 References………………..…………………………………………………………….………51
Figures
Figure 1. Location of the Pembina-Wabamun cluster of acid-gas injection sites in
western Canada at the end of 2002……..…………………………………….…..2
Figure 2. Phase diagrams for methane (CH4), carbon dioxide (CO2), hydrogen
sulphide (H2S) and a 50%-50% acid gas mixture; hydrate conditions
for CO2 and H2S……………………………………….…………..……..……….3
Figure 3. Solubility of water in acid gas as a function of pressure for:
a) different acid gas composition (CO2 and H2S) at 30oC,
and b) different temperatures for an acid gas with a composition
of 49% CO2, 49% H2S and 2% CH4………………..…………………………….5
Figure 4. Basin-scale stratigraphic and hydrostratigraphic delineation and
nomenclature for the southern and central parts of the Alberta Basin…….….…..9
ERCB/AGS Special Report 093 (March 2008) ii

Figure 5. Subcrop of the Wabamun Group at the pre-Cretaceous
unconformity in the Alberta Basin………………………………………………11
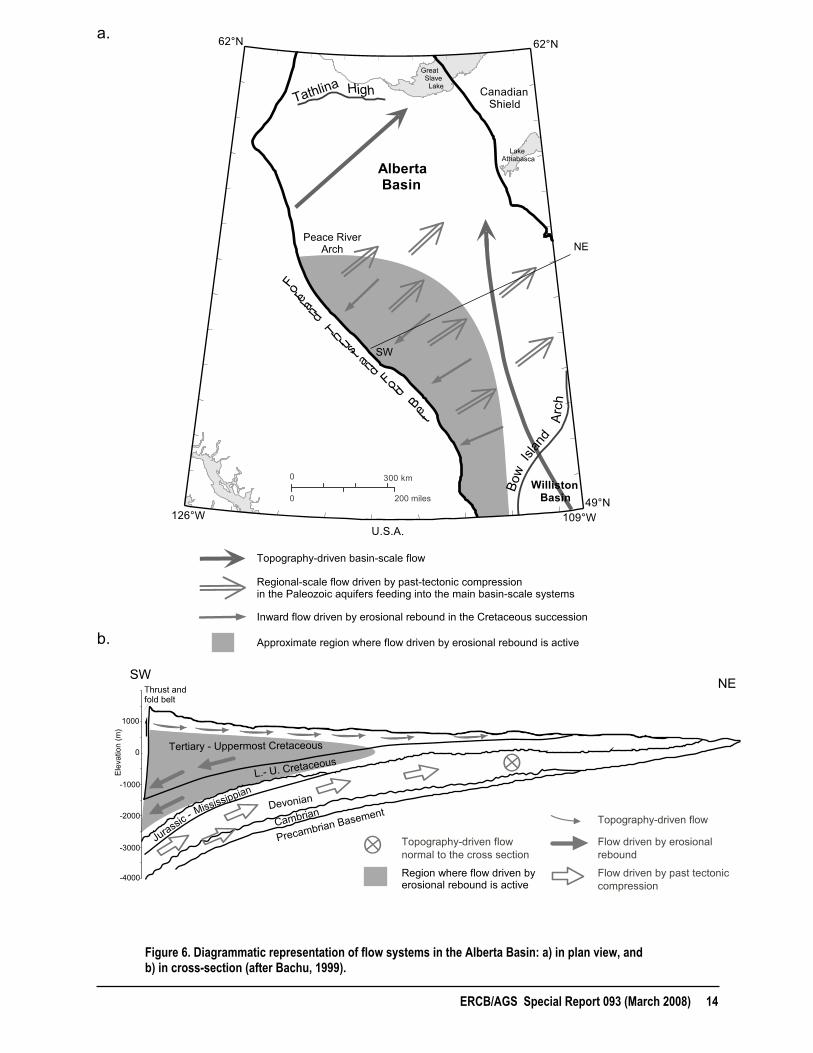
Figure 6. Diagrammatic representation of flow systems in the Alberta
Basin: a) in plan view, and b) in cross-section……………………..……..…….14
Figure 7. Lithofacies distribution of the Wabamun Group in the
Alberta Basin…………………….....…………………………………………...18
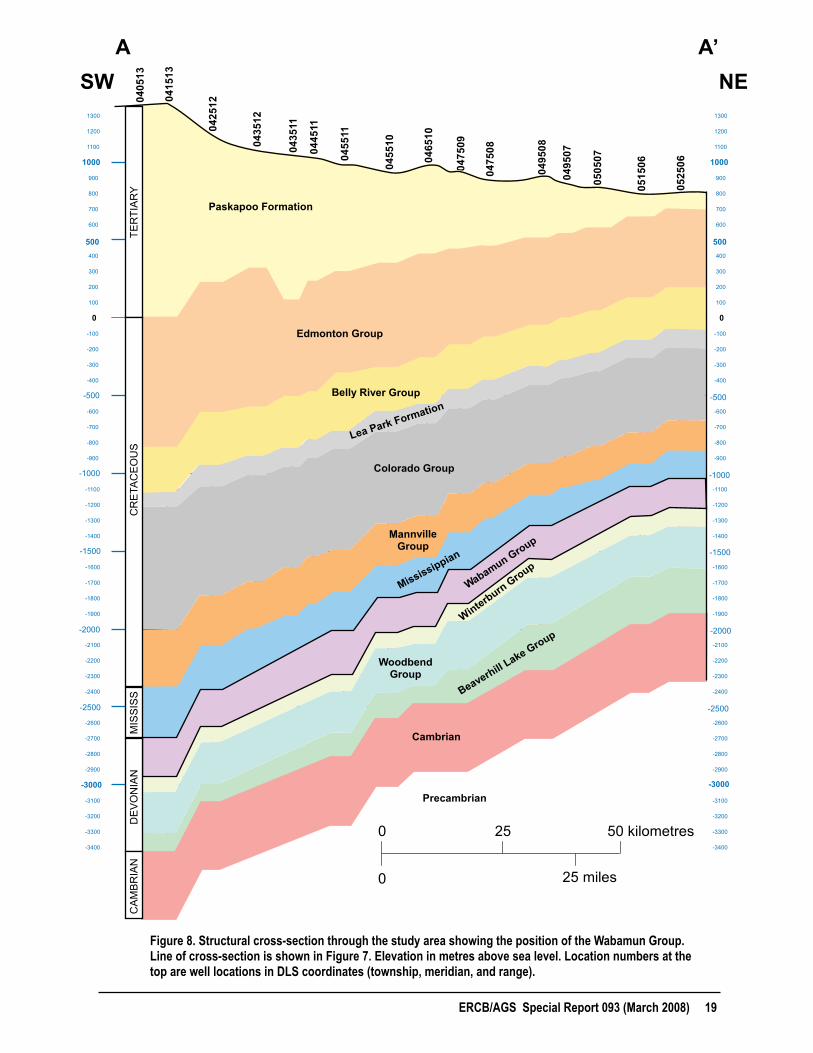
Figure 8. Structural cross-section through the study area showing the
position of the Wabamun Group.………………………………………………..19
Figure 9. Stratigraphic nomenclature of the Upper Devonian Wabamun
Group in west-central Alberta…………………………………………………...20
Figure 10. Top of the Wabamun Group in the regional-scale study area:
a) depth, and b) elevation..……………………………………………………....21
Figure 11. Hydrogeological characteristics of the Wabamun aquifer in
the regional-scale study area: a) salinity of formation
waters (g/l), and b) distributions of hydraulic heads (m)………………..………23
Figure 12. Hydrogeological characteristics of the Mississippian aquifer
in the regional-scale study area: a) salinity of formation
waters (g/l), and b) distributions of hydraulic heads (m)…………………..……24
Figure 13. Hydrogeological characteristics of the Winterburn aquifer
in the regional-scale study area: a) salinity of formation
waters (g/l), and b) distributions of hydraulic heads (m)…………………..……25
Figure 14. Location of the acid-gas injection sites in relation to the
Pembina oil field…..…………………………………………….………………27
Figure 15. Top of the Wabamun Group in the local-scale study area:
a) depth, and b) elevation..………………………………………………………28
Figure 16. Isopach of the Wabamun Group in the local-scale study area….……….………29
Figure 17. Isopach of the Graminia Formation of the Winterburn Group
in the local-scale study area.……………………………………………….……29
Figure 18. Isopach of the Mississippian, Banff and Exshaw formations
in the local-scale study area ………………………………………………….…31
Figure 19. Downhole stratigraphic model for the injection location at
Pembina Burlington in well 06-25-45-10W5…………………………..……….33
Figure 20. Downhole stratigraphic model for the injection location at
Pembina I in well 14-22-49-12W5…………………………………………..….34
ERCB/AGS Special Report 093 (March 2008) iii

Figure 21. Downhole stratigraphic model for the injection location at
Pembina II in well 02-11-51-10W5…………..…………………………………35
Figure 22. Stiff-diagram of Wabamun Formation waters in the local-scale study area…….36
Figure 23. Hydrogeological characteristics of the Wabamun aquifer in
the local-scale study area: a) salinity of formation water (g/l); and
b) hydraulic heads (m)…………………………………………………………..38
Figure 24. Variation of pressure with: a) depth and b) elevation, in the
Wabamun Group and adjacent formations in the local-scale study area..………39
Figure 25. Characteristics of the stress regime in the Wabamun Group
in the local-scale study area: a) vertical stresses, SV, and their
gradient, and b) minimum horizontal stresses, SHmin, and their orientation……..43
Figure 26. Current distribution of wells that penetrate the Wabamun Group
in the local-scale study area……………………………………………………..48
Tables
Table 1. X-ray fluorescence analysis of matrix rock from the Wabamun Group
in well 14-29-48-6W5 at 2154 m depth………………………………...….……31
Table 2. Well-scale porosity and permeability values obtained
from core-scale measurements in core plugs from the Wabamun
Group in the local-scale study area…………………………………...…………32
Table 3. Chemical analyses of formation water from the Wabamun Group
in the local-scale study area……….…………………………………………….37
Table 4. Geomechanical properties of rocks of interest from the Alberta Basin….……...44
Table 5. Characteristics of the acid-gas injection operations in the Wabamun
Group in the Pembina area………………………………………………………45
ERCB/AGS Special Report 093 (March 2008) iv

1 Introduction
Over the past decade, oil and gas producers in western Canada (Alberta and British Columbia)
have been faced with a growing challenge to reduce atmospheric emissions of hydrogen sulphide
(H2S), which is produced from “sour” hydrocarbon pools. Sour oil and gas are hydrocarbons that
contain H2S and carbon dioxide (CO2), which have to be removed before the produced oil or gas
is sent to markets. Since surface desulphurization through the Claus process is uneconomic, and
the surface storage of the produced sulphur constitutes a liability, increasingly more operators are
turning to acid gas disposal by injection into deep geological formations. Acid gas is a mixture of
H2S and CO2, with minor traces of hydrocarbons, that is the byproduct of “sweetening” sour
hydrocarbons. In addition to providing a cost-effective alternative to sulphur recovery, the deep
injection of acid gas reduces emissions of noxious substances into the atmosphere and alleviates
the public concern resulting from sour gas production and flaring.
The first acid-gas injection operation was started in 1989 in Alberta. To date, 42 injection sites
have been approved in Alberta and British Columbia; their locations are shown in Figure 1. In
Alberta, the Oil and Gas Conservation Act requires that operators apply for and obtain approval
from the Alberta Energy and Utilities Board (AEUB), the provincial regulatory agency, to
dispose of acid gas. Before approving any operation, the AEUB reviews the application to
maximize conservation of hydrocarbon resources, minimize environmental impact and ensure
public safety. To adequately address these matters, the AEUB requires that the applicants submit
information regarding surface facilities, injection well configurations, characteristics of the
injection reservoir or aquifer, and operations. After approval for acid gas injection is granted, the
operators have to submit to the regulatory agencies biannual progress reports on the operations.
Although the purpose of the acid-gas injection operations is to dispose of H2S, significant
quantities of CO2 are being injected at the same time because it is costly to separate the two
gases. Actually, more CO2 than H2S has been injected to date into deep geological formations in
western Canada. In the context of current efforts to reduce anthropogenic emissions of CO2, these
acid-gas injection operations represent an analogue to geological storage of CO2. The latter is an
immediately-available and technologically-feasible means of reducing CO2 emissions into the
atmosphere that is particularly suited for land-locked regions located on sedimentary basins, such
as the Alberta Basin in western Canada. Large-scale injection of CO2 into depleted oil and gas
reservoirs and into deep saline aquifers is one of the most promising methods of geological
storage of CO2, and in this respect it is no different from acid-gas injection operations. However,
before implementation of greenhouse gas geological storage, a series of questions needs
addressing, the most important ones relating to the short- and long-term fate of the injected CO2.
Thus, the study of the acid-gas injection operations in western Canada provides the opportunity to
learn about the safety of these operations and about the fate of the injected gases, and represents a
unique opportunity to investigate the feasibility of CO2 geological storage.
Geographically, the acid-gas injection operations in western Canada can be grouped in several
clusters (Figure 1). The operations located in the cluster situated southwest of Edmonton in the
Brazeau-Pembina area inject acid gas in the Upper Devonian Winterburn and Wabamun groups.
At the Brazeau site, acid gas is injected into the Nisku Q Pool in the Winterburn Group, and this
operation was the subject of a previous study. At three other sites injection takes place into the
overlying Wabamun Group. The fourth site, although approved by AEUB, was never
implemented by the operator. The subsurface characterization of the operations in the Pembina
area that inject acid gas into the Wabamun Group will help in understanding various issues that
relate to the disposal and/or sequestration of acid and greenhouse gases in geological media. The
ERCB/AGS Special Report 093 (March 2008) 1

�������� ��
�� ��� �
�� �
��� ���� �
������
�����������������
������ �!
� "���#$
� ����$���%
�������������
���������� ����������������������������� ����������� ����������� ������������������������������������������������
�����
���
��
�
��
�
��
����!&
��
�
����
����
���
��
��
�
'()�)�
�*+�,')�
�+'-(��
���
���
����
������
��������
.�/*� �*(��-����-(()�*()-�
����+�#�����0�%��
�� ��������
)%����
�!��
'�1
(��#&�,
�������%
2�$��
�
3�������4���
�
5�����(� �!
�
��!�%��6�3���'���
5�$0���
�
-�$������
5!� �%�
�
ERCB/AGS Special Report 093 (March 2008) 2

characterization is based on reservoir-scale data and information submitted by the operators to the
AEUB, on basin-scale work performed at the Alberta Geological Survey (AGS) during the last 15
years, and on specific, local and reservoir-scale work performed by the AGS specifically for this
report.
2 Selection of an Acid-Gas Injection Site
In Alberta, applications for acid gas disposal must conform to the specific requirements listed in
Chapter 4.2 of Guide 65 that deals with applications for conventional oil and gas reservoirs
(AEUB, 2000). The selection of an acid-gas injection site needs to address various considerations
that relate to: proximity to sour oil and gas production that is the source of acid gas; confinement
of the injected gas; effect of acid gas on the rock matrix; protection of energy, mineral and
groundwater resources; equity interests; wellbore integrity and public safety (Keushnig, 1995;
Longworth et al., 1996). The surface operations and the subsurface aspects of acid gas injection
depend on the properties of the H2S and CO2 mixture, which include, but are not limited to non-
aqueous phase behavior, water content, hydrate formation and the density and viscosity of the
acid gas (Carroll & Lui, 1997; Ng et al., 1999).
2.1 Acid Gas Properties
The acid gas obtained after the removal of H2S and CO2 from the sour gas may also contain 1%-
3% hydrocarbon gases, and is saturated with water vapor in the range of 2%. In their pure state,
CO2 and H2S have similar phase equilibria, but at different pressures and temperatures (Carroll,
1998a). They exhibit the normal vapour/liquid behavior with pressure and temperature (Figure 2),
with CO2 condensing at lower temperatures than H2S. Methane (CH4) also exhibits this behavior,
but at much lower temperatures. The phase behavior of the acid-gas binary system is represented
by a continuous series of two-phase envelopes (separating the liquid and gas phases) located
between the unary bounding systems in the pressure-temperature space (Figure 2).
Figure 2. Phase diagrams for methane (CH4), carbon dioxide (CO2), hydrogen sulphide (H2S) and a 50%-50% acid gas mixture; hydrate conditions for CO2 and H2S (after Wichert & Royan, 1996, 1997).
ERCB/AGS Special Report 093 (March 2008) 3

If water is present, both CO2 and H2S form hydrates at temperatures up to 10oC for CO2 and more
than 30oC for H2S (Carroll & Lui, 1997). If there is too little water, the water is dissolved in the
acid gas and hydrates will generally not form. However, phase diagrams show that hydrates can
form without free water being present (Carroll, 1998a,b), thus operating above the hydrate-
forming temperature is desirable. Unlike the case of hydrocarbon gases, the solubility of water in
both H2S and CO2, hence in acid gas, decreases as pressure increases up to 3-8 MPa, depending
on temperature, after which it dramatically increases (Figure 3). The solubility minimum reflects
the pressure at which the acid gas mixture passes into the dense liquid phase, where the solubility
of water can increase substantially with increasing pressure due to the molecular attraction
between these polar compounds (Wichert & Royan, 1996, 1997).
The properties of the acid gas mixture are important in facility design and operation because, to
optimize storage and minimize risk, the acid gas needs to be injected: (1) in a dense-fluid phase,
to increase storage capacity and decrease buoyancy; (2) at bottom-hole pressures greater than the
formation pressure, for injectivity; (3) at temperatures generally greater than 35oC to avoid
hydrate forming, which could plug the pipelines and well; and (4) with water content lower than
the saturation limit, to avoid corrosion.
After separation, the water-saturated acid-gas stream leaves the regeneration unit at 35 to 70 kPa
and must be cooled and then compressed for injection to pressures in excess of the subsurface
storage formation pressure. Typically, four stages of compression are required to provide the
required discharge pressure. By the 4th stage in a cycle, compression will tend to dewater the acid
gas up to a maximum pressure between 3 and 5 MPa (Figure 3), if there are no hydrocarbon
impurities present. Further compressing the acid gas to higher pressures increases the solubility of
water in the acid gas, such that any residual excess water dissolves into the acid gas, and more
than counteracts the decrease in solubility due to inter-stage cooling. To avoid pump cavitation,
the acid gas must not enter the two-phase region during compression. Once the acid gas is
compressed, it is transported through a pipeline to the injection wellhead usually at a short
distance from the gas plant. The high pressures after the fourth compression stage stabilize, upon
cooling, the high-density liquid-phase of the acid gas, which can have a density of approximately
75% of the density of water, providing the hydrocarbon content is not greater than approximately
2%.
Although a number of safety valves are always installed, both in the well and in the surface
facilities to be able to isolate the containment lines for the acid-gas injection system into small
volumes, the release of even small volumes of acid gas can be harmful. Consequently, the
operators are required to have a detailed emergency response plan (ERP) in case a leak occurs
that may impact humans. An emergency planning zone, the EPZ (i.e., area of land which may be
impacted by the release of H2S), is defined around the sour gas facility.
2.2 Criteria for Site Selection
The general location for an acid-gas injection well is often influenced by the proximity to sour oil
or gas production facilities that are the source of acid gas. The specific location is based on a
general assessment of the regional geology and hydrogeology, which is designed to evaluate the
potential for leakage (Longworth et al., 1996) and which includes:
1. size of the injection zone, to confirm that it is large enough to volumetrically hold all of the
injected acid gas over the lifetime of the project;
2. thickness and extent of the overlying confining layer (caprock), and any stratigraphic traps or
fractures that may affect its ability to contain the acid gas;
3. location and extent of the underlying or lateral bounding formations;
ERCB/AGS Special Report 093 (March 2008) 4

��7 � � 7 �� ��
�������������
��7
�
�
7
��
��
7�
���
����������������� !�"""#��$�%����
87��
����
�7��
"���
�7��
0�
��
�������������
��7���
�
"
7
��
���9�*�
���9�:��
879�:��
7�9�:��
�79�:��
����������������� !�"""#��$�%����
���������� ��� �������������������������������������������������������������������������������������������������� �������!"�#��������������������������������������������������$������������������%&'����#
%&'� ��������'�� %������� ���(��)#�*&&+,�-��$����.�/����#�*&&0#�*&&+��
ERCB/AGS Special Report 093 (March 2008) 5

4. folding or faulting in the area, and an assessment of seismic (neotectonic) risk;
5. rate and direction of the natural flow system, to assess the potential for migration of the
injected acid gas;
6. permeability and heterogeneity of the injection zone;
7. chemical composition of the formation fluids (water for aquifers, oil or gas for reservoirs);
8. formation temperature and pressure;
9. analyses of formation and caprock core (if available); and, finally,
10. a complete and accurate drilling history of offsetting wells within several kilometres of the
injection well, to identify any wells or zones that may be impacted by the injected acid gas.
Knowledge of the geological setting and characteristics is critical to assess the integrity of the
host formation or reservoir, and the short- and long-term fate of the injected acid gas. Of
particular importance are potential migration pathways from the injection zone to other
formations, shallow groundwater and/or the surface. These potential pathways are of three types:
the caprock pore space (“membrane” type), natural and/or induced fractures (“cracks”) through
the confining strata, and improperly completed and/or abandoned wells (“punctures”). To avoid
diffuse gas migration through the caprock pore space, the difference between the pressure at the
top of the injection aquifer or reservoir and the pressure in the confining layer must be less than
the caprock threshold displacement pressure, which is the pressure needed for the acid gas to
overcome the capillarity barrier and displace the water that saturates the caprock pore space. To
avoid acid gas migration through fractures, the injection zone must be free of natural fractures,
and the injection pressure must be below a certain threshold to ensure that fracturing is not
induced. The maximum bottomhole injection pressure is set by regulatory agencies at 90% of the
fracturing pressure of the reservoir rock. In the absence of site-specific tests, the pressures are
limited by pressure-depth correlations, based on basin-wide statistical data for the Alberta Basin.
From this point of view, injection into a depleted oil or gas reservoir has the advantages of
injection pressures being low and of wells and pipelines being already in place (Keushnig, 1995).
2.3 Issues
Critical issues are for the most part environmental and safety-related and they directly affect the
economics of acid gas injection. Acid gas leaks can result in loss of life or contamination of the
bio- and atmosphere. Surface safety is addressed through engineering, installation of safety valves
and monitoring systems, and emergency procedures for the case of H2S leaks. Subsurface issues
are of two inter-related categories: the effect of the acid gas on the rock matrix and well cements,
and plume containment.
When the acid gas contacts the subsurface formation, it will readily dissolve in the formation
water in an aquifer, or connate water in a reservoir, and create weak carbonic and sulphuric acids.
This leads to a significant reduction in pH that accelerates water-rock reactions. Depending on
mineralogy, rock dissolution or precipitation may occur, affecting the porosity and permeability
of the host rock. The fact that both CO2 and H2S are dissolving in the formation water leads to
some complex reaction paths where carbonates precipitate and dissolve, and pyrite/pyrrhotite
precipitates (Gunter et al., 2000; Hitchon et al., 2001). Dissolution of some of the rock matrix in
carbonate strata, or of the carbonates surrounding the sand grains in sandstone units results in
lower injection pressures in the short term. A major concern with the injection process is the
potential for formation damage and reduced injectivity in the vicinity of the acid gas scheme. The
reduction in injectivity could possibly be the result of fines migration, precipitation and scale
potential, oil or condensate banking and plugging, asphaltene and elemental sulphur deposition,
and hydrate plugging (Bennion et al., 1996).
ERCB/AGS Special Report 093 (March 2008) 6

Cement compatibility with the acid gas, primarily in the injection well, but also in neighboring
wells, is crucial for safety and containment. For example, a non-carbonate and calcium cement
blend shattered when tested in an acid gas stream for several weeks (Whatley, 2000). Thus, the
compatibility of the acid gas with the cement that bonds the casing to the formation must be
tested at a minimum. While the cement for the newly implemented acid-gas operation can be
tested and properly selected prior to drilling, the cements in nearby wells are already in place and
their condition is largely unknown. Some of these wells could be quite old, with the cement
already in some stage of degradation as a result of brine composition. The acid gas, when
reaching these wells, may enhance and speed up the cement degradation, leading to possible leaks
through the well annulus and/or along casing.
If the acid gas is injected into the originating or other oil or gas pool, the main concern is the
impact on further hydrocarbon recovery from the pool and acid gas production at the pump,
although the injection operation and enhanced oil recovery may prove successful, like in the case
of the Zama X2X pool (Davison et al., 1999). If the gas mixture is injected into an aquifer, the
degree to which it forms a plume and migrates from the injection well depends on various factors,
including pressure and temperature, solubility, interplay between driving forces like buoyancy
and aquifer hydrodynamics, and aquifer heterogeneity, which controls gravity override and
viscous fingering.
The fate of the injected acid gas in the subsurface is not known, because subsurface monitoring is
not currently required and is difficult and expensive. Only the wellhead gas composition,
pressure, temperature and rate have to be reported to the AEUB. Thus, a proper understanding of
the geology and hydrogeology of the acid-gas injection unit (reservoir or aquifer) is critical in
assessing the fate of the injected acid gas and the potential for migration and/or leakage into other
units.
3 Basin-Scale Setting of the Pembina-Wabamun Acid-Gas Injection Sites
The Pembina operations for injecting acid gas into the Upper Devonian Wabamun Group are
located in the central part of the Alberta Basin, west-southwest of Edmonton (Figure 1). The
geology, stratigraphy and hydrostratigraphy of the sedimentary succession are different in the
northern part of the Alberta Basin (north of the Peace River arch) from those in the area south of
the Peace River arch because of different depositional and erosional conditions and events, with
corresponding effects on the flow of formation waters (Bachu, 1999). Consequently, only the
southern and central parts of the basin, relevant to the Pembina-Wabamun sites, will be presented
in the following. The geology described herein is based on Porter et al. (1982), Ricketts (1989)
and Mossop & Shetsen (1994) (and references cited therein), and the hydrogeology on Bachu
(1999).
3.1 Basin Geology and Hydrostratigraphy
The Alberta Basin sits on a stable Precambrian platform and is bound by the Rocky Mountain
Trench to the west and southwest, the Tathlina High to the north and the Canadian Precambrian
Shield to the northeast (Figure 1). The Bow Island Arch separates the Alberta and Williston
basins to the southeast. The basin was initiated during the late Proterozoic by rifting of the North
American craton and consists at the base of a Middle Cambrian to Middle Jurassic passive-
margin succession dominated by shallow-water carbonates and evaporites with some intervening
shales (Porter et al., 1982). From late Jurassic to early Tertiary, accretion of allochthonous
terranes to the western margin of the proto North American continent during the Columbian and
ERCB/AGS Special Report 093 (March 2008) 7

Laramide orogenies pushed sedimentary strata eastward, thrusting and folding them in the Rocky
Mountain main ranges and in the thrust and fold belt, and creating conditions for foreland-basin
development east of the deformation front. Because of lithospheric loading and isostatic flexure,
the Precambrian basement tilted westward, with a gentle slope of <4 m/km in the east near the
Canadian Shield, becoming steeper westward, up to >20 m/km near the deformation front. In the
undeformed part of the basin, progressively older Jurassic to Middle Devonian strata subcrop
from west to east at the sub-Cretaceous unconformity, as a result of basement tilting and
significant Pre-Cretaceous erosion. Deposition during the foreland stage of basin development
was dominated by synorogenic clastics, mainly muds and silts that became shales, derived from
the evolving Cordillera. The basin attained maximum thickness and burial during the Laramide
orogeny in the Paleocene. Tertiary-to-Recent erosion since then has removed an estimated 2000
to 3800 m of sediments in the southwest (Nurkowski, 1984, Bustin, 1991). The present-day
topography of the undeformed part of the basin has a basin-scale trend of decreasing elevations
from highs in the 1200 m range in the southwest to lows around 200 m in the north-northeast at
Great Slave Lake, which is the lowest topographic point in the basin. As a result of these
depositional and erosional processes, the undeformed part of the Alberta Basin comprises a
wedge of sedimentary rocks that increases in thickness from zero at the Canadian Shield in the
northeast to close to 6000 m in the southwest at the thrust and fold belt. The stratigraphic and
hydrostratigraphic nomenclature and delineation for the entire sedimentary succession in the
Alberta Basin south of the Peace River Arch are shown in Figure 4.
Hydrostratigraphically, the Precambrian crystalline basement constitutes an aquiclude, except
possibly for fault and shear zones that may have been conduits for fluid flow and may still be
active today. A thin, diachronous basal quartz sandstone unit and Granite Wash detritus cover the
Precambrian basement. As a result of pre-Middle Ordovician erosional beveling and of major pre-
Middle Devonian erosion, Cambrian strata are eroded near the Peace River arch. Ordovician
strata are present only in the southeast along a narrow band along the basin edge, and Silurian
strata are completely absent. The Basal Sandstone unit forms the Basal aquifer, while the shale-
dominated Cambrian and Ordovician strata form the Cambrian aquitard system.
A Middle Devonian interbedded succession of low-permeability anhydritic red beds and
carbonates, halite and argillaceous carbonates of the Lower Elk Point Group overlies the
Cambrian units or Granite Wash detritus, and forms the Elk Point aquitard system. The overlying
platform and reefal carbonates of the Upper Elk Point Group Winnipegosis Formation form the
Winnipegosis aquifer. This unit is overlain over most of the basin by the thick halite of the Prairie
Formation and the shales of the Watt Mountain Formation, which together form the Prairie
aquiclude system. Because of the variable lithology of the Prairie Formation in the west, and salt
dissolution in the east along the basin edge, this hydrostratigraphic system has aquiclude
characteristics where the salt is present, and aquitard characteristics where the salt is absent, or
present only in minor quantities.
The Elk Point Group is overlain by the Middle-Upper Devonian Beaverhill Lake Group. The
latter can be subdivided into the open marine reefs and carbonates of the Slave Point Formation,
which is an aquifer, and the shales and argillaceous carbonates of the Waterways Formation,
which form, depending on location and dominant lithology, either an aquitard or an aquifer. The
aquifers and aquitards of the Beaverhill Lake Group subcrop at the sub-Cretaceous unconformity,
and crop out in the northeast along the Athabasca River and in the Great Slave Lake area.
The Upper Devonian Woodbend Group strata conformably overlie the Beaverhill Lake Group
and are the result of renewed marine transgression and deepening within the Alberta Basin, which
resulted in the deposition of the thick euxinic shales of the Duvernay and Majeau Lake
ERCB/AGS Special Report 093 (March 2008) 8

,��#�(� �!��;��<�!
&�!�%�!���!�=�&
����!���
�;����!�
%&%��$
+�1�!�,��� �����;��<�!
����!1���!��;����!��==�!�,��� ������;��<�!
,�%%�%%�==����>
4�!�%%��
�;��<�!
%&%��$
-?%��1�>�'��<<��;����!�
�==�!
@� �����
�;��<�!�%&%��$
����0������;����!�,������>��==�!
@� �����
�;��<�!�%&%��$
5!��!����;��������>
�;����!��%&%��$�����=��%�%��;��<�!
-�#�5����
�;��������%&%��$
��$0!���
�;����!��%&%��$
'�%����;��<�!
4�!�%%����;����!�
+���5�!#��;����!�
������!��>�5�%#�=��
�;��<�!
'������;����!�
'��!=�1��;����!�
�!%�%�������&���;��<�!
'���&�(� �!�;��<�!�%&%��$
=�%�>����!�����;��<�!>�;����!�
������%&%��$
5�!���
�!��%%��
5�!$���
����!���
*!�� �����
��!���!&
,�%%�%%�==���
�
,
+
5���%&� �����
�
,
+
A!��= 3�!$�����
,��� ����
'�� �!�����+�#�
����0���
�����!0�!�
'��<<
-?%��1
��0�$��
5!��!��
�����=��%�%
'�%�������%����
A!�%$���)!����
����!1���!
��#��
��!���$
5!���$0!���
5�%#�=��
��!���!�=������$�������!�
������=�%����
������=�%����
,��#�(� �!+��
5�!#
'�����
�����$��
�!%�%�������&��
'��!=�1
'���&�(� �!
������!�
������!�
(�����
+����
B����!��!&5!��������������������!�<�
���#���+#�
��������������=��#��������%����
�����+�#�
+��%0�!
�!������%
'!�C���
�==�!
+�1�! �
���!���
4�!�%%��
@� �����
�==�!
,�����
+�1�!
-�#�5����
+�1�!
�==�!
��$0!���
�������%�1����2��� ������������$�������$��������������$����� ������������������� �����������$������$������������� �����������$��3 ������1������������1��$�#�*&&&�
'�%�$�����;�������
�!��%%���;����!��%&%��$
ERCB/AGS Special Report 093 (March 2008) 9

formations. In southern and southeastern Alberta, extensive platform carbonates of the Cooking
Lake Formation comprise shallow water equivalents of the Duvernay and Majeau Lake
formations. During subsequent drowning of the carbonate platform, shallow water and locally
evaporitic carbonate deposition of the Leduc Formation took place. Infilling of the Woodbend
basin by shales of the Ireton Formation started at the northeastern margin and progressed into
southern Alberta, subsequently terminating younger Leduc reef growth. The Grosmont shelf
complex developed over the prograding Ireton in northeastern Alberta. Thick accumulations of
Upper Woodbend Group shales filled the entire basin by the close of the Ireton deposition, except
for a small portion in central Alberta, which remained unfilled. This part, the Cynthia Basin, was
the site of later reef development during overlying Winterburn sedimentation (Burrowes &
Krause, 1987).
Hydrostratigraphically, the Cooking Lake and Leduc carbonates form the Cooking Lake aquifer,
which, together with the underlying Beaverhill Lake aquifers, form the Middle-Upper Devonian
aquifer system. The Ireton, Duvernay and Majeau Lake formations form the Woodbend aquitard.
The Grosmont Formation is an aquifer that is included in the overlying Upper Devonian aquifer
system as a result of its hydraulic continuity with and influence on the Winterburn and Wabamun
aquifers in the area of subcrop in the northeast (Anfort et al., 2001). All the units of the
Woodbend Group subcrop at the sub-Cretaceous unconformity, while the Grosmont aquifer also
crops out along the Peace River at an elevation of approximately 250 m.
The Woodbend Group is overlain by the Winterburn Group. It represents a continuation of
Grosmont-type deposition wherein carbonates “piggy-back” on prograding clastics (Watts, 1987).
Within this respect, basal Winterburn carbonates of the Nisku Formation formed widespread shelf
deposits over most of Alberta. In the north, these were rather silty and argillaceous, but in eastern
and southeastern Alberta, and rimming the Cynthia basin, fossiliferous shelf and reef carbonates
were widespread. A major marine transgression followed the Nisku sedimentation, which is
marked by widespread terrigenous deposits of the Calmar Formation. After a time of non-
deposition and/or erosion, shallow shelf sedimentation returned to most of the Alberta Basin and
resulted in the carbonates of the Blue Ridge Member. A second major regression occurred at the
close of the Winterburn time, resulting in the northwestward thickening wedge of the “Graminia
Silt” (Burrowes & Krause, 1987).
The strata of the Wabamun Group conformably overlie the Winterburn Group. They consist
mostly of shallow marine carbonates and may reach a thickness of 300 m. In southeastern
Alberta, these carbonates interfinger with peritidal evaporites (mainly anhydrite) of the Stettler
Formation. Wabamun carbonates consist largely of mud-rich to grainy to pelletal limestones.
These change in parts of the basin to fossiliferous carbonates that pinch out into the evaporitic
Stettler Formation. A second transgressive episode occurred close to the end of Wabamun time
and resulted in the open marine limestones of the Big Valley Formation over most of Alberta.
Black-shales of the Exshaw Formation abruptly overlie the Wabamun and straddle the Devonian-
Mississippian Boundary.
The widespread platform carbonates interspersed with minor shales of the Winterburn and
Wabamun groups subcrop at the sub-Cretaceous unconformity (Figure 5), and, at the basin scale,
form the Upper Devonian aquifer system. Reefs of the Leduc Formation breach the Ireton
aquitard in places, thus establishing local hydraulic communication between the Middle-Upper
Devonian aquifer system and the overlying Upper Devonian aquifer system, including the
Grosmont aquifer (Bachu & Underschultz, 1993; Hearn & Rostron, 1997; Rostron & Toth, 1996,
1997; Anfort et al., 2001).
ERCB/AGS Special Report 093 (March 2008) 10

�������4�������������$��-�������5���������$�����2����������������������������$��3 ������1����6$�� ������������$�����������2������7����������������������$��8���������������� ����$����
A!������� ����+�#�
����+�#�����0�%��
'�1
)%����
�!��
�� ��� �
�� �
��� ���� �
������
(��#&�,
�������%
�����������������
�������������
��0�$���A!��='�����!&
��0�$���A!��=��0�!�=�-��
�� ��������
����������
� "���#$
� ����$���%
5�$0���
ERCB/AGS Special Report 093 (March 2008) 11

The thin, organic rich, competent shales of the Exshaw Formation were conformably deposited
during late Devonian – early Carboniferous, followed by the interbedded shale-to-carbonate
succession of the Banff Formation. This trend continued with the deposition of the overlying
thick carbonate successions of the Rundle and Stoddart groups (Figure 4). Permian, Triassic and
early Jurassic strata are present only in the Peace River Arch area in the northwest near the
eastern edge of the thrust and fold belt, and consist of interbedded sandstones, siltstones,
carbonates, evaporites and shales. The shales of the Exshaw Formation and the shale-dominated
lower part of the Banff Formation form the Exshaw-Banff aquitard. The Triassic shales and
evaporites form aquitards and aquicludes that dominate the Triassic succession, which, as a
whole, forms an aquitard system. At a regional scale, the entire Upper Banff to Lower Jurassic
succession, except for the Triassic, forms the Carboniferous-Jurassic aquifer system in the
southern and central parts of the basin.
Late Jurassic siliciclastics were deposited along the western edge of the basin at the beginning of
the foreland-stage of basin evolution. They are variably dominated by either sandstones or shales,
which form an aquifer or a weak aquitard, depending on location. The overlying Cretaceous strata
are divided into several depositional successions. The Mannville Group, the depositional response
to the Columbian orogeny, consists of fluvial and estuarine valley-fill sediments, and sheet sands
and shales deposited by repeated marine transgressive-regressive events. In the southern part of
the basin, the Mannville Group forms at the basin-scale a single sandstone-dominated aquifer,
while in the central-to-northern part, the Lower and Upper Mannville aquifers are separated by
the intervening shale-dominated Clearwater aquitard. At a local scale, the lithology and therefore,
the hydrostratigraphy of the Mannville Group are much more complex, with lateral or vertical
discontinuities caused by siliciclastic deposition in a fluvio-deltaic environment.
The Colorado Group was deposited during a lull in tectonic plate convergence when the basin
was subject to a widespread marine transgression. Colorado strata consist predominantly of thick
shales that form aquitards, within which there are isolated, thin, sandy units that form aquifers.
Some of the sandstones, like the Viking and Cardium formations, are laterally extensive. Others
are more restricted areally, present only in the south, like the Second White Speckled Sandstone.
Post-Colorado Cretaceous and Tertiary strata were deposited during the Laramide orogeny and
the subsequent period of tectonic relaxation, and consist of eastward-thinning nonmarine clastic
wedges intercalated with argillaceous sediments. This cyclicity is developed best in the southern
and southwestern parts of the basin, where the Milk River, Belly River, Horseshoe Canyon and
Scollard-Paskapoo formations form the clastic wedges, and the Lea Park, Bearpaw, Whitemud
and Battle formations comprise the intervening shales. In the central and northern parts of the
basin many of these cycles are absent due to either non-deposition or erosion. The clastic wedges
form aquifers, while the intervening shales form aquitards. A variety of pre-glacial, glacial and
post-glacial surficial deposits of Quaternary age overlie the bedrock over the entire basin.
3.2 Basin-Scale Flow of Formation Water
The flow of formation water in the Alberta Basin is quite well understood at the basin scale as a
result of work performed over the last three decades by various researchers, starting with the
pioneering work of Hitchon (1969a,b) and ending with a comprehensive summary and synthesis
of previous work by Bachu (1999). Publications since then (i.e., Anfort et al., 2001; Michael et al., 2003; and Bachu & Michael, 2003) only confirm and detail the broad understanding of the
flow of formation water in the basin. The flow in the deformed part of the basin (the Rocky
Mountains and the thrust and fold belt) seems to be driven by topography in local-scale systems.
Recharge takes place at the surface throughout the entire system, with discharge as springs, in
ERCB/AGS Special Report 093 (March 2008) 12

lakes and along river valleys. In most cases, fresh groundwater of meteoric origin discharges
along various faults and thrust sheets, such as the Brazeau, Burnt Timber and McConnell, that
separate the flow systems in the Rocky Mountain thrust and fold belt from the flow systems in the
undisturbed part of the basin (Wilkinson, 1995; Grasby & Hutcheon, 2001). The flow in the
undeformed part of the Alberta Basin (from the eastern edge of the deformation front in the
southwest to the edge of the exposed Precambrian Shield in the northeast) is extremely complex
due to basin evolution, geology, lithology and hydrostratigraphy.
Topography-Driven Flow
The flow of formation water is driven by topography in local, intermediate, regional and basin
scale systems, from regions of recharge at high elevations to regions of discharge at low
elevations. A basin-scale flow system in the southern and central parts of the basin is recharged
with fresh meteoric water in the south where Devonian, Carboniferous and Cretaceous aquifers
crop out at high elevation in Montana. Water flows northward and discharges at outcrop of the
Grosmont aquifer along the Peace River (Figure 6). The aquifers in this flow system are the
Upper Devonian and Carboniferous-Jurassic in the region of respective subcrop at the sub-
Cretaceous unconformity, the Grosmont, and the Lower Mannville. They all are in hydraulic
contact in southeastern and central Alberta due to the absence of intervening aquitards as a result
of pre-Cretaceous erosion (Figures 4-6). In this basin-scale flow system, low hydraulic heads
corresponding to discharge areas propagate far upstream, inducing widespread sub-hydrostatic
pressures, as a result of high aquifer permeability downstream (Anfort et al., 2001).
An intermediate-scale flow system driven by topography is present in the Athabasca region,
where meteoric water recharges at relatively high elevations in the Birch and Pelican mountains,
penetrates down to the Slave Point (Beaverhill Lake Group) aquifer and discharges at low-
elevation outcrop along the Athabasca, Peace and Hay rivers (Bachu & Underschultz, 1993;
Bachu, 1999). All aquifers and aquitards in the Upper Devonian to Jurassic succession are absent
in this area due to pre-Cretaceous erosion (Figures 4 and 5). The Slave Point and Winnipegosis
aquifers in northeastern Alberta are in an intermediate position between regional-scale flow in the
western part of the basin, and local-scale flow systems close to the basin’s eastern edge (Hitchon
et al., 1990; Bachu & Underschultz, 1993).
Local-scale flow systems are present throughout the entire basin in the shallower strata. Fresh
meteoric water is driven from local topographic highs, such as Swan Hills, Cypress Hills and
Pelican Mountains, to the nearest topographic lows, usually a river valley. Such local flow
systems were identified in the Upper Cretaceous – Tertiary strata in the south, southwest and west
(Toth & Corbet, 1986; Michael & Bachu, 2002a, Bachu & Michael, 2003), and in the Red Earth
and Athabasca regions (Toth, 1978; Bachu & Underschultz, 1993).
Flow Driven by Erosional and/or Post-Glacial Rebound
During sediment loading, water flows vertically in compacting sand-shale successions, out of
overpressured shaly aquitards into the adjacent sandstone aquifers (expulsion), then laterally in
the sandstones, outward toward the basin edges. Directions of water movement are reversed
during erosional unloading, with transient effects lasting for long periods of time in rocks
characterized by very low hydraulic diffusivity. Significant underpressuring in shales drives the
flow of formation waters in the intervening aquifers laterally inward from the permeable basin
edges, and vertically into the rebounding shaly aquitards (“suction”). This type of flow is present
at both local and large scales in the southern and southwestern part of the Alberta Basin in the
siliciclastic Mannville, Viking, Second White Speckled Sandstone, Belly River and Horseshoe
ERCB/AGS Special Report 093 (March 2008) 13
A!�������� �����+�#�
�� �
�� �
��� ���� �
������
�����������������
��
�-
��=�!�=�&>�!� ���0�%��>%�����<��1
(������>%�����<��1��!� ���0&�=�%�>�����������$=!�%%����������5����C�����;��<�!%�<���������������$����0�%��>%�����%&%��$%
)�1�!��<��1��!� ���0&��!�%������!�0�������������!�������%�%����%%���
�==!�?�$����!�����1��!��<��1��!� ���0&��!�%������!�0������%����� �
'�1
)%����
�!��
��!�%����
3���'���
�������
� ��
3�!�����
5�����(� �!�!��
�� �
�������������
+�>�����!������
�%
��$0!���
5!���$0!���
�'�%�$���
����
�
>����
>"���
>����
>����
-�� ������D$E
���-
��!���!&�>��==�!$�%���!�������%
4�!�%%���>�
@� �����
��!�%�����<����0���
,�%%�%%�=
=���
��
0�
�������������� ��������������������������������� ������������������������������������������� �����������!��������"�������������#$$$�
�� ��������
����+�#�����0�%��
��=�!�=�&>�!� ���<��1
��=�!�=�&>�!� ���<��1
��!$�����������!�%%�%������
3��1��!� ���0&��!�%�����
!�0����
3��1��!� ���0&�=�%����������
��$=!�%%���
(�����1��!��<��1��!� ���0&�!�%������!�0������%����� �
� "���#$
� ����$���%
ERCB/AGS Special Report 093 (March 2008) 14

Canyon aquifers in the Cretaceous succession (Figures 5 and 6) (Toth & Corbet, 1986; Parks &
Toth, 1993; Bachu & Undershultz, 1995; Anfort et al., 2001; Michael & Bachu, 2002a). The flow
is driven by erosional and post-glacial rebound in the thick intervening shales of the Colorado
Group, and Lea Park, Bearpaw and Battle formations, as a result of up to 3800 m of sediments
having been eroded in the area since the peak of the Laramide orogeny some 60 My BP
(Nurkowski, 1984; Bustin, 1991) and since the retreat of 2 km thick Laurentide ice sheets since
the Pleistocene. The flow in these Cretaceous aquifers is in a transient state, driven inward from
the aquifers’ eastern boundary to the west-southwest, downdip toward the thrust and fold belt.
The aquifers are severely underpressured in places, with corresponding hydraulic heads being less
than 200 m close to the thrust and fold belt (Bachu et al., 2002; Bachu & Michael, 2003). These
hydraulic heads are lower than the lowest topographic elevation in the basin at Great Slave Lake
more than 1500 km away in the northeast.
Tectonic Compression
Unlike compaction and erosion, which create vertical stresses in the fluid-saturated sedimentary
succession, tectonic compression during orogenic events creates lateral stresses and pressure
pulses that lead to water expulsion from the overridden and thrusted rocks into the foreland basin.
These pressure pulses dissipate over several million years, depending on the hydraulic diffusivity
of the sedimentary succession (Deming & Nunn, 1991). In the deep part of the Alberta Basin in
the southwest, the flow of formation waters in the Middle-Upper Devonian, Upper Devonian and
Mississippian-Jurassic aquifer systems (Figures 4 and 6) is northeastward updip until it reaches
the sub-Cretaceous unconformity, where it joins the northward basin-scale gravity-driven flow
system (Hitchon et al., 1990; Bachu & Underschultz, 1993, 1995; Rostron & Toth, 1997; Anfort
et al., 2001). In the deeper Basal and Winnipegosis aquifers the flow of formation waters is also
northeastward updip to their respective northeastern boundary (Hitchon et al., 1990; Bachu &
Underschultz, 1993). The salinity of formation waters in these aquifers generally increases
southwestward downdip. (Hitchon et al., 1990; Bachu & Underschultz, 1993, 1995; Rostron &
Toth, 1997; Anfort et al., 2001; Michael & Bachu, 2002a,b; Michael et al., 2003). Up to their
respective eastern erosional or depositional boundary, all of these aquifers are separated by
intervening strong aquitards or aquicludes. Direct freshwater meteoric recharge from the surface
of these aquifers in either the deformed or the undeformed parts of the basin in the southwest is
not possible or very unlikely for a variety of reasons (Bachu, 1999; Michael & Bachu, 2002a,b;
Bachu et al., 2002; Michael et al., 2003). Based on the high salinity of formation waters in the
deep Paleozoic aquifers in the southwestern part of the basin, and because of the lack of an
identified recharge source and mechanism, Bachu (1995) postulated that the flow in these
aquifers is driven by past tectonic compression (Figure 6). This hypothesis is supported by
isotopic analyses of formation waters and late-stage cements in both the deformed and
undeformed parts of the basin (Nesbitt & Muehlenbachs, 1993; Machel et al., 1996; Buschkuehle
& Machel, 2002).
Hydrocarbon Generation
During the process of hydrocarbon generation, the phase change of solid kerogen that fills the
pore space into fluid hydrocarbons leads to volumetric expansion and generation of internal
stresses that create overpressures capable of driving flow. However, the overpressures caused by
active hydrocarbon generation can be maintained only if the respective reservoirs are well sealed
by very low permeability rocks. Overpressured reservoirs are present in Cretaceous strata in the
deep parts of the Alberta Basin (e.g., Masters, 1984). Most of the overpressuring attributed to
hydrocarbon generation occurs in the southwest, in the deep basin near the thrust and fold belt in
the Cretaceous Mannville, Viking and Cardium strata (Figure 5) associated with low-permeability
ERCB/AGS Special Report 093 (March 2008) 15

(tight) rocks and seals (Bachu & Underschultz, 1995; Anfort et al., 2001; Michael & Bachu,
2002a). The high pressures are caused by present-day or recent (last few million years)
hydrocarbon generation in strata that still contain organic matter capable of yielding thermally
generated hydrocarbons, but which have very low permeability that impedes pressure dissipation.
The rock succession in the Cretaceous deep basin is generally gas or oil saturated, and discrete
hydrocarbon-water contacts generally are not present. In the absence of contact between the
overpressured reservoirs and formation water in aquifers, hydrocarbon generation is not an
effective flow-driving mechanism.
Buoyancy
The flow of formation water is driven in the gravitational field by hydraulic gradients and by
density differences (buoyancy). Generally, Paleozoic waters are more saline than Mesozoic
waters (Hitchon, 1969a,b; Bachu, 1999; Anfort et al., 2001; Michael & Bachu, 2002a,b; Michael
et al., 2003). The increase in salinity is mild in Cretaceous strata, rather abrupt at the sub-
Cretaceous unconformity, and steep in Paleozoic strata, particularly in the vicinity of evaporitic
beds (Bachu, 1999). In southern Alberta, water salinity in Upper Devonian and Carboniferous
aquifers is lower than in the central and northern parts of the basin and comparable with water
salinity in Mesozoic aquifers, as a result of meteoric water recharge at outcrop in Montana
(Anfort et al., 2001). The existence of high-salinity connate waters in the Paleozoic strata shows
that the basin has not been flushed yet of the original waters existing in the basin at the time of
deposition. Thus, buoyancy, rather than generating or enhancing the flow of formation waters in
the Alberta Basin, retards it, to the point of stagnation or sluggishness in some places. A zone of
mixing between high-salinity Paleozoic connate waters and freshwater of meteoric origin is
present in the Lower Mannville aquifer in the south-central part of the basin, in the region where
Devonian aquifers subcrop at the sub-Cretaceous unconformity (Bachu, 1995; Rostron & Toth,
1997; Anfort et al., 2001).
Cross-Formational Flow
Generally there is little cross-formational flow in the Alberta Basin because of its “layer-cake”
structure, where strong aquitards and aquicludes separate the major aquifers and aquifer systems
in the sedimentary succession. Cross-formational flow takes place over large areas only where
aquitards are weak. Such cases are the Clearwater and Watt Mountain aquitards in the northeast
in the Athabasca area (Bachu & Underschultz, 1993), and the Calmar aquitard in the Upper
Devonian aquifer system (Rostron & Toth, 1997; Anfort et al., 2001). Localized, direct cross-
formational “pipe” flow between aquifers takes place across Devonian aquitards and aquicludes
only in places where Winnipegosis and Leduc reefs breach through the intervening shaly
aquitards. Such “pipes” were identified between the carbonate platforms of the Woodbend Group
and the Winterburn Group in the Cheddarville and Bashaw areas, and along the Rimbey-
Meadowbrook reef trend (Bachu & Underschultz, 1993; Wilkinson, 1995; Rostron & Toth, 1996,
1997; Anfort et al, 2001). Reefs of the Leduc Formation create a path for direct hydraulic
communication across the Ireton aquitard between the underlying and overlying Cooking Lake-
Leduc and Upper Devonian aquifer systems. Otherwise, mixing of formation waters from
different aquifers, and consequently of fresh meteoric and connate waters, takes place at the sub-
Cretaceous unconformity in the area where various Devonian-to-Carboniferous strata subcrop
(Figure 4) (Hitchon et al., 1990: Bachu & Underschultz, 1993, 1995; Rostron & Toth, 1997;
Anfort et al., 2001).
ERCB/AGS Special Report 093 (March 2008) 16

4 Regional-Scale Setting of the Pembina-Wabamun Acid-Gas Injection Sites Because hydrogeological data for the Wabamun Group are scarce in the Pembina area, a regional
scale study area was defined between 52.5oN to 54oN and 117oW to 113.5oW (Figure 7), to better
understand the flow of formation waters and hydrogeology around the acid-gas injection sites.
4.1 Geology of the Wabamun Group in West-Central Alberta
The Upper Devonian Wabamun Group extends from southern Alberta to northern Alberta and
British-Columbia (Figure 7) and marks a reflooding of the Alberta Basin following the
Winterburn cycle of basin fill. At the initiation of the cycle, the underlying Winterburn succession
had infilled almost all of the preexisting topography throughout most of Alberta. Therefore the
Wabamun Group is preserved as a rather monotonous package of low-angle mud-dominated
carbonate ramp sediments (Figures 7 and 8). The infilling of the basin took place from the
northwest, resulting in the deposition of basinal shales followed by thick limestone sequences in
northern Alberta. The Wabamun Group becomes increasingly dolomitic and eventually anhydritic
in southeastern Alberta and southwest Saskatchewan (Figures 7; Stoakes, 1992). Due to this
transitional sedimentation pattern, the Wabamun Group has been sub-divided mainly into two
formations across the basin: the Big Valley Formation and the Stettler Formation (Figure 9),
whereby the Big Valley Formation is a calcitic unit and the underlying Stettler Formation
becomes increasingly dolomitic to the south. The Stettler Formation can be further subdivided
into members as indicated in Figure 9.
In the Pembina study area the Wabamun is represented mainly by a thick limestone succession
with a few dolomitized areas. The depth to the top of the Wabamun Group in the regional-study
area ranges between more than 4000 m in the southwest along the deformation front to less than
1100 m in the northeast (Figure 10a) with an average thickness of 200 m in most of the area
except for the very eastern border where it approaches the sub-Cretaceous unconformity and has
been eroded to around 30 m. The top of the Wabamun Group dips southwestward with a slope
that varies between 15m/ km in the northeast and 20m/km near the deformation front, from above
– 400m in the northeast to less than -2600 m in the southwest (Figure 10b).
The Wabamun Group in the regional-scale study area consists of dolomitic limestones and
calcareous dolomites, with the limestones predominating in the upper part of the formation and
dolomites in the middle and lower parts. Appreciable interbedded anhydrite occurs, which forms
a prominent zone near the base of the formation in some areas (e.g. the Leduc field just west of
Edmonton). In the Stettler area and southeastward (southeast study area), halite may be
interbedded with these anhydrites. In a trend further to the south, interbedded anhydrite and
dolomite occur in both the upper and lower portion of the group, with the variably porous
Crossfield Member dolomites occurring in between. In the northwestern part of the study area the
Wabamun is wholly limestone. Brecciation, secondary anhydrite and calcite veining are common.
At the upper contact with the Exshaw Formation the limestone may be highly pyritic.
The Wabamun Group is underlain by siliciclastics and carbonates of the Graminia–Blueridge
succession of the Winterburn Group, which reach a thickness of about 30 m in the study area. The
injection zone is overlain by several metres of the tight shales of the Exshaw Formation, and the
shaly carbonates of the Banff Formation, with an aggregate thickness of 200 m on average.
ERCB/AGS Special Report 093 (March 2008) 17

�� ��� �
�� �
��� ���� �
������
(��#&�,
�������%
�����������������
����+�#�����0�%��
A!�������� ������+�#�
�� ��������
�����
����&���$�%����
+�$�%����
@���%����
���&�!���������%����
���&�!���
�����!���%�%����
��!��0����������&
� "���#$
� ����$���%
�
�
��
��
��� �
��
���� � �
�
� �
����
���
���
��
�
�
�
�
��
�
��
�
�
�
���� �
���
����� � �
�
� �
����
���
���
� �
��
�
�
�
�
�
��� �
�
�
�
��
���
��� �
���
��
���� � �
�
� �
����
���
���
��
�
�
�
�
�
�
�
��� �
�
�
�
��
�
�
��
���� �
���
�
�
��
����� � �
�
� �
����
���
���
� �
��
�
�
�
�
�
�
�
��� �
�� ��
�
���
���
�
�
�
��� �
�� ��
�
���
�
�
���
�
�
�
5�$0���>��0�$��
(������>%����%���&��!��
�
��
������� ������������������������������������������������������������� �!"##$%� ���������&�����������������'�(�)�����&�����������&�����*���������������������&��������+������������,��
ERCB/AGS Special Report 093 (March 2008) 18
�>"��� �>"���
�>""�� �>""��
�>"��� �>"���
�>"��� �>"���
&�""" &�"""
�>���� �>����
�>�F�� �>�F��
�>�8�� �>�8��
�>���� �>����
�>�7�� �>�7��
�>���� �>����
�>�"�� �>�"��
�>���� �>����
�>���� �>����
�>���� �>����
�>���� �>����
�>�F�� �>�F��
�>�8�� �>�8��
�>���� �>����
�>�7�� �>�7��
�>���� �>����
�>�"�� �>�"��
�>���� �>����
�>���� �>����
�>���� �>����
��>��� ��>���
��>F�� ��>F��
��>8�� ��>8��
��>��� ��>���
��>7�� ��>7��
��>��� ��>���
��>"�� ��>"��
��>��� ��>���
��>��� ��>���
" "
������ ������
������ ������
���"�� ���"��
������ ������
�"" �""
������ ������
���8�� ���8��
���F�� ���F��
������ ������
�""" �"""
������ ������
������ ������
���"�� ���"��
"�"���
�,����)++-�A(5
�3-(�)-�A(5
�(*�/��(--/�,'(�5*/-(��)5��
��*(@-AA�,'(
���(�-(���++-.�3,
����@��3,
�5-/)�/*�3,
"�����
�'-++.�()�-(�A(5
�+-��5�(/�3,���5)�')�3,
��*+*(�@*�A(5
���(@)�,�3,
���(@)�,��@
�'+��/��*�-�3,
��-�*�@��)�-��5-�/+-@��
�'��-�3)�����+-��2*�-
��)/)�A�3,��)/)�A����@��*�-�4*+)�3*��3,
�'+�)(,*(-�A(5�,����)++-�A(5
�A+���*�)�)����
�+*�-(�,����)++-�3,
�-++-(�+)-�,'(
�3-(�)-�A(5
�(*�/��(--/�,'(�5*/-(��)5��
��*(@-AA�,'(
���(�-(���++-.�3,
����@��3,
�5-/)�/*�3,
�'��33�3,
�-G����3,���'�,���A(5
��)��-('�(��A(5
���+,�(�3,��)�/��3,
�)(-�*��3,
�@��-(��.�3,
�'-��-()++�+�/-�3,
�+.�G�A(*�5
"�����
�-@,*��*��A(5
�'-++.�()�-(�A(5
�+-��5�(/�3,
��*+*(�@*�A(5
���(@)�,�3,
���(@)�,��@
��-�*�@��)�-��5-�/+-@��
�'��-�3)�����+-��2*�-
��)/)�A����@��*�-
�'+�)(,*(-�A(5
�A+���*�)�)����
�(*�/��(--/�,'(�5*/-(��)5����*(@-AA�,'(
�-+/�*��,'(
����@��3,
�5-/)�/*�3,
�'��33�3,
�-G����3,���'�,���A(5
�A(�,)�)��3,�'+�-()@A-�,'(
���+,�(�3,��)�/��3,
�)(-�*��3,
"�����
�-@,*��*��A(5
�/�--)++����33�2*�-
�'-++.�()�-(�A(5
�'���+�'-++.�()�-(��@
�+-��5�(/�3,
��*+*(�@*�A(5
���(@)�,�3,��55-(���(@)�,
���(@)�,��@
�+*�-(���(@)�,
��-�*�@��)�-��5-�/+-@��
�'��-�3)�����+-��2*�-��)/)�A�3,��)/)�A����@��*�-
�'+�)(,*(-�A(5
�,����)++-�A(5
�A+���*�)�)�����*��(��*@�2*�-
�3-(�)-�A(5�(*�/��(--/�,'(�5*/-(��)5����*(@-AA�,'(
���(�-(���++-.�3,�-+/�*��,'(
����@��3,
"�����
�-@,*��*��A(5�/�--)++����33�2*�-
�'-++.�()�-(�A(5
�+-��5�(/�3,
��*+*(�@*�A(5
���(@)�,�3,
���(@)�,��@
��-�*�@��)�-��5-�/+-@��
�'��-�3)�����+-��2*�-
��)/)�A�3,��)/)�A����@��*�-�4*+)�3*��3,�,����)++-�A(5
�A+���*�)�)����
�+*�-(�,����)++-�3,�*��(��*@�2*�-
�-++-(�+)-�,'(
�3-(�)-�A(5�(*�/��(--/�,'(
�5*/-(��)5����*(@-AA�,'(
�-+/�*��,'(����@��3,
�5-/)�/*�3,
�'��33�3,
"�����
�-@,*��*��A(5
�/�--)++����33�2*�-
�'-++.�()�-(�A(5
�+-��5�(/�3,
��*+*(�@*�A(5
�'�@-�(��3,
���(@)�,�3,
���(@)�,��@
��-�*�@��)�-��5-�/+-@��
�'��-�3)�����+-��2*�-
��)/)�A�3,��)/)�A����@��*�-�'+�)(,*(-�A(5�,����)++-�A(5
�A+���*�)�)����
�'���+�'+�)(,*(-
�4�(���)���.��-,
�3-(�)-�A(5
�(*�/��(--/�,'(
�5*/-(��)5����*(@-AA�,'(
�,)��)��)55)����.��-,�-+/�*��,'(����@��3,
�5-/)�/*�3,
�'��33�3,
"�����
�/�--)++����33�2*�-
�'-++.�()�-(�A(5
�'���+�'-++.�()�-(��@
�+-��5�(/�3,
��*+*(�@*�A(5
���(@)�,�3,
���(@)�,��@
��-�*�@��)�-��5-�/+-@��
�'��-�3)�����+-��2*�-��)/)�A�3,
��)/)�A����@��*�-
�'+�)(,*(-�A(5
�,����)++-�A(5
�A+���*�)�)�����+*�-(�,����)++-�3,
�'���+�B��(�2��@�3-(�)-�A(5�(*�/��(--/�,'(�5*/-(��)5��
��*(@-AA�,'(
�,)��)��)55)����.��-,
����@��3,
�5-/)�/*�3,
�'��33�3,
�-G����3,
���'�,���A(5
�A(�,)�)��3,
��)�/��3,
�)(-�*��3,
�@��-(��.�3,
"����"
�/�--)++����33�2*�-
�'-++.�()�-(�A(5
�+-��5�(/�3,
��*+*(�@*�A(5
���(@)�,�3,���(@)�,��@
�'+��/��*�-�3,
��-�*�@��)�-��5-�/+-@��
�'��-�3)�����+-��2*�-
��)/)�A�3,
��)/)�A����@��*�-
�4*+)�3*��3,
�,����)++-�A(5
�A+���*�)�)�����+*�-(�,����)++-�3,
�-++-(�+)-�,'(
�3-(�)-�A(5�(*�/��(--/�,'(
�5*/-(��)5����*(@-AA�,'(
����@��3,
�5-/)�/*�3,
�'��33�3,
�-G����3,���'�,���A(5
�A(�,)�)��3,�'+�-()@A-�,'(
���+,�(�3,��)�/��3,
�)(-�*��3,
�,�4-���+�/-�3,
�'-��-()++�+�/-�3,
�-+/�5*)���A(5���,'()����.��-,
"����"
�-@,*��*��A(5
�/�--)++����33�2*�-
�'-++.�()�-(�A(5
�+-��5�(/�3,
��*+*(�@*�A(5
���(@)�,�3,���(@)�,��A+
���(@)�,��@
��-�*�@��)�-��5-�/+-@��
�'��-�3)�����+-��2*�-
��)/)�A����@��*�-
�,����)++-�A(5
�A+���*�)�)�����+*�-(�,����)++-�3,�-++-(�+)-�,'(
�3-(�)-�A(5�(*�/��(--/�,'(
�5*/-(��)5����*(@-AA�,'(
����@��3,�5-/)�/*�3,
�'��33�3,
�-G����3,���'�,���A(5
�A(�,)�)��3,�'+�-()@A-�,'(
��)�/��3,
�)(-�*��3,
"���"'
��(-���-*����.��-,
�-@,*��*��A(5
�/�--)++����33�2*�-
�'-�(5���3,
�'-++.�()�-(�A(5
�'���+�'-++.�()�-(��@
�+-��5�(/�3,
��*+*(�@*�A(5
�'�@-�(��3,
���(@)�,�3,��55-(���(@)�,���(@)�,��A+���(@)�,��@
�'+��/��*�-�3,
��-�*�@��)�-��5-�/+-@��
�'��-�3)�����+-��2*�-��)/)�A�3,
��)/)�A����@��*�-�4*+)�3*��3,
�,����)++-�A(5
�A+���*�)�)�����+*�-(�,����)++-�3,
�*��(��*@�2*�-
�-++-(�+)-�,'(�3-(�)-�A(5
�A(--��'-@�
�(*�/��(--/�,'(�5*/-(��)5����*(@-AA�,'(
����@��3,�5-/)�/*�3,
�'��33�3,
�-G����3,���'�,���A(5
�A(�,)�)��3,�'+�-()@A-�,'(
���+,�(�3,��)�/��3,
�)(-�*��3,
�@��-(��.�3,
��**/)�A�+�/-�3,
�'-��-()++�+�/-�3,
���,'()����.��-,
"���"(
�-@,*��*��A(5
�/�--)++����33�2*�-
�'-�(5���3,�'-++.�()�-(�A(5
�'���+�'-++.�()�-(��@
�+-��5�(/�3,
��*+*(�@*�A(5
�'�@-�(��3,
���(@)�,�3,
��55-(���(@)�,���(@)�,��A+���(@)�,��@
�'+��/��*�-�3,
��-�*�@��)�-��5-�/+-@��
�'��-�3)�����+-��2*�-
��)/)�A�3,��)/)�A����@��*�-
�4*+)�3*��3,�,����)++-�A(5
�A+���*�)�)�����+*�-(�,����)++-�3,
�-++-(�+)-�,'(�(*�/��(--/�,'(�5*/-(��)5��
��*(@-AA�,'(�5-/)�/*�3,
�'��33�3,
"�'�"(
�-@,*��*��A(5
�/�--)++����33�2*�-
�'-�(5���3,
�'-++.�()�-(�A(5
�'���+�'-++.�()�-(��@
�+-��5�(/�3,
��*+*(�@*�A(5
�'�@-�(��3,
���(@)�,�3,��55-(���(@)�,
���(@)�,��A+���(@)�,��@
�'+��/��*�-�3,
��-�*�@��)�-��5-�/+-@��
�'��-�3)�����+-��2*�-
��)/)�A�3,��)/)�A����@��*�-
�4*+)�3*��3,�,����)++-�A(5
�A+���*�)�)����
�+*�-(�,����)++-�3,�*��(��*@�2*�-�-++-(�+)-�,'(�3-(�)-�A(5�(*�/��(--/�,'(�5*/-(��)5����*(@-AA�,'(
�5-/)�/*�3,�'��33�3,
�-G����3,���'�,���A(5
�A(�,)�)��3,�'+�-()@A-�,'(
���+,�(�3,��)�/��3,
�)(-�*��3,
�@��-(��.�3,
�'-��-()++�+�/-�3,
�-+/�5*)���A(5
�3)��-A���3,
�@-�@�**@�3,
�5)/��3,
�-+@*��3,
"�'�"�
�-@,*��*��A(5
�/�--)++����33�2*�-
�'-�(5���3,
�'-++.�()�-(�A(5
�'���+�'-++.�()�-(��@�+-��5�(/�3,
��*+*(�@*�A(5
�'�@-�(��3,
���(@)�,�3,
���(@)�,��A+���(@)�,��@�+*�-(���(@)�,
�'+��/��*�-�3,
��-�*�@��)�-��5-�/+-@��
�'��-�3)�����+-��2*�-
��)/)�A�3,��)/)�A����@��*�-
�4*+)�3*��3,
�'+�)(,*(-�A(5�,����)++-�A(5
�A+���*�)�)�����+*�-(�,����)++-�3,�*��(��*@�2*�-
�'���+�B��(�2��@�-++-(�+)-�,'(
�4�(���)���.��-,
�3-(�)-�A(5
�5*/-(��)5��
��*(@-AA�,'(�,)��)��)55)����.��-,�5-/)�/*�3,�'��33�3,
"�"�"�
�-@,*��*��A(5
�/�--)++����33�2*�-
�'-�(5���3,
�'-++.�()�-(�A(5
�'���+�'-++.�()�-(��@
�+-��5�(/�3,
��*+*(�@*�A(5
���(@)�,�3,���(@)�,��A+���(@)�,��@
��-�*�@��)�-��5-�/+-@��
�'��-�3)�����+-��2*�-
��)/)�A�3,��)/)�A����@��*�-
�4*+)�3*��3,
�'+�)(,*(-�A(5�,����)++-�A(5
�A+���*�)�)����
�+*�-(�,����)++-�3,�*��(��*@�2*�-
�'���+�B��(�2��@
�-++-(�+)-�,'(
�@-�()��+�H�(-�H
�3-(�)-�A(5
��*(@-AA�,'(
�,)��)��)55)����.��-,�5-/)�/*�3,
�'��33�3,
"���"�
�/�--)++����33�2*�-
�'-++.�()�-(�A(5
�+-��5�(/�3,
��*+*(�@*�A(5
���(@)�,�3,���(@)�,��@
��-�*�@��)�-��5-�/+-@��
�'��-�3)�����+-��2*�-
��)/)�A�3,
��)/)�A����@��*�-
�4*+)�3*��3,
�,����)++-�A(5
�A+���*�)�)�����+*�-(�,����)++-�3,
�*��(��*@�2*�-�-++-(�+)-�,'(
�3-(�)-�A(5��*(@-AA�,'(
�'��33�3,
�-G����3,���'�,���A(5
�A(�,)�)��3,�'+�-()@A-�,'(
���+,�(�3,��)�/��3,
�)(-�*��3,
"���"�
�'-++.�()�-(�A(5
�+-��5�(/�3,
��*+*(�@*�A(5
���(@)�,�3,
���(@)�,��@
��)/)�A�3,��)/)�A����@��*�-
�4*+)�3*��3,�,����)++-�A(5
�A+���*�)�)����
�*��(��*@�2*�-�'���+�B��(�2��@�-++-(�+)-�,'(�@-�()��+�H�(-�H�3-(�)-�A(5��*(@-AA�,'(
�'��33�3,
�-G����3,���'�,���A(5
��)��-('�(��A(5
��**@'-�@�A(5
�)(-�*��3,
�����)��*��#�����
Edmonton Group
���+,�-��.���)
/�����
�*��#�
����
������%�.���)
0%#�����.���)
����-����.���)
��������))���
�� �#��.���)
������ ���.���)
���% ��%.���)
��-��1���/���.���)
��# ����
�-(�)�(.
�(-���-*��
,)��)��
@-�*�)��
��,'()��
� �2
3� 40
�����'����������������&�������������������+������,������������������������������ ���������&�����������,����������-�.��������������.���.�� ����������������������,�������������/ ��������������,�����!�������!�������%�
���$�# ����
� �7 7��#���$��!�%
� �7�$���%
ERCB/AGS Special Report 093 (March 2008) 19
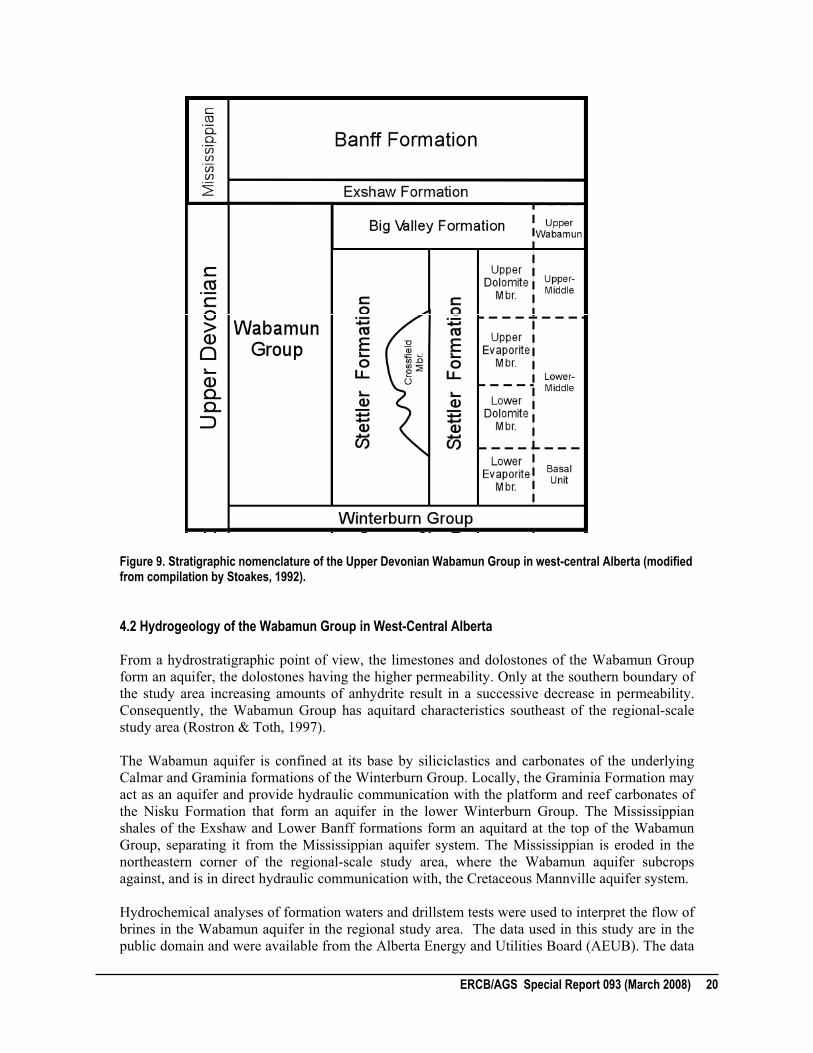
Figure 9. Stratigraphic nomenclature of the Upper Devonian Wabamun Group in west-central Alberta (modified from compilation by Stoakes, 1992). 4.2 Hydrogeology of the Wabamun Group in West-Central Alberta
From a hydrostratigraphic point of view, the limestones and dolostones of the Wabamun Group
form an aquifer, the dolostones having the higher permeability. Only at the southern boundary of
the study area increasing amounts of anhydrite result in a successive decrease in permeability.
Consequently, the Wabamun Group has aquitard characteristics southeast of the regional-scale
study area (Rostron & Toth, 1997).
The Wabamun aquifer is confined at its base by siliciclastics and carbonates of the underlying
Calmar and Graminia formations of the Winterburn Group. Locally, the Graminia Formation may
act as an aquifer and provide hydraulic communication with the platform and reef carbonates of
the Nisku Formation that form an aquifer in the lower Winterburn Group. The Mississippian
shales of the Exshaw and Lower Banff formations form an aquitard at the top of the Wabamun
Group, separating it from the Mississippian aquifer system. The Mississippian is eroded in the
northeastern corner of the regional-scale study area, where the Wabamun aquifer subcrops
against, and is in direct hydraulic communication with, the Cretaceous Mannville aquifer system.
Hydrochemical analyses of formation waters and drillstem tests were used to interpret the flow of
brines in the Wabamun aquifer in the regional study area. The data used in this study are in the
public domain and were available from the Alberta Energy and Utilities Board (AEUB). The data
ERCB/AGS Special Report 093 (March 2008) 20

"���
� 7� ����#���$��!�%
� 7��$���%
)�I�����������
+����>%���������&��!��
7��7 �
7� �
��"�7 ���8 �
7��7 �
7� �
��"�7 ���8 �
@�<�!$
������3!���
��� �
7" �7" �
��� �
��
0�
7��7 �
7� �
��"�7 ���8 �
7��7 �
7� �
��"�7 ���8 �
@�<�!$
������3!���
��� �
7" �7" �
��� �
>���
>F��>����>����>����>����>�F��
>����
>����
>����>����
��������
�����F��
�����������������F��
"���
"���"���"F������
�����"0�(�����������������������������&��������+���1�%����!����%�.������2�������������� ����������������&��������+������������,��
ERCB/AGS Special Report 093 (March 2008) 21
were culled for erroneous analyses and tests, including production influence, and processed
according to the methods presented by Hitchon and Brulotte (1994), Hitchon (1996) and Michael
and Bachu (2002a).
Chemistry of Formation Waters
The Upper Devonian formation waters in west-central Alberta are of Na-Cl and Na-Ca-Cl types
in the shallow and deep parts, respectively (Spencer, 1987; Adams & Bachu, 2002; Michael et al., 2003). In the regional-scale study area, water salinity in the Wabamun aquifer varies between less
than 100 g/l in the northeast corner of the study area where the Wabamun subcrops against the
Mannville Group, and greater than 180 g/l in the northwest near the deformation front (Figure
11a). In the Pembina area, the salinity is approximately 120 g/l. Significantly lower salinity of
formation water in the overlying Mississippian aquifer, ranging from less than 40 g/l to 120 g/l
(Figure 12a), indicates that the Exshaw-Lower Banff aquitard is an effective barrier to cross-
formational flow. The salinity of formation water in the underlying Winterburn Group is in the
same range as the salinity in the Wabamun Group in the northern half of the study area; however,
in the southeastern half the salinity is significantly higher, reaching more than 200 g/l (Figure
13a). The differences in salinity between the Wabamun and Winterburn aquifers in the south
suggest that the intervening Calmar and Graminia aquitards prevent cross-formational mixing of
formation waters. Only in the northeast, where salinities are in a similar range, the possibility of
cross-formational flow is likely.
Flow of Formation Waters
The analysis of the flow of formation waters is based on distributions of hydraulic heads in the
Wabamun Group (Figure 11b). These hydraulic heads were calculated with a reference density of
1050 kg/m3 in order to minimize the errors in representing and interpreting the flow of variable
density water in the vicinity of the acid-gas injection sites (Bachu & Michael, 2002). The
reference density, calculated for in-situ conditions according to the algorithm of Batzle and Wang
(1992), corresponds to brine density at conditions characteristic of the acid-gas injection sites.
Hydraulic heads were calculated according to:
zg
pHo
���
(1)
where z (m) is the elevation of the pressure recorder, p (Pa) is pressure, �o (kg/m3) is the
reference density and g is the gravitational constant (9.81 m/s2).
In general, the distributions of hydraulic heads in the Winterburn and Wabamun aquifers in the
regional-scale study areas are similar to each other and both are quite different than that in the
Mississippian aquifer (Figures 11b, 12b and 13b). Hydraulic heads decrease in both Wabamun
and Winterburn aquifers from greater than 700 m in the northwest and greater than 500 m in the
southeast, to less than 350 m in the northeast (Figures 11b and 13b). Hydraulic-head gradients are
high in the western half and in the southeast, where hydraulic-head values decrease to 400 m over
a relatively short distance. However, gradients are comparably low in the central and northeastern
portions of the study area, where hydraulic heads decrease northeastward from approximately 400
m to 300 m over a distance of 300 km.
Flow inferred from the hydraulic head distributions in the Wabamun and Winterburn aquifers
generally shows the potential for updip flow, eastward in the northern half, and north to
ERCB/AGS Special Report 093 (March 2008) 22

"7�
7��
0�
7��7 �
7� �
��"�7 ���8 �
7��7 �
7� �
��"�7 ���8 �
@�<�!$
������3!���
��� �
7" �7" �
��� �
���
�7�
���
8��
���
�7�
���
"7�
)�<�!!���<��1���!������@����=����
)�I�������%���
+����>%�����%���&��!��
��0�!�=������<������0�$���A!��=
� 7� ����#���$��!�%
� 7��$���%
���
7��7 �
7� �
��"�7 ���8 �
7��7 �
7� �
��"�7 ���8 �
@�<�!$
������3!���
��� �
7" �7" �
��� �
��
���
�����
�
�F�
���
���
���
���
������
@����=���� )�I�������%��� +����>%�����%���&��!����0�!�=������<������0�$���A!��=
���
���
�����""�3+��������������������������������������4���������������&��������+���1�%�������+�����������,������5�%!����%���������������+�������������%�
77�
ERCB/AGS Special Report 093 (March 2008) 23

���
77�
F�
7��7 �
7� �
��"�7 ���8 �
7��7 �
7� �
��"�7 ���8 �
@�<�!$
������3!���
��� �
7" �7" �
��� �
��
0�
7��7 �
7� �
��"�7 ���8 �
7��7 �
7� �
��"�7 ���8 �
@�<�!$
������3!���
��� �
7" �7" �
��� �
0
���
��� ��
�F�
��
��
��
���
���
F���
���
F�
���
7��
7��
77�77�
�7�
�7�
77�
77�
���
���
���
7��
���"7�
�7�
�����"$�3+������������������������������6�������������4���������������&��������+���1�%�������+�����������,������5�%!����%����������������+�������������%�
@����=���� )�I�������%��� +����>%�����%���&��!��,�%%�%%�==���0�����!&
)�<�!!���<��1���!������@����=����
)�I�������%���
+����>%�����%���&��!��
,�%%�%%�==����0�����!&� 7� ����#���$��!�%
� 7��$���%
ERCB/AGS Special Report 093 (March 2008) 24
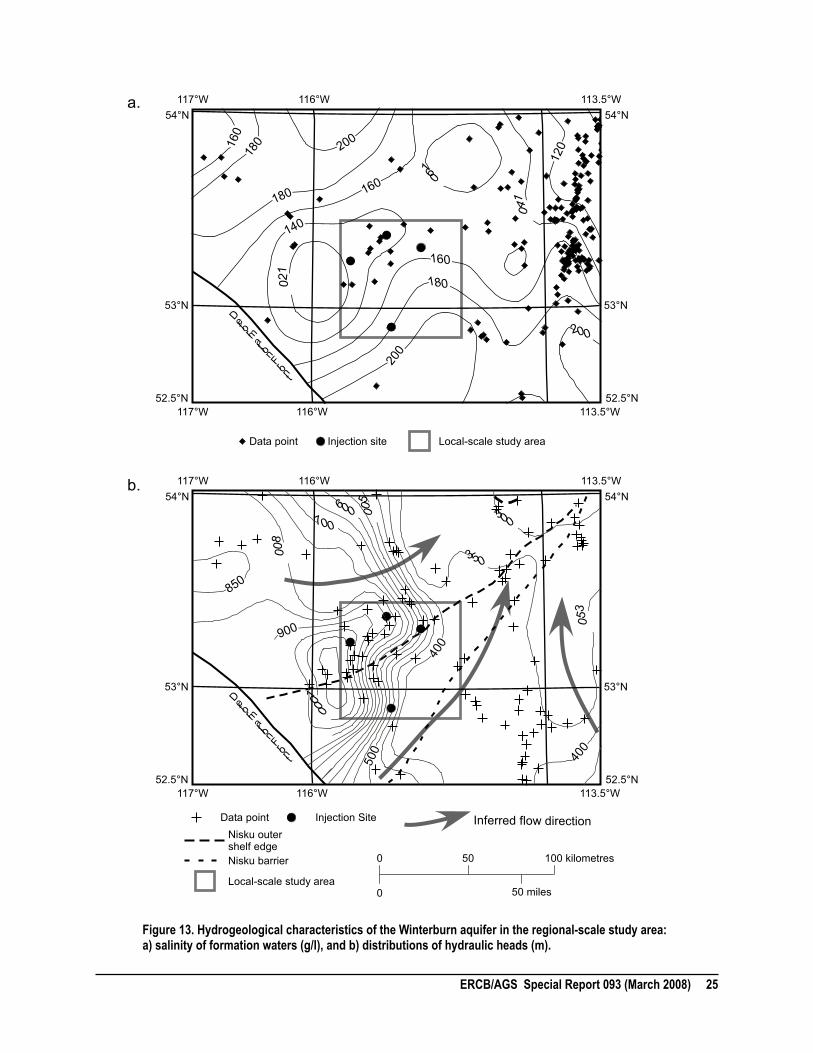
7��
����
7��
7��7 �
7� �
��"�7 ���8 �
7��7 �
7� �
��"�7 ���8 �
@�<�!$
������3!���
��� �
7" �7" �
��� �
��
0�
7��7 �
7� �
��"�7 ���8 �
7��7 �
7� �
��"�7 ���8 �
@�<�!$
������3!���
��� �
7" �7" �
��� �
���
���
���
�F�
�F����
���
�F�
���
���
���
���
���
���
�����"7�3+����������������������������������������4���������������&��������+���1�%�������+�����������,������5�%!����%����������������+�������������%�
"��
"7�
���
���
���
F��
���8��
F7�
"7�
@����=���� )�I�������%��� +����>%�����%���&��!��
)�<�!!���<��1���!������@����=���� )�I�����������
+����>%�����%���&��!��
��%#��0�!!��! � 7� ����#���$��!�%
� 7��$���%
��%#������!%���<����
ERCB/AGS Special Report 093 (March 2008) 25

northeastward in the southern part of the study area, suggesting that, on a regional scale, both
aquifers are controlled by similar flow-driving mechanisms. The flow in the southern part of the
regional-scale study area appears to be directed along the facies change from limestone to
dolostone in the Wabamun aquifer and along the trend of the Nisku shelf edge in the Winterburn
aquifer. The main difference in hydraulic head distributions between the Wabamun and
Winterburn aquifer is a north-south trend (approximately 200 km long along 115.5oW) of rapidly
decreasing hydraulic heads (from 1000 m to 400 m) in the Winterburn Group aquifer over a
relatively short distance of approximately 50 km, a feature that is absent in the Wabamun aquifer
(Figures 11b and 13b). This zone of high hydraulic gradients indicates the existence of a region of
low permeability in the underlying Winterburn aquifer. The hydraulic gradient in the Wabamun
aquifer in this region, although not as high as in the Winterburn aquifer, is similarly higher than
the gradient in the central and northeastern portions of the study area, suggesting that the
limestones in the Wabamun aquifer have a lower permeability than the dolostones. The Pembina
acid-gas injection sites are located in the transition zone from relatively low-permeability
limestone to higher-permeability dolostone along the western margin of the north-
northeastwardly directed regional flow system.
The hydraulic head distribution in the Mississippian aquifer shows a completely different flow
pattern from those in the underlying Wabamun and Winterburn aquifers (Figure 12b). Generally,
flow is directed northwestward in the western and central parts of the study area, and only in the
east flow is updip, towards the Mississippian erosional edge. The contrast between flow patterns
in the Mississippian and Wabamun aquifers indicates that the intervening Exshaw-Lower Banff
interval is an effective aquitard. Conversely, similar distributions of hydraulic heads in the
Wabamun and Winterburn aquifers suggest that the intervening Graminia and Calmar formations
form, at least locally, a relatively weak aquitard.
Based on the relatively high salinity of formation waters, and because of the lack of an identified
recharge source and flow-driving mechanism for meteoric water, Bachu (1995) postulated that
the flow in the Wabamun and Winterburn aquifers is driven by past tectonic compression (Figure
6). This hypothesis is supported by isotopic analyses of formation waters and late-stage cements
in both the deformed and undeformed parts of the basin (Nesbitt & Muehlenbachs, 1993; Machel
et al., 1996; Buschkuehle & Machel, 2002).
5 Local-Scale Setting of the Pembina-Wabamun Acid-Gas Injection Sites
The geological and hydrogeological characteristics of the Wabamun Group are described at a
local scale (defined as Twp. 45-51, Rge. 6-12 W 5th Mer.), to better understand the containment
of the injected acid gas, and to examine the potential for gas migration and/or leakage from the
Wabamun Group. The geology in this area is only moderately well understood, because there are
no hydrocarbon reservoirs within the Wabamun Group in the study area and, as a result, not many
wells have been cored. The four injection sites are located within the boundaries of the Pembina
Field about 20 to 40 km apart; their locations are 14-22-49-12W5, 02-11-51-10W5, 11-14-50-
8W5, and 06-25-45-10W5 (Figure 14).
ERCB/AGS Special Report 093 (March 2008) 26

Figure 14. Location of the acid-gas injection sites in relation to the Pembina oil field. 5.1 Geology of the Wabamun Group
In the local-scale study area, the Wabamun Group constitutes a thick, homogenous sequence of
shallow marine carbonates, which have been deposited on a large, semi-restricted shelf
(Halbertsma, 1994). The Wabamun carbonates lie at depths of about 2700 m (-1700 to -1800 m
elevation) in the southwest and rise updip, northeastward, towards 2000 m (-1100 to -1200 m
elevations) (Figure 15). The Wabamun Group has a uniform thickness of 200 to 220 m in the
injection areas and thins slightly to 180 m towards the northeast as a result of erosion (Figure 16).
There are no known faults in the area.
5.2 Lithology and Mineralogy of the Graminia-Wabamun-Banff/Exshaw Interval
To understand the fate of the acid gas injected into the Wabamun Group in the Pembina area
there is need for a description not only of the rocks of the Wabamun Group, but also of the
underlying and overlying confining strata. Thus, the following presents the entire sedimentary
succession from the underlying Graminia Formation of the Winterburn Group to the Wabamun
Group, which in turn is overlain by the Exshaw and Banff formations of the Mississippian Period.
Blue Ridge Member (Graminia Formation, Winterburn Group)
The Blue Ridge is the lower member of the Graminia Formation. It overlies a thin silty unit
assigned to the Calmar Formation and is overlain by another silt unit designated the Graminia silt.
The Blue Ridge Member is composed of burrowed, nodular, silty dolomite and fine siltstones,
with occasional thin shale partings. Fauna is generally scarce and confined to scattered
brachiopods and crinoids.
ERCB/AGS Special Report 093 (March 2008) 27

(����� (����� (����� (���� (���F (���8 (������7
�1=��7�
�1=��7�
�1=����
�1=���F
�1=���8
�1=����
�1=���7
��
�����8��
�7��
����
�"��
� �� ���#���$��!�%
� 7 ���$���%)�I�����������
���������� �� ���������������� ����������� ������������������������������ �����������!��� ��" �� ��������������
0�
(����� (����� (����� (���� (���F (���8 (������7
�1=��7�
�1=��7�
�1=����
�1=���F
�1=���8
�1=����
�1=���7
>����
>����
>����
>�F��
>����
ERCB/AGS Special Report 093 (March 2008) 28

(����� (����� (����� (���� (���F (���8 (������7
�1=��7�
�1=��7�
�1=����
�1=���F
�1=���8
�1=����
�1=���7
���
���
���
�F�
���
� �� ���#���$��!�%
� 7 ���$���%)�I�����������
(����� (����� (����� (���� (���F (���8 (������7
�1=��7�
�1=��7�
�1=����
�1=���F
�1=���8
�1=����
�1=���7
�7��
����
"7��
"���
�7��
����
"7��
�������#��$� ����� ���������������� ����������� ���������������������" �� ��������������
�������%��$� ����� ���������������� ����� �� ������������������� ���������� ����������������������" �� ��������������
� �� ���#���$��!�%
� 7 ���$���%)�I�����������
ERCB/AGS Special Report 093 (March 2008) 29

Graminia Silt (Graminia Formation, Winterburn Group)
The Graminia Formation consists predominantly of anhydrite, with subordinate siltstone and silty
dolomite and buff, crystalline, silty dolomite. It commonly consists of an upper and lower silty
zone separated by a carbonate (Blue Ridge Member). The Blue Ridge-Graminia interval is about
30 m to 45 m thick in the local study area and thins due to erosion towards the east (Figure 17).
Wabamun Group
The Wabamun Group in the Pembina area is a thick sequence of grey to dark grey, shallow
marine, massive to burrow mottled, platform carbonates. The sediments usually consist of
limestone with minor amounts of dolomite and they are generally tight. Eight to six thin, laterally
continuous, dolomitized intervals occur in the Wabamun Group in the study area, which range in
thickness from 2 to 14 m; these intervals form the major injection units. In more detail, the
Wabamun Group can be subdivided into four unofficial units, which consist from top to bottom
of a tight argillaceous limestone, an upper anhydrite, a middle dolomite of reservoir quality, and a
lower anhydrite unit. The porous portion of the Wabamun Group commonly is the thickest
member. It is the middle dolomite section, which is primarily dolomite with minor layers of
limestone. It contains about 25 to 50 m of reservoir quality rock, with porosity reaching up to
20% in some intervals.
Thin-section point-counting analyses, XRD and XRF analyses from core samples were used to
determine the mineralogical composition of the Wabamun Group carbonates in the study area
(Table 1). The XRF analyses do not measure carbon content, which constitutes the balance to
100%. The rocks consist of 90% calcite, 5-9% dolomite, and the remainder being other minor
compounds like clay or ferroan minerals. This composition may vary locally due to different
degrees of dolomitization and recrystallization. These diagenetic processes also resulted in a
highly variable distribution of porosity and permeability, which is mainly confined to the middle
dolomite member. The porosity is mainly inter-crystalline porosity with minor amounts of vuggy
porosity.
Banff and Exshaw Formations (Mississippian)
The Wabamun Group disconformably underlies the Mississippian-aged Exshaw and Banff
formations, which consist of 180 m to 200 m tight limestones and bituminous shales (Figure 18).
The Exshaw Formation consists of a lower, shale-dominated member (~ 9 m) that is gradationally
overlain by an upper member (~37 m) comprised of siltstone and silty limestone (Macqueen &
Sandberg, 1970; Richards & Higgins, 1988). Conodonts are locally common within calcareous
concretions of the black shale member and indicate that the Devonian-Carboniferous boundary
actually lies within that unit in some places (Macqueen & Sandberg, 1970; Richards & Higgins,
1988). The lower member consists of anomalously radioactive, brownish black, sparsely
fossiliferous shale. A thin (10 cm) phosphatic, pyritic to sphaleritic, basal sandstone to
conglomerate bed is locally present. Bentonite and tuff beds are commonly present in the shale
member (Macdonald, 1987). The upper member is composed of a grey shale grading up into
siltstone, sandstone, silty limestone and skeletal to ooid lime grainstone and packstone. The
Exshaw Formation is generally disconformably overlain by the Banff Formation and/or grades
laterally into that unit.
ERCB/AGS Special Report 093 (March 2008) 30

(����� (����� (����� (���� (���F (���8 (������7
�1=��7�
�1=��7�
�1=����
�1=���F
�1=���8
�1=����
�1=���7
� �� ���#���$��!�%
� 7 ���$���%)�I�����������
��7
�8�
�87
�F�
�F7
��7
�8�
�87
�87
�F�
�F�
��7
�87
�8�
�������&��$� ����� ������'������������ �(���������)*���+�� ����� ���������� ����������������������" �� ��������������
���* 1�9 ���� �� ==$ 7
,* 1�9 ���� �� ==$ F
���*" 1�9 ���� 2� ==$ J+@
��*� 1�9 ���F A� ==$ J+@
5�*7 1�9 � �% ==$ J+@
� ==$ �F� (0 ==$ ��7
�� ==$ ���7 �! ==$ �7���
/�* 1�9 ���� . ==$ J+@
��* 1�9 8��� 2! ==$ ��7
�� ==$ "� �0 ==$ J+@
��*� 1�9 J+@ '� ==$ J+@
� ==$ � �� ==$ J+@
�! ==$ J+@ 50 ==$ �
,�* 1�9 ���� �� ==$ J+@
3��*"� 1�9 ���� � ==$ J+@
����� 1�9 8"��79
��������,������� ������������������� �������*�� �-��� ���������������� ������+���.�/0�.&�#�����/.���������
ERCB/AGS Special Report 093 (March 2008) 31
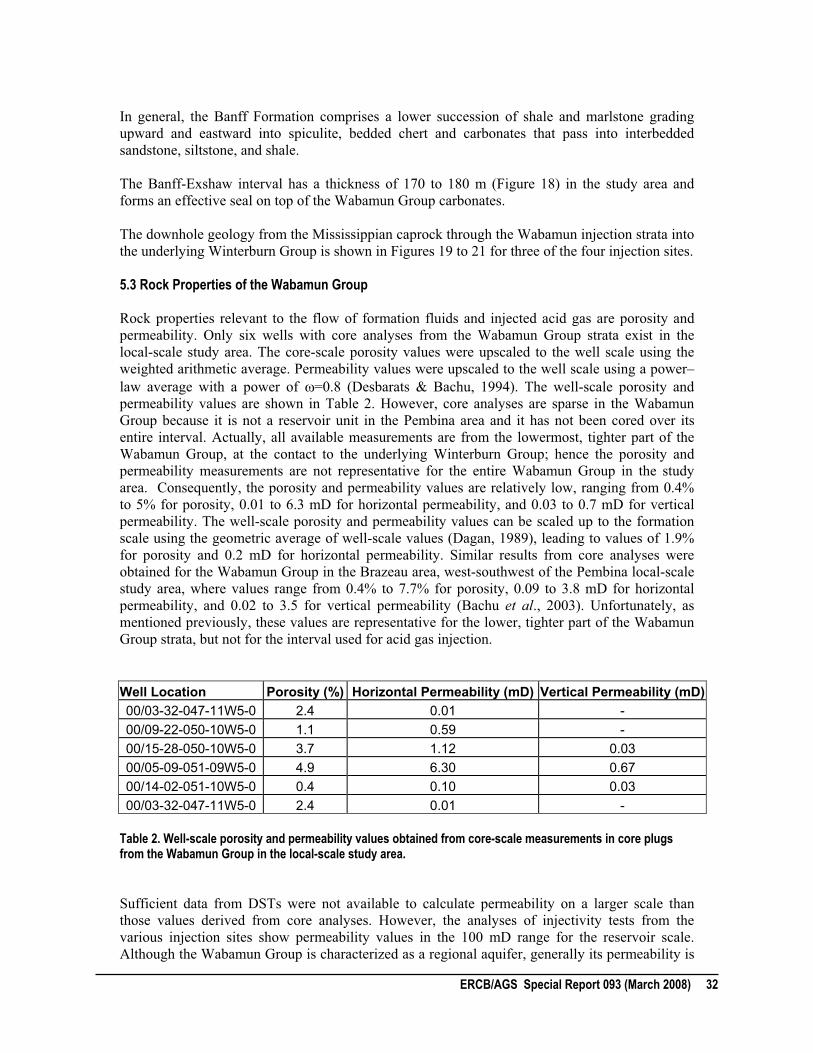
In general, the Banff Formation comprises a lower succession of shale and marlstone grading
upward and eastward into spiculite, bedded chert and carbonates that pass into interbedded
sandstone, siltstone, and shale.
The Banff-Exshaw interval has a thickness of 170 to 180 m (Figure 18) in the study area and
forms an effective seal on top of the Wabamun Group carbonates.
The downhole geology from the Mississippian caprock through the Wabamun injection strata into
the underlying Winterburn Group is shown in Figures 19 to 21 for three of the four injection sites.
5.3 Rock Properties of the Wabamun Group
Rock properties relevant to the flow of formation fluids and injected acid gas are porosity and
permeability. Only six wells with core analyses from the Wabamun Group strata exist in the
local-scale study area. The core-scale porosity values were upscaled to the well scale using the
weighted arithmetic average. Permeability values were upscaled to the well scale using a power–
law average with a power of �=0.8 (Desbarats & Bachu, 1994). The well-scale porosity and
permeability values are shown in Table 2. However, core analyses are sparse in the Wabamun
Group because it is not a reservoir unit in the Pembina area and it has not been cored over its
entire interval. Actually, all available measurements are from the lowermost, tighter part of the
Wabamun Group, at the contact to the underlying Winterburn Group; hence the porosity and
permeability measurements are not representative for the entire Wabamun Group in the study
area. Consequently, the porosity and permeability values are relatively low, ranging from 0.4%
to 5% for porosity, 0.01 to 6.3 mD for horizontal permeability, and 0.03 to 0.7 mD for vertical
permeability. The well-scale porosity and permeability values can be scaled up to the formation
scale using the geometric average of well-scale values (Dagan, 1989), leading to values of 1.9%
for porosity and 0.2 mD for horizontal permeability. Similar results from core analyses were
obtained for the Wabamun Group in the Brazeau area, west-southwest of the Pembina local-scale
study area, where values range from 0.4% to 7.7% for porosity, 0.09 to 3.8 mD for horizontal
permeability, and 0.02 to 3.5 for vertical permeability (Bachu et al., 2003). Unfortunately, as
mentioned previously, these values are representative for the lower, tighter part of the Wabamun
Group strata, but not for the interval used for acid gas injection.
Well Location Porosity (%) Horizontal Permeability (mD) Vertical Permeability (mD)
00/03-32-047-11W5-0 2.4 0.01 -
00/09-22-050-10W5-0 1.1 0.59 -
00/15-28-050-10W5-0 3.7 1.12 0.03
00/05-09-051-09W5-0 4.9 6.30 0.67
00/14-02-051-10W5-0 0.4 0.10 0.03
00/03-32-047-11W5-0 2.4 0.01 -
Table 2. Well-scale porosity and permeability values obtained from core-scale measurements in core plugs from the Wabamun Group in the local-scale study area.
Sufficient data from DSTs were not available to calculate permeability on a larger scale than
those values derived from core analyses. However, the analyses of injectivity tests from the
various injection sites show permeability values in the 100 mD range for the reservoir scale.
Although the Wabamun Group is characterized as a regional aquifer, generally its permeability is
ERCB/AGS Special Report 093 (March 2008) 32

�,*�*���)*���>��*K�)-�-��>�7
@+��>�7>�7>���7
,��!�% A(
DA � 5) E� ���
��
D��L, E��� �
�5
D, �E>��� �
5*+
D�L �E>�� ��>�7��
>����
>�8��
>�F��
>����
>"���
>"���
>"���
>""��
-?%��1�3�!$�����
��0�$���
�����!0�!�
����0����
,)@
@+-�@
-�*�)��
����0����;����!�
A� �����
3!�%����
3�$$�����
�55-(�������������@
-�*�)��
/56� / .74��0!., 8�!* ,��65 4!�0�0,
0� ���0,5 9
30,503 �79, &36,�6 903�,5�65 4
�.0�:7:
,)��)��)55)��
'��<<�3�!$�����
5�#�%#��3�!$�����
��0�$���A!��=
A!�$�����3�!$�����
'���!����,�$0�!
���$�!�3�!$�����
��%#��3�!$�����
)!�����3�!$�����
,�I����+�#�3�!$�����
"8�
"�8
"��
��!0�
����%�6����������%���%
��!0�
����%
�����!0�!��;����!�
�����!0�!��;��<�!
��0�$���;��<�!
,�%%�%%�==����;����!�
�����
���������%���%�6���!0�
����%
���
��%
�����<�!$��&
���������� ��� ������������������ ����� ������������� ��� ���� ��������������������� ����������� !" #" �$"��
ERCB/AGS Special Report 093 (March 2008) 33

-?%��1�3�!$�����
3!�%����
3�$$�����
�55-(�������������@
-�*�)��
�0,5 9
30,503 0� �� /56� / .7 �79, &36,�6 903�,5�65 4�.0
�:7:,
)��)��)55)��
'��<<�3�!$�����
5�#�%#��3�!$�����
��0�$���A!��=
A!�$�����3�!$�����
��%#��3�!$�����
"�8
"��
�����!0�!��;����!�
��0�$���;��<�!
,�%%�%%�==����;����!�
,��!�% A(
DA�5) E� ���
@-�
D/L," E�87� "���>�7��
>����
>�8��
>�F��
>����
>"���
�����<�!$��&
��!0�
����%�6����������%���%
�����
��!0�
����%
���������%���%�6
��!0�
����%
�������!���� ��� ������������������ ����� ������������� ��� ���� �������������%���������# !! # !$"��
ERCB/AGS Special Report 093 (March 2008) 34

-?%��1�3�!$�����
��0�$���
�����!0�!�
����0����
����0����;����!�
3!�%����
3�$$�����
�55-(�������������@
-�*�)��
/56� / .70� ���0,5 9
30,503 �79, &36,�6 903�,5�65 4
�.0�:7:
,)��)��)55)��
'��<<�3�!$�����
5�#�%#��3�!$�����
��0�$���A!��=
A!�$�����3�!$�����
��%#��3�!$�����
)!�����3�!$�����
"�8
"��
��!0�
����%�6����������%���%
�����
�����!0�!��;����!�
��0�$���;��<�!
,�%%�%%�==����;����!�
�����<�!$��&
,��!�% A(
DA�5) E� ���
��
D��L,E��� �
@-�
D/L,"E��� �F��>����
>����
>�"��
>����
>�7��
>����
��!0�
����%
���������%���%�6
��!0�
����%
���
��%
�������!��� ��� ������������������ ����� ������������� ��� ���� �������������%%����������! " �$"��
ERCB/AGS Special Report 093 (March 2008) 35
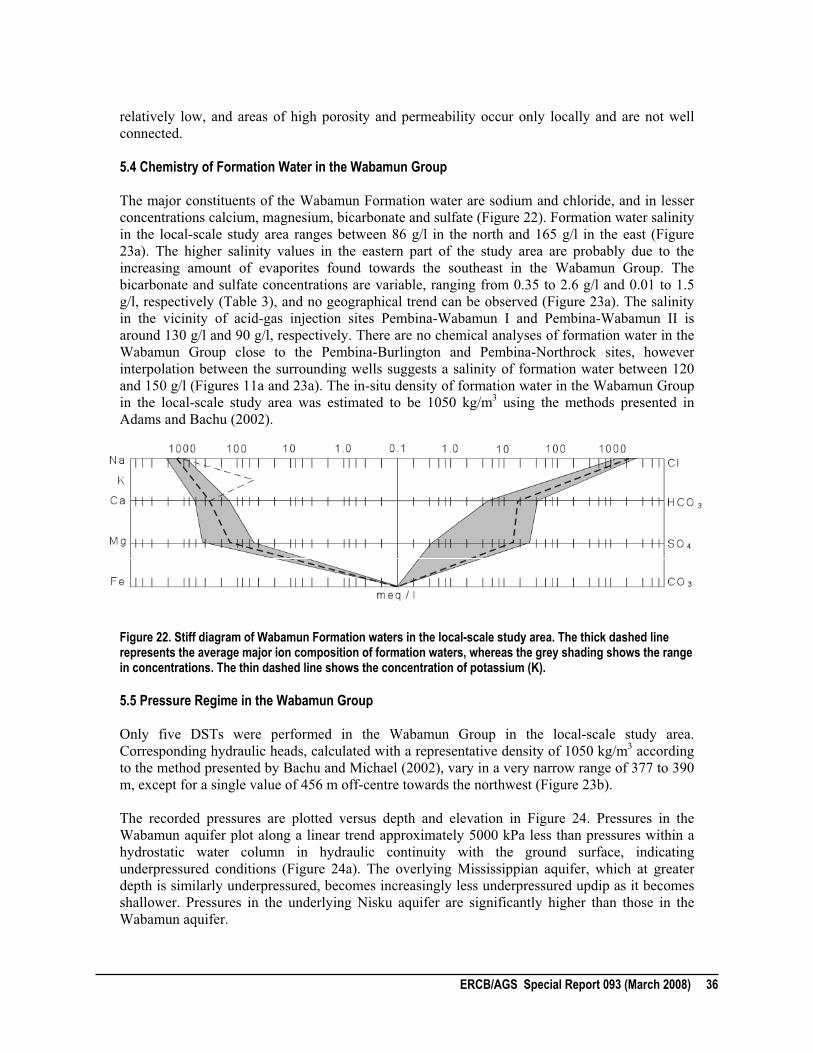
relatively low, and areas of high porosity and permeability occur only locally and are not well
connected.
5.4 Chemistry of Formation Water in the Wabamun Group
The major constituents of the Wabamun Formation water are sodium and chloride, and in lesser
concentrations calcium, magnesium, bicarbonate and sulfate (Figure 22). Formation water salinity
in the local-scale study area ranges between 86 g/l in the north and 165 g/l in the east (Figure
23a). The higher salinity values in the eastern part of the study area are probably due to the
increasing amount of evaporites found towards the southeast in the Wabamun Group. The
bicarbonate and sulfate concentrations are variable, ranging from 0.35 to 2.6 g/l and 0.01 to 1.5
g/l, respectively (Table 3), and no geographical trend can be observed (Figure 23a). The salinity
in the vicinity of acid-gas injection sites Pembina-Wabamun I and Pembina-Wabamun II is
around 130 g/l and 90 g/l, respectively. There are no chemical analyses of formation water in the
Wabamun Group close to the Pembina-Burlington and Pembina-Northrock sites, however
interpolation between the surrounding wells suggests a salinity of formation water between 120
and 150 g/l (Figures 11a and 23a). The in-situ density of formation water in the Wabamun Group
in the local-scale study area was estimated to be 1050 kg/m3 using the methods presented in
Adams and Bachu (2002).
Figure 22. Stiff diagram of Wabamun Formation waters in the local-scale study area. The thick dashed line represents the average major ion composition of formation waters, whereas the grey shading shows the range in concentrations. The thin dashed line shows the concentration of potassium (K). 5.5 Pressure Regime in the Wabamun Group
Only five DSTs were performed in the Wabamun Group in the local-scale study area.
Corresponding hydraulic heads, calculated with a representative density of 1050 kg/m3 according
to the method presented by Bachu and Michael (2002), vary in a very narrow range of 377 to 390
m, except for a single value of 456 m off-centre towards the northwest (Figure 23b).
The recorded pressures are plotted versus depth and elevation in Figure 24. Pressures in the
Wabamun aquifer plot along a linear trend approximately 5000 kPa less than pressures within a
hydrostatic water column in hydraulic continuity with the ground surface, indicating
underpressured conditions (Figure 24a). The overlying Mississippian aquifer, which at greater
depth is similarly underpressured, becomes increasingly less underpressured updip as it becomes
shallower. Pressures in the underlying Nisku aquifer are significantly higher than those in the
Wabamun aquifer.
ERCB/AGS Special Report 093 (March 2008) 36

Well location Sample Date Depth (mKB) Cations (mg/l) Anions (mg/l) TDS Density Density T pH pH T
from to Na K Ca Mg Cl HCO3 SO4 (mg/l) (g/m3) (oC) (
oC)
2224 2263 50110 10615 2207 101486 375 1052 165845 1.017 16 7.7 02/14-29-048-06W5-0
2185 2195 45995 10224 1872 93189 380 1083 152965 1.111 16 8.6
00/14-20-050-12W5-0 29-Apr-77 2908 2932 46924 3115 695 78900 452 1027 131113 1.092 16 6.8 24
00/02-20-050-10W5-0 08-May-78 2582 2591 32594 8689 1118 68300 1037 12 111750 1.08 16 7.3 22
28-Nov-83 2601 2603 31500 2150 3208 668 54253 2006 843 94628 1.0755 15.4 8.600/14-28-050-10W5-0
28-Nov-83 2601 2603 34000 2740 3412 741 59613 2324 722 103552 1.0818 15.4 8.6
00/01-28-048-12W5-0 25-Mar-83 2995 2997 31030 2111 13170 5900 83900 2635 494 139240 1.099 25 7.2 25
09-Mar-87 2239 2260 25180 1918 4324 1074 52000 351 1535 86382 1.055 25 7.7 2300/14-04-051-09W5-0
12-Mar-87 2260 2281 41530 3553 9830 2175 93800 481 1444 152813 1.103 25 7.0 23
00/13-26-051-09W5-0 13-Jan-86 2216 2239 45450 4494 11200 2284 102100 817 479 166820 1.110 25 7.0 22
02/14-12-048-06W5-0 06-Apr-89 2146 2183 45235 2496 10410 3156 100000 805 605 162707 1.111 25 6.4 21
Table 3. Chemical analyses of formation water from the Wabamun Group in the local-scale study area. The location of sample wells and salinity (TDS) values are shown in Figure 23a.
ERCB/AGS Special Report 093 (March 2008) 37

(����� (����� (����� (���� (���F (���8 (������7
�1=��7�
�1=��7�
�1=����
�1=���F
�1=���8
�1=����
�1=���7
� �� ���#���$��!�%
� 7 ���$���%)�I�����������
���������� ��������������������������������������������������������������������������� ����������������� �������������������� �!��"��������� �������������� �#������������������
���������������� ����$%&%�'�!���
0�
��
(����� (����� (����� (���� (���F (���8 (������7
�1=��7�
�1=��7�
�1=����
�1=���F
�1=���8
�1=����
�1=���7
�"�
�"�
5�$0����)
��
���
F�5�$0����))
5�$0������!��!��#
��7
���
�"� �������&�DL+E
5�$0����'�!������
�7�&�!����������D$��0� ��%����� ��E
5�$0����)
5�$0����))
5�$0������!��!��#
5�$0����'�!������
"F�
"��
�7�
"88
"F8
ERCB/AGS Special Report 093 (March 2008) 38

����
�F��
����
����
����
����
�F��
"���
"���
����� �7��� ����� �7��� "���� "7���
��0�$��
�����!0�!�
,�%%�%%�==���
3!�%�1���!��&�!�%������!�������D��F��#5
�L$E
'!����Dρ�H���7��#L$ "
E��&�!�%������!�������D���"�#5�L$
E
+�����M��0�$
��M�=!�%%�!���!���
� �!=!�%%�!�%
����!=!�%%�!�%
��>�8>���>���7
��>��>���>���7
��>��>�7�>���7
��>��>�7�>���7
��>��>��F>���7
>����
>����
>�F��
>����
>����
>����
>����
>F��
����� �7��� ����� �7��� "���� "7���
��0�$��
�����!0�!�
,�%%�%%�==���
A!�������H����"�#5
�L$
�������(��)������������*�������������������*�������������+�����"����������������,���*�������-����������������������������������������� �������.��������������������� ���*���������������������*��������������� ����������� �����������"������������������������������������� ����������$%%%����$%&%��!�� %�'/����������������������
0��-������#�� ����
9�)�1�# ���;�����%���<�$��
�������������
���������������
0�
ERCB/AGS Special Report 093 (March 2008) 39

On the pressure-elevation plot (Figure 24b), data points from the Wabamun aquifer follow a
linear trend with a slope of 10.3 kPa/m, which is representative of the pressure distribution in a
static column of water with a density of 1050 kg/m3. Only the pressure measurement from the 12-
09-049-10W5 well falls above this static gradient line. This “higher” pressure translates into the
hydraulic head value of 456 m, which is higher than the surrounding head values (Figure 23b).
5.6 Flow of Formation Water in the Wabamun Group
The pressure regime and hydraulic head distribution in the Wabamun aquifer suggest that flow
conditions in the Pembina area are close to static. Only the elevated hydraulic head value in the
12-09-049-10W5 well suggests formation water flow into the Pembina area, with three
possibilities for origin and cause: a) lateral flow from the west, where values of hydraulic heads
are higher than 450 (Figure 11b), b) vertical upward leakage from the Winterburn aquifer, and c)
downward leakage from the Mississippian aquifer. The latter hypothesis can be easily discarded
because hydraulic heads in the Mississippian aquifer are lower than those in the Wabamun
aquifer in the Pembina area. Pressures and hydraulic heads in the underlying Winterburn Group
(Figures 24b and 13b, respectively) are higher than those in the Wabamun Group (Figures 24b
and 11b), so that the potential for upwards cross-formational flow exists, at least locally.
However, the offset of pressure data from the Wabamun and Nisku aquifers in the pressure-depth
and pressure-elevation plots (Figure 24) indicates that, on a larger scale, there is no vertical
hydraulic continuity between the two aquifers in the Pembina area and that the intervening
Calmar and Graminia formations form an effective aquitard. It is more likely that the elevated
hydraulic head value was measured in a lower-permeability limestone interval of the Wabamun
Group. As discussed in the regional-scale hydrogeological analysis, the facies boundary from
limestone to higher-permeability dolostone runs through the Pembina area, forming a lateral flow
barrier and thereby causing the drop in hydraulic head values (Figure 11b). However, a definitive
assessment is not possible because this interpretation of the flow and its causes hinges on a single
data point, the quality of which could not be validated with sufficient certainty.
Pressures from the Wabamun and overlying Mississippian plot along a similar trend in the
pressure-depth and pressure-elevation plots, which may suggest a continuous Wabamun-
Mississippian aquifer system. However, the intervening Exshaw-Lower Banff interval forms a
thick, competent aquitard (more than 150 m in thickness). Therefore, it is more likely that, rather
than being in hydraulic communication, both aquifers are controlled by the same boundary
conditions along their subcrop at the sub-Cretaceous unconformity. The northward regional-scale
flow system in the Upper Devonian-Cretaceous Mannville aquifer system in central-eastern
Alberta affects pressures and flow in both the Mississippian and the Wabamun aquifers along
their respective subcrop areas in the center and east of the local-scale study area, respectively.
Previous studies have established convergence in central Alberta of Paleozoic flow systems
(Michael & Bachu, 2002b, Michael et al., 2003) and the flow system in the Upper Devonian-
Mannville aquifer system along the sub-Cretaceous unconformity (Bachu, 1995; Rostron & Toth,
1997; Anfort et al., 2001).
Mixing of formation waters from various aquifers in their subcrop region at the sub-Cretaceous
unconformity region creates a plume of high salinity brine in the Mannville aquifer and,
conversely, dilutes brines in the Paleozoic aquifers. Although the Wabamun aquifer connects with
the Mannville aquifer east of the local-scale Pembina area, and clearly updip flow of Wabamun
brines contributed in the past to the high-salinity plume in the Mannville, at present flow
conditions inferred from pressure and hydraulic head distributions appear rather stagnant in the
area of the acid-gas injection sites. The high salinity values (160 g/l) in the east (Figure 23a) also
show that significant dilution with less saline Mannville waters, like it is observed further east
ERCB/AGS Special Report 093 (March 2008) 40

along the Wabamun subcrop edge (Figure 11a), has not occurred in the Pembina area. These
hydrogeological conditions are similar to those in the deep formations of the Williston basin in
Saskatchewan and North Dakota, where the negative buoyancy of high-salinity formation waters
cancels out the topographic drive and leads to quasi-stagnant flow (Bachu & Hitchon, 1996).
5.7 Stress Regime and Geomechanical Properties
Knowledge of the stress regime at the injection sites is important for establishing the potential for
hydraulic rock fracturing as a result of injection, and for setting limits for operational parameters.
Given its tensorial nature, the stress regime in any structure, including the Earth, is defined by the
magnitude and orientation of the three principal stresses, which are orthogonal to each other. In
the case of consolidated rocks, the fracturing threshold is greater than the smallest principal
stress, �3, but less than the other two principal stresses, �1 and �2. If fracturing is induced,
fractures will develop in a plane and direction perpendicular to the trajectory of the smallest
principal stress. Basin-scale studies of the stress regime in the Alberta basin suggest that, in most
of the basin, the smallest principal stress, �3, is horizontal (Bell & Babcock, 1986; Bell et al., 1994; Bell & Bachu, 2003). Due to the orthogonality of the stress tensor, this means that the
smallest stress is the minimum horizontal stress (�3=SHmin). Rock fracturing occurs at pressures Pb
that are greater than the minimum horizontal stress and that can be estimated using the equation:
00maxmin3 TPSSP HHb ���� (2)
where SHmax is the maximum horizontal principal stress, P0 is the pressure of the fluid in the pore
space, and T0 is tectonic stress. In the case of injection, the fluid pressure at the well is the bottom
hole injection pressure. This equation demonstrates that the fracturing pressure is related to the
effective stress (stress less fluid pressure), beside the tensile strength of the rock.
The minimum horizontal stress, SHmin, can be evaluated using a variety of tests. The most accurate
method for estimating the magnitude of the SHmin, is through micro-fracture testing, but mini-
fracturing, leak-off tests and Fracture Breakdown Pressure tests are also used (Bell, 2003; Bell &
Bachu, 2003). The maximum horizontal stress cannot be directly measured, but it can be
calculated according to the relation:
)(1
0max PSS VH ��
��
� (3)
where SV is the vertical stress and � is Poisson’s ratio, which is determined through laboratory
tests on rock samples. The magnitude of SV at any depth coincides with the pressure exerted by
the rocks above that point (weight of the overburden), and can be calculated by integrating the
values recorded in density logs. Unfortunately there are no methods for estimating the tectonic
stress, T0, hence it is not possible to estimate the rock fracturing pressure. However, previous
studies have shown that in the study area the SHmax is less than SV (Bell & Babcock, 1986; Bell et al., 1994). Thus, estimation of SHmin and SV in a well provides loose lower and upper bounds for
the fracturing pressure in that well.
If fractures occur, they will develop in a direction perpendicular to the plane of the minimum
horizontal stress, hence the need to know the principal directions of the stress field. Horizontal
stress orientations can be determined from breakouts, which are spalled cavities that occur on
opposite walls of a borehole (Bell, 2003). They form because the well distorts and locally
amplifies the far-field stresses, producing shear fracturing on the borehole wall. If the horizontal
ERCB/AGS Special Report 093 (March 2008) 41

principal stresses are not equal, the wall rock of a quasi-vertical well is anisotropically squeezed.
Caving occurs preferentially aligned with the axis of the smaller SHmin. More detailed description
of the methods used for estimating stress magnitude, gradient and orientation are found in Bell
(2003) and Bachu and Bell (2003).
Because no testing was performed in the injection wells themselves, density logs and tests from
adjacent wells in the local-scale study area were used in the analysis of the stress regime in the
rocks of the Wabamun Group in the Pembina area. Micro-frac, mini-frac and leak-off tests from
wells in the Wabamun Group in the regional-scale study area were used to estimate the gradient
of the minimum horizontal stress, SHmin. These gradients were then mapped, to infer the value of
the gradient at the acid-gas injection sites. The SHmin at each injection site was then back
calculated on the basis of stress gradient and depth (Bell, 2003; Bachu & Bell, 2003).
Orientations of the SHmin were determined from wells with breakouts in the Wabamun Group in
the local-scale study area. The results are presented in Figure 25.
Vertical stresses at the top of the Wabamun Group in the acid-gas injection wells vary from 50.8
MPa to 65.6 MPa (Figure 25a) and reflect the southwestward dipping of the Wabamun Group
strata. Because in some cases the injection interval is deeper than the top of the Wabamun Group,
vertical stresses, SV, at the top of the injection interval vary between 51.5 MPa and 67.4 MPa
(Figure 25a). The gradient of the vertical stress, calculated for the injection wells and for the other
two wells with data higher up in the sedimentary succession, varies between 22.6 kPa/m and 24.2
kPa/m (Figure 25a), reflecting variations in rock density. Minimum horizontal stresses, SHmin, in
the four injection intervals vary between 36.0 MPa and 47.9 MPa (Figure 25b), reflecting
variations in both injection depth and in stress distribution. The implication of these results is that
the rock fracturing threshold in each well is between SHmin and SV, but generally closer to SHmin.
If the bottom hole injection pressure (BHIP) reaches the SHmin value, pre-existing fractures, if
present, may open up. If no fractures are present, and there is no indication that there are any
(except maybe around the well bore), the pressure has to increase beyond SHmin to overcome the
tensile strength of the rocks, at which time the rocks will fracture. However, fractures may be
limited to reservoir rocks only and may not propagate into the caprock. In order to avoid reservoir
fracturing, the maximum BHIP should, at all times, remain less than the SHmin. For safety reasons,
AEUB regulations require that the maximum BHIP be less than 90% of the fracturing threshold.
Thus, the maximum BHIP approved by AEUB for these injection operations is significantly less
than the minimum horizontal stress SHmin.
The direction of the minimum horizontal stress varies between 127.4o and 148.8o, in a general
southeast-northwest direction (Figure 25b). This means that fractures will form and propagate in a
vertical plane in a southwest-northeast direction (47°-59°), basically perpendicular to the Rocky
Mountain deformation front and along the direction of the tectonic stress induced by the
Laramide orogeny and by the collision of the Pacific and Juan de Fuca tectonic plates with the
North American continent. This preferential fracturing direction was observed previously in coal
mines in Alberta (Campbell, 1979), and was similarly determined for overlying Cretaceous rocks
in southern and central Alberta (Bell & Bachu, 2003).
Knowledge of the geomechanical properties of rocks in formations affected by acid gas injection
is an essential part of the subsurface characterization of any injection site, including the acid-gas
injection operations in the Pembina area. These properties, in combination with the stress regime,
play an important role in evaluating the safety of the operation and avoiding rock fracturing and
acid gas leakage into overlying formations. Two parameters are essential to understanding the
rock mechanics of an injection site: Young’s modulus and Poisson’s ratio. Unfortunately there are
ERCB/AGS Special Report 093 (March 2008) 42

�"F�F
� �� ���#���$��!�%
� 7 ���$���%
)�I�����������
,����<!����!�����!������
�$��
��!���������
0�
(����� (����� (����� (���� (���F (���8 (������7
�1=��7�
�1=��7�
�1=����
�1=���F
�1=���8
�1=����
�1=���7�����,5�
�8���,5�
"����,5�
"��,5�
��8��
�"8�8
�"��F
��F�F
(����� (����� (����� (���� (���F (���8 (������7
�1=��7�
�1=��7�
�1=����
�1=���F
�1=���8
�1=����
�1=���7
7��7�,5�
7��F�,5�7"���,5��"���#5�L$�����,5�
�����,5������#5�L$
�7���,5��8���,5������#5�L$
�"�7�#5�L$
��
���F�#5�L$
���������� ������������������ �������������������� �������������������� ���������������������������� ����������������!�" !������ ������������!���������������� ���#��������������!�"$���!
����� �����������������
�7���,5�����������������=��<�������0�$���A!��=
�8���,5�����������������=��<�������I�����������! ��
�����#5�L$����%�!�%%�!������
ERCB/AGS Special Report 093 (March 2008) 43

no publicly available values for these parameters for carbonate rocks in the Alberta Basin, and
very few values for other geomechanical properties that can be used to derive the parameters of
interest (Miller & Stewart, 1990; Allen & Roberts, 1992; Chalaturnyk, 1996). Four of them are
for deep Mississippian rocks in west-central Alberta just outside the regional-scale study area,
and one is for shallow Middle Devonian rocks in northeastern Alberta (Table 4). For the caprock,
which formed by the Exshaw Formation shales, representative values could be derived for only
one case of Jurassic Fernie Group shales (Table 4), based on data from Miller and Stewart (1990).
Young’s modulus is defined as the amount of strain (deformation) caused by a given stress, and is
a function of the stiffness of the material. Young’s modulus is used as an indication of the
possible width of fractures. A high Young’s modulus correlates to a narrower fracture width. In
general, typical Young’s modulus values for rock range from 20 to 82.5 GPa (Jumikis, 1983;
Haas, 1989). The values for Mississippian rocks range from 55 GPa to 73.5 GPa, compared with
a value of 27.9 GPa for the Jurassic shale (Table 4).
Poisson’s ratio is defined as the ratio of the strain perpendicular to an applied stress, to the strain
along the direction of that stress. It is a measure of the deformation perpendicular to and along the
stress being applied to the rock, and indicates the plasticity of the rock. The rock plasticity,
expressed by Poisson’s ratio, and SHmin, have a significant effect in determining the rock fracture
threshold (see equations 2 and 3). A formation with high SHmin and Poisson’s ratio likely would be
an effective barrier to fracture propagation. In general, values for Poisson’s ratio for limestone
range from 0.27 to 0.3, and for shales from 0.2 to 0.4 (Lambe & Whitman, 1951; Haas, 1989).
For carbonate rocks in the Alberta Basin values range from 0.28 to 0.32, while the single value
for shales is 0.3 (Table 4).
Rock Age Rock Type Well Location Average
Depth (m) Poisson’s
Ratio Young’s
Modulus (GPa)
Mississippian Limestone Calgary, AB. 2700 0.28 55.0
Mississippian Limestone 15-18-039-3W5 2195 0.30 73.5
Mississippian Limestone 9-5-039-3W5 2185 0.31 64.0
Mississippian Limestone/Dolostone
9-5-039-3W5 2175 0.26 56.7
Middle Devonian
Limestone 31-092-12W5 261 0.32 -
Jurassic Shale 9-13-039-3W5 2179 0.30 27.9
Table 4. Geomechanical properties of rocks of interest from the Alberta Basin (derived based on data from Miller & Stewart, 1990; Allen & Roberts, 1992; Chalaturnyk, 1996).
5.8 Site Specific Characteristics of the Acid Gas Operations
The site-specific characteristics of the acid-gas injection operations in the Wabamun Group in the
Pembina area are summarized in Table 5. The information contained therein has been compiled
from the applications submitted by operators to AEUB in the process of obtaining approval for
these operations, and from other sources. It is worth noting that the operators indicate site-specific
porosity and permeability values in the range of 6% to 20%, and 35 to 137 mD (Table 5), which
are significantly higher than the values obtained from other wells (Table 2).
ERCB/AGS Special Report 093 (March 2008) 44

Operation Description Pembina-Wabamun I
Pembina-Wabamun
Northrock
Pembina-Wabamun
Burlington Pembina-Wabamun II
Gas Plant Chevron West Pembina Amoco Lobstick O'Chiese Gas Plant Chevron Bigoray
Current Operator Enerpro Midstream Inc.
Northrock Resources
Ltd.
Burlington Resources
Canada Energy Ltd. Enerpro Midstream Inc.
Approval Date 2/23/1994 1/21/2000 5/11/2000 6/7/2000
Status active not implemented active active
Location (DLS) 14-22-049-12W5/02 11-14-050-08W5/00 06-25-045-10W5/00 02-11-051-10W5/02
Latitude (N) 53.24688 53.3181 52.90618 53.38374
Longitude (W) -115.6746 -114.98 -115.3226 -115.28
KB Elevation (m AMSL) 966.3 850.0 915.4 879.3
Depth of Injection Interval (m) 2,715-2,918 2,222-2,228 2,781-2,847 2,285-2,503
Average Injection Depth (m) 2,817 2,225 2,814 2,394
Injection Formation Name Wabamun Group Wabamun Group Wabamun Group Wabamun Group
Injection Formation Lithology Limestone Limestone Dolostone Limestone
Injection Formation Thickness (m) 203 6 66 218
Net Pay (m) 10 8 60 10
Caprock Formation
Exshaw/Banff
Formations
Exshaw/Banff
Formations Exshaw/Banff Formations Exshaw/Banff Formations
Caprock Formation Lithology Shale/Limestone Shale/Limestone Shale/Limestone Shale/Limestone
Caprock Thickness (m) 130 190 168 130
Underlying Formation Graminia Formation Blueridge Member
Wabamun-Winterburn
Group Graminia Formation
Underlying Formation Lithology Siltstone Dolomitic shale Limestone
Argillaceous/Silty
carbonate
Underlying Thickness (m) 10 50 90 7
Porosity (fraction) 0.06 0.20 0.09 0.08
Permeability (md) 75 122 137 35
SV (MPa) 61.4 53.4 67.4 51.5
SHMIN (MPa) 47.9 36.1 44.6 36.0
Original Formation Pressure (kPa) 27,000 17,762 24,680 20,244
Formation Temperature (°C) 100 69 103 70
Reservoir Volume (1000 m3) 569.3 107 306.9 320
TDS Calculated (mg/L) 152,813 115,000 125,000 86,382
Na (mg/L) 41,530 ND ND 25,180
Ca (mg/L) 9,830 ND ND 4,324
HCO3 (mg/L) 481 ND ND 351
Injected Gas - CO2 (mole fraction) 0.15 0.65 0.45 0.7919
Injected Gas - H2S (mole fraction) 0.75 0.35 0.55 0.1997
Maximun Approved WHIP (kPa) 12,000 10,500 10,500 13,000
Maximum Approved Injection Rate (1000 m3/d) 30 16 28 34
Total Approved Injection Volume (106 m
3) 63,000 38,000 109,000 124,100
Life Time (years) 15 10
EPZ (km) 5.30 2.40 6.20
Fo
rmati
on
Wate
rL
icen
sed
In
jecti
on
Op
era
tio
ns
Inje
cti
on
Op
era
tio
ns
Reserv
oir
Geo
log
yR
ock P
rop
ert
ies
Reserv
oir
Pro
pert
ies
Table 5. Characteristics of the acid-gas injection operations in the Wabamun Group in the Pembina area (status at the end of 2002).
ERCB/AGS Special Report 093 (March 2008) 45

6 Discussion
Based on the hydrogeological analysis of the injection sites at local, regional and basin scales presented in the preceding chapters, the potential for acid gas migration and/or leakage from the Wabamun aquifer in the Pembina area can be qualitatively assessed. Migration is defined here as flow along bedding within the same formation (aquifer), and leakage is defined as upward flow to overlying formations and possibly to the surface. Both will be considered in the context of the natural hydrogeological setting and of man-made features, such as wells and induced fractures.
6.1 Acid Gas Migration
The injected gas will migrate upwards from well perforations towards the top of the Wabamun aquifer because the acid gas is lighter than the formation water, and it will accumulate as a plume at the top of the aquifer. Since the flow of formation water in the Wabamun aquifer is extremely slow, almost stagnant, the hydrodynamic drive for acid gas migration is negligible, and the flow of the injected acid gas will be driven by buoyancy updip to the northwest. Acid gas cannot migrate into overlying Mississippian aquifers because of the overlying confining shales of the Exshaw and Banff formations.
The specific discharge, q, (or Darcy velocity) of the flow of acid gas in a sloping aquifer can be written with respect to a reference density 0� as (Bachu, 1995):
�
� �
�
���� EH
gkq
g 00
0
��
��
where k is permeability, g is the gravitational constant, g� is gas viscosity, �� is the density
difference between the acid gas and the reference density, 0H is the hydrodynamic drive, and E is the slope of the aquifer. If the reference density is the density of formation water in the
Wabamun aquifer ( 0� =1050 kg/m3), then 0H becomes the hydrodynamic drive of the flow of formation water in the Wabamun aquifer, which is negligible (quasi stagnant flow). In this case, the above relation becomes:
Egk
qg
gb �
���� )(
where b� and g� are the densities of the brine and acid gas, respectively. The density and viscosity of the acid gas at in situ conditions in the Wabamun Group in the Pembina area are estimated to be approximately 600 kg/m3 and 0.054 MPa�s, respectively. An order-of-magnitude analysis shows that, once outside the cone of influence created around the injection well by the bottom-hole injection pressure, the Darcy velocity of the updip migrating acid gas is on the order of 0.1 to 1 m per year, depending on permeability. This means that it will take an extremely long time, on the order of tens to hundreds of thousand of years, for the acid gas to migrate updip in the Wabamun aquifer and reach the subcrop region at the sub-Cretaceous unconformity (Figures
ERCB/AGS Special Report 093 (March 2008) 46

5, 10 and 12). The migration direction will be to the northeast. There the acid gas will meet the
northward basin-scale flow system driven by topography from northern Montana to northeastern
Alberta (Figure 6a) (Bachu, 1999; Anfort et al., 2001).
If the acid gas reaches the subcrop area at the pre-Cretaceous unconformity, it will migrate
upward into the Lower Mannville aquifer, and then it will flow to the north-northeast, unless
caught in stratigraphic and/or structural traps. The flow will be the resultant of updip,
northeastward buoyancy and draining to the north-northwest by the Grosmont drain that controls
the flow of formation water in Upper Devonian and Lower Mannville strata in northeastern
Alberta (Bachu, 1999; Barson et al., 2001).
In the absence of numerical modeling, the time scale of the flow process along the path described
previously can be only estimated to be of the order of thousands to millions of years. It is highly
improbable that such a flow path would be ever completed, because the amount of acid gas that
will be injected during the lifetime of the operation will be much smaller than the volume traps
that would be encountered along the path. Also, the acid gas will disperse and dissolve in
formation water, such that an acid gas plume would disappear along a basin-scale flow path
(McPherson & Cole, 2000). Most likely the injected acid gas will be contained within the
Wabamun Group if the injection operations are run within the terms of the respective applications
and approvals.
6.2 Acid Gas Leakage
Upward leakage of the acid gas may occur through weak aquitards and natural faults and/or
fractures, and through induced fractures and/or improperly completed and/or abandoned wells.
There are no known faults and fractures in the Pembina area. Leakage through the overlying
aquitards is very unlikely, practically impossible to happen, because the Wabamun Group is
capped by the thick, tight and competent shales of the Exshaw and Banff formations, which have
been shown in many regional-scale studies to separate the flow systems in Devonian and
Mississippian aquifers (e.g., Bachu, 1995; Rostron & Toth, 1997; Michael & Bachu, 2002b;
Michael et al., 2003). Continuing higher up in the sedimentary succession, the Jurassic Fernie
aquitard isolates the Mississippian aquifers from Jurassic and Lower Cretaceous (Lower
Mannville) aquifers (Figure 4). Further up, the thick Colorado shales and embedded sandy
aquifers form, respectively, a physical barrier and a hydrodynamic barrier as a result of erosional
rebound in shales (Bachu, 1999; Michael & Bachu, 2002a). These aquifers behave like sinks for
any contained or passing fluids. Similar physical barriers (shaly aquitards) and hydrodynamic
barriers (hydraulic sinks) are encountered in the overlying Upper Cretaceous strata of the Belly
River and Edmonton groups (Figure 4) (Bachu & Michael, 2003). The barriers to vertical leakage
of the acid gas in the natural system exist not only at the site and local scales in the Pembina area,
but also at the regional and even basin scales.
Leakage of the injected acid gas through fractures induced in the caprock as a result of injection
into the Wabamun Group would be possible if the caprock is fractured or weakened by
geomechanical and/or geochemical processes. However, even if the immediate caprock layer may
have been weakened, the large thickness of the shaly Exshaw and Banff formations (Figure 18)
ensures that no leakage through this aquitard will occur. Further leakage higher up is very
unlikely to happen because of the overlying succession of aquitards and hydrodynamic sinks
described in the preceding paragraph.
While leakage of acid gas through the natural system is very unlikely to happen, leakage through
wells is a very distinct possibility, now or in the future. Figure 26 shows the current distribution
ERCB/AGS Special Report 093 (March 2008) 47

5�$0����)
(����� (����� (����� (���� (���F (���8 (������7
�1=��7�
�1=��7�
�1=����
�1=���F
�1=���8
�1=����
�1=���7
� �� ���#���$��!�%
� 7 ���$���%)�I�����������
�������������� ������������� ����������������� ����������������� �������in the local-scale study area.�
5�$0����))
5�$0������!��!��#
5�$0����'�!������
�����=����!�����������=��<�������0�$���A!��=
ERCB/AGS Special Report 093 (March 2008) 48

of wells that penetrate the Wabamun Group in the local-scale study area. The density of wells that
penetrate the top of the Wabamun Group is quite high along the updip migration path from the
Pembina I and Pembina II acid-gas injection wells, and much less updip from the Pembina
Burlington well. The quality of completion and/or abandonment for these wells is not well known
at present, and is beyond the scope of this study. Notwithstanding that it may never be known,
even in the best-scenario case that the cement and tubing quality are good at present in every
well, they will most probably degrade at some point in the future as a result of reactions with
formation brine and/or acid gas. Primarily the well cements, but also the steel tubing, will
ultimately degrade, potentially creating flow pathways. The leakage may not necessarily occur all
along the well up to the surface as leaking acid gas may stop at more competent cements in the
well and at plugs.
Poor-quality completion in existing or future wells may provide a pathway for upward leakage
from the injection reservoir or from any place that an acid gas plume may reach in the future.
However, time scale and magnitude of the degradation cannot be assessed with the current data,
knowledge and methods.
7 Conclusions
The experience gained since the start of the first acid-gas injection operation in Canada in 1989
shows that, from an engineering point of view, acid gas disposal is a well-established technology.
Close to 1.5 Mt CO2 and 1 Mt H2S have been successfully injected to date into deep hydrocarbon
reservoirs and saline aquifers in Alberta and British Columbia. A major issue that has not been
addressed is the containment and long-term fate of the injected acid gas. Although no incidents of
long-range migration or leakage have been detected and reported to date, this issue should be
considered by both operators and regulatory agencies.
Injection of acid gas into the Wabamun Group in the Pembina area of west-central Alberta is
taking place since 1994. To date, close to 40 million m3, or 60 kt acid gas have been injected into
this aquifer.
If only the natural setting is considered, including geology and flow of formation waters, the
basin- to local-scale hydrogeological analysis indicates that injecting acid gas into the Wabamun
Group in the Pembina area is basically a safe operation with no potential for acid gas migration to
shallower strata, potable groundwater and the surface. Although the Wabamun Group is
characterized as a regional aquifer, the average permeability in the Pembina area is relatively low,
and intervals of high porosity and permeability occur only locally and are not well connected.
There are many physical and hydrodynamic barriers to acid gas migration from the injection zone
into other strata, and the flow process, if it will ever happen, would take an extremely long time,
on a geological time scale. Any acid gas plume would disperse and dissolve in formation water
during flow on such large time and spatial scales.
Based on available data, it seems that there is no potential for acid gas leakage through fractures.
However, the possibility for upward leakage of acid gas exists along wells that were improperly
completed and/or abandoned, or along wells whose cement and/or tubing has degraded or may
degrade in the future as a result of chemical reactions with formation brine and/or acid gas.
These conclusions are based on a qualitative hydrogeological analysis in the sense that the
geological and hydrogeological data were interpreted within the framework of the most current
knowledge about the Alberta basin and its contained fluids. No quantitative analysis based on
ERCB/AGS Special Report 093 (March 2008) 49

numerical modeling was performed because, to the best knowledge of the authors, no such
models are available. Predictive numerical models of acid gas injection and flow, if not already in
existence, should be developed and used to validate the qualitative hydrogeological analysis
presented in this report. Geochemical and geomechanical effects on reservoir rock and caprock
should be assessed to confirm integrity. The potential for, and risk of, leakage through existing
wells should be better assessed. In addition, a monitoring program would support and provide
feedback to the analysis and modeling, and greatly enhance the confidence in the safety of the
operation.
Extension of this type of analysis to other current and future disposal sites will lower risk and
increase the public trust in the potential and safety of geological sequestration of acid and
greenhouse gases. Ideally, a thorough program for predicting the long-term fate of the injected
acid gas should contain the following major components:
- a hydrogeological analysis of the injection site at various scales, from site-specific to
regional, to provide the context, understanding and necessary data for a qualitative
assessment;
- numerical modeling for predicting possible migration and/or leakage paths and
corresponding time scales for the injected acid gas;
- monitoring of the acid gas plume, to validate and update the numerical model;
- continuous updating of the hydrogeological and numerical models as new data is
acquired.
Currently there are no adequate numerical models that could properly simulate the fate of the acid
gas injected in deep geological formations. Also, monitoring programs are expensive, and, in the
absence of forward-simulating models, may not provide the necessary information. However, the
hydrogeological analysis, the first step for understanding the fate of the acid gas, can be easily
implemented for all acid-gas injection sites, particularly in the case of basins with a wealth of
data such as the Alberta Basin.
ERCB/AGS Special Report 093 (March 2008) 50

8 References
Adams, J.J., & Bachu, S. 2002. Equations of state for basin geofluids: algorithm review and inter-
comparison for brines. Geofluids, 2, 257-271.
AEUB (Alberta Energy and Utilities Board) 2000. Guide 65: Resources Applications for Conventional & Gas Reservoirs. Alberta Energy and Utilities Board, Calgary, AB, 113-
136. DOI eub.gov.ab.ca/bbs/products/guides/g65.pdf.
Allen, T.O. and Roberts, A.P. (1982): Production Operations. Oil & Gas Consultants
International, Inc., Tulsa, OK., 162 p.
Anfort, S.J., Bachu, S., & Bentley, L.R. 2001. Regional-scale hydrogeology of the Upper
Devonian-Lower Cretaceous sedimentary succession, south-central Alberta basin,
Canada. American Association of Petroleum Geologists Bulletin, 85, 637-660.
Bachu, S. 1995. Synthesis and model of formation water flow in the Alberta basin, Canada.
American Association of Petroleum Geologists Bulletin, 79, 1159-1178.
Bachu, S. 1999. Flow systems in the Alberta Basin: Patterns, types and driving mechanisms.
Bulletin of Canadian Petroleum Geology, 47, 455-474.
Bachu, S. & Hitchon, B. 1996. Regional-scale flow of formation waters in the Williston basin.
American Association of Petroleum Geologists Bulletin, 80, 248-264.
Bachu, S. & Michael, K. 2003. Hydrogeology and stress regime of the Upper Cretaceous-Tertiary
coal-bearing strata in the Alberta basin: toward coalbed methane producibility. American Association of Petroleum Geologists Bulletin, In press.
Bachu, S. & Underschultz, J.R.1993. Hydrogeology of formation waters, northeastern Alberta
basin. American Association of Petroleum Geologists Bulletin, 77, 1745-1768.
Bachu, S. &. Underschultz, J.R.1995. Large-scale erosional underpressuring in the Mississippian-
Cretaceous succession, southwestern Alberta basin. American Association of Petroleum Geologists Bulletin, 79, 989-1004.
Bachu, S., Buschkuehle, B.E. & Michael, K. 2003. Subsurface characterization of the Brazeau
Nisku Q Pool reservoir for acid gas injection. Alberta Geological Survey Report, 58 p.
Bachu, S., Michael, K. & Buschkuehle, B.E. 2002. The relation between stratigraphic elements,
pressure regime, and hydrocarbons in the Alberta deep basin (with emphasis on select
Mesozoic units): Discussion. American Association of Petroleum Geologists Bulletin, 86,
525-528.
Bachu, S. & Michael, K., 2002. Flow of variable-density formation water in deep sloping
aquifers: minimizing the error in representation and analysis when using hydraulic-head
distributions. Journal of Hydrology, 259, 49-65.
Barson, D., Bachu, S. & Esslinger, P. 2001. Flow systems in the Mannville Group in the south
Athabasca area: implications for steam-assisted gravity drainage (SAGD) operations for
in-situ bitumen production. Bulletin of Canadian Petroleum Geology, 49, 376–392.
Batzle, M. & Wang, Z. 1992. Seismic properties of pore fluids. Geophysics, 57, 1396-1408.
Bell, J. S. 2003. Practical methods for estimating in-situ stresses for borehole stability
applications in sedimentary basins. Journal of Petroleum Science and Engineering, 38:3-
4, 111-119.
Bell, S. J. & Babcock, E. A., 1986. The stress regime of the Western Canada Sedimentary Basin
and implications for hydrocarbon production. Bulletin of Canadian Petroleum Geology,
34, 364-378.
Bell, S. J. & Bachu, S., 2003. In situ stress magnitude and orientation estimates for Cretaceous
coal-bearing strata beneath the plains area of central and southern Alberta. Bulletin of Canadian Petroleum Geology, 51, 1-28.
Bell, S. J., Price, P. R. & McLellan, P. J., 1994. In-situ stress in the Western Canada Sedimentary
Basin. In: Geological Atlas of the Western Canada Sedimentary Basin (Mossop, G.D. &
ERCB/AGS Special Report 093 (March 2008) 51

Shetsen, I., comp.). Canadian Society of Petroleum Geologists and Alberta Research
Council, Calgary, 439-446.
Bennion, D.B., Thomas, F.B., Bennion, D.W. & Bietz, R.F. 1996. Formation screening to
minimize permeability impairment associated with acid gas or sour gas
injection/disposal. CIM Paper 96-93 Presented at the 47th Annual Technical Meeting of the CIM Petroleum Society, Calgary, AB, June 10-12, 1996.
Burrowes, O.G. & Krause, F.F. 1987. Overview of the Devonian System: Subsurface Western
Canada Basin. In: Devonian lithofacies and reservoir styles in Alberta, (Krause, F.F. &
Burrowes, O. G., eds.) 2nd International Symposium of the Devonian System, 13th CSPG
Core Conference, D. 1-52.
Buschkuehle, B.E. & Machel, H.G., 2002, Diagenesis and paleofluid flow in the Devonian
Southesk-Cairn carbonate complex in Alberta, Canada. Marine and Petroleum Geology,
19, 219-227.
Bustin, R.M. 1991. Organic maturation of the Western Canadian sedimentary basin. International Journal of Coal Geology, 19, 319-358.
Campbell, J. D. 1979. Major cleat trends in Alberta Plains coals. Canadian Institute of Mining
Bulletin, 72, 69-75.
Carroll, J. J. 1998a. Phase diagrams reveal acid-gas injection subtleties. Oil & Gas Journal, 96:9,
92-96.
Carroll, J. J. 1998b. Acid-gas injection encounters diverse H2S, water phase changes. Oil & Gas Journal, 96:10, 57-59.
Carroll, J. J. & Lui, D. W. 1997. Density, phase behavior keys to acid gas injection. Oil & Gas Journal, 95:25, 63-72.
Chalaturnyk, R.J. 1996. Geomechanics of the Steam Assisted Gravity Drainage Process in Heavy
Oil Reservoirs, Ph. D. Dissertation, Department of Civil Engineering, University of
Alberta, Edmonton, Alberta.
Dagan, G. 1989. Flow and Transport in Porous Formations. Springer-Verlag, New York, 465p.
Davison, R. J., Mayder, A., Hladiuk, D. W. & Jarrell, J. 1999. Zama acid gas disposal/miscible
flood implementation and results. Journal of Canadian Petroleum Technology, 38:2, 45-
54.
Deming, D. & Nunn, J.A. 1991. Numerical simulations of brine migration by topographically
driven recharge. Journal of Geophysical Research, 96:B2, 2485-2499.
Desbarats, A. J. & Bachu, S. 1994. Geostatistical analysis of aquifer heterogeneity from the core
scale to the basin scale: A case study. Water Resources Research, 30:3, 673-684.
Grasby, S. & Hutcheon, I. 2001. Controls on the distribution of thermal springs in the southern
Canadian Cordillera. Canadian Journal of Earth Sciences, 38:3, 427-440.
Gunter, W. D., Perkins, E. H. & Hutcheon, I. 2000. Aquifer disposal of acid gases: modeling of
water-rock reactions for trapping acid wastes. Applied Geochemistry, 15, 1085-1095.
Haas, C. J., 1989. Static stress-strain relationships. In: Physical properties of rocks and minerals
(Touloukian, Y. S., Judd, W. R. & Roy, R. F., eds.), Hemisphere Publishing Corporation,
New York, 123-176.
Halbertsma, H.L. 1994. Devonian Wabamun Group of the Western Canada Sedimentary Basin. In: Geological Atlas of the Western Canada Sedimentary Basin (Mossop, G.D. &
Shetsen, I., comp.). Canadian Society of Petroleum Geologists and Alberta Research
Council, Calgary, 203-220.
Hearn, M.R. & Rostron, B.J. 1997. Hydrogeologic, stratigraphic, and diagenetic controls on
petroleum entrapment in Devonian reefs, Bashaw area, Alberta. Core Conference Proceedings, CSPG-SEPM Joint Convention, June 1997, Calgary, AB, 89-101.
Hitchon, B. 1996. Rapid evaluation of the hydrochemistry of a sedimentary basin using only
“standard” formation water analyses: example from the Canadian portion of the Williston
Basin. Applied Geochemistry, 11, 789–795.
ERCB/AGS Special Report 093 (March 2008) 52
Hitchon, B. 1969a. Fluid flow in the Western Canada sedimentary basin. 1. Effect of topography.
Water Resources Research, 5, 186-195.
Hitchon, B. 1969b. Fluid flow in the Western Canada sedimentary basin. 2. Effect of geology.
Water Resources Research, 5, 460-469.
Hitchon, B. & Brulotte, M. 1994. Culling criteria for “standard” formation water analyses:
Applied Geochemistry, v. 9, p. 637–645.
Hitchon, B., Bachu, S. & Underschultz, J.R. 1990. Regional subsurface hydrogeology, Peace
River arch area, Alberta and British Columbia. Bulletin of Canadian Petroleum Geology,
38A, 196-217.
Hitchon, B., Perkins, E. H. & Gunter, W. D. 2001. Recovery of trace metals in formation waters
using acid gases from natural gas. Applied Geochemistry, 16, 1481-1497.
Jumikis, A.R. (1983): Rock Mechanics (2nd Edition); Trans Tech Publications, Rockport, MA.,
613 p.
Keushnig, H. 1995. Hydrogen sulphide – if you don’t like it, put it back. Journal of Canadian Petroleum Technology, 34:6, 18-20.
Lambe, T.W. and Whitman, R.V. (1979): Soil Mechanics, SI version. John Wiley & Sons
Inc., New York, New York, 553 p.
Lock, B. W. 1997. Acid gas disposal – A field perspective. In: Proceedings of the Seventy-Sixth Gas Processors Association Annual Convention, San Antonio, TX, March 10-12, 1999,
Tulsa, OK, 161-170.
Longworth, H. L., Dunn, G. C. & Semchuk, M. 1996. Underground disposal of acid gas in
Alberta, Canada: regulatory concerns and case histories. SPE Paper 35584, In: Proceedings of the Gas Technology Symposium, Calgary, AB, Canada, 28 April – 1 May
1996, SPE, 181-192.
MacDonald, D.E., 1987. Geology and resource potential of phosphates in Alberta. Alberta
Geological Survey, Alberta Research Council, Earth Sciences Report 87-2, 65 p.
Machel, H.G., Cavell, P.A. & Patey, K.S. 1996. Isotopic evidence for carbonate cementation and
recrystallization, and for tectonic expulsion of fluids into the Western Canada
sedimentary basin. Geological Society of America Bulletin, 108, 1108-1119.
Macqueen, R.W. & Sandberg, C.A., 1970. Stratigraphy, age and inter-regional correlation of the
Exshaw Formation, Alberta Rocky Mountains. Bulletin of Canadian Petroleum Geology,
v. 18, 32-66.
Masters, J.A. (ed.), 1984. Elmworth: case study of a deep basin gas field. American Association of Petroleum Geologists Memoir 38, Tulsa, OK, 316 p.
McPherson, B.J.O.L. & Cole, B.S. 2000. Multiphase CO2 flow, transport and sequestration in the
Powder River basin, Wyoming, USA. Journal of Geochemical Exploration, 69-70, 65-69.
Michael, K. & Bachu, S. 2002a. Fluids and pressure distributions in the foreland-basin succession
in the west-central part of the Alberta basin, Canada: evidence for permeability barriers
and hydrocarbon generation and migration. American Association of Petroleum Geologists Bulletin, 85, 1231-1252.
Michael, K. & Bachu, S. 2002b. Origin, chemistry and flow of formation waters in the
Mississippian – Jurassic sedimentary succession in the west – central part of the Alberta
Basin, Canada. Marine and Petroleum Geology, 19, 289-306.
Michael, K., Machel, H.G. & Bachu, S. 2003. New insights into the origin and migration of
brines in deep Devonian aquifers, Alberta, Canada. Journal of Geochemical Exploration,
80:2-3, 193-219.
Miller, S.L.M. and Stewart, R.R., 1990. Effects of lithology, porosity, and shaliness on P- and S-
wave velocities from sonic logs, Canadian Journal of Exploration Geophysics, 26, 94-
103.
ERCB/AGS Special Report 093 (March 2008) 53

Mossop, G.D. & Shetsen, I. (comp.) 1994. Geological Atlas of the Western Canada Sedimentary Basin. Canadian Society of Petroleum Geologists and Alberta Research Council, Calgary,
510 p.
Nesbitt, B.E. & Muechlenbachs, K. 1993. Synorogenic fluids of the Rockies and their impact on
paleohydrogeology and resources of the Western Canada sedimentary basin. In: Alberta Basement Transect Workshop (G.M. Ross, ed.), LITHOPROBE Report 31,
LITHOPROBE Secretariat, University of British Columbia, 60-62.
Ng, H-J., Carroll J. J. & Maddocks, J. R. 1999. Impact of thermophysical properties research on
acid-gas injection process design. In: Proceedings of the Seventy-Eighth Gas Processors Association Annual Convention, Nashville, TN, March 1-3, 1999, Tulsa, OK, 114-120.
Nurkowski, J.R. 1984. Coal quality, coal rank variation and its relation to reconstructed
overburden, Upper Cretaceous and Tertiary plains coals, Alberta, Canada. American Association of Petroleum Geologists Bulletin, 68, 285-295.
Parks, K.P. & Toth, J. 1993. Field evidence for erosion-induced underpressuring in Upper
Cretaceous and Tertiary strata, west central Alberta, Canada. Bulletin of Canadian Petroleum Geology, 43, 281-292.
Porter, I.W., Price, R.A., & McCrossan, R.G. 1982. The Western Canada sedimentary basin.
Philosophical Transactions of Royal Society of London, Series A, 305, 169-182.
Richards, B.C. & Higgins, A.C., 1988. Devonian-Carboniferous boundary beds of the Palliser and
Exshaw formations at Jura Creek, Rocky Mountains, southwestern Alberta. In: Devonian
of the World; McMillan, N.J., Embry, A.F. and Glass, D.J. (Eds.). Canadian Society of
Petroleum Geologists, Memoir 14, v. 2, p. 399-412.
Ricketts, B.D. (ed.) 1989. Western Canada sedimentary basin – a case history. Canadian Society
of Petroleum Geologists, Calgary, 320 p.
Rostron, B.J., and Toth, J. 1996. Ascending fluid plumes above Devonian pinnacle reefs:
numerical modeling and field example from west-central Alberta, Canada. In:
Hydrocarbon Migration and its Near-Surface Expression (Schumacher, D. & Abrams,
M.A., eds.). American Association of Petroleum Geologists Memoir 66, Tulsa, OK, 185-
201.
Rostron, B.J., and Toth, J. 1997. Cross-formational fluid flow and the generation of a saline
plume of formation waters in the Mannville Group, west-central Alberta. In: Petroleum Geology of the Cretaceous Mannville Group (Pemberton, S.G. & James, D.P., eds.).
Canadian Society of Petroleum Geologists Memoir 18, Calgary, 169-190.
Spencer, R.J., 1987. Origin of Ca-Cl brines in Devonian formations, Western Canada
Sedimentary Basin. Applied Geochemistry, 2, 373-384.
Stoakes, F.A. 1992. Winterburn megasequence. In: Devonian-Early Mississippian carbonates of
the Western Canada Sedimentary Basin: a sequence-stratigraphic framework (Wendte,
J.C., Stoakes F.A. & Campbell, C.V., eds.). Society for Sedimentary Geology, Short
Course No. 28, p. 207-224.
Toth, J. 1978. Gravity-induced cross-formational flow of formation fluids, Red Earth region,
Alberta, Canada: analysis, patterns, and evolution. Water Resources Research, 14, 805-
843.
Toth, J. & Corbet, T. 1986. Post-Paleocene evolution of regional groundwater flow-systems and
their relation to petroleum accumulations, Taber area, southern Alberta, Canada. Bulletin of Canadian Petroleum Geology, 34, 339-363.
Watts, N.R., 1987. Carbonate sedimentology and depositional history of the Nisku Formation in
south-central Alberta. In: Devonian lithofacies and reservoir styles in Alberta, (Krause,
F.F. & Burrowes, O. G., eds.) 2nd International Symposium of the Devonian System, 13th
CSPG Core Conference, D. 87-152.
Whatley, L. 2000. Acid-gas injection proves economic for west-Texas plant. Oil & Gas Journal, 98:21, 58-61.
ERCB/AGS Special Report 093 (March 2008) 54

Wichert, E. & Royan, T. 1996. Sulfur disposal by acid gas injection. SPE Paper 35585, In: Proceedings of the Gas Technology Symposium, Calgary, AB, Canada, 28 April – 1 May
1996, SPE, 193-200.
Wichert, E. & Royan, T. 1997. Acid gas injection eliminates sulfur recovery expense. Oil & Gas Journal, 95:17, 67-72.
Wilkinson, P.K. 1995. Is fluid flow in Paleozoic formations of west-central Alberta affected by the Rocky Mountain thrust belt? Unpublished M.Sc. Thesis, University of Alberta,
Edmonton, 102 p.
ERCB/AGS Special Report 093 (March 2008) 55