subsistence and small commercial farmer report · pdf filesapa subsistence and small...
TRANSCRIPT

SAPA Subsistence and Small Commercial Farmer Report 3Q2016
- 1 -
The South African Poultry Association
SUBSISTENCE AND SMALL COMMERCIAL FARMER REPORT FOR THE THIRD QUARTER OF 2016 (3Q2016)
INTRODUCTION Collection of statistics: The data presented in this report is obtained from the analysis of the small-scale farmer survey results from July to September 2016. These farmers are largely former DPFO members who have been absorbed into the Egg and Broiler Organisations, following the restructuring at SAPA. Note: Unless otherwise stated, all prices exclude VAT. SAPA’s new membership representation and size definitions are as follows:
Subsistence Farmers Small Commercial Farmers Large Commercial Farmers
Broilers Less than 1 500 per cycle 1 500 - 40 000 per cycle More than 40 000 per cycle
Eggs 1 - 499 hens 500 - 50 000 hens More than 50 000 hens
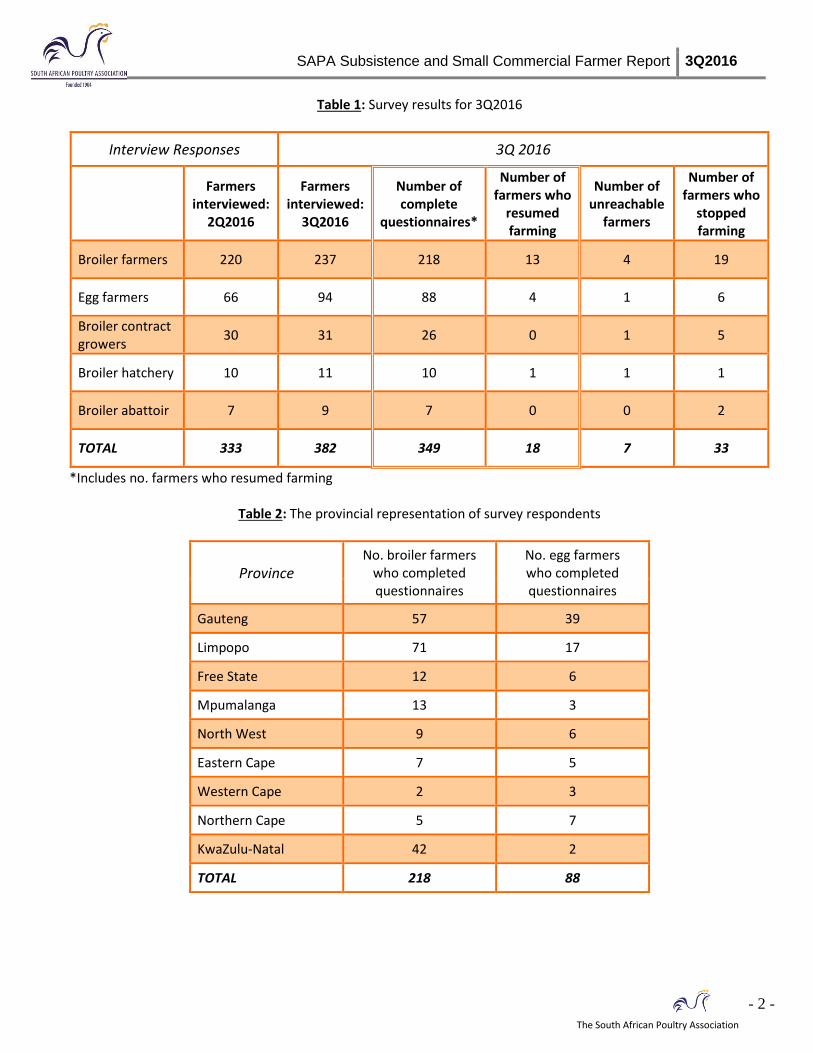
SUMMARY OF INTERVIEWS DONE Table 1 summarises the survey results. In total 382 farmers were interviewed, which includes those who reported to have resumed or stopped farming, and those who completed the questionnaire, but it excludes unreachable farmers. The number of farmers who have resumed farming is included in the number of complete questionnaires, as shown in the table below. This report had 49 interviews more (+14.7%) than the previous quarter. Some of the reasons given for stopping farming were:
Needing financial assistance to expand or renovate;
No place to farm;
Not realising any profit;
Needing further training;
Problems with water and electricity, transport and medication;
Poor production and high mortality due to the cold weather, some only farm in the warmer months;
Battling with their location, it is not in close proximity to an abattoir;
Finding the abattoir too expensive;
Difficulties sourcing good quality chicks and feed;
Vandalism and non-payment of accounts by buyers;
Problems marketing their products and bigger producers in the area with lower prices; and
The high cost of feed and point-of lay pullets.
The surveys were conducted amongst producers from all provinces (Table 2), with the largest proportion concentrated in Gauteng (31.4%), Limpopo (28.8%) and KwaZulu-Natal (14.4%). Figure 1 is a map showing the distribution of the survey respondents for the third quarter.
SAPA Subsistence and Small Commercial Farmer Report 3Q2016
- 2 -
The South African Poultry Association
Table 1: Survey results for 3Q2016
Interview Responses 3Q 2016
Farmers
interviewed: 2Q2016
Farmers interviewed:
3Q2016
Number of complete
questionnaires*
Number of farmers who
resumed farming
Number of unreachable
farmers
Number of farmers who
stopped farming
Broiler farmers 220 237 218 13 4 19
Egg farmers 66 94 88 4 1 6
Broiler contract growers
30 31 26 0 1 5
Broiler hatchery 10 11 10 1 1 1
Broiler abattoir 7 9 7 0 0 2
TOTAL 333 382 349 18 7 33
*Includes no. farmers who resumed farming
Table 2: The provincial representation of survey respondents
Province
No. broiler farmers who completed questionnaires
No. egg farmers who completed questionnaires
Gauteng 57 39
Limpopo 71 17
Free State 12 6
Mpumalanga 13 3
North West 9 6
Eastern Cape 7 5
Western Cape 2 3
Northern Cape 5 7
KwaZulu-Natal 42 2
TOTAL 218 88

SAPA Subsistence and Small Commercial Farmer Report 3Q2016
- 3 -
The South African Poultry Association
Figure 1: Distribution of survey respondents in South Africa
1. Hatcheries
There were nine hatchery respondents. Six hatcheries are owned or managed by women, and three by men. Three of the hatcheries are located in Limpopo, three in Gauteng, and one each in the Free State, Eastern Cape and KwaZulu-Natal, as shown in Figure 2. Some farms are situated in very close proximity and are therefore represented by only one red dot on the map. Eight hatcheries produce their own fertile hatching eggs from breeding stock. In total 234 206 fertile eggs were produced for incubation in the quarter, i.e. an average of 29 276 per respondent. One hatchery produces their own fertile eggs as well as buying in eggs, thus two hatcheries bought in from undisclosed breeders at a weighted average cost of R3.04 per egg. In total 393 120 eggs were purchased during the quarter. Five hatcheries are producing day-old broiler chicks and four are hatching day-old pullets. The total number of broiler chicks sold for the quarter was 306 925 at an average selling price of R6.19 per chick, and a weighted average selling price of R5.98 per chick. The total number of day-old pullets sold was 5 389 at an average selling price of R5.73 per chick,
Distribution of Number of Farms Interviewed in the Survey
Gauteng: Layers: 39 Broilers: 57 Total: 96
Mpumalanga: Layers: 3 Broilers: 13 Total: 16
North West: Layers: 6 Broilers: 9 Total: 15
Free State: Layers: 6 Broilers: 12 Total: 18
Western Cape: Layers: 3 Broilers: 2 Total: 5
Eastern Cape: Layers: 5 Broilers: 7 Total: 12
KwaZulu-Natal: Layers: 2 Broilers: 42 Total: 44
Limpopo: Layers: 17 Broilers: 71 Total: 88
Survey period: Jul 2016 to Sep 2016 Contract growers not represented on this map
Northern Cape: Layers: 7
Broilers: 5
Total: 12

SAPA Subsistence and Small Commercial Farmer Report 3Q2016
- 4 -
The South African Poultry Association
and a weighted average selling price of R5.32 per chick. The hatcheries selling day-old pullets have battled to find a market and have thus been forced to sell their stock below market value. The day-old chicks and pullets were sold to a co-op and local emerging broiler and egg farmers. The total value of the broiler chick sales was R1 835 779 and the pullets, R28 691.
Figure 2: Location of hatcheries surveyed
BROILER FARMERS
2. Broiler Producers Of the 218 broiler farm owners, 127 are women and 91 are men. Day-old chicks: The average purchase price of a day-old chick in 3Q2016 was R6.70. In total 222 575 chicks were placed per cycle on broiler farms during 3Q; an average of 1 021 per farmer. The total number of birds on the farms at the time of the questionnaire was 249 299; an average of 1 144 per farm. These birds are grown in 710 houses which equates to an average of three houses per farm. The total capacity of the broiler farms is 785 112 birds. Because 249 299 birds were on farm, only 31.8% of the capacity was used. This has decreased from 51.2% in 2Q2016. Although members should attempt to use their available facilities

SAPA Subsistence and Small Commercial Farmer Report 3Q2016
- 5 -
The South African Poultry Association
more effectively, thereby increasing their output and turnover; large commercial broiler farms are also having to implement cutbacks as costs and demand for market share are too high. The average mortality rate was 8.1%, which is higher than the standard mortality rate of 4.4% to 42 days of age.
Figure 3: Location of broiler farms surveyed
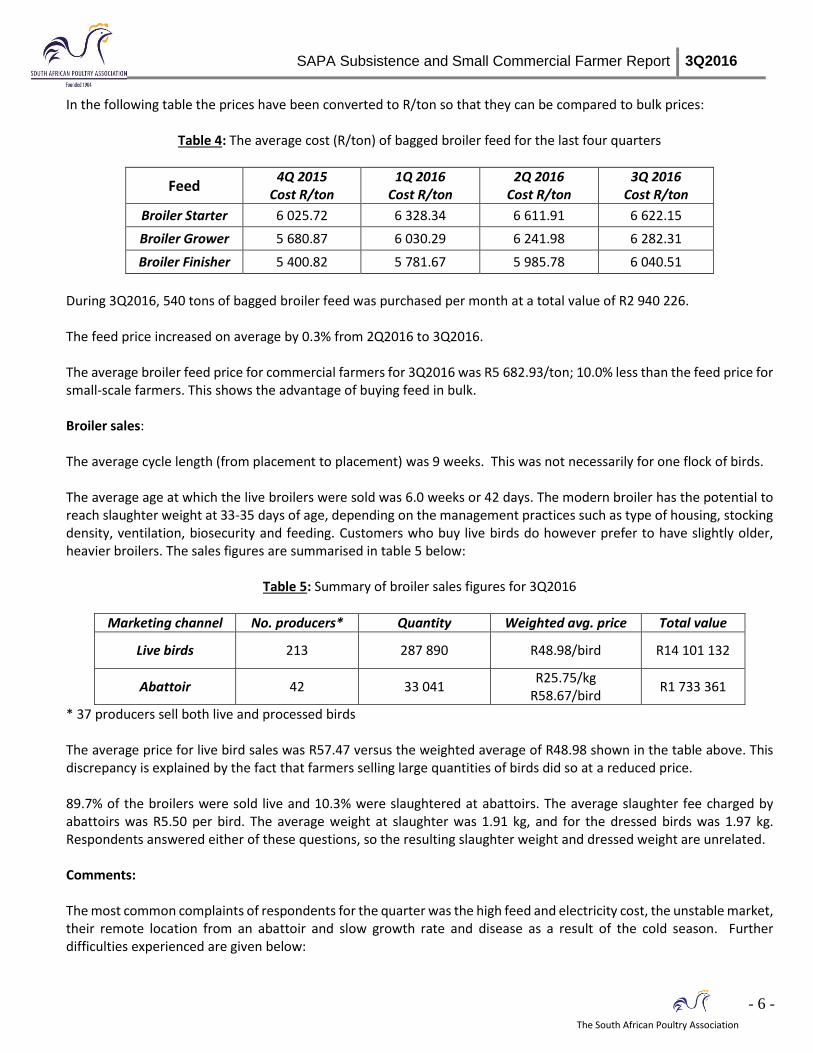
Broiler feed: During 3Q2016, 98.2% of respondents purchased feed in bags, 1.4% purchased feed in bulk and one respondent, or 0.4%, manufactured their own feed. The tables below summarise the average cost of bagged broiler feed for the last four quarters. Some farmers purchase feed in 40kg bags, but for the comparison, those prices are converted to 50kg bags. Prices exclude VAT and transport.
Table 3: The average cost (R/50kg bag) of broiler feed for the last four quarters
Feed 4Q 2015
Cost R/bag 1Q 2016
Cost R/bag 2Q 2016
Cost R/bag 3Q 2016
Cost R/bag
Broiler Starter 295.20 316.42 330.60 331.11
Broiler Grower 278.16 301.51 312.10 314.12
Broiler Finisher 264.94 289.08 299.29 302.03
SAPA Subsistence and Small Commercial Farmer Report 3Q2016
- 6 -
The South African Poultry Association
In the following table the prices have been converted to R/ton so that they can be compared to bulk prices:
Table 4: The average cost (R/ton) of bagged broiler feed for the last four quarters
Feed 4Q 2015
Cost R/ton 1Q 2016
Cost R/ton 2Q 2016
Cost R/ton 3Q 2016
Cost R/ton
Broiler Starter 6 025.72 6 328.34 6 611.91 6 622.15
Broiler Grower 5 680.87 6 030.29 6 241.98 6 282.31
Broiler Finisher 5 400.82 5 781.67 5 985.78 6 040.51
During 3Q2016, 540 tons of bagged broiler feed was purchased per month at a total value of R2 940 226. The feed price increased on average by 0.3% from 2Q2016 to 3Q2016. The average broiler feed price for commercial farmers for 3Q2016 was R5 682.93/ton; 10.0% less than the feed price for small-scale farmers. This shows the advantage of buying feed in bulk. Broiler sales: The average cycle length (from placement to placement) was 9 weeks. This was not necessarily for one flock of birds. The average age at which the live broilers were sold was 6.0 weeks or 42 days. The modern broiler has the potential to reach slaughter weight at 33-35 days of age, depending on the management practices such as type of housing, stocking density, ventilation, biosecurity and feeding. Customers who buy live birds do however prefer to have slightly older, heavier broilers. The sales figures are summarised in table 5 below:
Table 5: Summary of broiler sales figures for 3Q2016
Marketing channel No. producers* Quantity Weighted avg. price Total value
Live birds 213 287 890 R48.98/bird R14 101 132
Abattoir 42 33 041 R25.75/kg
R58.67/bird R1 733 361
* 37 producers sell both live and processed birds The average price for live bird sales was R57.47 versus the weighted average of R48.98 shown in the table above. This discrepancy is explained by the fact that farmers selling large quantities of birds did so at a reduced price. 89.7% of the broilers were sold live and 10.3% were slaughtered at abattoirs. The average slaughter fee charged by abattoirs was R5.50 per bird. The average weight at slaughter was 1.91 kg, and for the dressed birds was 1.97 kg. Respondents answered either of these questions, so the resulting slaughter weight and dressed weight are unrelated. Comments: The most common complaints of respondents for the quarter was the high feed and electricity cost, the unstable market, their remote location from an abattoir and slow growth rate and disease as a result of the cold season. Further difficulties experienced are given below:

SAPA Subsistence and Small Commercial Farmer Report 3Q2016
- 7 -
The South African Poultry Association
Not able to source funding to expand the business;
Very little assistance from extension officers;
Non-payment of accounts by clients, and crime in the area;
Struggle with transport to collect chicks and make deliveries to the abattoir;
Either a large amount of competition or no market;
Belief that small farmers are supplied with second grade chicks;
Spending a lot on transport for feed, medication and collection of chicks;
Battling to find a place nearby to buy medication and
They would like financial assistance and training, but are not receiving either, some respondents have thus said they will refuse to supply their info in the future.
A number of respondents complained about their poor market or location to the nearest abattoir, but still said that they want to expand. It is concerning that the viability of the market is not explored before beginning such a venture.
3. Contract Growers Day-old chicks and broiler production: The gender split for contract growers is 19 males and 7 females. The farms are located in North West (8), Limpopo (7), Mpumalanga (7), Gauteng (3), and Free State (1) provinces (Figure 4).
Figure 4: Location of contract growers surveyed

SAPA Subsistence and Small Commercial Farmer Report 3Q2016
- 8 -
The South African Poultry Association
Day-old chicks were obtained from the principal company’s hatcheries. The 26 respondents placed a total of 3 168 159 chicks per cycle during 3Q2016; an average of 121 852 per farmer. The total capacity of the broiler farms is 3 498 130; at the time of the questionnaire the farms were stocked to 88.6% of their capacity. The average mortality rate on the contract growers’ farms was 4.1%. No information was collected on sales volumes or prices. The average feed consumed per bird placed was 2.96 kg’s/bird. The average age at slaughter was 4.9 weeks (34.1 days) and the contract growers on average stand empty for 14 days.
4. Abattoirs
Seven abattoirs were contacted. Two are located in each province of the Northern Cape and Gauteng, with one each in the Free State, Mpumalanga and North West. These abattoirs are owned by four males and three females. Four of the businesses produce their own broilers as well as providing a slaughtering service to outsiders, while the other three operate as an abattoir only.
The total number of birds slaughtered per day was 6 600, this value ranged from 2 000 to 300 per day across the abattoirs. The average slaughter fee was R4.79 per bird. Respondents gave their selling price for dressed birds as either R/kg or R/bird; the resulting averages were R30.72/kg or R40.00 per whole bird. The location of the abattoirs is shown in Figure 5.
Figure 5: Location of abattoirs surveyed

SAPA Subsistence and Small Commercial Farmer Report 3Q2016
- 9 -
The South African Poultry Association
EGG FARMERS
1. Pullet Rearers Day-old pullets: A total of 15 pullet rearers from four different provinces responded to the 3Q2016 survey. The farms are located in Limpopo (7), Gauteng (5), Eastern Cape (2) and the Northern Cape (1). Figure 6 shows the distribution of egg farmers (both pullet rearers and egg producers). The businesses are owned by nine females and six males. Three of the pullet rearers keep point-of-lay pullets for their own egg production units.
Figure 6: Location of egg farmers surveyed
Four pullet rearers obtained chicks from their own hatcheries, while the remaining eleven purchased 16 520 day-old pullets from recognised commercial layer hatcheries, and traders, for the quarter. The weighted average price per day-old pullet was R10.21. At the time of the questionnaire, a total of 17 668 pullets were being reared. The average number per farmer was 1 178 pullets. The capacity of the rearing facilities is 63 870, which means that 27.7% of the capacity was used.

SAPA Subsistence and Small Commercial Farmer Report 3Q2016
- 10 -
The South African Poultry Association
Pullet Feed: All respondents buy their feed in bags. The average price paid per 50kg bag for Starter mash was R303.61; for Grower mash R301.50, and for Developer mash R321.67. Very few respondents supplied information for the Developer Mash, hence the inconsistent price in comparison to the other phases as it comes from a smaller pool of data. The total quantity of bag feed purchased per month during 3Q2016 by pullet rearers was 43.5 tons, i.e. an average of 58 bags per farmer. The total value of the feed purchases was approximately R238 540 per month. Point-of-lay sales: Eleven of the pullet rearers interviewed sold point-of-lay pullets to outside customers. Total sales amounted to 13 020 birds for the quarter. The average selling price was R53.18 per bird.
2. Egg Producers A total of 73 egg producers took part in the 3Q2016 survey. The gender count is 39 males and 34 females.
Point-of-lay hens: 69 Egg producers buy point-of-lays from recognised pullet rearers as well as smaller independent rearers and traders. Four of the egg producers rear their own pullets. Hens are kept in battery cages on 56 farms, there are 13 free-range farms, one that has both these housing types and three that use barn housing. A total of 242 521 point-of-lays were purchased, with an average of 3 515 per farmer. The weighted average purchase price was R62.78 per point-of-lay pullet. The flock size for the 73 respondents was 216 882 hens. The laying facilities can hold 472 760 hens, which means that they were stocked at 45.9% of their capacity during 3Q2016. Layer feed: 63 of the respondents buy their feed in 40kg or 50kg bags. In total 248.9 tons of bagged layer feed was purchased per month; approximately 68 bags per farmer. Some of the figures given for the number of bags bought per month did not match up to the number of layers cited as being on the farm at the time of the questionnaire. This is concerning given what a valuable commodity feed is; feed stock should be managed closely on a weekly basis. The weighted average price for laying mash, excluding VAT and transport, was R257.62/50kg bag. In order to compare this to a bulk price, the bag price is multiplied by 20 (1 ton = 1000 kg = 20 x 50kg bags): R257.62 x 20 bags = R5 152.44/ton. Ten of the survey respondents are buying in bulk. They purchased 398 tons per month at a weighted average price of R4 681.90/ton. The total value of the layer feed purchases was R3 145 891 per month, i.e. R9 437 673 per quarter. The SAPA reported layer feed price for 3Q2016 was R4 168/ton. This would be for egg producers who are buying large quantities in bulk. Small farmers buying in bulk paid 12.3% more than large producers for their feed. Farmers buying in bags paid 23.6% more.

SAPA Subsistence and Small Commercial Farmer Report 3Q2016
- 11 -
The South African Poultry Association
Egg sales: Eggs were sold to the community, schools, bakeries, butcheries, a game lodge, hospitals, clinics, a creche, at informal markets, to hawkers, a bed and breakfast establishment, a restaurant, supermarkets, wholesalers, co-op’s, and local spaza shops. The weighted average egg price during 3Q2016 was R13.33/doz. The commercial farmers’ producer price was R13.36/dozen. The difference between the small-scale farmers’ selling price and the commercial farmers’ egg realisation was R0.03/doz (-0.2%). Producers selling direct to end users should be able to realise a higher price than commercial farmers. Total sales amounted to 71 695 dozen per week, i.e. 935 190 dozen per quarter. The average rate of lay for the 216 882 hens was 64.4%. Although the rate of lay has increased from the previous quarter, the layer farmers should be aiming for 80-85%. The total value of the eggs produced for 3Q2016 was R12 466 667. Cull hen sales: Old hens continue to be sold live to the community via spaza shops and hawkers, and are also marketed at schools. In total 142 288 culls were sold for the quarter at a weighted average selling price of R35.78/hen. The average cull price obtained by commercial farmers during 3Q2016 was R30.31. Small farmers got 18.1% more for their culls than larger producers. Comments: A lot of the egg farmers experienced problems with water, the high feed cost and the cold weather in 3Q2016. Other challenges included the high cost and irregular supply of electricity, the high cost of transporting pullets and feed due to the remote location of their farm, poor chick quality, disease and poor production as a result of the colder weather, the high crime rate in the area, bigger companies in the area pushing their prices down, too many competitors in the market, inability to buy medication for their hens and one farmer was battling with the burning of vegetation in the area negatively affecting their hens. A desire for further training was expressed as well as a need for training to assist with costing of eggs, this illustrates the need for some type of record keeping to aid farmers with their pricing. CONCLUSION Silverpath is making huge strides in improving the data collection procedures to ensure the results are meaningful. Thank you to all small commercial producers who take part in the quarterly surveys. Your comments have been passed on to the SAPA Chairman for discussion at the committee meetings. The call centre staff members who interview the farmers speak all eleven official languages. Please expect a call from Ireen Lekabe or Olga Leshabane. The cell number dedicated to emerging farmers is 079 591 6454 / 079 077 9003 / 079 618 2609, and staff can be contacted from Monday to Friday during office hours; from 08:30 to 16:00. The email address is [email protected] / [email protected]. Ms Cynthia Ncube heads up Silverpath and can be contacted for assistance at [email protected]

SAPA Subsistence and Small Commercial Farmer Report 3Q2016
- 12 -
The South African Poultry Association
PLEASE NOTE: Any and all information, data, know-how, documentation, materials and other communications, written or oral, which are disclosed or provided to SAPA or its designees by a SAPA member shall be regarded as confidential information belonging to that member and will not be disclosed to any other member. APPENDIX A Statistical Terms and examples Statistical methods can be used to summarise or describe a collection of data; this is called descriptive statistics. In our case the collection of data is the stats that we collect from emerging broiler, egg, chick producer farmers, hatcheries and abattoirs. Below please find an example of calculating a weighted average: A farmer sells 50 chickens live at R30 per chicken to a hawker. His neighbour sells 10 chickens live at R40 per chicken to the same hawker. The average price that the chickens were sold at was: (R30+R40)/2 = R70/2 = R35 per chicken The weighted average price that the chickens were sold at was: (R30*50)+ (R40*10) divided by 50+10 = R1500 + R400 divided by 60 =R1900/60 =R31.67 This means in effect that the price of the 50 birds carries more weight than the 10 birds when determining the average price.