subsea permafrost: expert assessment of carbon stocks and
TRANSCRIPT

1
Subsea Permafrost: Expert Assessment of Carbon Stocks and Fluxes 1. Introduction to Expert Assessment and Rational of this Project1
The goal of this survey is to document expert understanding of current, past, and future subsea permafrost
carbon stocks and fluxes. Possible thresholds and tipping points in the relationship between climate change and
subsea permafrost extent and carbon balance are of particular interest, because such non-linearity is difficult to
predict on the basis of models. We recognize that climate-change-driven feedbacks in complex Earth systems
are not, and cannot be, precisely and definitively characterized or predicted. As such, we are only asking for
your informed opinion, realizing that many of the included parameters are not well understood. By
administering this survey to scientists who have expertise relating to the subsea permafrost system, we strive to
evaluate the possible response of Arctic continental shelves to past and future climate change. Even if you only
have expertise pertaining to one or a few of the questions in this survey, your response is valuable because of
the high level of scientific uncertainty and potentially large societal implications associated with the subsea
permafrost system. Because participation in this survey entails a substantial time commitment and contribution
of intellectual production (e.g. empirical results, model runs, and professional opinion), all survey participants
who give feedback on the manuscript will have the opportunity to be co-authors. The dataset of estimates
will be published without identifying information (i.e. individual estimates will be kept anonymous).
When management decisions are pressing but
uncertainty is high, expert judgements have long
informed possible system response and risk of
dangerous or undesired outcomes (Aspinall 2010,
Zickfeld et al. 2010, Morgan 2014). While expert
assessment cannot definitively answer questions of
future system response, it complements modeling
and empirical approaches by allowing the synthesis
of formal and informal knowledge about the system
to inform decision makers and researchers (Fig. 1).
The approach is similar to the concept of ensemble
models, where multiple estimates built on different
assumptions and data provide a more robust
estimate of central tendency and measure of
variance. Because the experimental unit is an
individual researcher, each data point integrates multiple types of knowledge available to that person; including
information not yet formalized enough to integrate into numerical models. Working with the Permafrost Carbon
Network, we have previously used this methodology to estimate the timing and magnitude of greenhouse gas
and fluvial carbon release from terrestrial permafrost, assess Arctic and Boreal wildfire, and quantify the
potential for terrestrial vegetation to offset permafrost carbon losses through increased primary production
(Schuur and Abbott 2011, Schuur et al. 2013, Abbott et al. 2016). These estimates should be considered as
hypotheses of possible system response to be tested with future data collection and modeling.
In the context of this project, expert assessment of subsea permafrost and carbon balance could: 1. assess
risks of abrupt CO2 and CH4 release, two of the major anthropogenic greenhouse gases, 2. provide a critical
long-term perspective on vulnerability of carbon currently being thawed from terrestrial permafrost, and 3.
generate first-order estimates of energy resources on the continental shelves. These questions have been
identified as critical research priorities (Lenton et al. 2008, Shakhova et al. 2010, Thornton and Crill 2015,
1 Project supported by the Permafrost Carbon Network (permafrostcarbon.org) and the Brigham Young University Graduate School
Figure 1. Diagram of the role of expert assessment in synthesizing
and communicating scientific understanding (Abbott et al. 2016).

2
Lindgren et al. 2018, Martens et al. 2018), but given the scarcity of data and complexity of subsea permafrost,
precise empirical or model-based estimates of the critical factors driving subsea permafrost dynamics are
unlikely in the near future.
2. Background Information on Subsea Permafrost2
Subsea permafrost (perennially frozen sediment, soil, and other material) exists under portions of the
shallow continental shelves of the Arctic Ocean (Fig. 2). This permafrost formed during the last ice age when
unglaciated portions of the exposed continental shelves accumulated hundreds of billions of tons of carbon in
soil profiles from undecomposed plant material (Osterkamp and Harrison 1982, Rekant et al. 2005,
Romanovskii et al. 2005, Tesi et al. 2016, Lindgren et al. 2018). As ice sheets and glaciers melted after the Last
Glacial Maximum, sea level rose ~130 m, inundating several million km2 of terrestrial permafrost (Yokoyama
et al. 2000, Bauch et al. 2001, Rachold et al. 2005, Lindgren et al. 2016). Seawater inundation fundamentally
changes the thermal regime of permafrost, and consequently most subsea permafrost has been degrading since it
was inundated after the Last Glacial Maximum
(Osterkamp et al. 1989, Romanovskii and
Hubberten 2001, Shakhova et al. 2009, 2017,
Ruppel et al. 2016).
Diverse empirical and modeling methods
have been used to estimate the extent and depth of
subsea permafrost and associated organic carbon,
including: Neumann solutions to estimate
permafrost aggradation (Mackay et al. 1972);
electromagnetic measurements (Sherman et al.
2017, Piskunova et al. 2018); cone penetrometry
(Blouin et al. 1979); various drilling approaches
to quantify temperature, ice content, and organic
matter (Osterkamp and Harrison 1982, Osterkamp
et al. 1985, Ruppel et al. 2016); velocity analysis
(Brothers et al. 2016); seismoacoustic methods
(Portnov et al. 2013); acoustic methods to detect
gas release (Leifer et al. 2017); and numerical
modeling of conductive heat transfer and hydrates
(Romanovskii et al. 1998, Hutter and Straughan
1999, Delisle 2000, Romanovskii and Hubberten 2001). Technical and political challenges of obtaining
measurements from the Arctic shelves means that subsea permafrost remains one of the least understood aspects
of the permafrost zone and Earth system generally. Particularly uncertain parameters include, permafrost extent
and degradation state (Nicolsky and Shakhova 2010, Nicolsky et al. 2012, Portnov et al. 2013), organic matter
content (Tarnocai et al. 2009, Lindgren et al. 2018, Martens et al. 2018), and CH4 stocks (Kvenvolden 1988,
Frederick and Buffett 2014, Ruppel and Kessler 2017).
2.1 Net ecosystem carbon balance of the subsea permafrost domain
Organic carbon of the Arctic continental shelves can be divided into three general pools, each with different
characteristics and potential vulnerability to climate change.
1. Prior to the marine transgression, tundra and steppe ecosystems on the continental shelf contained dense
and deep soil organic matter (SOM) deposits because of limited decomposition at the surface and
2 This document is not intended as a comprehensive or endorsed list of citations or information. It is a partial summary of the current
understanding of subsea permafrost to be used as a reference while filling out the survey.
Figure 2. Reconstructed distribution of terrestrial and subsea
permafrost and ice sheets and glaciers at the Last Glacial Maximum
(Lindgren et al. 2016). We define the areas of discontinuous and
continuous sea shelf permafrost as the subsea permafrost domain.

3
cryogenic processes that mixed or deposited SOM at depth (Zimov et al. 2006, Yu et al. 2010, Ciais et
al. 2011, Schirrmeister et al. 2013, Anthony et al. 2014, Lindgren et al. 2018). Some of this SOM
remains frozen in subsea permafrost deposits, while some has been thawed (Naidu et al. 2000, Karlsson
et al. 2016, Lindgren et al. 2018). For the purposes of this survey, we refer to this SOM that
accumulated in soil profiles of the continental shelves as subsea SOM.
2. During deglaciation and subsequent permafrost degradation (including ongoing degradation), Arctic
rivers and rapidly eroding coasts delivered huge quantities of terrestrial sediment and SOM to coastal
seas, covering much of the continental shelf with additional carbon and nitrogen- rich material above
the permafrost (Taylor et al. 1996, Mueller-Lupp et al. 2000, Gustafsson et al. 2011, Charkin et al.
2011, Vonk et al. 2012, Doxaran et al. 2015, Tesi et al. 2016, Irrgang et al. 2018, Martens et al. 2018).
We refer to this pool as surface-sediment OM.
3. Before and after the marine transgression, methane (CH4) formed within and below permafrost deposits,
constituting a potentially high-sensitivity carbon pool (Dmitrenko et al. 2011, Frederick and Buffett
2014, 2016, Thornton and Crill 2015, Ruppel and Kessler 2017). We refer to this pool, which includes
all trapped CH4 (whether gas or hydrate) stored below or on the seafloor as subsea CH4.
It remains highly uncertain how much shelf carbon existed at the Last Glacial Maximum, and how much
persists today (Vonk et al. 2012, Schuur et al. 2015, Lindgren et al. 2018). When subsea permafrost degrades,
the CH4 and SOM it contains may be mobilized via several distinct pathways. Flowing water can transport
dissolved organic matter (DOM) from subsea SOM and surface sediment OM to the water column, where it
may be decomposed, immobilized biotically or abiotically, or transported via ocean currents (Guo et al. 2004,
Frederick and Buffett 2014, Salvadó et al. 2015, Karlsson et al. 2016). Microbial decomposition of shelf carbon
can create CO2 and CH4, which may remain trapped, diffuse into the water column, or be released directly to the
atmosphere via ebullition. Because CH4 is readily consumed by methanotrophs, which are abundant in surface
sediments and in the overlying water column, some of the CH4 released from subsea permafrost and surface
sediment never reaches the atmosphere because of microbial immobilization and oxidation to CO2 (Damm and
Budéus 2003, Westbrook et al. 2009, Overduin et al. 2015, Thornton and Crill 2015, Sparrow et al. 2018,
Winkel et al. 2018). Ebullition effectively bypasses zones of CH4 uptake, and large-scale CH4 release has been
observed from some Arctic shelves (Shakhova et al. 2010, Portnov et al. 2013, Thornton et al. 2016, Leifer et al.
2017), though these fluxes appear to be highly variable geographically and temporally (Macdonald 1976,
Savvichev et al. 2007, Nickel et al. 2012, Coffin et al. 2013, Lapham et al. 2017). Additionally, it remains
unclear if these emissions are due to recent Arctic system warming, or how much of this CH4 is from subsea
permafrost (i.e. subsea SOM), recently deposited SOM (surface-sediment OM), CH4 hydrates, or deeper
hydrocarbon stocks (Kvenvolden et al. 1993, Cramer and Franke 2005, Lapham et al. 2010, Vonk et al. 2012,
Sparrow et al. 2018).
2.2 Climate change in the subsea permafrost domain
Anthropogenic climate change is affecting subsea permafrost and the carbon it contains in three general and
interconnected ways. First, high latitude air temperature is increasing approximately 6-times faster than the
global mean (Huang et al. 2017). This increase in air temperature is a consequence and cause of a massive
decline in Arctic sea ice over the past decades (Holland and Bitz 2003, Screen and Simmonds 2010, Parmentier
et al. 2013, AMAP 2017), which in turn, decreases albedo and increases Arctic Ocean temperature
(Johannessen et al. 2004, Screen and Simmonds 2010, Koenigk et al. 2016). Second, climate change is
increasing freshwater runoff to the Arctic Ocean because of increased precipitation, glacial and ice-sheet melt,
groundwater discharge, and river discharge (McClelland et al. 2006, Peterson 2006, Overeem and Syvitski
2010, Rawlins et al. 2010, AMAP 2017, Box et al. 2018, Trusel et al. 2018). This influx of freshwater is
disrupting Arctic Ocean circulation, which directly and indirectly affects water temperature and associated
changes on the continental shelves (Proshutinsky and Johnson 1997, Wassmann et al. 2011, Koenigk et al.

4
2013). Third, coastal and terrestrial permafrost degradation is altering the chemistry of estuarine and
continental-shelf waters. Solute concentrations and fluxes have increased for virtually all rivers where long-term
data exist (Frey et al. 2007, McClelland et al. 2007, Tank et al. 2012, 2016, Toohey et al. 2016, Kendrick et al.
2018), and erosion of Arctic coastlines is accelerating due to warming and increased exposure to wave action
and storms due to reductions in sea ice cover (Stroeve et al. 2007, Screen and Simmonds 2010). Increased
terrestrial and coastal erosion delivers solutes and particulates coastal waters, where they affect redox
conditions, light penetration, and sedimentation (Rachold et al. 2007, Lantuit et al. 2009, Jones et al. 2009,
Doxaran et al. 2015, McClelland et al. 2016, Ramage et al. 2018).
2.3 Executive summary:
1. Subsea permafrost has been degrading since the Last Glacial Maximum and it continues to degrade today
2. A portion of subsea SOM and surface-sediment OM has been decomposed since it was deposited by
terrestrial processes prior to inundation (subsea SOM) or aquatic/marine processes after inundation
(surface-sediment OM)
3. There appears to be spatially-variable CH4 release from the subsea permafrost domain, but the source,
magnitude, and trend (i.e. increasing or stable since pre-industrial) of CH4 flux is unclear
4. Climate change is warming air and ocean temperature, decreasing sea ice, altering freshwater inputs and
Arctic Ocean circulation, and changing the biogeochemistry of estuarine and marine waters
5. The potential effects of anthropogenic climate change on carbon pools and fluxes in the subsea permafrost
domain remain unknown
3. Questionnaire instructions
You will be asked to provide estimates of the magnitude and timing of subsea permafrost carbon stocks and
fluxes in the past (section 5.1), present (5.2), and future (5.3). Given the large spatial and temporal scales of
interest, we ask you to consider the overall response of the circumarctic subsea permafrost domain, defined as
the unglaciated continental shelf areas exposed during the Last Glacial Maximum that are currently inundated
(Fig. 2). For the future (section 5.3), we ask for estimates of carbon fluxes for two warming scenarios from the
most recent IPCC radiative forcing scenarios (RCP4.5 and RCP8.5; Figs. 3-6). We will ask for estimates over
short (Present-2050), medium (Present-2100), and long (Present-2300) time frames for. Climate projections and
estimates of system response become increasingly uncertain for distant time frames. However, because subsea
permafrost can take many decades or centuries to fully respond to disturbance, we have included the 2300-time
step to account for lags in this response.
Because of the compound assumptions inherent to this kind of assessment, you will be asked to provide a
subjective confidence interval around your estimate defined as follows:
Lower = I consider there to be a 95% chance that the actual value is greater than this value
Central = This is my best estimate of system response
Upper = I consider there to be a 95% chance that the actual value is lower than this value
For each question, you will have a chance to indicate your level of confidence and expertise concerning
your answer, make comments on how you selected your estimates, and identify key sources of uncertainty
concerning the future response of the system (e.g. what data or processes missing from current understanding
would most improve our ability to predict system behavior). If there is not yet clear supporting evidence in the
literature, but you have some basis for an estimate based on professional judgment, please make a note of that.
These supporting questions allow us to compare responses from multiple experts and are just as valuable as the
quantitative estimates. If you feel you can truly provide no useful input on a question, you can leave it blank.
The five-point “Confidence level” scale is defined as follows:
1= My answer is my best guess, but I am not confident in it; it could easily be far off the mark.
2= My answer is an educated guess; it could be far off the mark, but I have some confidence in it.

5
3= I am moderately confident in my answer; the true value is likely different from my answer,
but in the generally range.
4= I am confident in my answer; the true value is likely to be somewhat different from my answer,
but it is unlikely to be dramatically different.
5= Given current understanding, I would be surprised if my answer were far off from the true value.
The five-point “Expertise level” scale is defined as follows:
1= I have little familiarity with the literature and I do not actively work on these particular questions.
2= I have some familiarity with the literature and I’ve worked on related questions
but haven't contributed to the literature on this issue; it is not an area of central expertise for me.
3= I have worked on related issues and have contributed to the relevant literature
but do not consider myself one of the foremost experts on this particular issue.
4= I am very familiar with relevant literature and have worked on related questions.
This is an area of central expertise for me.
5= I contribute actively to the literature directly concerned with this issue,
and I consider myself one of the foremost experts on it.
4. Climate Scenarios
Figure 3. Projected
changes in mean
annual sea surface
temperature (SST)
from the recent past
(1986-2005) to the end
of century (2081-2100)
for representative
concentration pathway
scenarios RCP4.5 and
RCP8.5. The CMIP5
models included are
bcc-csm1-1, bcc-csm1-
1-m, CanESM2,
CCSM4, CNRM-
CM5,CESM1-CAM5,
GFDL-CM3, GFDL-
ESM2G, GFDL-
ESM2M, GISS-E2-H,
HadGEM2-AO, IPSL-
CM5A-LR, IPSL-
CM5A-MR, MIROC5,
,MIROC-ESM,
MIROC-ESM CHEM,
MPI-ESM-LR, MPI-
ESM- MR, MRI-
CGCM3, NorESM1-
M,NorESM1- ME.
Data extracted and
plotted by Shengpin
He.
Figure 4. Vertical ocean temperature distribution (in ºC)
from EC-Earth, averaged over the Arctic Ocean
(Koenigk et al. 2013).

6
Figure 5. Summer (JJA,
dashed) and winter (DJF,
solid) mean 2m air
temperature in ℃ averaged
over 70-90 N in the twentieth
century simulations (black)
and three RCP scenarios
from EC-Earth (a global
coupled climate model) and
the ERA-Interim reanalysis
(stars). (Koenigk et al.
2013).
Figure 6. a) Mean annual air temperature at 2m in ºC from EC-Earth, averaged
over 1980-1999. b-c) projected changes in mean annual air temperature at 2m
by 2080-2099 for RCP4.5 (b) and RCP8.5 (c). (Koenigk et al.2013).

7
5. Questions
Respondent Information Gender
Age
General field (biogeochemistry, geophysics,
marine biology, ecosystem ecology, industry etc.)
Research discipline (subsea permafrost, general
permafrost, methane hydrates, SOM etc.)
Rate yourself on a scale of 1 to 5 where 1 is exclusively field
research and 5 is exclusively modeling research.
Country of origin
Country of residence
Have you previously participated in an expert
assessment on any topic?
How many years of experience do you have in
subsea permafrost research?
Primary geographic region/s of expertise
Example question
Example response table. Please fill out each question completely as in the example below (example responses in red).
Your estimate in X Confidence level
(1-5)
Expertise level
(1-5) 5% (Lower) Central 95% (Upper)
30 50 90 2 4 How did you generate these estimates (mark all that apply)? What are the largest sources of
uncertainty in this estimate?
a) published empirical data: Yes
b) published model estimates: Yes
c) unpublished data:
d) professional opinion: Yes
e) other (please specify):
The distribution of X is unknown. More measurements of Y in the Z geographic region would reduce this uncertainty.
Additional comments: My guess is based on my study area, and I am only somewhat familiar with
the rest of the areas.

8
5.1 Permafrost extent and carbon stocks at the Last Glacial Maximum
Question 1. What is the area of formerly subaerial permafrost that was inundated after the Last Glacial Maximum
(26,500 years before present)?
Note: This does not include areas that were glaciated or covered by perennial ice.
Your estimate in km2 Confidence level
(1-5)
Expertise level
(1-5) 5% (Lower) Central 95% (Upper)
How did you generate these estimates (mark all that apply)?
a) published empirical data:
b) published model estimates:
c) unpublished data:
d) professional opinion: e) other (please specify):
What are the largest sources of
uncertainty in this estimate?
Additional comments:
Question 2. At the Last Glacial Maximum how much organic carbon was stored in and on the continental shelves that
are now submerged?
Note: This question only considers soil organic matter (SOM) present at that time, not including CH4 stocks.
Your estimate in Gt C (1Gt = 1012 Kg = 1015g) Confidence level
(1-5)
Expertise level
(1-5) 5% (Lower) Central 95% (Upper)
How did you generate these estimates (mark all that apply)?
a) published empirical data:
b) published model estimates:
c) unpublished data:
d) professional opinion: e) other (please specify):
What are the largest sources of uncertainty
in this estimate?
Additional comments:
9
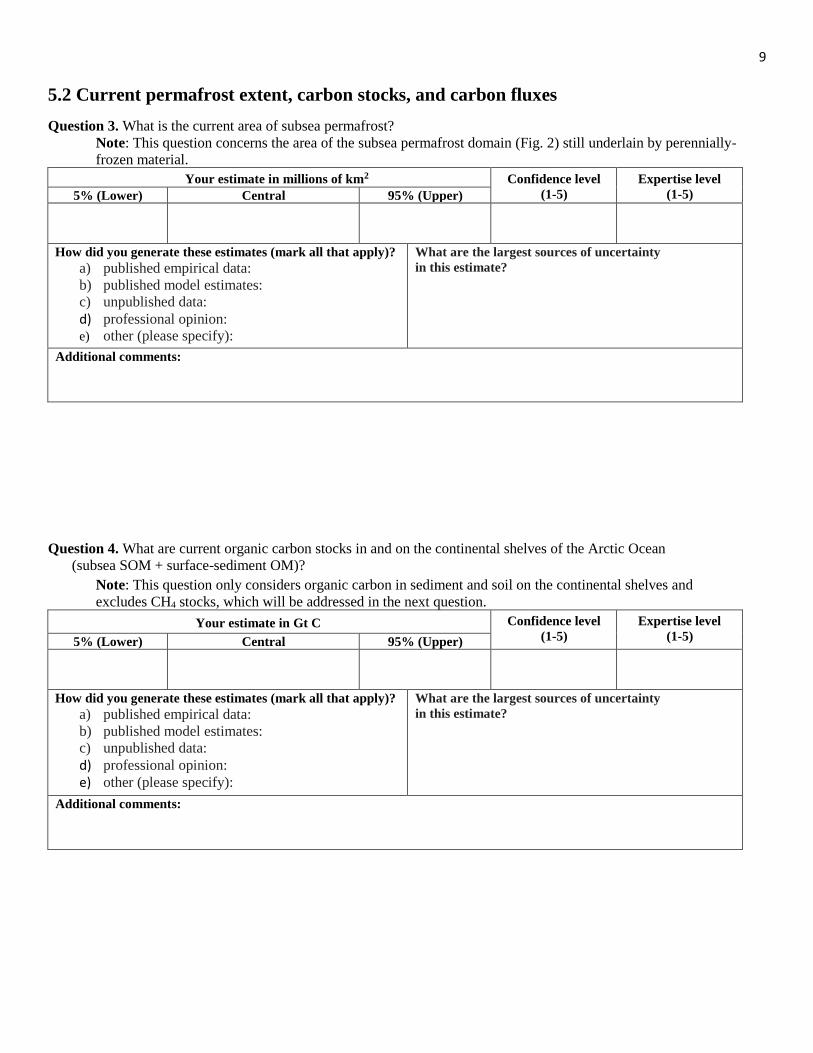
5.2 Current permafrost extent, carbon stocks, and carbon fluxes
Question 3. What is the current area of subsea permafrost?
Note: This question concerns the area of the subsea permafrost domain (Fig. 2) still underlain by perennially-
frozen material.
Your estimate in millions of km2 Confidence level
(1-5)
Expertise level
(1-5) 5% (Lower) Central 95% (Upper)
How did you generate these estimates (mark all that apply)?
a) published empirical data:
b) published model estimates:
c) unpublished data:
d) professional opinion: e) other (please specify):
What are the largest sources of uncertainty
in this estimate?
Additional comments:
Question 4. What are current organic carbon stocks in and on the continental shelves of the Arctic Ocean
(subsea SOM + surface-sediment OM)?
Note: This question only considers organic carbon in sediment and soil on the continental shelves and
excludes CH4 stocks, which will be addressed in the next question.
Your estimate in Gt C Confidence level
(1-5)
Expertise level
(1-5) 5% (Lower) Central 95% (Upper)
How did you generate these estimates (mark all that apply)?
a) published empirical data:
b) published model estimates:
c) unpublished data:
d) professional opinion: e) other (please specify):
What are the largest sources of uncertainty
in this estimate?
Additional comments:
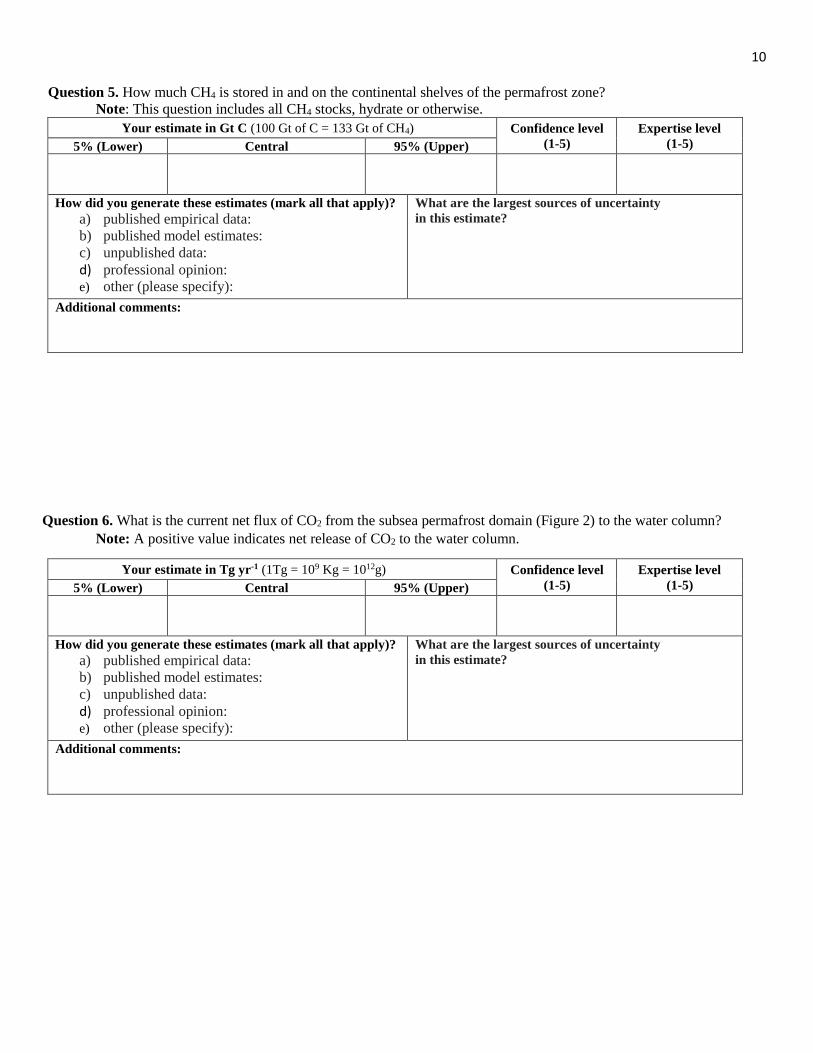
10 Question 5. How much CH4 is stored in and on the continental shelves of the permafrost zone?
Note: This question includes all CH4 stocks, hydrate or otherwise.
Your estimate in Gt C (100 Gt of C = 133 Gt of CH4) Confidence level
(1-5)
Expertise level
(1-5) 5% (Lower) Central 95% (Upper)
How did you generate these estimates (mark all that apply)?
a) published empirical data:
b) published model estimates:
c) unpublished data:
d) professional opinion: e) other (please specify):
What are the largest sources of uncertainty
in this estimate?
Additional comments:
Question 6. What is the current net flux of CO2 from the subsea permafrost domain (Figure 2) to the water column?
Note: A positive value indicates net release of CO2 to the water column.
Your estimate in Tg yr-1 (1Tg = 109 Kg = 1012g) Confidence level
(1-5)
Expertise level
(1-5) 5% (Lower) Central 95% (Upper)
How did you generate these estimates (mark all that apply)?
a) published empirical data:
b) published model estimates:
c) unpublished data:
d) professional opinion: e) other (please specify):
What are the largest sources of uncertainty
in this estimate?
Additional comments:
11
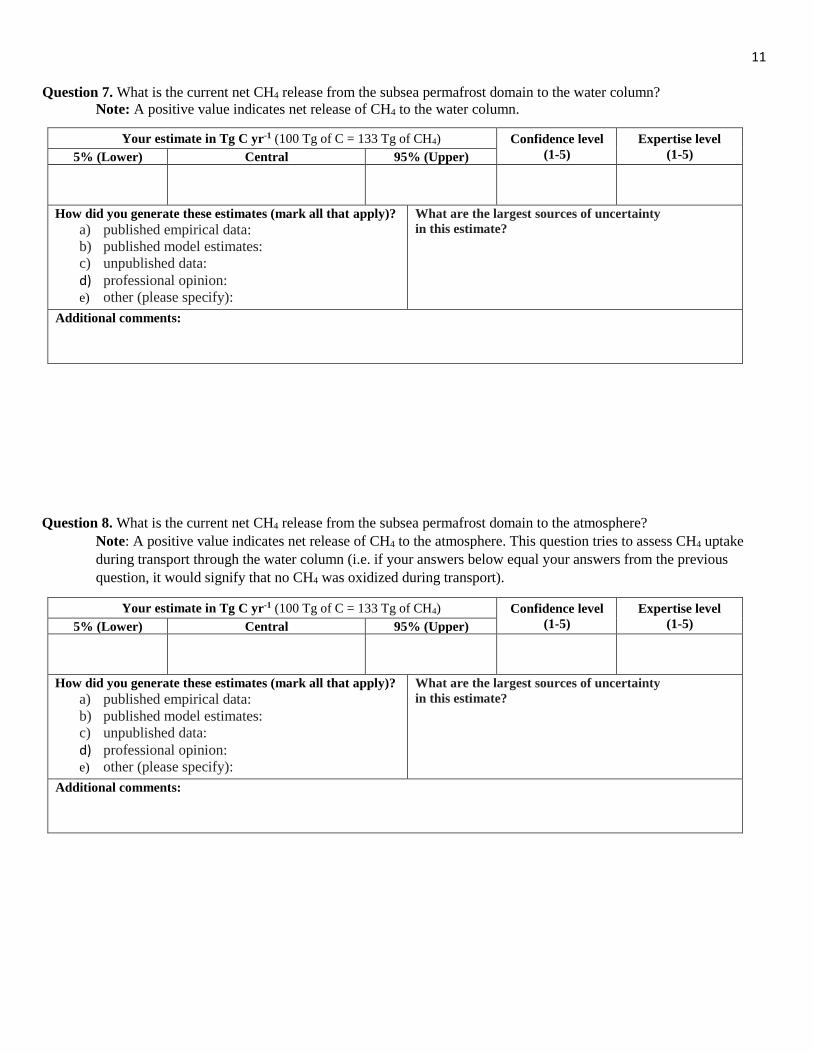
Question 7. What is the current net CH4 release from the subsea permafrost domain to the water column?
Note: A positive value indicates net release of CH4 to the water column.
Your estimate in Tg C yr-1 (100 Tg of C = 133 Tg of CH4) Confidence level
(1-5)
Expertise level
(1-5) 5% (Lower) Central 95% (Upper)
How did you generate these estimates (mark all that apply)?
a) published empirical data:
b) published model estimates:
c) unpublished data:
d) professional opinion: e) other (please specify):
What are the largest sources of uncertainty
in this estimate?
Additional comments:
Question 8. What is the current net CH4 release from the subsea permafrost domain to the atmosphere?
Note: A positive value indicates net release of CH4 to the atmosphere. This question tries to assess CH4 uptake
during transport through the water column (i.e. if your answers below equal your answers from the previous
question, it would signify that no CH4 was oxidized during transport).
Your estimate in Tg C yr-1 (100 Tg of C = 133 Tg of CH4) Confidence level
(1-5)
Expertise level
(1-5) 5% (Lower) Central 95% (Upper)
How did you generate these estimates (mark all that apply)?
a) published empirical data:
b) published model estimates:
c) unpublished data:
d) professional opinion: e) other (please specify):
What are the largest sources of uncertainty
in this estimate?
Additional comments:

12
5.3 Projections of carbon fluxes in the future
Question 9. What percentage of the subsea SOM stocks estimated in Question 4 could be affected by anthropogenic
climate change for the following time steps?
Note: This question seeks to understand what portion of subsea SOM is potentially responsive to climate change
on decadal to centennial timescales (e.g. it could experience a change in thermal or chemical state) versus subsea
SOM that is effectively isolated from anthropogenic climate change because of its location, physical protection, or
other factors. The question is not asking how much of the SOM will be mineralized or otherwise destabilized, just
how much could experience any change in state because of anthropogenic climate change. Given the general
nature of this question, we do not ask you to provide independent estimates for different warming scenarios.
Year
Your estimate in % Confidence
level (1-5)
Expertise level
(1-5) 5% (Lower) Central 95% (Upper)
2050
2100
2300
How did you generate these estimates (mark all that apply)?
a) published empirical data:
b) published model estimates:
c) unpublished data:
d) professional opinion: e) other (please specify):
What are the largest sources of
uncertainty in this estimate?
Additional comments:
Question 10. What percentage of the subsea CH4 stocks estimated in Question 5 could be affected by anthropogenic
climate change for the following time steps?
Note: This question seeks to understand what portion of subsea CH4 is potentially responsive to changes climate
change on decadal to centennial timescales (e.g. it could experience a change in thermal or chemical state) versus
subsea CH4 that is effectively isolated from anthropogenic climate change because of its location, physical
protection, or other factors. The question is not asking how much of the CH4 will released, just how much could
experience any change in state because of anthropogenic climate change. Given the general nature of this
question, we do not ask you to provide independent estimates for different warming scenarios.
Year
Your estimate in % Confidence
level (1-5)
Expertise level
(1-5) 5% (Lower) Central 95% (Upper)
2050
2100
2300
How did you generate these estimates (mark all that apply)?
a) published empirical data:
b) published model estimates:
c) unpublished data:
d) professional opinion: e) other (please specify):
What are the largest sources of
uncertainty in this estimate?
Additional comments:

13 Question 11. How much could CO2 flux from the subsea permafrost domain to the water column change for the
following climate scenarios and time steps?
Note: This question asks for percentage change relative to estimates of current CO2 flux from Question 6.
Possible responses range from -100% to +∞, with negative values indicating a decrease and positive values
indicating an increase.
Your estimate in %
Confidence
level (1-5)
Expertise
level (1-5)
RCP4.5 RCP8.5
5%
(Lower) Central 95%
(Upper)
5%
(Lower) Central
95%
(Upper)
2050
2100
2300
How did you generate these estimates (mark all that apply)?
a) published empirical data:
b) published model estimates:
c) unpublished data:
d) professional opinion: e) other (please specify):
What are the largest sources
of uncertainty in this
estimate?
Additional comments:
Question 12. How much could CH4 flux from the subsea permafrost domain to the atmosphere change for the
following climate scenarios and time steps?
Note: This question asks for percentage change relative to estimates of current CH4 flux from Question 8.
Possible responses range from -100% to +∞, with negative values indicating a decrease and positive values
indicating an increase. While responding, please consider possible changes in CH4 release from the continental
shelves and possible changes in uptake/oxidation dynamics in the water column.
Your estimate in %
Confidence
level (1-5)
Expertise
level (1-5)
RCP4.5 RCP8.5
5%
(Lower) Central 95%
(Upper)
5%
(Lower) Central
95%
(Upper)
2050
2100
2300
How did you generate these estimates (mark all that apply)?
f) published empirical data:
g) published model estimates:
h) unpublished data:
i) professional opinion: j) other (please specify):
What are the largest sources
of uncertainty in this
estimate?
Additional comments:

14
5.4 Final questions
Question 13. As this assessment is not comprehensive (i.e. there are many pools and fluxes that are not explicitly
estimated in this survey), what additional carbon pools or fluxes are or could be influential in determining the net
ecosystem carbon balance of the subsea permafrost domain?
Pool or flux not considered in
previous questions
Potential impact on total net
ecosystem carbon balance of
the subsea permafrost domain
(% increase or decrease or mass
of C in units you specify) Comments
Question 14. Do you have any final comments or know of any other experts qualified to answer one or more of these
questions?
Comments
Expert name Email Area of expertise

15
6. References
Abbott, B. W., J. B. Jones, E. A. G. Schuur, F. S. C. III, W. B. Bowden, M. S. Bret-Harte, H. E. Epstein, M. D. Flannigan,
T. K. Harms, T. N. Hollingsworth, M. C. Mack, A. D. McGuire, S. M. Natali, A. V. Rocha, S. E. Tank, M. R.
Turetsky, J. E. Vonk, K. P. Wickland, G. R. Aiken, H. D. Alexander, R. M. W. Amon, B. W. Benscoter, Yves
Bergeron, K. Bishop, O. Blarquez, B. Bond-Lamberty, A. L. Breen, I. Buffam, Yihua Cai, C. Carcaillet, S. K.
Carey, J. M. Chen, H. Y. H. Chen, T. R. Christensen, L. W. Cooper, J. H. C. Cornelissen, W. J. de Groot, T. H.
DeLuca, E. Dorrepaal, N. Fetcher, J. C. Finlay, B. C. Forbes, N. H. F. French, S. Gauthier, M. P. Girardin, S. J.
Goetz, J. G. Goldammer, L. Gough, P. Grogan, L. Guo, P. E. Higuera, L. Hinzman, F. S. Hu, Gustaf Hugelius, E.
E. Jafarov, R. Jandt, J. F. Johnstone, J. Karlsson, E. S. Kasischke, Gerhard Kattner, R. Kelly, F. Keuper, G. W.
Kling, P. Kortelainen, J. Kouki, P. Kuhry, Hjalmar Laudon, I. Laurion, R. W. Macdonald, P. J. Mann, P. J.
Martikainen, J. W. McClelland, Ulf Molau, S. F. Oberbauer, D. Olefeldt, D. Paré, M.-A. Parisien, S. Payette,
Changhui Peng, O. S. Pokrovsky, E. B. Rastetter, P. A. Raymond, M. K. Raynolds, G. Rein, J. F. Reynolds, M.
Robard, B. M. Rogers, C. Schädel, K. Schaefer, I. K. Schmidt, Anatoly Shvidenko, J. Sky, R. G. M. Spencer, G.
Starr, R. G. Striegl, R. Teisserenc, L. J. Tranvik, T. Virtanen, J. M. Welker, and S. Zimov. 2016. Biomass offsets
little or none of permafrost carbon release from soils, streams, and wildfire: an expert assessment. Environmental
Research Letters 11:034014.
AMAP. 2017. Snow, Water, Ice and Permafrost. Summary for Policy-makers. Page 20. Oslo, Norway.
Anthony, K. M. W., S. A. Zimov, G. Grosse, M. C. Jones, P. M. Anthony, F. S. C. Iii, J. C. Finlay, M. C. Mack, S.
Davydov, P. Frenzel, and S. Frolking. 2014. A shift of thermokarst lakes from carbon sources to sinks during the
Holocene epoch. Nature 511:452–456.
Aspinall, W. 2010. A route to more tractable expert advice. Nature 463:294–295.
Bauch, H. A., T. Mueller-Lupp, E. Taldenkova, R. F. Spielhagen, H. Kassens, P. M. Grootes, J. Thiede, J. Heinemeier,
and V. V. Petryashov. 2001. Chronology of the Holocene transgression at the North Siberian margin. Global and
Planetary Change 31:125–139.
Blouin, S. E., E. J. Chamberlain, P. V. Sellmann, and D. E. Garfield. 1979. Determining subsea permafrost characteristics
with a cone penetrometer—Prudhoe Bay, Alaska. Cold Regions Science and Technology 1:3–16.
Box, J. E., W. T. Colgan, B. Wouters, D. O. Burgess, S. O’Neel, L. I. Thomson, and S. H. Mernild. 2018. Global sea-level
contribution from Arctic land ice: 1971–2017. Environmental Research Letters 13:125012.
Brothers, L. L., B. M. Herman, P. E. Hart, and C. D. Ruppel. 2016. Subsea ice-bearing permafrost on the U.S. Beaufort
Margin: 1. Minimum seaward extent defined from multichannel seismic reflection data. Geochemistry,
Geophysics, Geosystems 17:4354–4365.
Charkin, A. N., O. V. Dudarev, I. P. Semiletov, A. V. Kruhmalev, J. E. Vonk, L. Sánchez-García, E. Karlsson, and ö.
Gustafsson. 2011. Seasonal and interannual variability of sedimentation and organic matter distribution in the
Buor-Khaya Gulf: the primary recipient of input from Lena River and coastal erosion in the southeast Laptev Sea.
Biogeosciences 8:2581–2594.
Ciais, P., A. Tagliabue, M. Cuntz, L. Bopp, M. Scholze, G. Hoffmann, A. Lourantou, S. P. Harrison, I. C. Prentice, D. I.
Kelley, C. Koven, and S. L. Piao. 2011. Large inert carbon pool in the terrestrial biosphere during the Last Glacial
Maximum. Nature Geoscience 5:74–79.
Coffin, R. B., J. P. Smith, R. E. Plummer, B. Yoza, R. K. Larsen, L. C. Millholland, and M. T. Montgomery. 2013. Spatial
variation in shallow sediment methane sources and cycling on the Alaskan Beaufort Sea Shelf/Slope. Marine and
Petroleum Geology 45:186–197.
Cramer, B., and D. Franke. 2005. Indications for an active petroleum system in the Laptev Sea, NE Siberia. Journal of
Petroleum Geology 28:369–384.
Damm, E., and G. Budéus. 2003. Fate of vent-derived methane in seawater above the Håkon Mosby mud volcano
(Norwegian Sea). Marine Chemistry 82:1–11.
Delisle, G. 2000. Temporal variability of subsea permafrost and gas hydrate occurrences as function of climate change in
the Laptev Sea, Siberia. Polarforschung 68:221–225.
Dmitrenko, I. A., S. A. Kirillov, L. B. Tremblay, H. Kassens, O. A. Anisimov, S. A. Lavrov, S. O. Razumov, and M. N.
Grigoriev. 2011. Recent changes in shelf hydrography in the Siberian Arctic: Potential for subsea permafrost
instability. Journal of Geophysical Research 116.
Doxaran, D., E. Devred, and M. Babin. 2015. A 50 % increase in the mass of terrestrial particles delivered by the
Mackenzie River into the Beaufort Sea (Canadian Arctic Ocean) over the last 10 years. Biogeosciences 12:3551–
3565.

16 Frederick, J. M., and B. A. Buffett. 2014. Taliks in relict submarine permafrost and methane hydrate deposits: Pathways
for gas escape under present and future conditions. Journal of Geophysical Research: Earth Surface 119:106–122.
Frederick, J. M., and B. A. Buffett. 2016. Submarine groundwater discharge as a possible formation mechanism for
permafrost-associated gas hydrate on the circum-Arctic continental shelf. Journal of Geophysical Research: Solid
Earth 121:1383–1404.
Frey, K. E., J. W. McClelland, R. M. Holmes, and L. C. Smith. 2007. Impacts of climate warming and permafrost thaw on
the riverine transport of nitrogen and phosphorus to the Kara Sea. Journal of Geophysical Research 112.
Guo, L., I. Semiletov, Ö. Gustafsson, J. Ingri, P. Andersson, O. Dudarev, and D. White. 2004. Characterization of
Siberian Arctic coastal sediments: Implications for terrestrial organic carbon export. Global Biogeochemical
Cycles 18:n/a-n/a.
Gustafsson, ö., B. E. van Dongen, J. E. Vonk, O. V. Dudarev, and I. P. Semiletov. 2011. Widespread release of old
carbon across the Siberian Arctic echoed by its large rivers. Biogeosciences 8:1737–1743.
Holland, M. M., and C. M. Bitz. 2003. Polar amplification of climate change in coupled models. Climate Dynamics
21:221–232.
Huang, J., J. Zhang, L. Wang, M. Hao, Q. Zhang, S. Nie, X. Zhang, X. Chen, Y. Lin, Y. Yao, Y. Xu, Y. Yin, Y. Luo, and
Z. Zhao. 2017. Recently amplified arctic warming has contributed to a continual global warming trend. Nature
Climate Change 7:875.
Hutter, K., and B. Straughan. 1999. Models for convection in thawing porous media in support for the subsea permafrost
equations. Journal of Geophysical Research: Solid Earth 104:29249–29260.
Irrgang, A. M., H. Lantuit, G. K. Manson, F. Günther, G. Grosse, and P. P. Overduin. 2018. Variability in Rates of
Coastal Change Along the Yukon Coast, 1951 to 2015. Journal of Geophysical Research: Earth Surface 123:779–
800.
Johannessen, O. M., L. Bengtsson, M. W. Miles, S. I. Kuzmina, V. A. Semenov, G. V. Alekseev, A. P. Nagurnyi, V. F.
Zakharov, L. P. Bobylev, L. H. Pettersson, K. Hasselmann, and H. P. Cattle. 2004. Arctic climate change:
observed and modelled temperature and sea-ice variability. Tellus A: Dynamic Meteorology and Oceanography
56:328–341.
Jones, B. M., C. D. Arp, M. T. Jorgenson, K. M. Hinkel, J. A. Schmutz, and P. L. Flint. 2009. Increase in the rate and
uniformity of coastline erosion in Arctic Alaska. Geophysical Research Letters 36.
Karlsson, E., J. Gelting, T. Tesi, B. van Dongen, A. Andersson, I. Semiletov, A. Charkin, O. Dudarev, and Ö. Gustafsson.
2016. Different sources and degradation state of dissolved, particulate, and sedimentary organic matter along the
Eurasian Arctic coastal margin. Global Biogeochemical Cycles 30:898–919.
Kendrick, M. R., A. D. Huryn, W. B. Bowden, L. A. Deegan, R. H. Findlay, A. E. Hershey, B. J. Peterson, J. P. Beneš,
and E. B. Schuett. 2018. Linking permafrost thaw to shifting biogeochemistry and food web resources in an arctic
river. Global Change Biology 24:5738–5750.
Koenigk, T., L. Brodeau, R. G. Graversen, J. Karlsson, G. Svensson, M. Tjernström, U. Willén, and K. Wyser. 2013.
Arctic climate change in 21st century CMIP5 simulations with EC-Earth. Climate Dynamics 40:2719–2743.
Koenigk, T., M. Caian, G. Nikulin, and S. Schimanke. 2016. Regional Arctic sea ice variations as predictor for winter
climate conditions. Climate Dynamics 46:317–337.
Kvenvolden, K. A. 1988. Methane hydrate—a major reservoir of carbon in the shallow geosphere? Chemical geology
71:41–51.
Kvenvolden, K. A., M. D. Lilley, T. D. Lorenson, P. W. Barnes, and E. McLaughlin. 1993. The Beaufort Sea continental
shelf as a seasonal source of atmospheric methane. Geophysical Research Letters 20:2459–2462.
Lantuit, H., V. Rachold, W. H. Pollard, F. Steenhuisen, R. Ødegård, and H.-W. Hubberten. 2009. Towards a calculation of
organic carbon release from erosion of Arctic coasts using non-fractal coastline datasets. Marine Geology 257:1–
10.
Lapham, L. L., J. P. Chanton, R. Chapman, and C. S. Martens. 2010. Methane under-saturated fluids in deep-sea
sediments: Implications for gas hydrate stability and rates of dissolution. Earth and Planetary Science Letters
298:275–285.
Lapham, L., K. Marshall, C. Magen, V. Lyubchich, L. W. Cooper, and J. M. Grebmeier. 2017. Dissolved methane
concentrations in the water column and surface sediments of Hanna Shoal and Barrow Canyon, Northern Chukchi
Sea. Deep Sea Research Part II: Topical Studies in Oceanography 144:92–103.
Leifer, I., D. Chernykh, N. Shakhova, and I. Semiletov. 2017. Sonar gas flux estimation by bubble insonification:
application to methane bubble flux from seep areas in the outer Laptev Sea. The Cryosphere 11:1333–1350.

17 Lenton, T. M., H. Held, E. Kriegler, J. W. Hall, W. Lucht, S. Rahmstorf, and H. J. Schellnhuber. 2008. Tipping elements
in the Earth’s climate system. Proceedings of the National Academy of Sciences 105:1786–1793.
Lindgren, A., G. Hugelius, and P. Kuhry. 2018. Extensive loss of past permafrost carbon but a net accumulation into
present-day soils. Nature 560:219.
Lindgren, A., G. Hugelius, P. Kuhry, T. R. Christensen, and J. Vandenberghe. 2016. GIS-based Maps and Area Estimates
of Northern Hemisphere Permafrost Extent during the Last Glacial Maximum: LGM Permafrost. Permafrost and
Periglacial Processes 27:6–16.
Macdonald, R. W. 1976. Distribution of low-molecular-weight hydrocarbons in Southern Beaufort Sea. Environmental
Science & Technology 10:1241–1246.
Mackay, J. R., V. N. Rampton, and J. G. Fyles. 1972. Relic Pleistocene Permafrost, Western Arctic, Canada. Science,
New Series 176:1321–1323.
Martens, J., B. Wild, C. Pearce, T. Tesi, A. Andersson, L. Bröder, M. O’Regan, M. Jakobsson, M. Sköld, L. Gemery, T.
M. Cronin, I. Semiletov, O. V. Dudarev, and Ö. Gustafsson. 2018. Remobilization of old permafrost carbon to
Chukchi Sea sediments during the end of the last deglaciation. Global Biogeochemical Cycles.
McClelland, J. W., S. J. Déry, B. J. Peterson, R. M. Holmes, and E. F. Wood. 2006. A pan-arctic evaluation of changes in
river discharge during the latter half of the 20th century. Geophysical Research Letters 33.
McClelland, J. W., R. M. Holmes, B. J. Peterson, P. A. Raymond, R. G. Striegl, A. V. Zhulidov, S. A. Zimov, N. Zimov,
S. E. Tank, R. G. M. Spencer, R. Staples, T. Y. Gurtovaya, and C. G. Griffin. 2016. Particulate organic carbon
and nitrogen export from major Arctic rivers: POC and PN Export From Major Arctic Rivers. Global
Biogeochemical Cycles 30:629–643.
McClelland, J. W., M. Stieglitz, F. Pan, R. M. Holmes, and B. J. Peterson. 2007. Recent changes in nitrate and dissolved
organic carbon export from the upper Kuparuk River, North Slope, Alaska. Journal of Geophysical Research 112.
Morgan, M. G. 2014. Use (and abuse) of expert elicitation in support of decision making for public policy. Proceedings of
the National Academy of Sciences 111:7176–7184.
Mueller-Lupp, T., H. A. Bauch, H. Erlenkeuser, J. Hefter, H. Kassens, and J. Thiede. 2000. Changes in the deposition of
terrestrial organic matter on the Laptev Sea shelf during the Holocene: evidence from stable carbon isotopes.
International Journal of Earth Sciences 89:563–568.
Naidu, A. S., L. W. Cooper, B. P. Finney, R. W. Macdonald, C. Alexander, and I. P. Semiletov. 2000. Organic carbon
isotope ratios (δ13C) of Arctic Amerasian Continental shelf sediments. International Journal of Earth Sciences
89:522–532.
Nickel, J. C., R. di Primio, K. Mangelsdorf, D. Stoddart, and J. Kallmeyer. 2012. Characterization of microbial activity in
pockmark fields of the SW-Barents Sea. Marine Geology 332–334:152–162.
Nicolsky, D. J., V. E. Romanovsky, N. N. Romanovskii, A. L. Kholodov, N. E. Shakhova, and I. P. Semiletov. 2012.
Modeling sub-sea permafrost in the East Siberian Arctic Shelf: The Laptev Sea region. Journal of Geophysical
Research: Earth Surface 117:F03028.
Nicolsky, D., and N. Shakhova. 2010. Modeling sub-sea permafrost in the East Siberian Arctic Shelf: the Dmitry Laptev
Strait. Environmental Research Letters 5:015006.
Osterkamp, T. E., G. C. Baker, W. D. Harrison, and T. Matava. 1989. Characteristics of the active layer and shallow
subsea permafrost. Journal of Geophysical Research: Oceans 94:16227–16236.
Osterkamp, T. E., and W. D. Harrison. 1982. Temperature measurements in subsea permafrost off the coast of Alaska.
Pages 238–248 4th Canadian Permafrost Conference.
Osterkamp, T. E., J. K. Petersen, and T. S. Collet. 1985. Permafrost thicknesses in the Oliktok point, Prudhoe Bay and
Mikkelsen Bay areas of Alaska. Cold regions science and technology 11:99–105.
Overduin, P. P., S. Liebner, C. Knoblauch, F. Günther, S. Wetterich, L. Schirrmeister, H.-W. Hubberten, and M. N.
Grigoriev. 2015. Methane oxidation following submarine permafrost degradation: Measurements from a central
Laptev Sea shelf borehole. Journal of Geophysical Research: Biogeosciences 120:2014JG002862.
Overeem, I., and J. P. M. Syvitski. 2010. Shifting Discharge Peaks in Arctic Rivers, 1977–2007. Geografiska Annaler:
Series A, Physical Geography 92:285–296.
Parmentier, F.-J. W., T. R. Christensen, L. L. Sørensen, S. Rysgaard, A. D. McGuire, P. A. Miller, and D. A. Walker.
2013. The impact of lower sea-ice extent on Arctic greenhouse-gas exchange. Nature Climate Change 3:195–202.
Peterson, B. J. 2006. Trajectory Shifts in the Arctic and Subarctic Freshwater Cycle. Science 313:1061–1066.
Piskunova, E. A., N. A. Palshin, and D. V. Yakovlev. 2018. Electrical conductivity features of the Arctic shelf permafrost
and electromagnetic technologies for their studies. Russian Journal of Earth Sciences 18:1–14.

18 Portnov, A., A. J. Smith, J. Mienert, G. Cherkashov, P. Rekant, P. Semenov, P. Serov, and B. Vanshtein. 2013. Offshore
permafrost decay and massive seabed methane escape in water depths >20 m at the South Kara Sea shelf:
METHANE ESCAPE IN THE SOUTH KARA SEA. Geophysical Research Letters 40:3962–3967.
Proshutinsky, A. Y., and M. A. Johnson. 1997. Two circulation regimes of the wind-driven Arctic Ocean. Journal of
Geophysical Research: Oceans 102:12493–12514.
Rachold, V., F. E. Are, D. E. Atkinson, G. Cherkashov, and S. M. Solomon. 2005. Arctic Coastal Dynamics (ACD): an
introduction. Geo-Marine Letters 25:63–68.
Rachold, V., D. Y. Bolshiyanov, M. N. Grigoriev, H.-W. Hubberten, R. Junker, V. V. Kunitsky, F. Merker, P. Overduin,
and W. Schneider. 2007. Nearshore arctic subsea permafrost in transition. Eos, Transactions American
Geophysical Union 88:149–150.
Ramage, J. L., A. M. Irrgang, A. Morgenstern, and H. Lantuit. 2018. Increasing coastal slump activity impacts the release
of sediment and organic carbon into the Arctic Ocean. Biogeosciences 15:1483–1495.
Rawlins, M. A., M. Steele, M. M. Holland, J. C. Adam, J. E. Cherry, J. A. Francis, P. Y. Groisman, L. D. Hinzman, T. G.
Huntington, D. L. Kane, J. S. Kimball, R. Kwok, R. B. Lammers, C. M. Lee, D. P. Lettenmaier, K. C. McDonald,
E. Podest, J. W. Pundsack, B. Rudels, M. C. Serreze, A. Shiklomanov, Ø. Skagseth, T. J. Troy, C. J. Vörösmarty,
M. Wensnahan, E. F. Wood, R. Woodgate, D. Yang, K. Zhang, and T. Zhang. 2010. Analysis of the Arctic
System for Freshwater Cycle Intensification: Observations and Expectations. Journal of Climate 23:5715–5737.
Rekant, P., G. Cherkashev, B. Vanstein, and P. Krinitsky. 2005. Submarine permafrost in the nearshore zone of the
southwestern Kara Sea. Geo-Marine Letters 25:183–189.
Romanovskii, N. N., A. V. Gavrilov, A. L. Kholodov, G. P. Pustovoit, H. W. Hubberten, F. Niessen, and H. Kassens.
1998. Map of predicted offshore permafrost distribution on the Laptev Sea Shelf:6.
Romanovskii, N. N., and H.-W. Hubberten. 2001. Results of permafrost modelling of the lowlands and shelf of the Laptev
Sea Region, Russia. Permafrost and Periglacial Processes 12:191–202.
Romanovskii, N. N., H.-W. Hubberten, A. V. Gavrilov, A. A. Eliseeva, and G. S. Tipenko. 2005. Offshore permafrost and
gas hydrate stability zone on the shelf of East Siberian Seas. Geo-Marine Letters 25:167–182.
Ruppel, C. D., B. M. Herman, L. L. Brothers, and P. E. Hart. 2016. Subsea ice-bearing permafrost on the U.S. Beaufort
Margin: 2. Borehole constraints. Geochemistry, Geophysics, Geosystems 17:4333–4353.
Ruppel, C. D., and J. D. Kessler. 2017. The interaction of climate change and methane hydrates. Reviews of Geophysics
55:126–168.
Salvadó, J. A., T. Tesi, A. Andersson, J. Ingri, O. V. Dudarev, I. P. Semiletov, and Ö. Gustafsson. 2015. Organic carbon
remobilized from thawing permafrost is resequestered by reactive iron on the Eurasian Arctic Shelf. Geophysical
Research Letters 42:8122–8130.
Savvichev, A. S., I. I. Rusanov, N. V. Pimenov, E. E. Zakharova, E. F. Veslopolova, A. Y. Lein, K. Crane, and M. V.
Ivanov. 2007. Microbial processes of the carbon and sulfur cycles in the Chukchi Sea. Microbiology 76:603–613.
Schirrmeister, L., D. Froese, V. Tumskoy, G. Grosse, and S. Wetterich. 2013. Yedoma: Late Pleistocene ice-rich
syngenetic permafrost of Beringia. Encyclopedia of Quaternary Science. 2nd edition:542–552.
Schuur, E. A., B. W. Abbott, and the Permafrost Carbon Network. 2011. Climate change: High risk of permafrost thaw.
Nature 480:32–33.
Schuur, E. A. G., B. W. Abbott, W. B. Bowden, V. Brovkin, P. Camill, J. G. Canadell, J. P. Chanton, F. S. Chapin, T. R.
Christensen, P. Ciais, B. T. Crosby, C. I. Czimczik, G. Grosse, J. Harden, D. J. Hayes, G. Hugelius, J. D. Jastrow,
J. B. Jones, T. Kleinen, C. D. Koven, G. Krinner, P. Kuhry, D. M. Lawrence, A. D. McGuire, S. M. Natali, J. A.
O’Donnell, C. L. Ping, W. J. Riley, A. Rinke, V. E. Romanovsky, A. B. K. Sannel, C. Schädel, K. Schaefer, J.
Sky, Z. M. Subin, C. Tarnocai, M. R. Turetsky, M. P. Waldrop, K. M. Walter Anthony, K. P. Wickland, C. J.
Wilson, and S. A. Zimov. 2013. Expert assessment of vulnerability of permafrost carbon to climate change.
Climatic Change 119:359–374.
Schuur, E. A. G., A. D. McGuire, C. Schädel, G. Grosse, J. W. Harden, D. J. Hayes, G. Hugelius, C. D. Koven, P. Kuhry,
D. M. Lawrence, S. M. Natali, D. Olefeldt, V. E. Romanovsky, K. Schaefer, M. R. Turetsky, C. C. Treat, and J. E.
Vonk. 2015. Climate change and the permafrost carbon feedback. Nature 520:171–179.
Screen, J. A., and I. Simmonds. 2010. The central role of diminishing sea ice in recent Arctic temperature amplification.
Nature 464:1334–1337.
Shakhova, N. E., D. Y. Nicolsky, and I. P. Semiletov. 2009. Current state of subsea permafrost on the East Siberian Shelf:
Tests of modeling results based on field observations. Doklady Earth Sciences 429:1518–1521.
Shakhova, N., I. Semiletov, O. Gustafsson, V. Sergienko, L. Lobkovsky, O. Dudarev, V. Tumskoy, M. Grigoriev, A.
Mazurov, A. Salyuk, R. Ananiev, A. Koshurnikov, D. Kosmach, A. Charkin, N. Dmitrevsky, V. Karnaukh, A.

19
Gunar, A. Meluzov, and D. Chernykh. 2017. Current rates and mechanisms of subsea permafrost degradation in
the East Siberian Arctic Shelf. Nature Communications 8:15872.
Shakhova, N., I. Semiletov, I. Leifer, A. Salyuk, P. Rekant, and D. Kosmach. 2010. Geochemical and geophysical
evidence of methane release over the East Siberian Arctic Shelf. Journal of Geophysical Research: Oceans
115:C08007.
Sherman, D., P. Kannberg, and S. Constable. 2017. Surface towed electromagnetic system for mapping of subsea Arctic
permafrost. Earth and Planetary Science Letters 460:97–104.
Sparrow, K. J., J. D. Kessler, J. R. Southon, F. Garcia-Tigreros, K. M. Schreiner, C. D. Ruppel, J. B. Miller, S. J. Lehman,
and X. Xu. 2018. Limited contribution of ancient methane to surface waters of the U.S. Beaufort Sea shelf.
Science Advances 4:eaao4842.
Stroeve, J., M. M. Holland, W. Meier, T. Scambos, and M. Serreze. 2007. Arctic sea ice decline: Faster than forecast:
ARCTIC ICE LOSS-FASTER THAN FORECAST. Geophysical Research Letters 34:n/a-n/a.
Tank, S. E., M. Manizza, R. M. Holmes, J. W. McClelland, and B. J. Peterson. 2012. The Processing and Impact of
Dissolved Riverine Nitrogen in the Arctic Ocean. Estuaries and Coasts 35:401–415.
Tank, S. E., R. G. Striegl, J. W. McClelland, and S. V. Kokelj. 2016. Multi-decadal increases in dissolved organic carbon
and alkalinity flux from the Mackenzie drainage basin to the Arctic Ocean. Environmental Research Letters
11:054015.
Tarnocai, C., J. G. Canadell, E. A. G. Schuur, P. Kuhry, G. Mazhitova, and S. Zimov. 2009. Soil organic carbon pools in
the northern circumpolar permafrost region. Global Biogeochemical Cycles 23:n/a-n/a.
Taylor, A. E., S. R. Dallimore, and S. I. Outcalt. 1996. Late Quaternary history of the Mackenzie–Beaufort region, Arctic
Canada, from modelling of permafrost temperatures. 1. The onshore–offshore transition. Canadian Journal of
Earth Sciences 33:52–61.
Tesi, T., F. Muschitiello, R. H. Smittenberg, M. Jakobsson, J. E. Vonk, P. Hill, A. Andersson, N. Kirchner, R. Noormets,
O. Dudarev, I. Semiletov, and ö Gustafsson. 2016. Massive remobilization of permafrost carbon during post-
glacial warming. Nature Communications 7:13653.
Thornton, B. F., and P. Crill. 2015. Arctic permafrost: Microbial lid on subsea methane. Nature Climate Change 5:723.
Thornton, B. F., M. C. Geibel, P. M. Crill, C. Humborg, and C.-M. Mörth. 2016. Methane fluxes from the sea to the
atmosphere across the Siberian shelf seas. Geophysical Research Letters 43:5869–5877.
Toohey, R. C., N. M. Herman-Mercer, P. F. Schuster, E. A. Mutter, and J. C. Koch. 2016. Multidecadal increases in the
Yukon River Basin of chemical fluxes as indicators of changing flowpaths, groundwater, and permafrost.
Geophysical Research Letters 43:12,120-12,130.
Trusel, L. D., S. B. Das, M. B. Osman, M. J. Evans, B. E. Smith, X. Fettweis, J. R. McConnell, B. P. Y. Noël, and M. R.
van den Broeke. 2018. Nonlinear rise in Greenland runoff in response to post-industrial Arctic warming. Nature
564:104.
Vonk, J. E., L. Sánchez-García, B. E. van Dongen, V. Alling, D. Kosmach, A. Charkin, I. P. Semiletov, O. V. Dudarev, N.
Shakhova, P. Roos, T. I. Eglinton, A. Andersson, and ö. Gustafsson. 2012. Activation of old carbon by erosion of
coastal and subsea permafrost in Arctic Siberia. Nature 489:137–140.
Wassmann, P., C. M. Duarte, S. Agustí, and M. K. Sejr. 2011. Footprints of climate change in the Arctic marine
ecosystem. Global Change Biology 17:1235–1249.
Westbrook, G. K., K. E. Thatcher, E. J. Rohling, A. M. Piotrowski, H. Pälike, A. H. Osborne, E. G. Nisbet, T. A.
Minshull, M. Lanoisellé, R. H. James, V. Hühnerbach, D. Green, R. E. Fisher, A. J. Crocker, A. Chabert, C.
Bolton, A. Beszczynska‐Möller, C. Berndt, and A. Aquilina. 2009. Escape of methane gas from the seabed along
the West Spitsbergen continental margin. Geophysical Research Letters 36.
Winkel, M., J. Mitzscherling, P. P. Overduin, F. Horn, M. Winterfeld, R. Rijkers, M. N. Grigoriev, C. Knoblauch, K.
Mangelsdorf, D. Wagner, and S. Liebner. 2018. Anaerobic methanotrophic communities thrive in deep submarine
permafrost. Scientific Reports 8:1291.
Yokoyama, Y., K. Lambeck, P. De Deckker, P. Johnston, and L. K. Fifield. 2000. Timing of the Last Glacial Maximum
from observed sea-level minima. Nature 406:713–716.
Yu, Z., J. Loisel, D. P. Brosseau, D. W. Beilman, and S. J. Hunt. 2010. Global peatland dynamics since the Last Glacial
Maximum. Geophysical Research Letters 37:n/a-n/a.
Zickfeld, K., M. G. Morgan, D. J. Frame, and D. W. Keith. 2010. Expert judgments about transient climate response to
alternative future trajectories of radiative forcing. Proceedings of the National Academy of Sciences 107:12451–
12456.
20 Zimov, S. A., E. A. G. Schuur, and F. S. Chapin. 2006. Permafrost and the Global Carbon Budget. Science 312:1612–
1613.