subproject h2: mesonic structure of the nucleon · subproject h2: mesonic structure of the nucleon...
TRANSCRIPT

Subproject H2: Mesonic Structure of the Nucleon
Dr. R. BeckInstitut fur Kernphysik
Universitat MainzJ.-J.-Becher-Weg 45
55099 MainzTel.: +49 6131 [email protected]
Dr. L. TiatorInstitut fur Kernphysik
Universitat MainzJ.-J.-Becher-Weg 45
55099 MainzTel.: +49 6131 [email protected]
123

124 CHAPTER 2. REPORT ON THE PROJECTS

SUBPROJECT H2: MESONIC STRUCTURE OF THE NUCLEON 125
H2.1 Introduction
The mesonic structure of the nucleon is a central topic of research at MAMI. Presently it is notknown, how the mesonic degrees of freedom emerge from the fundamental quark and gluonfields of QCD. The mesonic structure of the nucleon is investigated in our H2-project by me-son photo- and electroproduction in the threshold region and in the nucleon resonance region,where the contribution of the virtual meson cloud plays an important role for the “dressing”of nucleon resonances. The high precision, high statistics data from our experiments are com-pared to theoretical predictions based on chiral perturbation theory (ChPT) and more recentlyby predictions based on lattice calculations, which both try to link the QCD picture with themeson-nucleon dynamical view.
The analysis of the experimental data is strongly supported by the local Theory Group withunitary isobar models, dynamical models, quark models, dispersion theoretical approaches andchiral perturbation theory.
The report on the experimental and theoretical activities of this project is organized as follows:
• The Crystal Ball Detector
• Threshold Meson Production
• Nucleon Resonances
• Meson Polarizabilities
A list of publications in reviewed journals and in conference proceedings of our subproject H2over the past 3 years is given in section 3.2 (page 329).
H2.2 The Crystal Ball Detector
J. AHRENS, J.R.M. ANNAND1, H.-J. ARENDS, R. BECK, J. BRUDVIK4, R. CODLING1, E.DOWNIE1, R. GREGOR2, E. HEID, M. KOTULLA3 , D. KRAMBRICH, B. KRUSCHE3, M.LANG, K. LIVINGSTON1 , S. LUGERT2, J.C. MCGEORGE1 , V. METAG2 , B. NEFKENS4 , R.NOVOTNY2, G. ROSNER1, S. SCHUMANN A. STAROSTIN4 , C. TARBERT5, A. THOMAS,M. UNVERZAGT Th. WALCHER, D.P. WATTS5
1Department of Physics and Astronomy, University of Glasgow, Glasgow G128QQ, (UK)2II. Physikalisches Institut, Universit at Gießen, D–35392 Gießen, (Germany)3Department of Physics and Astronomy, University of Basel, CH-4056 Basel (Switzerland)4Department of Physics, University of California, Los Angeles (USA)5School of Physics, University of Edinburgh, Edinburgh, (UK)
In November 2002 the Crystal Ball detector was moved from BNL to Mainz. The Crystal Ball,CB, spectrometer consists of two highly segmented hemispheres made of NaI. The sphere hasan entrance and exit tunnel for the beam and a spherical cavity for the liquid hydrogen target,see Fig. H2.1. For the AGS experiments on baryon spectroscopy the target was surroundedby a cylinder of scintillation counters that functioned as the charged particle veto. The solidangle of the CB is 93% of 4π steradian. The Crystal Ball was build at SLAC and used in J/ψmeasurements at SPEAR and b–quark physics at DESY [1, 2, 3, 4, 5]. The CB is constructedof 672 optically isolated NaI(Tl) crystals with 15.7 radiation lengths thickness. The counters

126 CHAPTER 2. REPORT ON THE PROJECTS
Figure H2.1: Left: The Crystal Ball detector. Right: Typical Crystal Ball crystal.
are arranged in a spherical shell with an inner radius of 25.3 cm and an outer radius of 66.0 cm.The hygroscopic NaI is housed in two hermetically sealed evacuated hemispheres. The CBgeometry is based on that of an icosahedron. Each of the 20 triangular faces (major triangles)is divided into four (minor triangles), each consisting of nine separate crystals. Each crystal isshaped like a truncated triangular pyramid, 40.6 cm high, pointing towards the center of theBall. The sides on the inner end are 5.1 cm long and 12.7 cm on the far end, see Fig. H2.1.Each crystal is individually wrapped in reflector paper and aluminized mylar; it is viewedby a separate 5.1 cm diameter SRC L50 B01 photomultiplier, selected for linearity over awide dynamic range. The phototube is separated from the crystal by a glass window and a5 cm air gap. The crystals have been stacked so as to form two mechanically separate top andbottom hemispheres. The boundary between the two hemispheres of ∼ 0.8 cm is called theequator region and consists of two 1.6 mm stainless steel plates separated by 5 mm of air.This introduces an inactive space amounting to 1.6% of the solid angle. The inner wall of thehemisphere is 1.5 mm stainless steel or 0.09 r.l. The Ball has an entrance and exit openingfor the beam (±200 ) which results in a loss of 4.4% of acceptance. Electromagnetic showersin the spectrometer are measured with an energy resolution σE/E ∼ 1.7%/(E (GeV))0.4; theangular resolution for photon showers at energies of 0.05−0.5 GeV is σθ = 2–3 in the polarangle and σφ = 2/sin θ in the azimuthal angle. The CB detects neutrons with an efficiencyof ∼ 35% at En = 150 MeV. The thickness of the individual NaI counter is sufficient to stop233 MeV µ±, 240 MeV π±, 341 MeV K±, and 425 MeV protons.
H2.2.1 Crystal Ball Installation at MAMI
Upon arrival at Mainz the detector was stored in the MAMI experimental hall 8.5 meters be-low ground. The detector resided in the temporary dry room under constant temperature and

SUBPROJECT H2: MESONIC STRUCTURE OF THE NUCLEON 127
humidity. The stability of the environment is controlled by the CB environmental system thatwas setup within a few hours upon CB arrival at Mainz. The real-time CB environmental dataare available online at http://wwwa2.kph.uni-mainz.de/cb/actual/graphs/. The data show ex-ceptional temperature stability inside the experimental area (±1C).The hygroscopic NaI is housed in two hermetically sealed evacuated hemispheres. The lowpressure (∼ 50 torr) inside the hemispheres is necessary to insure the mechanical stability of thehemispheres and provide a low pressure of water vapor inside the shell. During the detector’sstay in BNL the bottom hemisphere experienced a relatively high leak rate: ∼ 2− 5 torr/day.The leaks have been detected in Mainz using a helium leak detector and sealed. At present theleaking from both hemispheres does not exceed 0.5 torr/week. In February-March of 2003 allCB crystals were visually inspected. The inspection did not indicate a significant decline inquality of the crystals. In April-May 2003 all 672 CB PMTs were tested and installed on thehemispheres. The second round experiments with the Crystal Ball at MAMI will utilize a new
10 cm
Figure H2.2: The Crystal Ball detector and TAPS as forward wall.

128 CHAPTER 2. REPORT ON THE PROJECTS
Bonn-type frozen-spin polarized target. This requires the Crystal Ball frame to be movable inorder to polarize the target material. The new potentially movable Crystal Ball frame has beendesigned, fabricated and assembled. The frame allows adjustment of the hemisphere positionin all projections and the upper hemisphere to be lifted to about 1 meter above the beam levelallowing installation and maintenance of the central tracker and the particle ID counter. Themoveable frame will be installed on the rails for the second stage of the experiment.The new fast readout electronic has been installed next to the new CB frame in the experi-mental hall. Each CB crystal is equipped with an active splitter, a discriminator with rise-timecompensation, a multihit TDC, and a flash (sampling) ADC. The data will be readout via VMEbus. The electronics is described in detail below. The electronics is connected to the CB PMT’svia twisted pair shielded cables. All 720 cables (plus a few extra) have been modified. The ca-bles were shortened and rearranged in groups of 8. The new mapping allows the most efficientuse of all electronic channels. The Crystal Ball also got four new high-current power supplies.The power supplies can be controlled remotely via I2C protocol.In early October 2003 the Crystal Ball was installed in the new frame at the photon beam line.A first beam run with the detector was performed at the end of October 2003 to study thebackground rates for different beam intensities. Especially the influence of the electron beam,which had to be moved from the new MAMI-C hall closer to the A2 experimental area, wasinvestigated. The first test measurements show that the electron beam dump is dominating thehall background and the single rate in the ball, but not limiting it.
H2.2.2 New Crystal Ball Electronics for the MAMI Experiments
The original Crystal Ball TTL electronics was developed in late 70s - early 80s [6]. It servedreliably for almost 20 years in three major experimental programs at SLAC, DESY and BNL.The new high precision, high rate experiments at MAMI require a new fast readout systemoptimized for high resolution photon spectroscopy with NaI signals in heavy background con-ditions. The new Crystal Ball electronics consist of the following major components: an active
Figure H2.3: The upper curve shows an example of the NaI pulse shape from a single Crystal Ballcrystal.
splitter, a flash (sampling) ADC, the discriminator with rise-time compensation, a multi-hitTDC, the cluster multiplicity logic and 32-bit scalers. The layout of the components is shownin Fig. H2.4.

SUBPROJECT H2: MESONIC STRUCTURE OF THE NUCLEON 129
(512
Cha
nnel
s)
(512
Cha
nnel
s)
(512
Cha
nnel
s)
MWPC Tracker
Particle ID&
CB NaI(Tl)TOP
Hemisphere
CAMACStand AloneTrigger
(768
Cha
nnel
s)
(768
Cha
nnel
s)
TC
S
(384
Cha
n.)
TAGGER
(384
Cha
n.)
MASTERCRATE
CAMACTrigger
VIC Bus
32−bit ECLbus
ControlFASTBUS
Trigger Control Fiber Optic
Fibre OpticControl/Data
Fibre OpticControl/Data
1 Gbit Fiber ENET (dedicated data)
100 Mbit ENET (A2 Hall Net)
CA
MA
C B
ranc
h
Start Readout
CB NaI(Tl)
HemisphereBOTTOM
MW
PC
& P
ID
MW
PC
& P
ID
4 C
AT
CH
TD
C
4 C
AT
CH
Sca
ler
MW
PC
& P
ID
8 F
IAD
C−
64 Q
DC
PP
C C
PU
VIC
8250
FA
ST
BU
S S
TR
200
SC
ALE
RS
Sta
tion
15−
25
Sta
tion
1−6
LAT
CH
ES
Seg
. Ext
end,
Sta
tion
13
FA
ST
BU
S S
TR
136D
FA
ST
BU
S M
AS
TE
R
TD
C’s
FA
ST
BU
S 1
0c6
Sta
tion
8−18
Seg
. Ext
end,
Sta
tion
4
1821
SM
I (N
o. 9
)
HS
M81
70
MAINZ A2 DAQ Electronics Layout 2003/4
FASTBUS
CB
−N
aI +
Trig
ger
6 C
AT
CH
TD
C
6 C
AT
CH
Sca
ler
CB
−N
aI +
Trig
ger
PP
C C
PU
VM
E−
SM
IIn
terf
ace
32−
Bit
CB
D82
10C
AM
AC
Br.
VIC
8250
VIC
Sla
ve
PP
C C
PU
CB
D82
10
PP
C C
PU
VIC
8250
VIC
Sla
ve
SG
−A
DC
Ctr
l3
GE
SIC
A
SG
−A
DC
12
VIC
MA
ST
ER
FASTBUS Segment ExtendFrom Tagger Focal Plane352 ECL Logic Signals
PP
C C
PU
VIC
8250
VIC
Sla
ve
SG
−A
DC
Ctr
l3
GE
SIC
A
SG
−A
DC
12FASTBUS Data
VMEbus 6U
VMEbus 9U
VMEbus 6U
J.R.M.Annand, 9th Sept. 2003Update
Figure H2.4: The electronic layout for the CB@MAMI experiments.
H2.2.3 The Active Splitter
The active splitter accepts the differential signal from a single Crystal Ball detector and pro-duces two 1:1 analog outputs. One of the outputs is used for the CB discriminator and thesecond via 300 nsec delay chip goes to the CB ADC. The 300 nsec delay can be bypassed toavoid the signal attenuation. Each splitter has inputs for 16 crystals and can be connected tothe discriminator and to the ADC via 16-wire ribbon coax cable. The splitter also produces ananalog sum all of the 16 inputs and four sums for groups of four crystals. Those sums can beused for fast triggering.

130 CHAPTER 2. REPORT ON THE PROJECTS
H2.2.4 The Flash ADC
A typical NaI pulse is shown in Fig. H2.3. The shape of the pulse carries all physical informa-tion that can possibly be extracted from the detector. The integral of the pulse is proportional tothe energy deposited in the detector, the rise time determines the timing, the part of the signalbefore the main pulse can be used to calculate the residual light in the detector, a deviationof the pulse from a “standard” shape may indicate an overlap of two hits in the detector. Acareful analysis of the pulse shape on event by event basis allows to achieve the best possibleenergy and timing resolution. Such analysis is however impossible with conventional analog-to-digital converters (ADC) which are commonly used in particle physics experiments. TheADC normally integrates the pulse over a time of order 1 µsec providing only an integratedvalue. Multi-hit time-to-digital converters (TDC) are usually used together with the integratingADC to detect overlapping events. This method is not very efficient for pulses with overlap lessthan 500 nsec due to technical difficulties of detecting the later pulse on the “tail” of the firstone. The ultimate solution to this problem is the “flash” ADC (FADC) - a digitizer which sam-ples a pulse with a relatively high frequency and stores the samples in a pipe-like memory forfurther readout and analysis. In the recent past such solution was not practical because of thehigh costs of the digitizer and a readout interface. The interface must be very fast because theamount of information from FADC is orders of magnitude larger compared to the integratingADC’s. A relatively inexpensive FADC’s became feasible after the APV 25 front-end digitizerchip has been developed in the Central Laboratory of the Research Councils (CERN) for CMSexperiments at LHC. The APV 25 is an application specific integrated circuit that features128 channels where each has a 192 samples deep analog pipe line. The sampling frequency ofthe APV is 40 MHz. The new Crystal Ball flash ADC build around the chip is 32 channels 6UVME unit with 10 bit-per-sample resolution and 80 MHz maximum sampling rate. Each FADCchannel may store up to 30K samples in the internal memory for later readout. The part of thememory that has to be read is determined by the FADC firmware and can be re-programmed.The FADC do not use VME interface and must be communicated using GeSiCA VME readoutunit via fast optical link. The GeSiCA formats the FADC data into a data buffer. In the originalCERN design the GeSiCA’s data buffer is readout via extremely fast (about 250 MB/sec) S-Link. The fast S-Link readout is not feasible at the first stage of the CB@MAMI experiment.The GeSiCA will be read via relatively slow VME bus instead. This applies a limit to howmuch data can be readout from the FADC. We will limit the amount of information from theFADC by reading only three integrated values related to the signal. The first value proportionalto the total energy deposited in the detector will integrate the main pulse over about 1 µsec. Thesecond sum will calculate “pedestal” over about 100 nsec before the main. The pedestal willbe subtracted from the energy sum later in the analysis. The third sum will integrate energyover first 300 nsec of the pulse. Ratio between first and the third sum will be used to identifyoverlapping events. All three sums will be calculated very fast inside the FADC firmware. Thewidth of the sums and their relative timing are programmable in 12.5 nsec steps.
H2.2.5 The Multi-Hit TDC and 32 Bit Scalers
The new electronics also includes multi-hit, long range TDC developed at the Freiburg Uni-versity for the CERN COMPASS experiment. The 128 channels 9U VME TDC unit is buildaround the F1 digitizing chip developed in Freiburg. The TDC features 75 psec resolution for

SUBPROJECT H2: MESONIC STRUCTURE OF THE NUCLEON 131
high, and 150 psec resolution for low the resolution mode. The 16-bit dynamic range provides4.9 msec full scale for the high resolution mode. Each CB crystal will be equipped also witha 32-bits scaler. The scalers will be used for fast online diagnostic in the process of the exper-iment. Details on the features of the TDC and their technical specifications can be found inRef. [7].
H2.2.6 The Discriminator and Cluster Multiplicity Logic
The discriminator we will use was designed by the Uppsala University (Sweden). The 16-channel, low threshold discriminator features: two thresholds capability, on-board input signalamplifier, custom defined logical signal analysis, on-board pattern unit, digital threshold con-trol and digital channel masking control. The discriminator will be used in conjunction withpattern recognition logic which potentially allows fast clusters counting in the detector. Detailsof the discriminator and the logic can be found in Ref. [8]
H2.2.7 The TAPS Forward Wall
In the combined Crystal Ball/TAPS–setup, TAPS [9] will be implemented as a Forward Wall ata distance of 1.8 m after the CB target. It covers the forward tunnel of the Crystal Ball (20 withrespect to the beam direction). In its present configuration, TAPS consists of 528 individualBaF2 detectors which are hexagonally shaped with an inner diameter of 59 mm and a length of250 mm (corresponding to 12 radiation lengths). The thickness of the detector is sufficient tostop 180 MeV π±, 280 MeV K±, and 360 MeV protons. Each detector has its own 5 mm plasticscintillator (NE102A) in front which serves as a charged particle veto detector (Fig. H2.5).BaF2 has two scintillation light components with very different decay constants τs=0.76 nsand τl=620 ns. The relative light yield which depends on the ionization density of the particleenables a pulse shape analysis to discriminate between various particle species. The excellenttime resolution of the TAPS detector of FWHM=0.5 ns and the long distance to the target allowan efficient TOF measurement for further particle identification. The relative energy calibration(matching of the individual detectors) is performed by measuring minimum ionizing cosmicray muons, while the absolute calibration is done using the invariant mass of the π → 2γ andη → 2γ decays in an iterative method for each crystal. The experimentally obtained invariantmass resolution for π mesons is 19 MeV FWHM and for the η meson (η → 2γ) the FWHMis 45 MeV. Altogether, the detector constitutes a good detection system for the measurementof multi-photon events as well as protons or charged pions. Further specifications of the TAPSdetector are listed in Tab. H2.1.
[1] E.D. Bloom and C.W. Peck, Ann. Rev. Nucl. Sci. 33, 143 (1983).
[2] H. Marsiske et al., Phys. Rev. D 41, 3324 (1990).
[3] D. Antreasyan et al., Phys. Rev. D 36, 2633 (1987).
[4] J.E. Gaiser et al., Phys. Rev. D 34, 711 (1986).
[5] M. Oreglia et al., Phys. Rev. D 25, 2259 (1982).
[6] M. Clajus, Crystal Ball Note CB-95-002 (1995)http://bmkn8.physics.ucla.edu/Crystalball/.

132 CHAPTER 2. REPORT ON THE PROJECTS
Figure H2.5: An individual TAPS detector.
Figure H2.6: The TAPS Forward Wall.

SUBPROJECT H2: MESONIC STRUCTURE OF THE NUCLEON 133
Figure H2.7: Crystal Ball and TAPS at the photon beam line.
Figure H2.8: Crystal Ball and TAPS at the photon beam line.

134 CHAPTER 2. REPORT ON THE PROJECTS
TAPS
distance to target 180 cmcoverage (7 crystals beam hole) 4 - 20
coverage (1 crystal beam hole) 2 - 20
angular resolution of photons (300 MeV, 1.8 m) FWHM 0.7
energy resolution [10] σEγ
= 0.79%√Eγ
+1.8%
invariant mass resolution π FWHM 19 MeVinvariant mass resolution η FWHM 45 MeVtime resolution (experiment) FWHM 0.5 nsneutron efficiency [11] 25 %
Table H2.1: Specification of the TAPS detector.
[7] H. Fischer et al., “CATCH User Manual”, COMPASS-2001 notehttp://hpfr02.physik.uni-freiburg.de/projects/compass/electronics/.
[8] P. Marciniewski, “Fast Digital Trigger System for Experiments in High Energy Physics”,PhD thesis, Uppsala University avaliable at http://www.tsl.uu.se/∼pavel/.
[9] R. Novotny, IEEE Trans. Nucl. Sci. 38 (1991) 379-385.
[10] A. R. Gabler, NIM A 346 (1994) 168-176.
[11] M. Kotulla, Dipl. Thesis (1997), Justus Liebig Universitat Giessen.
H2.3 Threshold Mesonproduction
H2.3.1 Threshold π0 photo- and electroproduction in a meson-exchange model
G.Y. CHEN1, D. DRECHSEL, S.S. KAMALOV2, L. TIATOR, S.N. YANG1
1 Department of Physics, National Taiwan University, Taipei 10617, Taiwan2 JINR Dubna, 141980 Moscow Region, Russia
Meson-exchange models (MEM’s), as in ChPT, also start from an effective chiral Lagrangian.However, they differ from ChPT in the approach to calculate the scattering amplitudes. InChPT, crossing symmetry is maintained in the perturbative field-theoretic calculation, and theagreement between its predictions and the data is expected as long as the series converges. InMEM’s, the effective Lagrangian is used in the construction of potential for use in the scatteringequation. The solutions of the scattering equation include rescattering effects to all orders andhence unitarity is ensured, while crossing symmetry is violated. Such models [1, 2, 3] havebeen able to provide a good description of πN scattering lengths and phase shifts in S-, P-, andD-waves up to 600 MeV pion laboratory kinetic energy. For further details see [4].
Here we present the predictions of the Dubna-Mainz-Taipei (DMT) dynamical model, based onmeson-exchange picture, which we recently developed in Ref. [5] for the threshold e.m. pionproduction and compare them with the recent experimental data [6, 7, 8, 9, 10, 11] for the S- andP-wave multipoles and cross sections, and with the results of ChPT [12]. In our DMT model,

SUBPROJECT H2: MESONIC STRUCTURE OF THE NUCLEON 135
contributions which are related to the excitation of resonances are considered phenomenolog-ically using standard Breit-Wigner forms. Such an approach gives a good description of e.m.pion production up to the second resonance region [13].
In the dynamical model for e.m. pion production, the t-matrix is given as
tγπ(E) = vγπ + vγπg0(E) tπN(E) , (H2.1)
where vγπ is the γπ transition potential, g0 and tπN are the πN free propagator and t−matrix, re-spectively, and E is the total energy in the c.m. frame. In the present calculation, tπN is obtainedin a meson-exchange πN model constructed in the Bethe-Salpeter formalism and solved withinCooper-Jennings reduction scheme. Both vπN and vγπ are derived from an effective Lagrangiancontaining Born terms as well as ρ- and ω-exchange in the t-channel [14]. For pion electropro-duction we restore gauge invariance by the substitution, Jµ → Jµ − kµ(k · J/k2), where Jµ is theelectromagnetic current corresponding to the background contribution of vγπ.
For the physical multipoles in channel α = l, j, I, Eq. (H2.1) gives
tα(qE ,k) = exp (iδα) cosδα
[
vα(qE ,k)+PZ
0dq′
Rα(qE ,q′)vα(q′,k)E(qE)−E(q′)
]
, (H2.2)
where δα and Rα are the πN phase shift and reaction matrix, in channel α, respectively, qE
is the pion on-shell momentum and k =| k | the photon momentum. In order to ensure theconvergence of the principal value integral, we introduce a dipole-like off-shell form factorcharacterizing the finite range aspect of the potential with Λ = 440 MeV.
For π0 photoproduction, we calculate the multipole E0+ near threshold by solving the coupledchannels equation within a basis with physical pion and nucleon masses. Results for ReE0+
are shown in Fig. H2.9. One sees that our results (solid curve) agree well with the experimentaldata and ChPT calculations (long dash-dotted curve) [12]. The FSI contributions from theelastic (π0 p) and charge exchange (π+n) channels, are shown by the short dashed and shortdash-dotted curves, respectively, while the dotted curve corresponds to the LET results, i.e.,without the inclusion of FSI. Our results clearly indicate that practically all of the FSI effectsoriginate from the π+n channel. Note that the main contribution stems from the principal valueintegral of Eq. (H2.2).
In the approach considered above, tπN contains the effect of πN rescattering to all orders. How-ever, we have found that only the first order rescattering contribution, i.e. the 1-loop diagram,is important. This result is obtained by replacing tπN in Eq. (H2.1) by the vπN . As can be seenin Fig. H2.9, the thus obtained results given by the long-dashed curve, differ from the fullcalculation by 5% only. This indicates that the 1-loop calculation in ChPT could be a reliableapproximation for π0 production in the threshold region.
Similar results are also obtained for the π0 photoproduction on neutron where 1-loop contribu-tion with π−p intermediate states is found to be large. In Table H2.2, the results obtained upto tree, 1-loop, and 2-loop approximations for all four possible pion photoproduction channelsare listed and compared to the experiments and ChPT results. We see that for π0 productionfrom both proton and neutron, it is necessary to include one-loop contribution while tree ap-proximation is sufficient for the charged pion productions.

136 CHAPTER 2. REPORT ON THE PROJECTS
Figure H2.9: ReE0+ for γp → π0 p. Notations are given in the text. Data points are from (4) [8], (•) [7],and () [11].
Tree 1-loop 2-loop Full ChPT Expπ0 p −2.26 −1.06 −1.01 −1.00 −1.1 −1.33±0.11π+n 27.72 28.62 28.82 28.85 28.2± 0.6 28.3± 0.3π0n 0.46 2.09 2.15 2.18 2.13π−p −31.65 −32.98 −33.27 −33.31 −32.7±0.6 −31.8±1.9
Table H2.2: Threshold values of E0+ (10−3/mπ) for different channels predicted by DMT
In Fig. H2.10, we compare the predictions of our model for the differential cross section withrecent photoproduction data from Mainz [8, 11]. The dotted and solid curves are obtained with-out and with FSI effects, respectively. It is seen that both off-shell pion rescattering and cuspeffects substantially improve the agreement with the data. This indicates that our model givesreliable predictions also for the threshold behaviour of the P-waves without any additional ar-bitrary parameters. A detailed comparison [4] showed that our predictions for P-waves are ingood overall agreement with the ChPT predictions [12] and the experimental values extractedfrom recent TAPS polarization measurements [11]. However, there is a 15%−20% differencein P3 = 2M1+ +M1− which leads to an underestimation of our result for the photon asymmetry.Note that, in contrast to our model, P3 is essentially determined by a low energy constant inChPT.
Pion electroproduction provides us with information on the Q2 dependence of the transverseE0+ and longitudinal L0+ multipoles in the threshold region. It is known that at threshold, theQ2 dependence is given mainly by the Born plus vector meson contributions in vγπ, as de-scribed in Ref. [14]. In Fig. H2.11 we show our results for the cusp and FSI effects in the E0+
and L0+ multipoles for π0 electroproduction at Q2 = 0.1 (GeV/c)2, along with the results ofthe multipole analysis from NIKHEF [9] and Mainz [10]. Note that results of both groups wereobtained using the P-wave predictions given by ChPT. However, there exist substantial differ-ences between the P-wave predictions of ChPT and DMT model at finite Q2. To understandthe consequence of these differences, we have made a new analysis of the Mainz data [10] forthe differential cross sections, using DMT prediction for the P-wave multipoles instead. TheS-wave multipoles extracted this way are also shown in Fig. H2.11 by solid circles. We see thatthe results of such a new analysis give a E0+ multipole closer to the NIKHEF data and in better

SUBPROJECT H2: MESONIC STRUCTURE OF THE NUCLEON 137
Figure H2.10: Differential cross sections for γp →π0 p. For notations, see the text. Data points arefrom (•) [8] and () [11].
Figure H2.11: ReE0+ and ReL0+ at Q2=0.1(GeV/c)2. Notations same as in Fig. H2.10. Datapoints are from () [9] and (4) [10].
agreement with our dynamical model prediction. However, the results of our new analysis forthe longitudinal L0+ multipole stay practically unchanged from the values found in the previ-ous analyses. Note that the dynamical model prediction for L0+ again agrees much better withthe NIKHEF data.
In Fig. H2.12, DMT model predictions (dashed curves) are compared with the Mainz experi-mental data [10] for the unpolarized cross sections dσ/dΩ, and for the longitudinal-transversecross section dσT L/dΩ. Overall, the agreement is good. The solid curves are the results of ourbest fit at fixed energies (local fit) obtained by varying only the E0+ and L0+ multipoles. Wehave found that the differences between the solid and dashed curves in Fig. H2.12 are mostlydue to the difference in the L0+ multipole (see also Fig. H2.11).
Finally, in Fig. H2.13 we compare the predictions of our DMT model, the results of the isobarmodel MAID and the ChPT calculations of [12] with recent experimental data at c.m. energiesup to 40 MeV above threshold, where nonresonant P-waves play the dominant role. At thehighest energies chiral perturbation theory deviates quite strongly and the dynamical modelgives a very good description of the data. For longitudinally polarized electrons the coincidencecross section is given by five terms, where four of them can be separated by a measurementof the azimuthal φ dependence. The longitudinal and transverse cross sections can only beseparated by a Rosenbluth separation. Cross sections and asymmetry are defined as
dσv
dΩ=
dσT
dΩ+ ε
dσL
dΩ(H2.3)
+√
2ε(1+ ε)dσLT
dΩcosφ+ ε
dσTT
dΩcos 2φ+h
√
2ε(1− ε)dσLT ′
dΩsin φ ,

138 CHAPTER 2. REPORT ON THE PROJECTS
Figure H2.12: dσ/dΩ and dσT L/dΩ at Q2=0.1 (GeV/c)2 and ε = 0.713, at ∆W =W −W π0 pthr = 0.5MeV .
The dashed curves show the DMT predictions and the solid lines are the result of our best fit to the dataas escribed in the text. Data points are from Ref. [10].
σ0 =dσT
dΩ+ ε
dσL
dΩ, (H2.4)
ALT ′ =√
ω2/Q2
√
2ε(1− ε) σLT ′
σT + ε σL − ε σTT. (H2.5)
In summary, we have shown that within a meson-exchange dynamical model [5], one is able todescribe pion photo- and electroproduction in the threshold region in good agreement with thedata. The model has been demonstrated to give a good description of most of the existing pionelectromagnetic production data up to the second resonance region [13]. The success of such amodel at intermediate energies is perhaps not surprising since unitarity plays an important rolethere. However, it is not a priori clear that our model should also work well near threshold,even though we do start from an effective chiral Lagrangian. In principle, crossing symmetryis violated and the well-defined power counting scheme in ChPT is lost by rescattering. On theother hand, MEM’s [3] have also been shown to give a good description of low energy πN data,in addition to an excellent agreement with the data at higher energies. It is therefore assuringthat similar success can also be achieved for the pion EM production. Finally, we found thatthe effects of FSI in the threshold region and in the case of π0 production, are nearly saturatedby the single rescattering term. Therefore, the existing one-loop calculations in ChPT can beexpected to give a good approximation to threshold π0 production.
[1] C.C. Lee, S.N. Yang, and T.-S.H. Lee, J. Phys. G17 (1991) L131.
[2] T. Sato and T.-S.H. Lee, Phys. Rev. C54 (1996) 2660.
[3] V. Pascalutsa and J. A. Tjon, Phys. Rev. C61 (2000) 054003.
[4] S.S. Kamalov et al., Phys. Lett. B522 (2001) 27.
[5] S.S. Kamalov and S. N. Yang, Phys. Rev. Lett. 83 (1999) 4494; S. S. Kamalov et al., Phys.Rev. C64 (2001) 032201 (R).
[6] R. Beck et al., Phys. Rev. Lett. 65 (1990) 1841.
[7] J.C. Bergstrom et al., Phys. Rev. C55 (1997) 2016.

SUBPROJECT H2: MESONIC STRUCTURE OF THE NUCLEON 139
Figure H2.13: Differential cross sections and electron beam asymmetry ALT ′ for p(~e,e′p)π0 near thresh-old at four-momentum transfer Q2=0.05 (GeV/c)2 and virtual photon polarization ε = 0.93. The inci-dent electron beam energy is 854.5 MeV and the pion scattering angle is 90o. The solid and dash-dottedcurves show our results of the dynamical model DMT and the unitary isobar model MAID, respectively.The dotted curves show the results of ChPT [12]. The experimental data are from Mainz [15].
[8] M. Fuchs et al., Phys. Lett. B 368 (1996) 20.
[9] H.B. van den Brink et al., Phys. Rev. Lett. 74 (1995) 3561.
[10] M.O. Distler et al., Phys. Rev. Lett. 80 (1998) 2294.
[11] A. Schmidt et al., Phys. Rev. Lett. 87 (2001) 232501.
[12] V. Bernard, N. Kaiser, U.-G. Meißner, Z. Phys. C70 (1996) 483;Nucl. Phys. A607 (1996) 379; A633 (1998) 695(E).
[13] S.S. Kamalov et al., “The Physics of Excited Nucleons”, Eds. D. Drechsel and L. Tiator,World Scientific, Singapore, 2001, p. 197.
[14] D. Drechsel, O. Hanstein, S.S. Kamalov, and L. Tiator, Nucl. Phys. A645 (1999) 145.
[15] M. Weis, “Elektroproduktion neutraler Pionen und Entwicklung eines Kontroll- undSteuerungssystems fur die Drei-Spektrometer-Anlage am Mainzer Mikrotron”,Dissertation, Mainz, 2003.

140 CHAPTER 2. REPORT ON THE PROJECTS
H2.3.2 Dispersion Relation Analysis of Neutral Pion Photo- and Electroproduction atThreshold using the MAID and SAID solutions
D. DRECHSEL, S.S. KAMALOV1, L. TIATOR, R.A. ARNDT2, C. BENNHOLD2,I.I. STRAKOVSKY2 , R.L. WORKMAN2
1 JINR Dubna, 141980 Moscow Region, Russia2 Department of Physics, The George Washington University, Washington, D.C., USA
Threshold pion photo- and electroproduction have been calculated with fixed-t dispersion rela-tions. Unlike previous work for photoproduction following the method of Omnes and Mushka-shevili, we have used the imaginary parts of the multipoles of the unitary isobar model MAIDand the phenomenological partial-wave analysis SAID as input to calculate the dispersion in-tegrals.
Unitarity, crossing symmetry, Lorentz invariance and gauge invariance are all fulfilled by thedispersion relations. Especially crossing symmetry can only be partially fulfilled in model cal-culations, even field-theoretical lagrangians violate crossing symmetry when energy-dependentwidths for nucleon resonances are introduced. Rather than fitting to the threshold data, we pre-fer to use dispersion relations whose input are models fitted to data in the resonance region,where more data is available. Further details can be found in Ref. [1]
Figure H2.14: The E0+ multipole for the reaction γp → π0 p. The dashed and dash-dotted curves showthe imaginary and real parts, respectively, as obtained from the MAID2002 (left panel) and SAID solu-tion SM02 with a modified imaginary part as explained in the text(right panel). The solid curves are thepredictions for the real parts obtained with the dispersion relations. The data points are the result of themultipole analyses from Ref. [4](4), Ref. [5](•), and Ref. [6]().
For pion photoproduction we obtain very good agreement with the threshold multipoles ob-tained from experimental analyses. Both the cusp effect and pion-loop effects are well de-scribed. The differences between the MAID and SAID inputs play only a minor role, and revealthe small systematic uncertainties in such a dispersion approach. We also find good agreementwith the results of ChPT for S- and P- waves, except for the quantity P2
2 −P23 . This discrepancy

SUBPROJECT H2: MESONIC STRUCTURE OF THE NUCLEON 141
was already observed in the previous dispersion analysis of Hanstein et al. [2] and relates to avery delicate cancelation among two large P-wave amplitudes.
Fig. H2.14 compares the energy dependence of the E0+ amplitude, as obtained, on the onehand, directly from the MAID and SAID solutions (dash-dotted curves) and, on the other hand,by use of the dispersion relations, with the imaginary parts of the amplitudes as input takenfrom the MAID and SAID solutions (solid curves). We clearly see the Wigner cusp effectappearing in the DR solutions due to the infinite derivative of ImE0+ (dashed curves) at thecharged pion threshold. In the MAID solution (dash-dotted curve), the cusp effect is the resultof the strong coupling to the π+ channel taken into account by the K-matrix approximation [3].The SAID solution does not include this effect.
Figure H2.15: The E0+ (left panel) and L0+ (right panel) multipoles for ep → e′π0 p at Q2=0.1 (GeV/c)2
as a function of ∆W = W −Wthr. The dashed and dash-dotted curves are the imaginary and real parts,respectively, for the the MAID2002 solution. The solid curves are the predictions for the real partsobtained with the dispersion relations. The dotted curves show the results of ChPT [10]. The data pointsare the result of the analyses from Ref. [8](), Ref. [7](4) and Ref. [3](•).
The threshold behavior of the E0+ and L0+ multipoles at Q2 = 0.1 (GeV/c)2 is shown inFig. H2.15. We point out the much smaller cusp effect in the L0+, as compared to the E0+
multipole, due to the smaller imaginary part of L0+. The fixed-t DR results are in good agree-ment with the results of the analysis of Ref. [7]. On the other hand, the real parts of the E0+
and L0+ multipoles obtained from the MAID solution, are closer to the results of Refs. [3, 8].However, as discussed in Refs. [3] and [9], the extracted results for the S waves at finite Q2
strongly depend on the assumptions used for the P-wave contributions. This is especially truefor the E0+ multipole. For example, at Q2 = 0.1 (GeV/c)2 the differences in the P waves usedby various groups lead to quite different threshold values for the E0+, namely 1.96±0.33 [7],2.28±0.36 [3], and 0.58±0.18 [9]. Clearly, these differences in the analyses must be resolvedbefore a comparison with theoretical predictions can be meaningful. Note that we find signifi-cant dispersion corrections for both multipoles at finite Q2.
Fig. H2.16 shows the Q2 dependence for several S-wave multipoles and P-wave multipolecombinations and compares our results with the results of the analyses of Refs. [9, 7]. A number

142 CHAPTER 2. REPORT ON THE PROJECTS
Figure H2.16: The S– and P–wave multipoles E0+, L0+, P1 = 3E1+ + M1+ −M1−, P4 = 4L1+ + L1−,P5 = L1−−2L1+, and P2
23 = (P22 +P2
3 )/2 for the reaction ep → e′π0 p at threshold as a function of Q2.The dash-dotted and solid curves are the MAID2002 solution and the prediction of dispersion relations,respectively. The dotted curves show the results of ChPT [10]. The data points are the results of theanalyses from Ref. [7](4) Ref. [9]() and Ref. [6](•).

SUBPROJECT H2: MESONIC STRUCTURE OF THE NUCLEON 143
of interesting features emerge. In general, the DR results for the transverse multipoles areconsistent with the corresponding MAID solution. For the L0+ multipole and the longitudinalP-wave combinations P4 and P5, strong dispersion corrections appear at low Q2. Our dispersionresults are in agreement with the results from ChPT below Q2 < 0.05 (GeV/c)2 in the case ofthe E0+ multipole and the P1 combination but differ significantly for the L0+ multipole and theamplitudes P2
23 = (P22 +P2
3 )/2, P4 = 4L1+ +L1−, and P5 = L1−−2L1+. This may reflect the factthat some of the ChPT low-energy constants where fitted to electroproduction threshold datawhile the MAID solutions are constrained by data in the resonance sector. Just as in Fig. H2.15,the experimental points shown have to be understood as the result of different model-dependentanalyses techniques.
The situation for pion electroproduction reflects a larger uncertainty, both in theory and ex-periment. Much less data are available which leads to a model dependence in the extractionof the multipoles at finite Q2. Since the electroproduction coincidence cross section cannotbe completely separated, a model independent analysis as in the photoproduction case is notyet possible, making any comparison with theory difficult. We emphasize that our dispersiontheoretical calculation has the advantage that most of the input for the fixed-t dispersion rela-tion comes from the magnetic excitation of the ∆ resonance which is very well known evenfor pion electroproduction. Future experiments will hopefully remove the model dependencein the extraction of the multipole amplitudes and allow an unambiguous comparison with thepredictions from dispersion relations.
[1] S.S. Kamalov, L. Tiator, D. Drechsel, R.A. Arndt, C. Bennhold, I.I. Strakovsky,R.L. Workman, Phys. Rev. C 66, 065206 (2002).
[2] O. Hanstein, D. Drechsel, and L. Tiator, Nucl. Phys. A632, 561 (1998).
[3] S.S. Kamalov, G.Y. Chen, S.N. Yang, D. Drechsel, and L. Tiator, Phys. Lett. B522, 27(2001).
[4] M. Fuchs et al., Phys. Lett. B368, 20 (1996).
[5] J.C. Bergstrom et al. Phys. Rev. C 53, 1052 (1996), ibid C 55, 2016 (1997).
[6] A. Schmidt et al., Phys. Rev. Lett. 87, 232501 (2001).
[7] M.O. Distler et al., Phys. Rev. Lett. 80, 2294 (1998).
[8] H.B. van den Brink et al., Nucl. Phys. A612, 391 (1997).
[9] H. Merkel et al., Phys. Rev. Lett. 88, 012301 (2002).
[10] V. Bernard, N. Kaiser, and Ulf-G. Meissner, Z. Phys. C 70, 483 (1996); Nucl. Phys.A607, 379 (1996), A633, 695 (1998) (E).
H2.3.3 Double π0 Photoproduction off the Proton at Threshold
J. AHRENS, J.R.M. ANNAND1, R. BECK, G. CASELOTTI, L.S. FOG1, D. HORNIDGE,S. JANSSEN2 , M. Kotulla2 , B. KRUSCHE3, J.C. MCGEORGE1 , I.J.D. MCGREGOR1,K. MENGEL2 , J.G. MESSCHENDORP2 , V. METAG2 , R. NOVOTNY2, M. PFEIFFER2 , M.ROST, S. SACK2, R. SANDERSON1, S. SCHADMAND2, D.P. WATTS1

144 CHAPTER 2. REPORT ON THE PROJECTS
1Department of Physics and Astronomy, University of Glasgow, Glasgow G128QQ, UK2II. Physikalisches Institut, Universit at Gießen, D–35392 Gießen, Germany3Department of Physics and Astronomy, University of Basel, CH-4056 Basel (Switzerland)
From the study of ππ production processes, complementary information to the study of thesingle pion photoproduction channels can be gained. The extention of ChPT to ππ photo- andelectroproduction has led to the finding that the cross section for final states with two neutralpions is dramatically enhanced due to chiral (pion) loops [1] which appear in leading (nonvanishing) order q3. This is a counter-intuitive result, since in the case of single pion productionthe cross sections for charged pions are considerably larger than those with neutral pions in thefinal state. This situation is not changed when the ChPT calculation is extended by evaluatingall next-to-leading order terms up to order M2
π in the threshold amplitude [3]. Exploring thissituation in more detail, the two pion channel exhibts the following properties [3]: Born typecontributions start at order Mπ and are very small. Tree diagrams up to order q3 are zero due tothreshold selection rules or pairwise cancellation. Only at order q4 do tree terms proportionalto the low energy constants ci give a moderate contribution. In a microscopic picture thesetree terms (∼ ci) subsume all s-, t- and u-channel resonances in the π0 p scattering amplitude(e.g. the ∆(1232)). The largest resonance contribution at order M2
π comes from the P11(1440)resonance via the N∗Nππ s-wave vertex. Possible double ∆ graphs as well as loop diagramscontaining a photon coupling to a K+ −Σ/Λ pair were estimated and found to be negligible.Fourth order loop diagrams (q4) provide only a moderate contribution. All the coefficientsof the resulting threshold amplitude were taken from the literature, π−N scattering and, incase of the s-wave P11(1440) to ππ coupling, from an analysis of the reaction πN → ππN [2].Adding all contributions together, the astonishing result is that the yield of the leading orderloop diagrams (q3) is approximately 2
3 of the total 2π0 strength. This fact makes this channelunique, because unlike in other channels where the loops are adding some contribution tothe dominant tree graphs, here they dominate. Consequently the 2π0 channel provides a verysensitive method to study these loop contributions to ChPT. In [3], the following prediction forthe near threshold cross section was given:
σtot(Eγ) = 0.6 nb
(
Eγ −Ethrγ
10 MeV
)2
(H2.6)
where Eγ denotes the photon beam energy and E thrγ is the production threshold of 308.8 MeV.
Actually, the uncertainty of the coupling of the P11(1440) to the s-wave ππ channel was alimiting factor for the accuracy of the ChPT calculation [3]. For the most extreme case ofthis coupling, an upper limit for this cross section was deduced by increasing the constant inEq. (H2.6) from 0.6 nb to 0.9 nb.To complete the overview of theoretical calculations of the reaction γp→ π0π0 p close to thresh-old, it is noted that this channel is also described in a recent version of the Gomez Tejedor-Osetmodel [8]. This model is based on a set of tree level diagrams including pions, nucleons andnucleonic resonances. In a recent work, particular emphasis was put on the rescattering of pi-ons in the isospin I=0 channel [7]. Double pion photoproduction via the ∆ Kroll-Rudermannterm is not possible for the 2π0 final state. In the case of a π−π+ Kroll-Rudermann term, thecharged pions can rescatter into two neutral pions generating dynamically a ππ loop. This ef-fect nearly doubles the cross section in the threshold region and is regarded by the authors asbeing reminiscent of the explicit chiral loop effect described above. Nevertheless, the crosssection calculated with this model is significantly smaller than the ChPT prediction.

SUBPROJECT H2: MESONIC STRUCTURE OF THE NUCLEON 145
In the past, two measurements of the reaction γp → π0π0 p below 450 MeV beam energy havebeen carried out [4, 9]. The second experiment showed an improvement in statistics by almost afactor 30. Nevertheless, in the threshold region the cross section still suffered from large statis-tical uncertainties (see Fig. H2.18). In contrast to previous analyses, we did not extract the crosssection from events in which only three of the four decay photons were detected. Such anal-yses are not kinematically overdetermined and, close to threshold in particular, the extractedcross section can be slightly contaminated by the reaction γp → π0γp, which has recently beenmeasured [5]. This present measurement of the 2π0 photoproduction at threshold is the firstfor which comparison to theoretical calculations is conclusive. The reaction γp → π0π0 p wasmeasured at the Mainz Microtron (MAMI) electron accelerator using the Glasgow tagged pho-ton facility and the photon spectrometer TAPS. The photon energy covered the range 285–820MeV with an average energy resolution of 2 MeV. The photon flux was of the order of 0.5MHzMeV−1 at photon energies of 300 MeV. The TAPS detector consisted of six blocks eachwith 62 hexagonally shaped BaF2 crystals arranged in an 8×8 matrix and a forward wall with138 BaF2 crystals arranged in a 11×14 rectangle. Each crystal is 250 mm long with an innerdiameter of 59 mm. The six blocks were located in a horizontal plane around the target atangles of ±54, ±103 and ±153 with respect to the beam axis. Their distance to the targetwas 55 cm and the distance of the forward wall was 60 cm. This setup covered ≈40% of thefull solid angle. All BaF2 modules were equipped with 5 mm thick scintillation plastic dE/dxdetectors to allow the identification of charged particles. The liquid hydrogen target was 10 cmlong with a diameter of 3 cm. Further details of the experimental setup can be found in Ref. [6].
mγ1γ2 / MeVm
γ3γ4 / MeV
coun
ts /
2x2
MeV
2
60 90 120 150 180
6090
120150
180
0
100
200
300
400
500
600
-12.BANX.1 bin=5
MX - mp / MeV
cou
nts
/ 5M
eV
0
20
40
60
80
100
120
140
160
-40 -20 0 20 40
Figure H2.17: Left: Two photon invariant masses mγ1γ2 vs mγ3γ4. Right: Missing mass MX −mp derivedfrom two detected π0 mesons for incident beam energies Eγ ≤ 400 MeV (symbols with errors: data,histogram: GEANT simulation).
The γp → π0π0 p reaction channel was identified by measuring the 4-momenta of the two π0
mesons, whereas the proton was not detected. For a three-body final state this provides kine-matical overdetermination and hence an unambiguous identification of this reaction channel.The π0 mesons were detected via their two-photon decay channel and identified in a standard

146 CHAPTER 2. REPORT ON THE PROJECTS
invariant mass analysis from the measured photon momenta. The four photons of an event canbe arranged in three different combinations to form two 2-photon invariant masses (compareFig. H2.17). For an acceptable (γ,π0π0) event, one of these combinations was required to fullfilthe condition, 110MeV < mγγ < 150MeV , for both of the 2-photon invariant masses. In addi-tion the mass of the missing proton was calculated from the beam energy Ebeam, target massmp and the energies Eπ0 and momenta ~pπ0 of the pions via:
M2X = ((Eπ0
1+Eπ0
2)− (Ebeam +mp))
2 − ((~pπ01+~pπ0
2)− (~pbeam))2 (H2.7)
The resulting distribution is shown in Fig. H2.17. In case of the reaction γp → π0π0 p the miss-ing mass must be equal to the mass of the (undetected) proton mp. A Monte Carlo simulationof the 2π0 reaction using GEANT3 reproduces the lineshape of the measured data. A cut cor-responding to a ±2σ width of the simulated lineshape has been applied to select the events ofinterest.The cross section was deduced from the rate of the 2π0 events, the number of hydrogen atomsper cm2, the photon beam flux, the branching ratio of the π0 decay into two photons, and thedetector and analysis efficiency. The intensity of the photon beam was determined by countingthe scattered electrons in the tagger focal plane and measuring the loss of photon intensity dueto collimation with a 100%-efficient BGO detector which was moved into the photon beam atreduced intensity. The geometrical detector acceptance and analysis efficiency due to cuts andthresholds were obtained using the GEANT3 code and an event generator producing distribu-tions of the final state particles according to phase space. The acceptance of the detector setupwas studied by examining independently a grid of the four degrees of freedom for this threebody reaction (azimuthal symmetry of the reaction was assumed). In a grid of total 1024 binsno acceptance holes were found for the beam energy range presented in this paper. The averagevalue for the detection efficiency is 1.0%. The systematic errors are estimated to be 6% andinclude uncertainties of the beam flux, the target length and the efficiency determination.The measured total cross section for the reaction γp → π0π0 p is shown in Fig. H2.18 as a func-tion of the incident photon beam energy. The results are compared to a previous experiment[9]. The two experiments are consistent within the rather large errors of the previous work. Theprediction of ChPT [3] is plotted up to 40 MeV above the production threshold. The overallshape as well as the absolute magnitude are in agreement with the data. Furthermore, the ChPTcalculation using the upper limit for the P11(1440) coupling to the s-wave ππ channel, can beexcluded. In the future, the present data might be exploited to provide a better constraint on thiscoupling. Additionally, the cross section is compared to the calculation with the chiral unitarymodel [7], which especially at threshold predicts a smaller cross section. The data show goodagreement with both calculations.
The pπ0 mass is consistent with a three body phase space distribution, whereas the π0π0 massdeviates slightly already for the energy bin of 330-360 MeV from the phase space distributionsand shows a trend towards higher invariant masses. The Valencia chiral unitary model [7] ex-plains that mπ0π0 distributions skewed to higher invariant masses can arise from the interferenceof the isospin I=0 and I=2 π0π0 amplitudes.Two angular distributions are depicted in Fig. H2.20. The polar angle θπ0 of the π0 mesons inthe overall center of mass frame is consistent with an isotropic distribution. The same holdsfor the angle between the π0 mesons ψπ0 and the proton in the frame where the π0π0 systemis at rest (Gottfried Jackson system). Due to the indistinguishability of the two π0 mesons, thedistribution of ψπ0 shows a symmetry around 90. The isotropy with respect to the ψπ0 angle in

SUBPROJECT H2: MESONIC STRUCTURE OF THE NUCLEON 147
0
25
50
75
100
125
150
175
200
325 350 375 400 425Eγ / MeV
σ / n
b
Eγ / MeV
σ / n
b
0
2.5
5
7.5
10
12.5
15
17.5
20
320 340 360
Figure H2.18: Total cross section for the reaction γp → π0π0 p (grey squares) at threshold in comparisonwith a previous experiment [9] (open circles) for incident energies up to 360 MeV (right) and 425 MeV(left), respectively. The error bars denote the statistical error. The prediction of the ChPT calculation [3]is shown (solid curve) together with its upper limit (dashed curve) and the prediction of Ref. [7] (dottedcurve).
both energy ranges indicates, that the π0 mesons are dominantly in an s-wave state. In futureit might be possible to exploit the present data to give a better constraint on the P11(1440) tos-wave ππ coupling. Secondly, the data are also compared to a prediction [7], where pion loopsare dynamically generated. Especially close to threshold, the two predicted cross sections differsignificantly. Although the present data are of much superior statistical quality than previousmeasurements, the precision is still not good enough to discriminate between these two mod-els. The observed angular distribution show that the π0 mesons are dominantly emitted in ans-wave state.
[1] V. Bernard et al., Nucl. Phys. A580 (1994) 475.
[2] V. Bernard, N. Kaiser and U.G. Meissner, Nucl. Phys. B 457 (1995) 147.
[3] V. Bernard, N. Kaiser and U.G. Meissner, Phys. Lett. B 382 (1996) 19.
[4] F. Haerter et al., Phys. Lett. B401 (1997) 229.
[5] M. Kotulla et al., Phys. Rev. Lett. 89 (2002) 272001.
[6] M. Kotulla, Prog. Part. Nucl. Phys. 50/2 (2003) 303.
[7] L. Roca, E. Oset and M.J. Vincente Vacas, Phys. Lett. B 541 (2002) 77.
[8] J.A. Gomez Tejedor and E. Oset, Nucl. Phys. A 600 (1996) 413.
[9] M. Wolf et al., Eur. Phys. J. A 9 (2000) 5.

148 CHAPTER 2. REPORT ON THE PROJECTS
0
0.2
0.4
0.25 0.3 0.35
0
0.2
0.4
1.05 1.1 1.15
0
0.5
1
1.5
0.25 0.3 0.35
dσ/
dm
ππ /
nb
/MeV 330-360 MeV
dσ/
dm
pπ
/ nb
/MeV
m(π0π0) / GeV
360-400 MeV
m(pπ0) / GeV
0
0.5
1
1.5
1.05 1.1 1.15
Figure H2.19: Invariant mass of π0π0 and π0 p for different bins of beam energy (full squares). Thedashed curve shows 3-body phase space. The beam energy range in the upper panel is 330-360 MeVand in the lower panel 360-400 MeV.
0
0.5
1
1.5
-1 -0.5 0 0.5 1
0
2
4
6
8
-1 -0.5 0 0.5 1
0
2
4
6
-1 -0.5 0 0.5 1
dσ/
dΩ
π / n
b/s
r
330-360
dσ/
dψ
ππ /
nb
cosθ(π0)
360-400
cosψ(π0)
0
20
40
-1 -0.5 0 0.5 1
Figure H2.20: Angular distributions of the center of mass polar angle θπ0 (left panel) and the angle ψπ0
(right panel) between the proton and the two-pions in the π0π0 rest frame (Gottfried Jackson system).The dashed curve shows 3-body phase space. The beam energy range in the upper panel is 330-360 MeVand in the lower panel 360-400 MeV.

SUBPROJECT H2: MESONIC STRUCTURE OF THE NUCLEON 149
H2.3.4 Study of η and η′ Photoproduction: From Threshold to High Energies
W.-T. CHIANG1, D. DRECHSEL, L. TIATOR, M. VANDERHAEGHEN, S.N. YANG1
1 Department of Physics, National Taiwan University, Taipei 10617, Taiwan
Photoproduction of η and η′ on the nucleon, γN → ηN, η′N, provides an alternative tool tostudy nucleon resonances (N∗) besides πN scattering and pion photoproduction. The ηN andη′N states couple to N∗ with isospin I = 1/2 only, so these processes are cleaner and moreselective to distinguish certain resonances than other processes. This provides the opportunityto access less explored N∗, especially some higher mass N∗ about which only little informationis yet available.
Previously, we used an isobar model (η-MAID[1]) to study the η photo- and electroproduction.Even both η and η′ have the same quantum numbers, an extension of the η-MAID formalismto the η′ photoproduction cannot be done straightforwardly. The reason is the higher thresholdfor η′ compared to η production (W = 1896 MeV vs. W = 1486 MeV). The approach in theη-MAID model, which is intended for the resonance region at W ≤ 2 GeV, has to be modifiedas the energy increases. The main modifications refer to the treatment of the t-channel contri-butions. The vector meson exchanges in the t-channel are usually included in studies of mesonphotoproduction, and calculated by using Feynman (pole-like) propagators. However, as theenergies increase, the use of meson poles will fail.
On the other hand, it is well known that the Regge theory is successful in describing variousreactions at high energy and low momentum transfer. In Ref. [2], the Regge trajectories in the t-channel are applied to pion and kaon photoproduction at high energies with success. Therefore,in this study we adapt a similar treatment for the t-channel vector meson exchanges and applyit to η and η′ photoproduction. In the next section, we introduce the treatment for the reggeizedt-channel exchanges. The full formalism for the η-MAID and reggeized model can be foundin Refs. [1] and [3].
!#"$% '&(
) +*,* ".- +*,*/ / / / /10 2435
0 62#78
Figure H2.21: The t-channel ρ and ω meson ex-change diagram in η photoproduction.
Figure H2.22: Regge trajectories of the ρ (ω)mesons shown by the dashed (dotted) line.
The Feynman diagram corresponding to t-channel vector meson (V = ρ , ω) exchanges isshown in Fig. H2.21. The electromagnetic coupling constants λVηγ and λVη′γ can be deter-mined from the radiative decay widths. In Table H2.3, we list the values of λVηγ and λVη′γ.For the hadronic V NN vertex, various values of the hadronic couplings gV NN and κVNN can

150 CHAPTER 2. REPORT ON THE PROJECTS
be found in the literature. Unlike the η-MAID where the values of the gVNN and κVNN cou-plings are treated as fitting parameters, the reggeized model contains these hadronic couplingsas derived by a fit to high energy data.
The Regge trajectories are of the form α(t) = α0 + α′ t, and shown in Fig. H2.22 for ρ andω trajectories. The α0 and α′ values are taken from Ref. [2], and given in Table H2.3. Theidea behind the replacement of the pole-like Feynman propagator by a Regge propagator, is toeconomically take into account the exchange of high-spin particles which cannot be neglectedany more as one moves to higher energies. For V = ρ and ω exchanges:
1
t −m2V
=⇒ P VRegge =
(
ss0
)αV (t)−1 πα′V e−iπαV (t)
sin(αV (t))1
Γ(αV (t)), (H2.8)
where s0 is a mass scale taken as s0 = 1 GeV2, and the gamma function Γ(α(t)) suppressespoles of the propagator in the unphysical region. Note that the Regge propagator reduces to theFeynman propagator 1/(t −m2) if one approaches the first pole on a trajectory (i.e., t → m2).
0.0 0.5 1.0
Eγ = 4 GeV
-t [GeV2]0.0 0.5 1.0 1.5
DESY
Eγ = 6 GeV
-t [GeV2]0.0 0.5 1.0
0.01
0.1
1 Eγ = 2 GeV
dσ/d
t [µb
/GeV
2 ]
-t [GeV2]
CLAS
Figure H2.23: Differential cross section dσ/dt for γp → ηp. The solid lines are the predictions fromt-channel exchange using Regge trajectories, the dashed (dotted) lines indicate the ρ (ω) contributionsonly. The data at E lab
γ = 4 GeV and 6 GeV are from DESY, at the lower energy we compare with theCLAS data at E lab
γ = 1.925 GeV.
Differential cross section data for γp → ηp at high-s (E labγ = 4 and 6 GeV) and low-t (forward
angles) were measured at DESY [4], as shown in Fig. H2.23. The data can be well describedby the t-channel Regge trajectory exchanges. Fitting these data, we determine the values of thehadronic couplings gV NN and κVNN , as given in Table H2.3. These values are then fixed andused for our calculation of both η and η′ photoproduction.
First, we present the η photoproduction results from the reggeized model as well as the η-MAID model. Both models are fitted to current photoproduction data of cross sections from
V mV [MeV ] gVNN κVNN λVηγ λVη′γ αV (t)ρ 768.5 2.4 3.7 0.81 1.24 0.55+0.8 t/GeV2
ω 782.6 9 0 0.29 −0.43 0.44+0.9 t/GeV2
Table H2.3: Parameters for the vector mesons in this study.

SUBPROJECT H2: MESONIC STRUCTURE OF THE NUCLEON 151
TAPS [5], GRAAL [6], and CLAS [7] as well as polarized beam asymmetry from GRAAL [8,9].
0.0
0.5
1.0
1.5
2.0E
γ = 825 MeV
GRAALCLAS
Eγ = 925 MeV
0.0
0.2
0.4
cos θcm
Eγ = 1025 MeV
Eγ = 1125 MeV
0.0
0.2
0.4
Eγ = 1325 MeV
dσ/d
Ω [µ
b/sr
]
Eγ = 1525 MeV
-1.0 -0.5 0.0 0.5 1.0/-1.00.0
0.1
0.2
0.3 Eγ = 1725 MeV
-0.5 0.0 0.5 1.0
Eγ = 1925 MeV
Figure H2.24: Differential cross section for γp → ηp. The solid line is the full result from the Reggemodel, the dotted line indicates the contribution from t-channel Regge exchanges only. The η-MAIDresult is given by the dashed line. The data are from GRAAL and CLAS.
The results for the differential cross sections are given in Fig. H2.24. The overall agreementof the η-MAID results with the data is very good. The reggeized model also agrees well withthe data except for an underestimate at backward angles for E lab
γ > 1.4 GeV, which probablyindicates the influence of the missing u-channel. However, only the reggeized model can besuccessfully extended to high energies, as is shown in Fig. H2.23 for E lab
γ = 4 and 6 GeV. Wenote that the sharp decrease at forward angles for energies above 1 GeV is mainly due to thet-channel ρ and ω exchanges.
The results for the photon beam asymmetry are shown in Fig. H2.25. We compare with thelatest GRAAL data [9], which are more updated than their published results [8]. Note that ourresults agree better with the latest GRAAL data, especially at lowest energies. Both modelsdescribe the data reasonably well. Particularly in the reggeized model, the forward-backwardasymmetry at higher energies is naturally produced from the t-channel Regge trajectory ex-changes. The large positive value of the photon asymmetry at high energies and forward anglesindicates the dominance of the Regge exchanges in this region.
The experimental data for η′ photoproduction is rather limited. Besides the total cross sectiondata from AHHBBM [10] and AHHM [11] decades ago, the only modern data were obtained

152 CHAPTER 2. REPORT ON THE PROJECTS
0.0
0.2
0.4
ΣΣ
Σ
Eγ
lab = 0.73 GeV
Eγ
lab = 0.76 GeV
Eγ
lab = 0.81 GeV
0.0
0.4
0.8
Eγ
lab = 0.87 GeV
Eγ
lab = 0.93 GeV
Eγ
lab = 0.99 GeV
0 30 60 90 120150
0.0
0.4
0.8
Eγ
lab = 1.05 GeV
0 30 60 90 120150
Eγ
lab = 1.10 GeV
0 30 60 90 120150180
θcm
θcm
θcm
Eγ
lab=1.38 GeV
Figure H2.25: Photon beam asymmetry Σ for γp → ηp. Notation of the curves as in Fig. H2.24. Dataare from GRAAL.
at SAPHIR [12]. However, this status will be largely improved by data from CLAS, GRAAL,and CB-ELSA expected to come soon. In the total cross section [12], we observe a sharp riseat threshold and a quick fall-off with energy. This behavior, also seen in η production, is likelydue to a dominant S11 N∗. Therefore, we start with only one S11 N∗ and the reggeized t-channelto describe the γp → η′p reaction.
The results for the differential cross sections are compared with the SAPHIR[12] data inFig. H2.26. We observe that these data show a linear forward rise in cos θ at E lab
γ = 1.59 and1.69 GeV. This P-wave behavior can be almost reproduced by our model, which includes onlyone S11 resonance and t-channel exchanges, without introducing a P-wave resonance. The in-dividual contribution from the S11 resonance or t-channel exchanges has an almost uniform an-gular distribution. Therefore, the apparent P-wave behavior is caused by a strong interferencebetween the S11 resonance and t-channel exchanges. We also tried to describe the t-channelusing ρ and ω poles, but the pole description fails to reproduce the data.
In conclusion, we find some evidence for an S11 N∗ resonance. However, it does certainly notestablish a resonance by itself. The PDG [13] lists the S11(2090) as a one-star resonance, andquotes previous results where the mass varies from 1880 to 2180 MeV. Recent analysis ofπN scattering and pion photoproduction [14] also indicates the existence of such a resonance.Furthermore, various quark models (e.g., Ref. [15]) have predicted an S11 resonance in thisenergy region. Therefore, the η′ photoproduction provides a good channel to study this lessexplored resonance and possibly other higher-mass resonances as well.
[1] W.-T. Chiang et al., Nucl. Phys. A700, 429 (2002).

SUBPROJECT H2: MESONIC STRUCTURE OF THE NUCLEON 153
0.0
0.1
0.2
0.3
0.4
Eγ=1.49 GeV
Eγ=1.59 GeV
Eγ=1.69 GeV
Eγ=1.79 GeV
-1.0-0.5 0.0 0.5 1/-10.0
0.1
0.2
0.3
dσ/d
Ω [µ
b/sr
]
cos θ
Eγ=1.94 GeV
-0.5 0.0 0.5 1/-1
cos θ
Eγ=2.14 GeV
-0.5 0.0 0.5 1/-1
cos θ
Eγ=2.44 GeV
-0.5 0.0 0.5 1.0
(x4)
Eγ=4.00 GeV
cos θ
Figure H2.26: Differential cross section for γp → η′p. Our full results are given by the solid lines, andthe dashed (dotted) lines indicate the t-channel exchange (S11 resonance) contributions only. The dash-dotted lines are the full results when using ρ and ω poles instead of Regge trajectories in the t-channelexchanges. Data are from SAPHIR.
[2] M. Guidal et al., Nucl. Phys. A627, 645 (1997).
[3] W.-T. Chiang et al., nucl-th/0212106.
[4] W. Braunschweig et al., Phys. Lett. B 33, 236 (1970).
[5] B. Krusche et al., Phys. Rev. Lett. 74, 3736 (1995).
[6] F. Renard et al., Phys. Lett. B 528, 215 (2002).
[7] M. Dugger et al. (CLAS Collaboration), Phys. Rev. Lett. 89, 222002 (2002).
[8] J. Ajaka et al., Phys. Rev. Lett. 81, 1797 (1998).
[9] D. Rebreyend (GRAAL Collaboration), Proceedings NSTAR2002.
[10] ABBHHM Collaboration, Phys. Rev. 175, 1669 (1968).
[11] W. Struczinski et al., Nucl. Phys. B108, 45 (1976).
[12] R. Plotzke et al., Phys. Lett. B 444, 555 (1998).
[13] K. Hagiwara et al., Phys. Rev. D 66, 010001 (2002).
[14] G.-Y. Chen et al., nucl-th/0210013.
[15] M. M. Giannini, E. Santopinto, and A. Vassallo, Proceedings NSTAR2002.

154 CHAPTER 2. REPORT ON THE PROJECTS
H2.4 Nucleon Resonances
H2.4.1 Progress report on the unitary isobar model MAID
D. DRECHSEL, S.S. KAMALOV1, L. TIATOR
1 JINR Dubna, 141980 Moscow Region, Russia
MAID is a unitary isobar model for pion photo- and electroproduction on the nucleon, acces-sible in the internet [1]. It can be applied for energies from pion threshold up to W = 2 GeVcovering most of the resonance region. From real photons at Q2 = 0 up to photon virtualities ofQ2 = 5 GeV2 it can be used for online calculations of multipoles, amplitudes, cross sections,polarization observables and sum rules.
The model is based on a nonresonant background dominated by Born and vector meson ex-change terms and a resonance part described by Breit-Wigner functions. Both parts are indi-vidually unitarized and fulfill the Watson theorem below the two-pion threshold.
In MAID2000 only the 8 most prominent nucleon resonances were included: P33(1232),P11(1440), D13(1520), S11(1535), S31(1620), S11(1650), F15(1680) and D33(1700). Re-cently we have extended the resonance sector and have added further resonances: D15(1675),P13(1720), F35(1905), P31(1910), and F37(1950). With this set of 13 nucleon resonances allfour-star resonances below W = 2 GeV are now included.
While all these resonances are very well established from pion nucleon scattering with mostlysmall uncertainties in resonance mass MR, total width ΓR and branching ratios Γπ/ΓR andΓππ/ΓR, the electromagnetic couplings are in most cases quite uncertain. These couplings canbe either parameterized in terms of electric (E), magnetic (M) and Coulomb (C) amplitudes ormore often in terms of helicity elements A1/2, A3/2 and S1/2, which are defined exactly on topof each resonance (W = MR) and depend only on the photon virtuality Q2. However, only atthe photon point, Q2 = 0, the transverse couplings A1/2 and A3/2 are well established and listedin the Particle Data Tables. At finite Q2 some previous results exist (mainly for the transversecouplings) and are frequently shown, but in many cases the uncertainties are very large andeven the signs are not always clear. In particular, this is true for the longitudinal couplings S1/2,where the situation is even worse, since different definitions exist in the literature, different bysign and leading factors. Results for helicity amplitudes are given in H2.4.2.
During the last 3 years we have also developed further web based online programs for cal-culation of kaon and eta photo- and electroproduction. Also the dynamical model DMT hasbecome accessible on our MAID web page. Most recently we have included the reggeized iso-bar models for η and η′ photoproduction on the proton, see H2.3.4. A still ongoing projectis the development of a dispersion relation analysis for pion photo- and electroproduction,where only the imaginary parts are parametrized with nucleon isobars. The real parts of theamplitudes are determined from fixed-t dispersion relations, therefore automatically fulfillingunitarity and crossing symmetry. First results are presented for threshold pion production incontribution H2.3.2 of this report.
[1] D. Drechsel, O. Hanstein, S.S. Kamalov and L. Tiator, Nucl. Phys. A 645, 145 (1999);http://www.kph.uni-mainz.de/MAID/.

SUBPROJECT H2: MESONIC STRUCTURE OF THE NUCLEON 155
H2.4.2 Electroproduction of nucleon resonances
D. DRECHSEL, S.S. KAMALOV1, L. TIATOR, M.M. GIANNINI2 , E. SANTOPINTO2 ,A. VASSALLO2
1 JINR Dubna, 141980 Moscow Region, Russia2 Dipartimento di Fisica dell’Universita di Genova and I.N.F.N., Sezione di Genova, I-16164 Genova, Italy
Our knowledge of nucleon resonances is mostly given by elastic pion nucleon scattering [1].All nonstrange baryon resonances that are given in the Particle Data Tables [2] have beenidentified in partial wave analyses of πN scattering both with Breit-Wigner analyses and withspeed-plot techniques. From these analyses we know very well the masses, widths and thebranching ratios into the πN and ππN channels. These are reliable parameters for all resonancesin the 3- and 4-star categories. There remain some doubts for the two prominent resonances,the Roper P11(1440) which appears unusually broad and the S11(1535) that cannot uniquelybe determined in the speed-plot due to its position close to the ηN threshold. Both resonances,however, have recently been found on the lattice in a very precise calculation with a pion massas low as 180 MeV and converge very close to the empirical masses [3]. This has been achievedin a quenched calculation giving rise to the conclusion that both resonance states are simplyqqq states.
Starting from these firm grounds, using pion photo- and electroproduction we can determine theelectromagnetic γNN∗ couplings. They can be given in terms of electric, magnetic and chargetransition form factors G∗
E(Q2), G∗M(Q2) and G∗
C(Q2) or by linear combinations as helicityamplitudes A1/2(Q
2), A3/2(Q2) and S1/2(Q
2). So far, we have some reasonable knowledgeof the A1/2 and A3/2 amplitudes at Q2 = 0, which are tabulated in the Particle Data Tables.For finite Q2 the information found in the literature is very scarce and practically does notexist at all for the longitudinal amplitudes S1/2. But even for the transverse amplitudes onlyfew results are firm, these are the G∗
M form factor of the ∆(1232) up to Q2 ≈ 10 GeV2, theA1/2(Q2) of the S11(1535) resonance up to Q2 ≈ 5 GeV2 and the asymmetry A(Q2) = (A2
1/2 −A2
3/2)/(A21/2 +A2
3/2) for the D13(1520) and F15(1680) resonance excitation up to Q2 ≈ 3 GeV2
which change rapidly between −1 and +1 at small Q2 ≈ 0.5 GeV2 [4]. Frequently also datapoints for other resonance amplitudes, e.g. for the Roper are shown together with quark modelcalculations but they are not very reliable. Their statistical errors are often quite large but inmost cases the model dependence is as large as the absolute value of the data points. In thiscontext it is worth noting that also the word ‘data point‘ is somewhat misleading because thesephoton couplings and amplitudes cannot be measured directly but can only be derived in apartial wave analysis. Only in the case of the ∆(1232) resonance this can and has been donedirectly in the experiment by Beck et al. at Mainz [5]. For the Delta it becomes possible dueto two important theoretical facts, the Watson theorem and the well confirmed validity of thes+p – wave truncation. Within this assumption a complete experiment was done with polarizedphotons and with the measurement of both π0 and π+ in the final state, allowing also for anisospin separation. For other resonances neither the theoretical constraints are still valid norare we any close to a complete experiment. The old data base was rather limited with largeerror bars and no data with either target or recoil polarization was available. Even now wedo not have many data points with double polarization, however, the situation for unpolarizede + p → e′ + p + π0 has considerably improved, mainly by the new JLab experiments in allthree halls A, B and C. These data cover a large energy range from the Delta up to the third

156 CHAPTER 2. REPORT ON THE PROJECTS
resonance region with a wide angular range in θπ. Due to the 2π coverage in the φ angle aseparation of the unpolarized cross section
dσv
dΩ=
dσT
dΩ+ ε
dσL
dΩ+
√
2ε(1+ ε)dσLT
dΩcosφ+ ε
dσTT
dΩcos 2φ (H2.9)
in three parts becomes possible and is very helpful for the partial wave analysis. Even withouta Rosenbluth separation of dσT and dσL we have an enhanced sensitivity of the longitudinalamplitudes due to the dσLT interference term. Such data are the basis of our new partial waveanalysis with an improved version of the Mainz unitary isobar model MAID.
For our analysis of pion electroproduction we will use the dynamical model DMT [6] and theunitary isobar model MAID [7]. In the dynamical approach to pion photo- and electroproduc-tion [8], the t-matrix is expressed as
tγπ(E) = vγπ + vγπ g0(E) tπN(E) , (H2.10)
where vγπ is the transition potential operator for γ∗N → πN, and tπN and g0 denote the πNt-matrix and free propagator, respectively, with E ≡ W the total energy in the CM frame. Amultipole decomposition of Eq. (H2.10) gives the physical amplitude in channel α [8],
t(α)γπ (qE ,k;E + iε) = exp (iδ(α)) cosδ(α) × [v(α)
γπ (qE ,k)
+PZ ∞
0dq′
q′2R(α)πN (qE ,q′;E)v(α)
γπ (q′,k)
E −EπN(q′)] , (H2.11)
where δ(α) and R(α)πN are the πN scattering phase shift and reaction matrix in channel α, respec-
tively; qE is the pion on-shell momentum and k = |k| is the photon momentum. The multipoleamplitude in Eq. (H2.11) manifestly satisfies the Watson theorem and shows that the γπ multi-poles depend on the half-off-shell behavior of the πN interaction.
In a resonant channel the transition potential vγπ consists of two terms
vγπ(E) = vBγπ + vR
γπ(E), (H2.12)
where vBγπ is the background transition potential and vR
γπ(E) corresponds to the contribution ofthe bare resonance excitation. The resulting t-matrix can be decomposed into two terms
tγπ(E) = tBγπ(E)+ tR
γπ(E), (H2.13)
where
tBγπ(E) = vB
γπ + vBγπ g0(E) tπN(E), (H2.14)
tRγπ(E) = vR
γπ + vRγπ g0(E) tπN(E). (H2.15)
Here tBγπ includes the contributions from the nonresonant background and renormalization of
the vertex γ∗NR. The advantage of such a decomposition is that all the processes which startwith the excitation of a bare resonance are summed up in t R
γπ. Note that the multipole decom-position of both tB
γπ and tRγπ would take the same form as Eq. (H2.11).
As in MAID [7], the background potential vB,αγπ (W,Q2) was described by Born terms obtained
with an energy dependent mixing of pseudovector-pseudoscalar πNN coupling and t-channel

SUBPROJECT H2: MESONIC STRUCTURE OF THE NUCLEON 157
vector meson exchanges. The mixing parameters and coupling constants were determined froman analysis of nonresonant multipoles in the appropriate energy regions. In the new version ofMAID, the S, P, D and F waves of the background contributions are unitarized in accordancewith the K-matrix approximation,
tB,αγπ (MAID) = exp (iδ(α)) cosδ(α)vB,α
γπ (W,Q2). (H2.16)
From Eqs. (H2.11) and (H2.16), one finds that the difference between the background termsof MAID and of the dynamical model is that off-shell rescattering contributions (principalvalue integral) are not included in MAID. To take account of the inelastic effects at the higherenergies, we replace exp (iδ(α))cosδ(α) = 1
2 (exp (2iδ(α))+ 1) in Eqs. (H2.11) and (H2.16) by12(ηα exp (2iδ(α)) + 1), where ηα is the inelasticity. In our actual calculations, both the πNphase shifts δ(α) and inelasticity parameters ηα are taken from the analysis of the GWU group[9].
Following Ref. [7], we assume a Breit-Wigner form for the resonance contribution A Rα (W,Q2)
to the total multipole amplitude,
ARα (W,Q2) = AR
α (Q2)fγR(W )ΓR MR fπR(W )
M2R −W 2 − iMRΓR
eiφ, (H2.17)
where fπR is the usual Breit-Wigner factor describing the decay of a resonance R with totalwidth ΓR(W ) and physical mass MR. The expressions for fγR, fπR and ΓR are given in Ref. [7].The phase φ(W ) in Eq. (H2.17) is introduced to adjust the phase of the total multipole to equalthe corresponding πN phase shift δ(α). While in the original version of MAID [7] only the7 most important nucleon resonances were included with mostly only transverse e.m. cou-plings, in our new version all four star resonances below W = 2 GeV are included. These areP33(1232), P11(1440), D13(1520), S11(1535), P33(1232), S31(1620), S11(1650), D15(1675),F15(1680), D33(1700), P13(1720), F35(1905), P31(1910) and F37(1950).
laboratory Q2(GeV 2) Wcm(MeV ) θcmπ (deg)
Mainz [10] 0.121 1232 180
Bates [11] 0.126 1152 - 1322 0−38
Bonn [12] 0.630 1153 - 1312 5−175
JLab, Hall A[13] 1.0 1110 - 1950 146−167
JLab, Hall B[14] 0.4−1.8 1100 - 1680 26−154
JLab, Hall C[15] 2.8,4.0 1115 - 1385 25−155
Table H2.4: Recent experimental data of π0 electroproduction on the proton. The Mainz experimentwas done with beam and recoil polarization, all others are unpolarized measurements. From JLab HallB data sets at fixed Q2 of 0.4, 0.525, 0.65, 0.75 0.90, 1.15 and 1.45 GeV 2 have been used.
The resonance couplings ARα (Q2) are independent of the total energy and depend only on Q2.
They can be taken as constants in a single-Q2 analysis, e.g. in photoproduction, where Q2 = 0but also at any fixed Q2, where enough data with W and θ variation is available. Alternativelythey can also be parametrized as functions of Q2 in an ansatz like
Aα(Q2) = Aα(0)1+ cα
1 Q2
(1+ cα2 Q2)n (H2.18)

158 CHAPTER 2. REPORT ON THE PROJECTS
with n ≥ 2. Also other parameterizations with an asymptotic fall-off for large Q2, e.g. of Gaus-sian form work equally well and can effectively be rewritten in either form. With such anansatz it is possible to determine the parameters Aα(0) from a fit to the world database ofphotoproduction, while the parameters cα
1 and cα2 can be obtained from a combined fitting of
all electroproduction data at different Q2. The latter procedure we call the ‘superglobal fit’. InMAID the photon couplings Aα are direct input parameters.
Eq. (H2.17) can also be used for a general definition. At the resonance position, W = MR weobtain
ARα (MR,Q2) = i Aα(Q2) fγR(MR) fπR(MR)cπN eiφ(MR)
= A resα (MR,Q2)eiφ(MR) (H2.19)
with fγR(MR) = 1 and
fπR(MR) =
[
1(2 j +1)π
kW
|q|mN
MR
ΓπN
Γ2tot
]1/2
. (H2.20)
The factor cπN is√
3/2 and −1/√
3 for the isospin 3/2 and isospin 1/2 multipoles, respec-tively. This leads to the definition
Aα(Q2) =1
cπN fπR(MR)ImA res
α (MR,Q2) . (H2.21)
It is important to note that by this definition the phase factor eiφ in Eqs. (H2.17 and H2.19) isnot considered as part of the resonant amplitude but rather as an artifact of the unitarizationprocedure. In the case of the ∆(1232) resonance this phase vanishes at the resonance positiondue to Watson’s theorem, however, for all other resonances it is finite and in some extremecases it can reach values of about 600. Aα is a short-hand notation for the electric, magnetic andlongitudinal multipole photon couplings of a given partial wave α. As an example, for the P33
partial wave the specific couplings are denoted by E1+, M1+ and S1+. By linear combinationsthey are connected with the more commonly used helicity photon couplings A1/2, A3/2 andS1/2.
For resonances with total spin j = `+1/2 we get
A`+1/2 = −1
2[(`+2)E`+ + `M`+] ,
A`+3/2 =
12
√
`(`+2)(E`+− M`+) ,
S`+1/2 = −`+1√
2S`+ (H2.22)
and for j = (`+1)−1/2
A(`+1)−1/2 =
12[(`+2)M(`+1)−− `E(`+1)−] ,
A(`+1)−3/2 = −1
2
√
`(`+2)(E(`+1)−+ M(`+1)−) ,
S(`+1)−1/2 = −`+1√
2S(`+1)− . (H2.23)

SUBPROJECT H2: MESONIC STRUCTURE OF THE NUCLEON 159
With some care, as will be discussed below, the photon couplings can be directly compared tomatrix elements of the electromagnetic current calculated in quark models between the nucleonand the excited resonance states,
A1/2 = −√
2πα f s
kW< R,
12|J+ |N,−1
2> ζ ,
A3/2 = −√
2πα f s
kW< R,
32|J+ |N,
12
> ζ ,
S1/2 = −√
2πα f s
kW< R,
12|ρ |N,
12
> ζ , (H2.24)
where J+ = − 1√2(Jx + iJy) . However, these couplings are only defined up to a phase ζ. Since
the sign of the pionic decay of the resonance has been ignored in the empirical definition ofthese amplitudes, Eq. (H2.21), it must be taken into account in a model calculation in orderto make comparison with the empirical data. Therefore the phases ζ have to be individuallycalculated in each model. In the calculations found in the literature this has often been ignoredand causes some confusion in comparing these numbers, especially in critical cases as for theRoper resonance P11(1440), where the correct sign cannot simply be guessed.
As an application for evaluating the photon couplings we have used the hypercentral Con-stituent Quark Model (hCQM) [16]. It consists of a hypercentral quark interaction containinga linear plus coulomb-like term, as suggested by lattice QCD calculations [17]
V (x) = −τx
+ αx , with x =
√
ρ2 +λ2 , (H2.25)
where x is the hyperradius defined in terms of the standard Jacobi coordinates ~ρ and~λ. Wecan think of this potential both as a two-body potential in the hypercentral approximation oras a true three-body potential. A hyperfine term of the standard form is added and treated asa perturbation. The parameters α, τ and the strength of the hyperfine interaction are fitted tothe spectrum (α = 1.61 f m−2, τ = 4.59 and the strength of the hyperfine interaction is de-termined by the ∆ - Nucleon mass difference). Recently, isospin dependent terms have beenintroduced [18] in the hCQM hamiltonian. The complete interaction used is given by
Hint = V (x)+HS +HI +HSI . (H2.26)
Having fixed the values of all parameters, the resulting wave functions have been used for thecalculation of the photocouplings, the transition form factors for the negative parity resonances,the elastic form factors [19] and now also for the longitudinal and transverse transition formfactors for all the 3- and 4-star and the missing resonances.
The unitary isobar model MAID was used to analyze the world data base of pion photopro-duction and recent differential cross section data on p(e,e′p)π0 from Mainz, Bates, Bonn andJLab. These data cover a Q2 range from 0.1 · · ·4.0 (GeV/c)2 and an energy range 1.1 <W < 2.0GeV, see Table H2.4. In a first attempt we have fitted each data set at a constant Q2 value sep-arately. This is similar to a partial wave analysis of pion photoproduction and only requiresadditional longitudinal couplings for all the resonances. The Q2 evolution of the background,Born terms and vector meson exchange, is described with a standard dipole form factor. In a

160 CHAPTER 2. REPORT ON THE PROJECTS
Figure H2.27: The Q2 dependence of the N → ∆ helicity amplitudes. The solid and dashed curves arethe results of the superglobal fit with MAID and the predictions of the hyperspherical constituent quarkmodel. The dotted lines show the pion cloud contributions calculated with DMT. The data points atfinite Q2 are the results of our single-Q2 fits, see Table H2.4 for references. At Q2 = 0 for A1/2 and A3/2the photon couplings from PDG are shown [2].
second attempt we have introduced a Q2 evolution of the transition form factors of the nucleonto N∗ and ∆ resonances and have parameterized each of the transverse (A1/2 and A3/2) andlongitudinal (S1/2) helicity amplitudes. In a combined fit with all electroproduction data fromthe world data base of GWU/SAID [20] and the data of our single-Q2 fit we obtained a Q2
dependent solution (superglobal fit). In Fig. H2.27 we show our results for the ∆(1232) excita-tion. Our superglobal fit agrees very well with our single-Q2 fits, except for the 2 lowest pointsof S1/2 from our analysis of the Hall B data. Whether this is an indication for a different Q2
dependence has still to be investigated. Generally, all our single-Q2 points are shown with sta-tistical errors from χ2 minimization only. A much bigger error has to be considered for modeldependence.
We also compare our empirical analyses with the predictions of the hypercentral constituentquark. It turns out that the transverse amplitudes of the quark model are about half of the mag-nitudes and for the longitudinal amplitude S1/2(Q2) the quark model gives essentially zero.This is due to the fact that in the empirical analysis the resonance contribution is fully dressedby the pion cloud which is not the case in a constituent quark model. As depicted in Fig. H2.28a fully dressed resonance contribution is renormalized on each vertex and in the propagator.The baryonic states of the hCQM including hyperfine interaction can be considered as reso-nances dressed by hadronic interaction giving rise to the empirical masses. However, the elec-tromagnetic vertex correction (third part of Fig. H2.28) is not included and has to be calculatedseparately. We have already started to do this and in a first attempt we have used the dynamicalmodel DMT and extracted the pion loop contributions for the s- and p-waves. This estimate

SUBPROJECT H2: MESONIC STRUCTURE OF THE NUCLEON 161
Figure H2.28: Resonances with dressed and bare electromagnetic vertices.
of the pion cloud vertex correction is shown as dotted lines in the figures. For the longitudi-nal Delta excitation the entire amplitude is practically given by the pion cloud contribution andonly a negligible part arises from a bare Delta. The same is true for the electric amplitude whichis given by the combination A1/2 −A3/2/
√3. This calculation also explains why none of the
constituent quark models was ever able to give the empirical strength of the M1 excitation (orthe transition moment µN∆) of the ∆(1232). While in a simple SU(2) calculation the transitionmoment is lower by about 30% in more refined calculations it can be as low as only half ofthe empirical value. This is also the case here in our hCQM, even if it has more realistic wavefunctions.
Figure H2.29: The Q2 dependence of the transverse and longitudinal helicity amplitudes for theP11(1440) and the S11(1535) resonance excitation. The notation of the curves and the data is the sameas in Fig. H2.27.
In Fig. H2.29 we show our results for the helicity amplitudes of the Roper resonance P11(1440)and the S11(1535). For these resonance amplitudes the pion cloud contributions are most im-portant near the photon point and become already negligible around Q2 = 0.5 GeV2. The com-parison between the hCQM and the empirical amplitudes is reasonably good, except for theA1/2 amplitude of the Roper. This finding has to be further investigated both in the frameworkof the quark model and also in the empirical analysis. Certainly, for the Roper resonance theexisting data is not very sensitive to this partial wave. Further experiments with double polar-ization could be very helpful to solve this problem.

162 CHAPTER 2. REPORT ON THE PROJECTS
Figure H2.30: The Q2 dependence of the transverse helicity amplitudes for the D13(1520) and F15(1680)resonance excitation. The notation of the curves and the data is the same as in Fig. H2.27.
Finally, in Fig. H2.30 we show our results for the D13(1520) and the F15(1680) resonances.Here the largest discrepancies between our quark model calculations and the empirical analysisappear in the helicity 3/2 amplitudes at small Q2. So far, the dynamical model calculationshave only been done for S- and P- waves, therefore we cannot give a pion cloud calculationsfor these partial waves. However, our findings encourages very strongly such extensions of thedynamical model. Furthermore we also have some empirical results for the partial waves thatare not shown here, but most of them come out of the fit with rather large errors bars in thesingle-Q2 analysis. This gives us less confidence also for our superglobal fit. The reason for itis mainly that we have fewer data points to analyze at higher energies.
Using the world data base of pion photo- and electroproduction and recent data from Mainz,Bonn, Bates and JLab we have made a first attempt to extract all longitudinal and transversehelicity amplitudes of nucleon resonance excitation for four star resonances below W = 2 GeV.For this purpose we have extended our unitary isobar model MAID and have parametrized theQ2 dependence of the transition amplitudes. Comparisons between single-Q2 fits and a Q2 de-pendent superglobal fit give us confidence in the determination of the Delta amplitudes. We canalso reasonably well determine the amplitudes of the P11(1440),S11(1535),D13(1520) and theF15(1680), even though the model uncertainty of these amplitudes can be as large as 50% forthe longitudinal amplitudes of the D13 and F15. For other resonances the situation is even worse.However, this only reflects the fact that precise data in a large kinematical range are absolutelynecessary. In some cases double polarization experiments are very helpful as has already beenshown in pion photoproduction. Furthermore, without charged pion electroproduction, someambiguities between partial waves that differ only in isospin as S11 and S31 cannot be resolved

SUBPROJECT H2: MESONIC STRUCTURE OF THE NUCLEON 163
without additional assumptions. Finally, all results discussed here are only for the proton tar-get. We have also started an analysis for the neutron, where much less data are available fromthe world data base and no new data has been analyzed in recent years. Since we can very wellrely on isospin symmetry, only the electromagnetic couplings of the neutron resonances withisospin 1/2 have to be determined. We have found such a solution for the neutron and will im-plement it in the next version of MAID (MAID2003). It will be a challenge for the experimentto investigate also the neutron resonances in the near future.
[1] G. Hohler et al., Handbook of Pion-Nucleon Scattering, Physics Data 12-1 (Karlsruhe,1979).
[2] K. Hagiwara et al. (Particle Data Group), Phys. Rev. D 66 (2002) 010001.
[3] S.J. Dong, T. Draper, I. Horvath, F.X. Lee, K.F. Liu, N. Mathur and J.B. Zhang,hep-ph/0306199.
[4] For an overview and further references see S. Boffi, C. Giusti, F.D. Pacatiand M. Radici,Electromagnetic Response of Atomic Nuclei, Clarendon Press, Oxford, 1996, p. 114ff.
[5] R. Beck et al., Phys. Rev. C 61 (2000) 035204.
[6] S. Kamalov, S.N. Yang, D. Drechsel, O. Hanstein, L. Tiator, Phys. Rev. C 64 (2001)032201; http://www.kph.uni-mainz.de/MAID/DMT/.
[7] D. Drechsel, O. Hanstein, S.S. Kamalov and L. Tiator, Nucl. Phys. A645 (1999) 145;http://www.kph.uni-mainz.de/MAID/.
[8] S.N. Yang, J. Phys. G 11 (1985) L205.
[9] R.A. Arndt, I.I. Strakovsky and R.L. Workman, Phys. Rev. C 56 (1997) 577.
[10] Th. Pospischil et al., Phys. Rev. Lett. 86 (2001) 2959.
[11] C. Mertz et al., Phys. Rev. Lett. 86 (2001) 2963.
[12] T. Bantes and R. Gothe, private communication.
[13] G. Laveissiere et al., Proc. of NSTAR2001, Mainz, World Scientific 2001, p 271 andnucl-ex/0308009.
[14] K. Joo et al., Phys. Rev. Lett. 88 (2002) 122001-1.
[15] V.V. Frolov et al., Phys. Rev. Lett. 82 (1999) 45.
[16] M. Ferraris, M.M. Giannini, M. Pizzo, E. Santopinto and L. Tiator,Phys. Lett. B364, 231 (1995).
[17] Gunnar S. Bali, Phys. Rep. 343, 1 (2001).
[18] M.M. Giannini, E. Santopinto, A. Vassallo,Eur. Phys. J. A12, 447 (2001); Nucl.Phys. A699,308 (2002).
[19] M.M. Giannini, E. Santopinto, A. Vassallo, Prog. Part. Nucl. Phys. 50, 263 (2003).
[20] R.A. Arndt, W.J. Briscoe, I.I. Strakovsky and R.L. Workman,http://gwdac.phys.gwu.edu/.

164 CHAPTER 2. REPORT ON THE PROJECTS
H2.4.3 Third and fourth S11 resonances in pion scattering and pion photoproduction
G.Y. CHEN1, D. DRECHSEL, S.S. KAMALOV2, L. TIATOR, S.N. YANG1
1 Department of Physics, National Taiwan University,Taipei 10617, Taiwan2 JINR Dubna, 141980 Moscow Region, Russia
There are 44 nonstrange baryon states listed in the Particle Data Tables [1]. Among them, 18are rated four-star and 6 rated three-star. The rest are weakly excited states with at most fairevidence of existence. Even though the existence of the four-star baryon resonances are cer-tain, some very large discrepancies exist in their properties as obtained from different analyses.These discrepancies arise mostly from the data set included in the analysis, or the separationof background and resonance contributions, among others. This model dependence in the ex-traction of the resonance properties has made it difficult to test the predictions of theoreticalmodels with existing data.
Here we report on an extension of a recently developed dynamical meson-exchange (MEX)model for pion-nucleon scattering [2] and for pion electromagnetic production [3, 4]. We con-sider the S11 channel up to 2 GeV by explicitly introducing the S11 resonances into the models.The resulting πN model in the S11 channel is then fed into the pion photoproduction model toanalyse the existing pE0+ multipole.
Our MEX πN model is obtained by using a three-dimensional reduction scheme of the Bethe-Salpeter equation for a model Lagrangian involving π,N,∆,ρ, and σ fields. Details can befound in Ref. [2]. Here we only present the general scheme to extend the model to the case ofcoupled π, η and 2π channels, including in addition the couplings with baryon resonances inthe S11 partial wave.
The full t-matrix can be written as a system of coupled equations,
ti j(E) = vi j(E)+∑k
vik(E)gk(E) tk j(E) , (H2.27)
where i and j denote the π, or η channel and E = W is the total center mass energy. Eq.(H2.27) is a system of three dimensional coupled integral equations which is derived from thefour dimensional Bethe-Salpeter equation using a three-dimensional reduction scheme with acorresponding relativistic propagator, gk, for the free kN system (k = π, or η).
In general, he potential vi j is a sum of non-resonant, vBi j , and bare resonance, vR
i j , terms, vi j(E)=
vBi j(E)+ vR
i j(E). The non-resonant term vBππ for the πN elastic channel contains contributions
from the s- and u-channel, Born terms and t-channel contributions with ω, ρ, and σ exchange.The bare resonance contribution vR
i j(E) can be symbolically expressed in the form of
vRi j(q,q′;E) =
fi(Λi,q;E)g(0)i g(0)
j f j(Λ j,q′;E)
E −M(0)R + i 1
2ΓR2π(E)
, (H2.28)
where q and q′ are the pion (or eta) momenta in the initial and final states, g(0)i( j), M(0)
R and fi
are the bare resonance vertex couplings, bare masses and covariant form factors (with cut-offparameter Λi), respectively. Note that in Eq. (H2.28) we have added a phenomenological termΓR
2π(E) in the resonance propagator in order to take into account the decay of the resonanceinto the ππN channel. The expression for ΓR
2π(E) is given in Ref. [5].

SUBPROJECT H2: MESONIC STRUCTURE OF THE NUCLEON 165
In the channel of interest, S11, there are two well-known four-star resonance states, S11(1535)and S11(1650), and one one-star resonance, S11(2090). In the Hypercentral Constituent QuarkModel [6] a third and a fourth S11 resonance with energies 1861 and 2008 MeV were pre-dicted. The generalization of our coupled channels model for multiple resonances with thesame quantum numbers is straightforward, namely vR
i j(q,q′;E) = ∑Nn=1 vRn
i j (q,q′;E) with addi-tional parameters for the bare masses, widths, coupling constants and cut-off parameters foreach resonance.
Results of our analysis of Re tππ and Im tππ are shown in Fig. H2.31. In the energy range 1100 <W < 1750 MeV the S11(1535) and S11(1650) resonances are very pronounced. However theresults of our best fit at larger energy range, W < 2200 MeV clearly show that the only wayto improve the agreement with the data is to introduce a third and fourth S11 resonance. Notethat in Fig. H2.31 the background contributions (dashed curves) are defined by the equationtBππ(E) = vB
ππ(E)+ vBππ(E)g(E) tB
ππ(E). Our final results for the physical (or “dressed”) massesand total widths are summarized in Table H2.5.
Resonances M0R (MeV) MR (MeV) ΓR (MeV)
R1 1559 1510 (1524) 99R2 1721 1681 (1688) 124R3 1810 1797 (1861) 295R4 2159 2182 (2008) 421
Table H2.5: S11 resonance parameters obtained from πN scattering: M0R and MR are the bare and physical
(dressed) masses, respectively; ΓR is the total width. In brackets: quark model predictions of Ref. [6]for the masses MR.
It is seen that the above analysis of the elastic πN scattering indicates the existence of four S11
resonances. Next we have checked this finding by an independent analysis of pion photopro-duction using the dynamical model developed in Refs. [3, 4] (hereafter called DMT (Dubna-Mainz-Taipei) model). We will again be brief about the DMT model and refer the readers toRef. [4] for the details.
Within our DMT model the resulting t-matrix contains two terms,
tγπ(E) = tBγπ(E)+ tR
γπ(E) , (H2.29)
where
tBγπ(E) = vB
γπ +∑k
vBγk gk(E) tkπ(E) and tR
γπ(E) = vRγπ +∑
k
vRγk gk(E) tkπ(E) . (H2.30)
The background potential vBγπ contains Born terms with an energy dependent mixing of pseu-
dovector and pseudoscalar πNN coupling and t-channel vector meson exchanges [5]. The mix-ing parameters and coupling constants were determined from an analysis of the nonresonantmultipoles. The standard physical multipoles in channel α = l, j, I can then be expressed as
tB,αγπ (q,k) = vB,α
γπ (q,k)[1+ iqF (α)ππ (q,q;E)]− P
π
Z ∞
0
q′2dq′
M (q′)
F(α)ππ (q,q′;E)vB,α
γπ (q′,k)
E −EπN(q′), (H2.31)
where F (α)ππ is the pion-scattering amplitude and M (q) the relativistic pion-nucleon reduced
mass. We mention in passing the so-called “K-matrix” approximation, when the principal value

166 CHAPTER 2. REPORT ON THE PROJECTS
integral in Eq. (H2.31) is neglected, i.e., only on-shell pion rescattering is taken into accountin the parametrization of the background.
Following Ref. [5], for the resonance contribution t R,αγπ (W ) we assume a Breit-Wigner form
tR,αγπ (W ) = AR
αfγR(W )ΓR MR fπR(W )
M2R −W 2 − iMRΓR
, (H2.32)
where fπR is the usual Breit-Wigner factor describing the decay of a resonance R with totalwidth ΓR(W ) and physical mass MR. The expressions for fγR, fπR and ΓR are given in Ref. [5].In the DMT model the electromagnetic form factor AR
α describes the bare γNR vertex. This isa free parameter to be determined from the experimental data.
Figure H2.31: Real and imaginary parts of theS11 pion scattering amplitude. Dashed curves:nonresonant background contribution tB
ππ. Dot-ted, dash-dotted and solid curves: total tππ am-plitude obtained after the best fit with two,three and four S11 resonances, respectively.Data points: from Ref. [7].
Figure H2.32: Imaginary parts of the pE1/20+
multipoles. Dashed and dash-dotted curves:background contributions obtained using K-matrix approximation and DMT model, re-spectively. Solid curves: total multipole. Theindividual contributions from each resonanceare shown by the dotted curves. Data pointsfrom Ref. [8].
In Fig. H2.32 (upper panel) we see that the resonant background in the DMT model (dash-dotted curve) is very important, in particular for W > 1450 MeV where it becomes large andnegative. This is in contrast to the prediction based on the K-matrix approximation (dashedcurve). The difference comes mainly from the principal value integral contribution in Eq.(H2.31). Such a background will thus require a much stronger resonance contribution in or-der to describe the results of the recent partial wave analysis of Ref. [8]. The best fit of theIm pE0+ multipole requires two new S11 resonances with masses 1810 MeV and 2053 MeV, inaddition to the well known resonances S11(1535) and S11(1650). In fact the χ2 per data pointof the fit improves from 64 to 3.7 by introducing these two additional resonances. This result

SUBPROJECT H2: MESONIC STRUCTURE OF THE NUCLEON 167
is in agreement with our previous findings for pion scattering, and it clearly indicates that ourmodels for both reactions call for a low-lying third S11 resonance which may be one of themissing resonances predicted by quark models, e.g. Ref. [6] and is also indicated in an analysisof eta photoproduction [9].
In summary, we have performed a self-consistent analysis of pion scattering and pion photo-production within a coupled channels dynamical model. The results indicate the existence of athird and a fourth S11 resonance with the masses 1803±7 and 2117±64 MeV. In the case ofthe pion photoproduction, we obtain background contributions to the imaginary part of the S-wave multipole which differ considerably from the result based on the K-matrix approxima-tion. Within the dynamical model these background contributions become large and negative inthe region of the S11(1535) resonance. Due to this fact much larger resonance contributions arerequired in order to explain the results of the recent multipole analyses. The complete resultswith further details are published in Ref. [10].
[1] Particle Data Group, Euro. Phys. J. C15 (2000) 1.
[2] C.T. Hung, S.N. Yang, and T.-S.H. Lee, J. Phys. G20 (1994) 1531; Phys. Rev. C64 (2001)034309.
[3] S.N. Yang, J. Phys. G11 (1985) L205.
[4] S.S. Kamalov, S.N. Yang, D. Drechsel, O. Hanstein, and L. Tiator, Phys. Rev. C64 (2001)032201(R).
[5] D. Drechsel, O. Hanstein, S.S. Kamalov, and L. Tiator, Nucl. Phys. A645 (1999) 145.
[6] M.M. Giannini, E. Santopinto, A. Vassallo, Nucl. Phys. A699 (2002) 308.
[7] R.A. Arndt, I.I. Strakovsky, R.L. Workman, and M.M. Pavan, Phys. Rev. C52 (1995) 2120
[8] R.A. Arndt, W.J. Briscoe, I.I. Strakovsky, and R.L. Workman, Phys. Rev. C66 (2002)055213 and private communication.
[9] B. Saghai and Zhenping Li, Eur. Phys. J. A11 (2001) 217 and nucl-th/0202007.
[10] G.Y. Chen, S. Kamalov, S.N. Yang, D. Drechsel, L. Tiator, Nucl. Phys. A723, (2003) 447.
H2.4.4 The reaction γp → π0γ′p and the magnetic dipole moment of the ∆+(1232) reso-nance
J. AHRENS, J.R.M. ANNAND1, R. BECK, G. CASELOTTI, L.S. FOG1, D. HORNIDGE,S. JANSSEN2 , M. Kotulla2 , B. KRUSCHE3, J.C. MCGEORGE1 , I.J.D. MCGREGOR1,K. MENGEL2 , J.G. MESSCHENDORP2 , V. METAG2 , R. NOVOTNY2, M. PFEIFFER2 , M.ROST, S. SACK2, R. SANDERSON1, S. SCHADMAND2, D.P. WATTS1
1Department of Physics and Astronomy, University of Glasgow, Glasgow G128QQ, UK2II. Physikalisches Institut, Universit at Gießen, D–35392 Gießen, Germany3Department of Physics and Astronomy, University of Basel, CH-4056 Basel (Switzerland)
The magnetic moment is an important observable for testing theoretical baryon structure cal-culations. Different predictions for the magnetic moment were made in several calculations[1, 2, 3, 4]. The magnetic moments of the octet of baryons (N,Λ,Σ,Ξ) of the SU(3) flavor

168 CHAPTER 2. REPORT ON THE PROJECTS
symmetry classification are known very accurately through spin precession measurements.However, for the decuplet baryons, only the Ω− magnetic moment has been determined asthe lifetime of the other decuplet members is too short for this technique. If SU(3) flavoursymmetry were to hold, the ∆ and the nucleon would be degenerate in mass and their magneticmoments related through µ∆ = Q∆µp, where Q∆ is the ∆ charge and µp the proton magneticmoment. However, structure calculations predict significant deviations from this SU(3) value.
1232
E / MeV
938
p°
g´
proton
g
Figure H2.33: Method to study the static electromagnetic properties of the ∆+(1232) isobar. The γ′transition carries the information of the magnetic moment of the ∆+.
It has been proposed that the electromagnetic structure of the ∆ can be determined by measur-ing a γ-transition within the resonance [5]. This method is depicted in Fig. H2.33, which showsan energy level diagram with the proton (nucleon) as the ground state and the ∆ as the firstexcited state. The ∆ structure can be probed by exciting the proton to a ∆, which then emits areal photon and subsequently decays into a nucleon and a pion. Spin and parity conservationrequire that the lowest order electromagnetic transition is magnetic dipole (M1) radiation.This ∆ → ∆γ′ amplitude is proportional to µ∆+ and was recently investigated in theoreticalcalculations [6, 7, 8]. The next allowed multipole is the electric quadrupole (E2) transition, butthis amplitude vanishes in the limit of zero photon energy because of time reversal symmetry[9]. The E2/M1 ratio of the transition amplitude N → ∆ has been measured to be very small,approx 0.025 [10], which leads to the assumption that the quadrupole deformation of the ∆is very small. The magnetic octupole (M3) transition is suppressed by two additional powersof photon momentum. Hence, the measurement of the reaction γp → π0γ′p provides access toµ∆+ . Unfortunately this final state can also result from bremsstrahlung radiation of the inter-mediate ∆ and the proton. These contributions are of the same order as the ∆ → ∆γ ′ transitionof interest. Nonresonant contributions are expected to play a minor role, since the partial wavedecomposition of the related elastic channel γp → π0 p shows the dominance of the ∆ resonantreaction process [11]. The reaction channel γp → π+γ′n is in that sense less favorable forextracting the magnetic moment of the ∆+ isobar. An accurate theoretical description of allprocesses contributing to γp → π0γ′p is crucial for extracting a precise value for µ∆+ .The magnetic moment of the ∆++ isobar was extracted in a similar way from the reaction

SUBPROJECT H2: MESONIC STRUCTURE OF THE NUCLEON 169
π+p → π+γ′p. Two experiments at the University of California (UCLA) [12] and the Schweiz-erisches Institut fur Nuklearforschung (SIN, now called PSI) [13] have been performed and asa result of many theoretical analyses of these data the Particle Data Group [14] quotes a rangeof µ∆++ = 3.7–7.5 µN (where µN is the nuclear magneton). The large uncertainty in the extrac-tion of µ∆++ is due to the strong contribution of π+ bremsstrahlung and model dependencies.In the reaction channel described here, the bremsstrahlung contributions are much weaker.The reaction γp → π0γ′p was measured at the electron accelerator Mainz Microtron (MAMI)using the Glasgow tagged photon facility and the photon spectrometer TAPS. A quasi--monochromatic photon beam was produced via bremsstrahlung tagging. The photon energycovered the range 205–820 MeV with an average energy resolution of 2 MeV. The TAPSdetector consisted of six blocks each with 62 hexagonally shaped BaF2 crystals arranged in an8×8 matrix and a forward wall with 138 BaF2 crystals arranged in a 11×14 rectangle. Eachcrystal is 250 mm long with an inner diameter of 59 mm. The six blocks were located in ahorizontal plane around the target at angles of ±54, ±103 and ±153 with respect to thebeam axis. Their distance to the target was 55 cm and the distance of the forward wall was60 cm. This setup covered ≈40% of the full solid angle. All BaF2 modules were equipped with5 mm thick plastic detectors for the identification of charged particles. The liquid hydrogentarget was 10 cm long with a diameter of 3 cm. Further details are described in.The measurement of the γp → π0γ′p reaction channel was exclusive since the 4-momenta of allparticles in the final state were determined. The π0 mesons were detected via their two photondecay channel and identified in a standard invariant mass analysis from the measured photonmomenta. The two π0 decay photons and the γ′ photon in the final state were distinguished byusing the π0 invariant mass as a selection criterion. The two photons with an invariant massclosest to the π0 mass were assigned to be the decay photons. The protons were identifiedusing the excellent time resolution of the TAPS detector and the deposited proton energy: Thecharacteristic time of flight dependence on the energy of the proton and a pulse shape analysiswere sufficient to identify the proton uniquely. The proton energy calibration was performed byexploiting energy balance of the exclusively measured γp → π0 p channel, thereby compensat-ing for the energy loss in the target and plastic detectors. Random TAPS - tagging spectrometercoincidences were subtracted using background events outside the prompt coincidence timewindow.
Further kinematic checks were performed by exploiting the kinematic overdetermination ofthe reaction. Special attention had to be paid to background from 2π0 production arising fromevents in which one of the four 2π0 decay photons escaped detection due to the limited solidangle coverage of the detector. In a first step, the conservation of the total momentum waschecked in the three cartesian directions respectively. After that, a missing mass analysis wasperformed to discriminate the 2π0 contamination. The following missing mass was calculated:
M2X = ((Eπ0 +Ep)− (Ebeam +mp))
2
−((~pπ0 +~pp)− (~pbeam))2 (H2.33)
where Eπ0 ,~pπ0 ,Ep,~pp denote the energy and momenta of the π0 and proton in the final stateand mp the proton mass. The resulting distributions (Fig. H2.34) show two distinct peaks,the widths of which are determined by the detector resolution. The peak near 0.02 GeV2 re-flects the missing mass of a π0 and therefore originates from the 2π0 production, while thepeak at 0 GeV2 indicates the missing mass of a photon and hence the π0γ′p production. A

170 CHAPTER 2. REPORT ON THE PROJECTS
0
5
10
15
20
25
30
35
-0.04 -0.02 0 0.02 0.04
375<Eγ<425MeV
m2X / GeV2
coun
ts /
0.00
1 G
eV2
0
20
40
60
80
100
-0.04 -0.02 0 0.02 0.04
425<Eγ<475MeV
m2X / GeV2
coun
ts /
0.00
1 G
eV2
Figure H2.34: Missing mass of the (π0 p) system in the final state, but with an additional photon detectedfor two different incident photon energies. The peak near 0.02 GeV2 originates from 2π0 production andis cut away. The peak at 0 GeV2 shows the true π0γ′p production. The dashed and dotted lines show thecorresponding simulated lineshapes using GEANT3.
Monte Carlo simulation of the 2π0 and π0γ′p reactions using GEANT3 reproduces the line-shape of the measured data. The nearly background free identification of the γp → π0γ′preaction is demonstrated in Fig. H2.34. The remaining small 2π0 background due to the fi-nite detector resolution (16% in the highest energy bin) is subtracted for the cross sectiondetermination. Since the information of the photon γ′ has not been used for evaluating themissing mass defined in Eq. H2.33, another kinematic check has to prove that the photonγ′ is not accidental. Therefore the energy balance was calculated to test energy conservation:EBAL = (Ebeam +mp)−(Eπ0 +Ep +Eγ′) ; the notation is the same as in Eq. (H2.33). The energybalance confirms the clean identification of the π0γ′p reaction channel.
The cross section was deduced from the rate of the π0γ′p events divided by the number of hy-drogen atoms per cm2, the photon beam flux, the branching ratio of π0 decay into two photons,and the detector and analysis efficiency. The intensity of the photon beam was determined bycounting the scattered electrons in the tagger focal plane and measuring the loss of photon in-tensity with a 100%-efficient BGO detector which was moved into the photon beam at loweredintensity. The geometrical detector acceptance and analysis efficiency due to cuts and thresh-olds were obtained using the GEANT3 code and an event generator producing distributions ofthe final state particles according to [9]. The systematic errors of the efficiency determinationare small because the shape of the measured distribution is reproduced by the simulation. Theaverage value for the detection efficiency is 0.25%.The measured differential cross sections for the reaction γp → π0γ′p are shown in Fig. H2.35for three different incident excitation energies
√s (i.e. the total γp center of mass energy), start-
ing at the ∆ resonance position and going up to 100 MeV above it. The angular distributionof the photon γ′ in the CM system shows an enhancement for angles around 120. The energydistribution shifts towards higher γ′ energies with rising
√s, showing an 1/Eγ form with an
additional peak, where the strength and the position depend on the excitation energy√
s. Thedifferent reaction mechanisms suggest such a behavior, where the 1/Eγ dependence stems fromthe external bremsstrahlung of the proton in the final state. The position of the peak structure

SUBPROJECT H2: MESONIC STRUCTURE OF THE NUCLEON 171
Figure H2.35: Differential cross sections for three different incident excitation energies√
s in the CMframe. The systematic errors are shown as a bar chart. Left: angular distribution of the photon γ′; mid-dle: energy distribution. The lines show the calculation [9] for three different values of the anomalousmagnetic moment κ∆+ = 0, 3 and 6. On the right side, the energy distribution has been divided by theprediction of the soft photon limit σ0/Eγ , respectively for the data and the calculation.
(the energy of γ′) originating partly from the ∆ radiation is determined by the difference of√s and the ∆ peak mass and a small correction due to the available phase space. The ∆ decay
mechanism contribution is emphasized, when the energy differential cross section is dividedby 1/Eγ (compare the column on the right hand side of Fig. H2.35).The first series of calculations, including only the resonant ∆ → ∆γ′ process as indicated inFig. H2.33, were done by Machavariani et al. [6, 7] and Drechsel et al. [8]. Both groups use theeffective Lagrangian formalism and in addition the latter group uses a quark model approachto describe the reaction. Since these calculations consider only the Feynman diagram whichis sensitive to µ∆+ , they cannot reproduce the measured cross sections. Recently, Drechsel andVanderhaeghen [9] extended their model and included bremsstrahlung diagrams (resonant ∆,non-resonant Born diagrams and ω exchange). This calculation is shown in comparison to themeasured cross sections in Fig. H2.35. The overall shape is reproduced very well, although theabsolute value is overestimated for the highest excitation energy. This is related to a overesti-mate in the calculation of the reaction γp → π0 p, which is well understood and attributed to πNrescattering contributions [9]. A model independent determination of the π0γ′p cross section isfeasible in the soft photon limit, which relates π0γ′p production to π0 p production in the limitof vanishing photon energy Eγ′ [15]:
limEγ′→0
(
dσdEγ′
)
= 1Eγ′
·σ0 (H2.34)

172 CHAPTER 2. REPORT ON THE PROJECTS
σ0 =R
dΩπ0
(
dσdΩπ0
)
· 2αemπ
(
v2+12v
)
ln
(
v+1v−1−1
)
(H2.35)
v =
√
1− 4m2p
t , t = (k− pπ0)2 (H2.36)
dσ/dΩπ0 labels the differential cross section for π0 p production, mp the proton mass, t the fourmomentum transfer between the initial photon and the π0 meson and αem = e2/4π ≈ 1/137.According to Eq. (H2.34), the energy differential cross section divided by σ0/Eγ′ should beequal to 1 in the limit of zero photon energy Eγ′ . This ratio is shown in the right column ofFig. H2.35, where the differential cross section dσ/dΩπ0 in Eq. (H2.34) is calculated with thesame effective Lagrangian model [9]. For comparison to the experimental results, the data arealso plotted as a cross section ratio where σ0 has been determined from Eq. (H2.34) usingconsistently the measured differential cross section dσ/dΩπ0 of the γp → π0 p reaction. Thecross section ratios show better agreement; they are less sensitive to uncertainties in the modelcalculation as well as uncertainties in the determination of the photon flux and target length.The sensitivity to the magnetic moment of the ∆+ is illustrated in Fig. H2.35 by the differenceof the three curves. The ∆+ magnetic moment can be obtained from the anomalous magneticmoment κ∆+ which is the only free parameter of the calculation [9]
µ∆+ = (1+κ∆+) · e2m∆
= (1+κ∆+) · mN
m∆·µN (H2.37)
where µN = e/2mN is the nuclear magneton. A combined maximum likelihood analysis [14]of the three cross section ratios in Fig. H2.35 yields a value [16] of µ∆+ = (2.7+1.0
−1.3 ±1.5)µN ,
the goodness of fit is χ2/F = 1.8 (F=21). The first error represents the statistical uncertainty andthe second one reflects the systematic errors given in Fig. H2.35. This error does not includethe systematic error of the model calculation which is of the order of ±3µN , estimated from theuncertainties discusssed in [9]. The extracted value of µ∆+ is in the range of different baryonstructure calculations [1, 2, 3, 4], but not sensitive enough to discriminate between them. Thissituation calls for a follow up experiment with much higher statistical precision, using so thatthe kinematic regions most sensitive to µ∆+ can be exploited. An investigation of the crosssection asymmetry using a polarized photon beam would also be valuable [17]. Supplementary,an improvement in the theoretical description is necessary to minimize the model dependence.The measurement can be extended to higher excited states of the nucleon. In particular themagnetic moment of the S11(1535) resonance is accessible via the reaction γp → ηγ′p becauseof its clean distinction from other resonances in the second resonance region through the ηchannel.
[1] Leinweber et al., Phys. Rev. D46 (1992) 3067.
[2] M. Butler et al., Phys. Rev. D49 (1994) 3459.
[3] H. Kim et al., Phys. Rev. D57 (1998) 2859.
[4] T. Aliev et al., Phys. Rev. D 62 (2000) 053012.
[5] L. Kontratyuk and L. Ponomarev, Yad. Fiz. 7 (1968) 11 Sov. J. Nucl. Phys. 7 (1968) 82.
[6] A. Machavariani et al., Nucl. Phys. A646 (1999) 231.
[7] A. Machavariani et al., Nucl. Phys. A686 (2002) 601.

SUBPROJECT H2: MESONIC STRUCTURE OF THE NUCLEON 173
[8] D. Drechsel et al., Phys. Lett. B484(2000) 236.
[9] D. Drechsel and M. Vanderhaeghen, Phys. Rev. C64 (2001) 065202.
[10] R. Beck et al., Phys. Rev. Lett. 78 (1997) 606.
[11] D. Drechsel et al., Nucl. Phys. A645 (1999) 145;http://www.kph.uni-mainz.de/MAID.
[12] B. Nefkens et al., Phys. Rev. D18 (1978) 3911.
[13] A. Bosshard et al., Phys. Rev. D44 (1991) 1962.
[14] D. Groom et al., Eur. Phys. J.A (2000) 1.
[15] W.-T. Chiang et al., nucl-th/0201161.
[16] M. Kotulla et al., Phys. Rev. Lett 89 (2002) 272001.
[17] R. Beck, M. Kotulla and A. Starostin, MAMI proposal MAMI/A2/01-02 .
H2.5 Meson Polarizabilities
H2.5.1 A measurement of the π+ meson polarizability
J. AHRENS, V.M ALEXEEV1 , J.R.M. ANNAND2, H.J. ARENDS, R. BECK, S.N.CHEREPNYA1 , D. DRECHSEL, L.V. FIL’KOV1 K. FOHL3, I. GILLER4 , P. GRABMAYR5,D. HORNIDGE, S. JANSSEN6 , V.L. KASHEVAROV1 M. KOTULLA7 , D. KRAMBRICH, B.KRUSCHE7, J.C. MACGEORGE2 , I.J.D. MACGREGOR2, V. METAG6 , M. MOINESTER4 ,R. NOVOTNY6, M. PFEIFFER6 , M. ROST, S. SCHADMAND6, S. SCHERER, Th. WALCHER
1P.N.Lebedev Physical Institute, Moscow, Russia2Department of Physics and Astronomy, University of Glasgow, Glasgow G128QQ, UK3School of Physics, University of Edinburg, Edinburg, U4Tel-Aviv University, Tel-Aviv, Israel5Physikalisches Institut, Universit at T ubingen, Germany6II. Physikalisches Institut, Universit at Gießen, D–35392 Gießen, Germany7Department of Physics and Astronomy, University of Basel, CH-4056 Basel (Switzerland)
The pion polarizabilities characterize the dynamical deformation of the pion in the electro-magnetic field. The values of the electric α and magnetic β pion polarizabilities depend onthe rigidity as a composite particle and provide importartant information of internal structure.Very different values for the pion polarizabilities have been calculated in the past. All predic-tions agree, however, that the sum of the two polarizabilities of the π± meson is very small.On the other hand, the values of the difference of the polarizabilities are very sensitive to thetheoretical models. The investigations within the framework of the chiral perturbation the-ory (ChPT ) predict (α−β)π± ≈ 5.4 [1] in one-loop calculations and 4.4± 1.0 for two-loops[2] (all values of the polarizabilities are given in units of 10−4 f m3). The calculations in theextended Numbu-Jona Lasino model with linear realization of chiral U(3)×U(3) symme-try [3] result in απ± = −βπ± = 3.0± 0.6. The application of dispersion sum rules (DSR) atfixed value of the Mandelstam variable u = µ2 for calculation of this parameter [4, 5] leads to(α−β)π± = 10.3±1.9 and (α−β)π0 =−3.01±2.06. DSR at finite energy [6] gave the similar

174 CHAPTER 2. REPORT ON THE PROJECTS
Experiments απ±/10−4 f m3 απ0/10−4 f m3
π−Z → γπ−Z, Serpukhov (1983) [9] 6.8±1.4±1.2γp → γπ+n, Lebedev Phys.Inst. (1984) [10] 20±12D. Babusci et al. (1992) [11]γγ → π+π−: PLUTO (1984) [12] 19.1±4.8±5.7
DM 1 (1986) [13] 17.2±4.6DM 2 (1986) [14] 26.3±7.4MAPK II (1990) [15] 2.2±1.6
γγ → π0π0: Crystal Ball (1990) [16] ±0.69±0.11F. Donoghue, B. Holstein (1993) [17]γγ → π+π−: MARK II 2.7±?γγ → π0π0: Crystal Ball −0.5±?
(α+β)π0/10−4 f m3 (α−β)π0/10−4 f m3
A. Kaloshin, V. Serebryakov (1994) [18]γγ → π0π0: Crystal Ball 1.00±005 −0.6±1.8L. Fil’kov, V. Kashevarov (1999) [5]γγ → π0π0: Crystal Ball 0.98±003 −1.6±2.2
Table H2.6: The experimental data available at present for the pion polarizabilities.
result for the charged pions ((α−β)π± = 10.6) and smaller value with large uncertainties forthe neutral pions, (α− β)π0 = 0.3± 5. A calculation in the linear σ model with quarks andvector mesons included to one loop order predicted (α−β)π± = 20 [7]. An evaluation in theDubna quark confinement model [8] results in (α−β)π± = 7.05 and (α−β)π0 = 1.05.The experimental information available so far for the polarizability of the pion is summarized
in table 1. The scattering of high energy pions off the Coulomb field of heavy nuclei [9] hasresulted in απ− = −βπ− = 6.8±1.4±1.2. This value agrees with prediction of the dispersionsum rules but is about 2.5 times larger than the ChPT result. The experiment of the LebedevInstitute on radiative pion photoproduction from the proton [10] has given απ+ = 20±12. Thisvalue has large error bars and shows the largest discrepancy with regard to the ChPT predic-tions. The attempts to determine the polarizability from the reaction γγ → ππ suffer greatlyfrom theoretical and experimental uncertainties. The most recent analysis of MARK II andCrystal Ball data [17] finds no evidence for a violation of the ChPT predictions. However,even changes of polarizabilities by 100% and more are still compatible with the present errorbars. As seen from this table our present experimental knowledge about the pion polarizabilityis still quite unsatisfactory.The pion polarizability can be extracted from the experimental data on the radiative pion pho-toproduction either by extrapolating these data to the pion pole [19] or by comparing the ex-perimental cross section with the predictions of different theoretical models directly. The theo-retical calculations of the cross section of the γp → γπ+n reaction show that the contribution ofnucleon resonance is suppressed for the photons scattered backward in the cms. Moreover, in-tegration over φ and θcm
γπ0 essentially decreased the contribution of resonances from the crossedchannels. Therefore, we will consider the cross section of the radiative pion photoproductionintegrated over φ from 0 to 360 and over θcm
γγ′ from 140 to 180.
Z 360
0dφ
Z −0.766
−1d cos θcm
γγ′dσγp→γπ+n
dtds1dΩγγ. (H2.38)

SUBPROJECT H2: MESONIC STRUCTURE OF THE NUCLEON 175
The cross section of the process γp → γπ+n has been calculated in the frame work of twodifferent models. In the first model (model-1) the contribution of all the pion and nucleonpole diagrams in the model with the pseudoscalar coupling [22] is taken into account. In thesecond model (model-2), in additional to the nucleon and the pion pole diagrams without theanomalous magnetic moments of the nucleons, the contribution of the ∆(1232), P11(1440),D13(1520), and S11(1535) resonances is considered. We will determine the pion polarizabilityby comparing the experimental data with predictions of these theoretical models in differentregions of s1.
The experiment has been performed at the continuous-wave electron accelerator MAMI Busing Glasgow tagged photon facility. The quasi-monochromatic photon beam covered the en-ergy range from 537 to 819 MeV with an intensity ∼ 0.6×10⁶/s in the tagger channel for thelowest photon energy and average energy resolution of 2 MeV. The tagged photons entered ascattering chamber, containing a 3 cm diameter and 11.4 cm long liquid hydrogen target withCapton windows. The emitted photon γ′, π+ meson, and the neutron were detected in coin-cidence. The experimental setup is shown in Fig. H2.36. The photons were detected by thespectrometer TAPS, assembled in a special configuration (Fig. H2.37). The TAPS spectrome-ter consists of 528 BaF2 crystals. Each crystal is 250 mm long corresponding to 12 radiationlengths and hexagonally shaped with an inner diameter of 59 mm. All crystals were arrangedinto three big blocks. Two blocks (A,B) consisted of 192 crystals arranged in 11 columnsand the third block (C) had 144 crystals arranged in 11 columns. These three blocks were lo-cated in the horizontal plane around the target at angles 68, 124, 180 with respect to thebeam axis. Their distances to the target center were 55 cm, 50 cm and 55 cm, respectively. AllBaF2 modules were equipped with 5 mm thick plastic veto detectors for the identification ofcharged particles. The neutrons were detected by a wide aperture time-of-flight spectrometer(TOF). It consisted of 111 scintillation-detector bars of 50×200×3000 mm3 and 16 counters(10× 230× 3000 mm3) which were used as veto detectors. The bars are made from NE110plastic scintillator and each bar is read out on both ends by two 3′′ phototubes XP2312B. Allbars were assembled in 8 planes of a special configuration with 16 detectors in each, followingone after another (Fig. H2.36). Thus we had a big block with a size of 3× 3× 1 m3. Such aneutron detector allows a detection the neutrons in the energy region 10-100 MeV with effi-ciency 30−50% and a determination of their energy with a resolution ∼ 10% using the neutrontime of flight and the angle of the neutron emission measured with a precision ∼ 2− 3%. Todetect the π+ meson two two-coordinate multi-wire proportional chambers (MWPC) and aforward scintillator detector (FSD), for getting a fast trigger signal, have been developed andconstructed. The MWPCs were located under 0 with respect to the beam direction. Their sen-sitive areas covered angles in the laboratory system θ ∼= 2−20, φ ∼= 0−360. The MWPCshave the following characteristics:
• sensitive region: 292×292 mm2,
• dead region in the center: 40×40 mm2,
• anode wires: gold plated tungsten 20 µm,
• distance between wires: 2 mm,
• cathode planes: 25 µm aluminum foil,
• gas windows: 50 µm mylar foil,

176 CHAPTER 2. REPORT ON THE PROJECTS
x
z
AB
C LH2
MWPC + FSD
TOF
γ-beam
Figure H2.36: Floor plan of the experimental setup showing the location of the detectors. A, B, C areTAPS-blocks, MWPC+FSD show multi-wire proportional chambers and forward scintillation detector,TOF indicates the block of the neutron detector bars, LH2 stands for the liquid hydrogen target in itsvacuum scattering chamber.
• anode-cathode gap: 5 mm,
• maximum current for all wires: 100 µA.
Each MWPC has two mutually perpendicular planes with 128 wires. The MWPCs operatedunder 60% of Argon and 30% of Isobutan gas mixture. The gas mixture was blown throughthe chambers with a flux of 180 ml/min. MWPCs were read by LeCroy 2735 DC cards. TheFSD had 16 plastic scintillator strips 1×2×30 cm3 with a 4×4 cm2 hole in the middle. Eachstrip had a photomultiplier tube at the end. The MWPCs were optimized for high count ratesand good efficiency. The first MWPC was located at an angle of 0 with respect to the beamaxis and at a distance 46 cm from the center of the target up to the first wire plane. The secondMWPC was placed behind the first one and was rotated by 45 around the beam axis. The FSDwas positioned between the first and second MWPCs. The whole setup has been assembled inthe tagger hall A2.In order to determine an efficiency of the γ and π+ detectors used in this experiment andto normalize the experimental data, the π0 meson photoproduction from the proton has beenmeasured and the cross section obtained was compared with the known ones. Neutral pions

SUBPROJECT H2: MESONIC STRUCTURE OF THE NUCLEON 177
A
B
C
LH2
FSD+MWPC
Figure H2.37: Enlarged view showing the details of the TAPS configuration.
produced in the liquid hydrogen target were detected via their two photons decay with theTAPS spectrometer. The MWPC and FSD were used to detect protons. The trigger was a coin-cidence between TAPS and FSD. About 2.5×10⁶ raw events were collected and after analysiswe had ∼ 5× 10⁵ events. The background of multiple pion production has been removed byconstructing the missing mass spectrum for the reaction γp→ π0X . Random coincidences weresubtracted by using background events outside the prompt coincidence time window. The an-gular distributions of these data in the energy region 480−530 MeV are shown in Fig. H2.38.The filled circles in these figures are data of the present work. The open circles are the dataobtained in [28]. The results of theoretical models MAID and DMT are depicted by the solidand dashed curves, respectively. The dotted curves are the results of the partial wave analysisSAID of the world experimental data. The present data for the angular distributions are in agood agreement with the experimental data of Ref. [28] and with the predictions of the modelsMAID, DMT and SAID analysis for the incoming photon energy up to ∼ 650 MeV . This resultshows that the efficiencies of the γ and π+ meson detectors in the experiment on the radiativepion photoproduction from the proton at MAMI B correspond well to the simulation result. Inorder to check the functioning of the neutron detector the data on the double pion photopro-duction γp → π0π+n were selected and analyzed. To this aim, π0 meson was reconstructed viaan invariant mass of two photons and then, using the measured data on the neutron, the missingmass spectrum for the π+ meson was constructed. On the other hand, the invariant mass of theπ0 and neutron gave a peak, the width and position of which corresponded to ∆0(1232) reso-nance. The analysis of the data obtained to the process γp → π0π+n indicated that this processis realized mainly through ∆0(1232) resonance in our kinematical region. The investigation of

178 CHAPTER 2. REPORT ON THE PROJECTS
0
2
4
6
8
100 120 140 160 180
0
2
4
6
8
100 120 140 160 180
0
2
4
6
8
100 120 140 160 180
0
2
4
6
8
100 120 140 160 180
0
2
4
6
8
100 120 140 160 180
0
2
4
6
8
100 120 140 160 180
Eγ = 480 MeV
dσ/d
Ω (
µb/s
r)
Eγ = 490 MeV
Eγ = 500 MeV
dσ/d
Ω (
µb/s
r)
Eγ = 510 MeV
Eγ = 520 MeV
dσ/d
Ω (
µb/s
r)
Eγ = 530 MeV
Θπ cm (deg)
Figure H2.38: The angular dependence of the differential cross section of the process γp → π0 p at theenergy 480−530 MeV. The open circles are the data from Ref. [28], the filled circles are the data of thepresent work. The solid, dashed, and dotted curves are results of the MAID, DMT calculations and theSAID analysis, respectively.
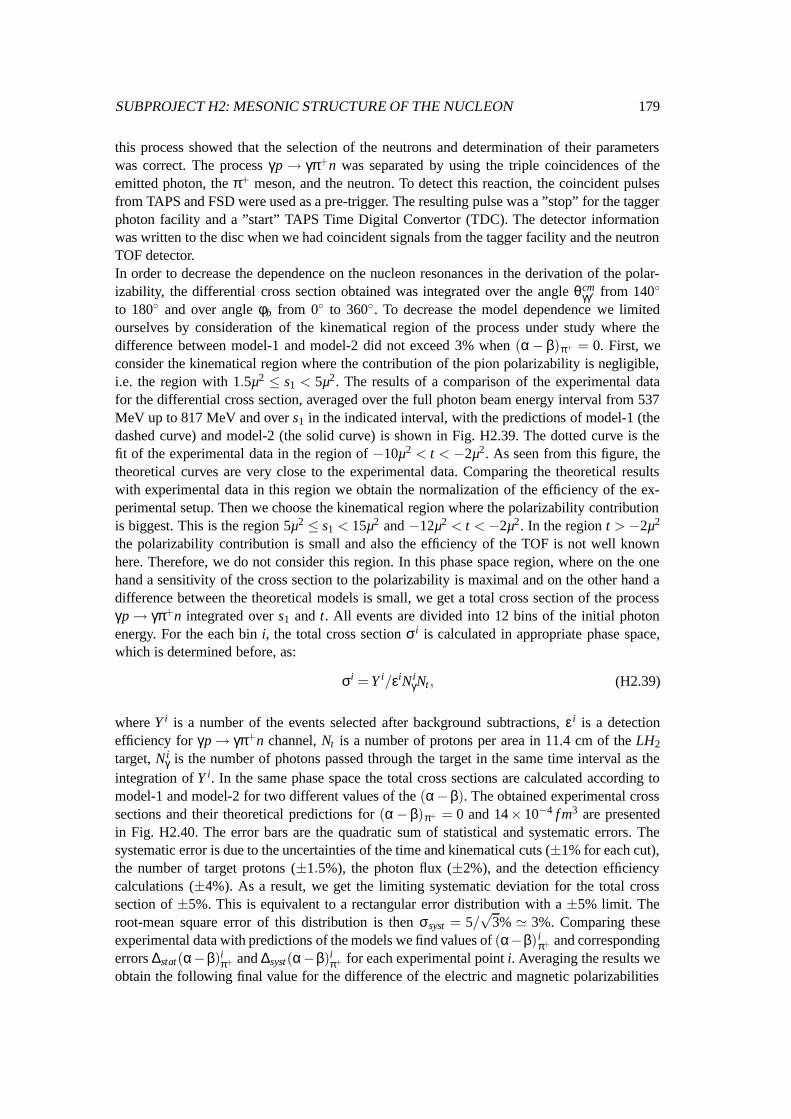
SUBPROJECT H2: MESONIC STRUCTURE OF THE NUCLEON 179
this process showed that the selection of the neutrons and determination of their parameterswas correct. The process γp → γπ+n was separated by using the triple coincidences of theemitted photon, the π+ meson, and the neutron. To detect this reaction, the coincident pulsesfrom TAPS and FSD were used as a pre-trigger. The resulting pulse was a ”stop” for the taggerphoton facility and a ”start” TAPS Time Digital Convertor (TDC). The detector informationwas written to the disc when we had coincident signals from the tagger facility and the neutronTOF detector.In order to decrease the dependence on the nucleon resonances in the derivation of the polar-izability, the differential cross section obtained was integrated over the angle θcm
γγ′ from 140
to 180 and over angle φb from 0 to 360. To decrease the model dependence we limitedourselves by consideration of the kinematical region of the process under study where thedifference between model-1 and model-2 did not exceed 3% when (α− β)π+ = 0. First, weconsider the kinematical region where the contribution of the pion polarizability is negligible,i.e. the region with 1.5µ2 ≤ s1 < 5µ2. The results of a comparison of the experimental datafor the differential cross section, averaged over the full photon beam energy interval from 537MeV up to 817 MeV and over s1 in the indicated interval, with the predictions of model-1 (thedashed curve) and model-2 (the solid curve) is shown in Fig. H2.39. The dotted curve is thefit of the experimental data in the region of −10µ2 < t < −2µ2. As seen from this figure, thetheoretical curves are very close to the experimental data. Comparing the theoretical resultswith experimental data in this region we obtain the normalization of the efficiency of the ex-perimental setup. Then we choose the kinematical region where the polarizability contributionis biggest. This is the region 5µ2 ≤ s1 < 15µ2 and −12µ2 < t < −2µ2. In the region t > −2µ2
the polarizability contribution is small and also the efficiency of the TOF is not well knownhere. Therefore, we do not consider this region. In this phase space region, where on the onehand a sensitivity of the cross section to the polarizability is maximal and on the other hand adifference between the theoretical models is small, we get a total cross section of the processγp → γπ+n integrated over s1 and t. All events are divided into 12 bins of the initial photonenergy. For the each bin i, the total cross section σi is calculated in appropriate phase space,which is determined before, as:
σi = Y i/εiN iγNt , (H2.39)
where Y i is a number of the events selected after background subtractions, εi is a detectionefficiency for γp → γπ+n channel, Nt is a number of protons per area in 11.4 cm of the LH2
target, N iγ is the number of photons passed through the target in the same time interval as the
integration of Y i. In the same phase space the total cross sections are calculated according tomodel-1 and model-2 for two different values of the (α−β). The obtained experimental crosssections and their theoretical predictions for (α− β)π+ = 0 and 14× 10−4 f m3 are presentedin Fig. H2.40. The error bars are the quadratic sum of statistical and systematic errors. Thesystematic error is due to the uncertainties of the time and kinematical cuts (±1% for each cut),the number of target protons (±1.5%), the photon flux (±2%), and the detection efficiencycalculations (±4%). As a result, we get the limiting systematic deviation for the total crosssection of ±5%. This is equivalent to a rectangular error distribution with a ±5% limit. Theroot-mean square error of this distribution is then σsyst = 5/
√3% ' 3%. Comparing these
experimental data with predictions of the models we find values of (α−β) iπ+ and corresponding
errors ∆stat(α−β)iπ+ and ∆syst(α−β)i
π+ for each experimental point i. Averaging the results weobtain the following final value for the difference of the electric and magnetic polarizabilities

180 CHAPTER 2. REPORT ON THE PROJECTS
t/µ2
dσ/d
s 1dt
(nb/
µ4 )
0
0.2
0.4
0.6
0.8
1
1.2
-10 -9 -8 -7 -6 -5 -4 -3 -2 -1 0
Figure H2.39: The differential cross section of the process γp → γπ+n averaged over of full photonbeam interval and s1 from 1.5µ2 to 5µ2. The solid and dashed curves are the predictions of model-1 andmodel-2, respectively, at (α−β)π+ = 0. The dotted curve is a fit to the experimental data.
of the π+ meson:
(α−β)π+ = (11.6±1.5stat ±3.0syst ±0.5model)×10−4 f m3. (H2.40)
As indicated above, the determinant systematic error is caused by the uncertainties in the neu-tron detector efficiency. However, this is a difficult problem to overcome since better neutrondetectors are hardly possible.
[1] J.F. Donoghue, B.R.Holstein, Phys. Rev. D40, 2378 (1989); J. Bijnens, F. Cornet, Nucl.Phys. B296, 557 (1988); B.R. Holstein, Comments Nucl. Part. Phys. 19, 221 (1990); SBelluci, J. Gasser, M.E. Sainio, Nucl. Phys. B423, 80 (1994).
[2] U. Burgi, Nucl. Phys. B479, 392 (1997).
[3] A.N. Ivanov, M. Nagu, N.I. Troitskaya, Mod. Phys. Lett. A7, 1997 (1992).
[4] L.V. Fil’kov, I. Guiasu, E.E. Radescu, Phys. Rev. D26, 3146 (1982).
[5] L.V. Fil’kov, V.L. Kashevarov, Eur. Phys. J. A5, 285 (1999).
[6] V.A. Petrun’kin, Sov. J. Part. Nucl. 12, 278 (1981).
[7] V. Bernard, B. Hiller, W. Weise, Phys. Lett. B205, 16 (1988).
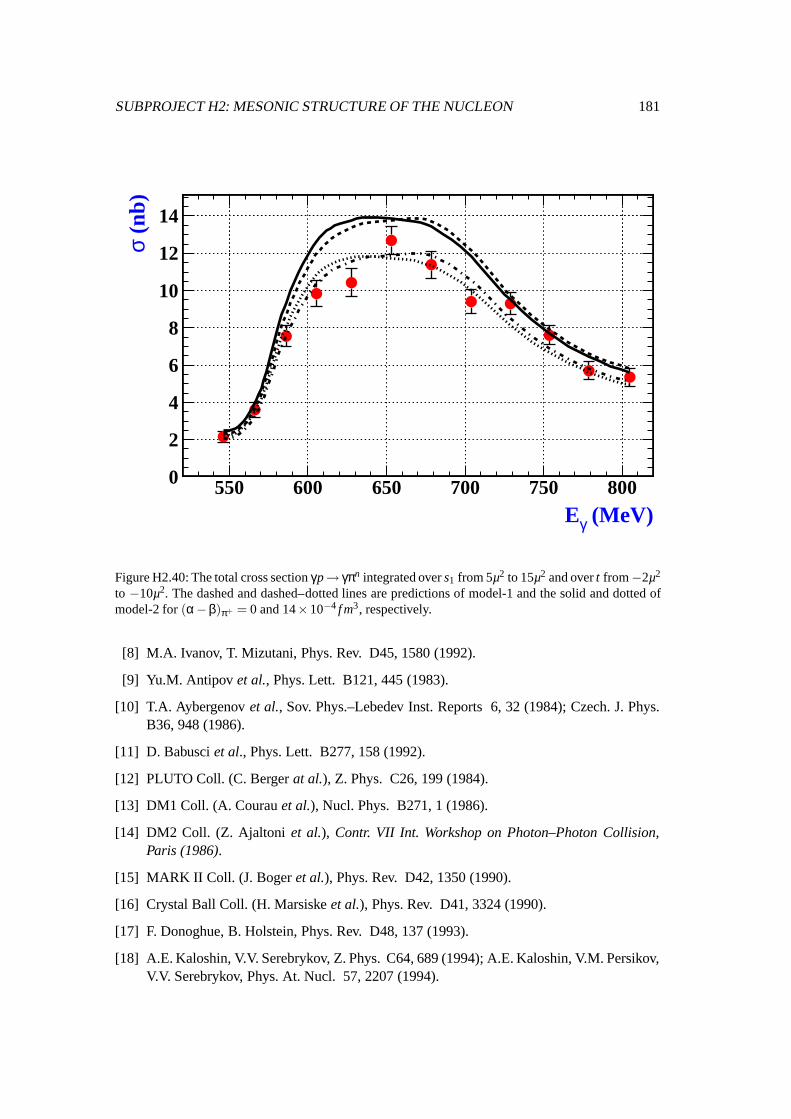
SUBPROJECT H2: MESONIC STRUCTURE OF THE NUCLEON 181
Eγ (MeV)
σ (n
b)
0
2
4
6
8
10
12
14
550 600 650 700 750 800
Figure H2.40: The total cross section γp→ γπn integrated over s1 from 5µ2 to 15µ2 and over t from −2µ2
to −10µ2. The dashed and dashed–dotted lines are predictions of model-1 and the solid and dotted ofmodel-2 for (α−β)π+ = 0 and 14×10−4 f m3, respectively.
[8] M.A. Ivanov, T. Mizutani, Phys. Rev. D45, 1580 (1992).
[9] Yu.M. Antipov et al., Phys. Lett. B121, 445 (1983).
[10] T.A. Aybergenov et al., Sov. Phys.–Lebedev Inst. Reports 6, 32 (1984); Czech. J. Phys.B36, 948 (1986).
[11] D. Babusci et al., Phys. Lett. B277, 158 (1992).
[12] PLUTO Coll. (C. Berger at al.), Z. Phys. C26, 199 (1984).
[13] DM1 Coll. (A. Courau et al.), Nucl. Phys. B271, 1 (1986).
[14] DM2 Coll. (Z. Ajaltoni et al.), Contr. VII Int. Workshop on Photon–Photon Collision,Paris (1986).
[15] MARK II Coll. (J. Boger et al.), Phys. Rev. D42, 1350 (1990).
[16] Crystal Ball Coll. (H. Marsiske et al.), Phys. Rev. D41, 3324 (1990).
[17] F. Donoghue, B. Holstein, Phys. Rev. D48, 137 (1993).
[18] A.E. Kaloshin, V.V. Serebrykov, Z. Phys. C64, 689 (1994); A.E. Kaloshin, V.M. Persikov,V.V. Serebrykov, Phys. At. Nucl. 57, 2207 (1994).

182 CHAPTER 2. REPORT ON THE PROJECTS
[19] D. Drechsel, L.V. Fil’kov, Z. Phys. A349, 177 (1994).
[20] J. Ahrens et al., Few-Body Syst.Suppl. 9, 449 (1995).
[21] J. Ahrens et al., Preprint of Lebedev Phys. Inst. No 52 (1996).
[22] Ch. Unkmeir, PhD Thesis, Mainz University, (2000).
[23] Th. Walcher, Chiral Dynamics: Theory and Experiment III, Proceedings from the Institutefor Nuclear Theory, Vol. 11, 296, (2000).
[24] V.A. Petrun’kin, Sov. J. JETP, 13, 808 (1961); Nucl. Phys. 55, 197 (1964).
[25] A. Klein, Phys. Rev. 99, 998 (1955).
[26] H.F. Jones, M.D. Scadron, Nucl. Phys. B10, 71 (1969).
[27] L.V. Fil’kov, Sov. J. Nucl. Phys. 41, 636 (1985).
[28] R. Leukel, PhD Thesis, Mainz University, (2001).
[29] S.P. Baranov, A.A. Shikanyan, Sov. J. Nucl. Phys. 46, 1068 (1988).
[30] R. Prange, Phys. Rev. 110, 240 (1958).
[31] A.C. Hearn, Novo Cimento 21, 333 (1961).
[32] S.P. Baranov, Phys. Atom. Nucl. 60, 1322 (1997).
H2.5.2 Pion Generalized Dipole Polarizabilities by Virtual Compton Scattering πe →πeγ
C. UNKMEIR, A. OCHERASHVILI1 , T. FUCHS, M.A. MOINESTER1 , S. SCHERER
1 School of Physics and Astronomy, R. and B. Sackler Faculty of Exact Sciences,Tel Aviv University, 69978 Tel Aviv, Israel
Pion electromagnetic polarizabilities are important dynamical properties, providing a windowto the pion’s internal structure. In a classical picture, polarizabilities determine the global, i.e.integral, deformation response of a composite system in static, uniform external electric andmagnetic fields. In the pion VCS reaction γ∗π→ γπ with a virtual space-like initial-state photonand a real final-state photon, the so-called generalized polarizabilities (GPs) can be measuredin the space-like region. In the limit of a soft final real photon, q′ → 0, the structure-dependentresponse is encoded in three generalized dipole polarizabilities αL(q2), αT (q2), and β(q2) [1].The Fourier transforms of these functions are related to the electric polarization and magneti-zation induced by soft external fields [1]. In other words, the VCS generalized dipole polariz-abilities allow one to access the local polarization response, whereas the RCS polarizabilitiesα = αL(0) = αT (0) and β = β(0) only provide the integrated, i.e. global, response. Further-more, two electric polarizabilities are needed to fully reconstruct the electric polarization, thelongitudinal electric polarizability being related to the divergence of the induced electric polar-ization, and the transverse electric polarizability describing rotational displacements of chargeswhich do not result in a modification of the charge density (such as, e.g., a rotating sphericalcharge distribution). On the other hand, due to the transverse character of the magnetic induc-tion, only one generalized magnetic dipole polarizability appears.

SUBPROJECT H2: MESONIC STRUCTURE OF THE NUCLEON 183
Motivated by the success of the nucleon VCS experiment [2], in Ref. [3] we have studied thereaction
πe → πeγ, (H2.41)
to get a hold of the pion VCS matrix element γ∗(q)+π(pi) → γ(q′)+π(p f ), which can then beutilized as a new experiment for a pion polarizability measurement. For the numerical analysisof the above reaction, we made use of the results obtained in the framework of chiral pertur-bation theory at O(p4) [4] (see Fig. H2.41). At this order in the momentum expansion, thegeneralized dipole polarizabilities display a degeneracy, β(q2) = −αL(q2) = −αT (q2) whichwill be lifted at O(p6) and O(p8), respectively.
-3
-2
-1
0
1
2
3
0 0.05 0.1 0.15 0.2 0.25
π0
π±
Q2[GeV2]
α L[1
0-4fm
3 ]
Figure H2.41: O(p4) prediction for the generalized dipole polarizabilities αL(−Q2) of the charged pion(solid curve) and the neutral pion (dashed curve) as functions of Q2.
In Ref. [3] we have given explicit expressions for the differential cross section of the reac-tion π−e → π−eγ, for which the invariant amplitude has been calculated at the one-loop level,O(p4), in chiral perturbation theory. The non-Born part of the VCS amplitude depends onthe generalized dipole polarizability αL(q2). The total cross section has been calculated usingMonte Carlo integration programs (see Fig. H2.42). With the VCS event generation we wereable to identify regions of phase space which are sensitive to the pion polarizability.
[1] A. I. L’vov, S. Scherer, B. Pasquini, C. Unkmeir and D. Drechsel, Phys. Rev. C 64 (2001)015203.
[2] VCS Collaboration and A1 Collaboration (J. Roche et al.), Phys. Rev. Lett. 85 (2000)708.
[3] C. Unkmeir, A. Ocherashvili, T. Fuchs, M. A. Moinester and S. Scherer, Phys. Rev. C 65(2002) 015206.
[4] C. Unkmeir, S. Scherer, A. I. L’vov and D. Drechsel, Phys. Rev. D 61 (2000) 034002.

184 CHAPTER 2. REPORT ON THE PROJECTS
Figure H2.42: Total cross section of π−e → π−eγ as a function of α. α is given in units of 10−43 cm3.
H2.5.3 Mesonic Chiral Perturbation Theory at Order p6: Odd Intrinsic Parity Sector
T. EBERTSHAUSER, H.W. FEARING1, S. SCHERER
1 TRIUMF, Vancouver, British Columbia, Canada V6T 2A3
Starting from Weinberg’s pioneering work [1], the application of effective field theory (EFT) tostrong interaction processes has become one of the most important theoretical tools in the low-energy regime. The basic idea consists of writing down the most general possible Lagrangian,including all terms consistent with assumed symmetry principles, and then calculating matrixelements with this Lagrangian within some perturbative scheme [1]. A successful applicationof this program thus requires two main ingredients:
(1) a knowledge of the most general effective Lagrangian;
(2) an expansion scheme for observables in terms of a consistent power counting method.
The structure of the most general Lagrangian for mesonic chiral perturbation theory (ChPT)has been investigated for almost two decades. The effective Lagrangian density of ChPT isorganized as a string of terms with an increasing number of covariant derivatives and quarkmass terms,
L = L2 + L4 + L6 + · · · , (H2.42)
where the subscripts refer to the order in the momentum and quark mass expansion. The deriva-tive expansion essentially takes account of the vanishing interaction at low energies with theexplicit symmetry breaking due to the quark masses being treated perturbatively. At each orderthe most general Lagrangian compatible with chiral symmetry, parity, and charge conjugationinvariance is required. We work in the framework of ordinary ChPT, where the quark mass termis counted as O(p2), or, in other words, matrix elements are treated at a fixed ratio mquark/p2

185
[2]. A systematic treatment of physical matrix elements is made possible by Weinberg’s powercounting scheme [1]. For example, at O(p4) one has to consider tree-level diagrams with ex-actly one vertex from L4 and an arbitrary number of vertices from L2 or one-loop diagramswith vertices from L2. The most general structure of L4 was first discussed by Gasser andLeutwyler [2] and contains 10 low-energy coupling constants Li. Out of these, 8 are required toabsorb infinities generated by one-loop diagrams from L2. The finite pieces are not predictedby chiral symmetry and have to be determined from experimental data.
The ChPT action functional, which is (apart from the special case of the Wess-Zumino-Wittenterm) the four-dimensional space-time integral over some chirally invariant Lagrangian density,generates at any given chiral order a finite-dimensional real vector space. The finite dimensionis due to the fact that the basic building blocks can only be multiplied together in a finite num-ber of different ways. Unfortunately, there seems to be neither a way to predict this dimensionbeforehand nor a general algorithm to decide whether a set of given structures is linearly inde-pendent or not. That is the reason why it is almost impossible to tell if a generating system islinearly independent so that it actually represents a basis of the above mentioned vector space.To our knowledge even the L4 of [2] has not formally been shown to be a basis, though itis without any doubt a generating system and countless calculations seem to confirm that theterms are independent. In Ref. [3] we systematically wrote down the most general Lagrangiandensity of chiral order O(p6), both for the normal (→ 111 SU(3) terms) and anomalous (→32 SU(3) terms) sector. Although these sets are also most likely to be generating systems, thenormal sector was later shown to include redundant structures [4].
In Ref. [5] we provided a revised and slightly modified list of SU(N f ) terms for the anomalousor epsilon sector, as well as its reduction to SU(2) and SU(3). Thanks to a more efficient use ofpartial integration, the implementation of so-called Bianchi identities for field strength tensors,and an additional application of a trace relation we have ended up with 24 SU(N f ), 23 SU(3),and 5 SU(2) slightly modified elements. The same number of terms was found in Ref. [6].Our final sets are thus considerably smaller than those proposed by [7, 8], which are both in-complete and redundant. Furthermore, we have constructed 8 additional structures which arisedue to the extension of the chiral group to SU(N f )L × SU(N f )R ×U(1)V . Besides the generalinterest, the latter group needs to be considered when consistently treating electromagneticreactions in the SU(2) framework.
[1] S. Weinberg, Physica A 96 (1979) 327.
[2] J. Gasser and H. Leutwyler, Ann. Phys. (N.Y.) 158 (1984) 142; Nucl. Phys. B250 (1985)465.
[3] H. W. Fearing and S. Scherer, Phys. Rev. D 53 (1996) 315.
[4] J. Bijnens, G. Colangelo, and G. Ecker, J. High Energy Phys. 9902 (1999) 020.
[5] T. Ebertshauser, H. W. Fearing, and S. Scherer, Phys. Rev. D 65 (2002) 054033.
[6] J. Bijnens, L. Girlanda, and P. Talavera, Eur. Phys. J. C 23 (2002) 539.
[7] D. Issler, SLAC-PUB-4943-REV (1990) (unpublished).
[8] R. Akhoury and A. Alfakih, Ann. Phys. (N.Y.) 210 (1991) 81.