submolecular resolution by variation of the inelastic...
TRANSCRIPT

Submolecular Resolution by Variation of the Inelastic Electron Tunneling SpectroscopyAmplitude and its Relation to the AFM/STM Signal
Bruno de la Torre,1,2,* Martin Švec,1,2 Giuseppe Foti,1 Ondrej Krejčí,1,3 Prokop Hapala,1 Aran Garcia-Lekue,4,5
Thomas Frederiksen,4,5 Radek Zboril,2 Andres Arnau,4 Héctor Vázquez,1 and Pavel Jelínek1,2,4,†1Institute of Physics, Academy of Sciences of the Czech Republic, v.v.i., Cukrovarnická 10, 162 00 Prague, Czech Republic
2Regional Centre of Advanced Technologies and Materials, Palacký University, Šlechtitelu 27, 78371 Olomouc, Czech Republic3Faculty of Mathematics and Physics, Department of Surface and Plasma Science, Charles University,
V Holešovičkách 2, 180 00 Prague, Czech Republic4Donostia International Physics Center (DIPC), Paseo Manuel Lardizabal 4, E-20018 San Sebastian, Spain
5Ikerbasque, Basque Foundation for Science, 48013 Bilbao, Spain(Received 29 June 2017; revised manuscript received 11 August 2017; published 16 October 2017)
Here we show scanning tunneling microscopy (STM), noncontact atomic force microscopy (AFM),and inelastic electron tunneling spectroscopy (IETS) measurements on an organic molecule with aCO-terminated tip at 5 K. The high-resolution contrast observed simultaneously in all channelsunambiguously demonstrates the common imaging mechanism in STM/AFM/IETS, related to the lateralbending of the CO-functionalized tip. The IETS spectroscopy reveals that the submolecular contrast at 5 Kconsists of both renormalization of vibrational frequency and variation of the amplitude of the IETS signal.This finding is also corroborated by first principles simulations. We extend accordingly the probe-particleAFM/STM/IETS model to include these two main ingredients necessary to reproduce the high-resolutionIETS contrast. We also employ the first principles simulations to get more insight into a different responseof frustrated translation and rotational modes of the CO tip during imaging.
DOI: 10.1103/PhysRevLett.119.166001
The development of high-resolution scanning tunnelingmicroscopy (STM) [1], atomic force microscopy (AFM)[2], and inelastic electron tunneling spectroscopy (IETS)[3] imaging with functionalized tips has allowed us to reachunprecedented spatial resolution of organic molecules onsurfaces. Using these techniques, the chemical structureof molecules can be now routinely determined directlyfrom experimental images [4,5], as well as the informationabout bond order [6], intermediates, and products of on-surface chemical reactions [7] or charge distribution withinmolecules [8].The origin of the high-resolution AFM/STM imaging is
now well understood within the framework of the so-calledprobe-particle (PP) model [9–11]. In general, an atom ormolecule (the probe particle) placed at the tip apex is sensitiveto spatial variations of the potential energy landscape of themolecule resulting from the interplay between Pauli, electro-static, and van der Waals interactions [9,10,12,13]. At closetip-sample distances, the probe particle relaxes according tothe potential energy surface, which gives rise to a sharpsubmolecular contrast. Nevertheless, neither direct experi-mental evidence nor a unified description of the imagingmechanism for all three scanning modes has been presented.On one hand, noncontact AFM is most often used in the
high-resolution imaging mode, which provides the highestspatial resolution with relatively straightforward interpreta-tion, compared to the other two modes. This implies that theinstrument operates in the frequency modulation (FM) mode
[14], which is not a trivial task from both the instrumentaland data acquisition point of view. From this perspective, theSTMmode seems to be a more feasible choice. On the otherhand, the interpretation of high-resolution STM images isnot at all straightforward because of the convolution of thegeometric and electronic effects [11]. The IETS mode [15]thus represents a promising alternative [3], but the high-resolution contrast was so far only demonstrated at sub-Kelvin temperatures. This temperature requirement posessevere limitations for its wider application.In this Letter, we present simultaneous AFM/STM/IETS
measurements of iron(II) phtalocyanine (FePc) on Au(111)acquired with a CO-terminated tip at 5 K [16]. Thesemeasurements (i) demonstrate that high-resolution IETSimaging is also feasible with standard LHe bath cryostats,and (ii) experimentally confirm the common imagingmechanism for all three imaging modes. Atomistic simu-lations using nonequilibrium Green’s functions (NEGF)[27] and an extension of the PP model [3,10,16] provide acharacterization of the contrast in the inelastic signal and aunified description of AFM/STM/IETS.Figure 1(a) shows a constant-current STM image of
coadsorbed FePc and CO molecules on Au(111). Prior tothe high-resolution imaging, a CO molecule was picked upto the tip. The presence of the CO on the tip is confirmedby the characteristic low-energy IETS spectrum over thebare substrate, consisting of the frustrated translational (FT)and frustrated rotational (FR) modes located at ≈3 and
PRL 119, 166001 (2017) P HY S I CA L R EV I EW LE T T ER Sweek ending
20 OCTOBER 2017
0031-9007=17=119(16)=166001(6) 166001-1 © 2017 American Physical Society
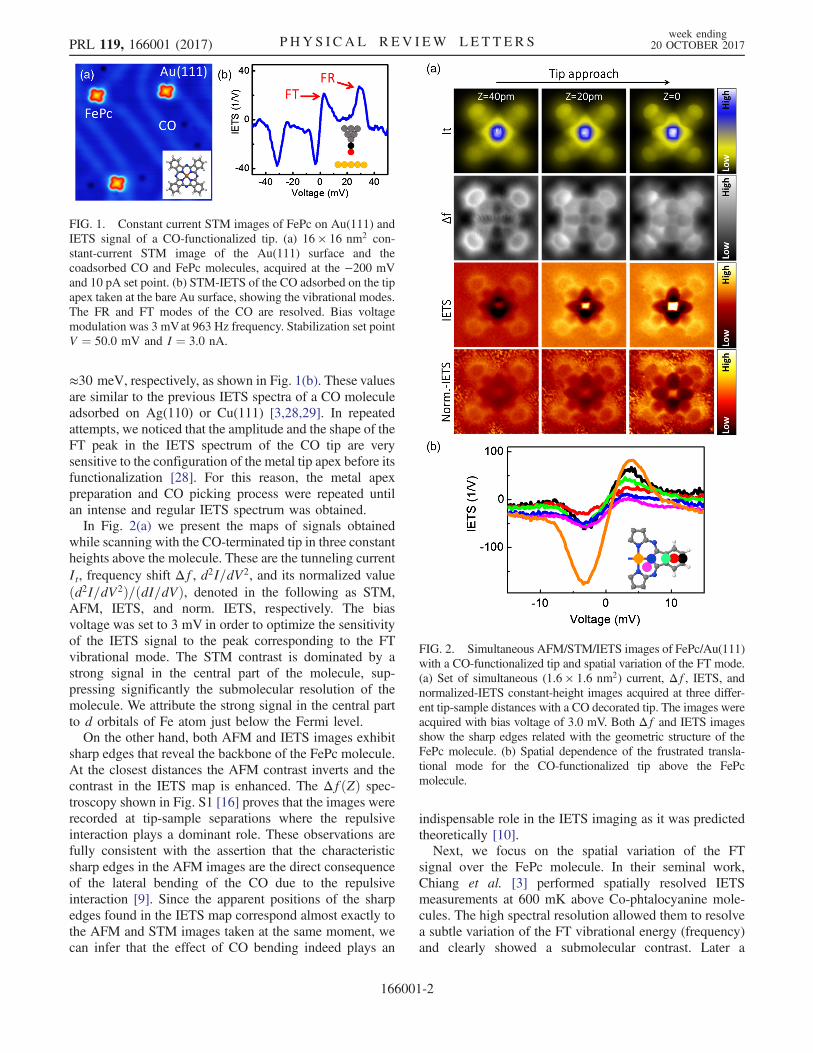
≈30 meV, respectively, as shown in Fig. 1(b). These valuesare similar to the previous IETS spectra of a CO moleculeadsorbed on Ag(110) or Cu(111) [3,28,29]. In repeatedattempts, we noticed that the amplitude and the shape of theFT peak in the IETS spectrum of the CO tip are verysensitive to the configuration of the metal tip apex before itsfunctionalization [28]. For this reason, the metal apexpreparation and CO picking process were repeated untilan intense and regular IETS spectrum was obtained.In Fig. 2(a) we present the maps of signals obtained
while scanning with the CO-terminated tip in three constantheights above the molecule. These are the tunneling currentIt, frequency shift Δf, d2I=dV2, and its normalized valueðd2I=dV2Þ=ðdI=dVÞ, denoted in the following as STM,AFM, IETS, and norm. IETS, respectively. The biasvoltage was set to 3 mV in order to optimize the sensitivityof the IETS signal to the peak corresponding to the FTvibrational mode. The STM contrast is dominated by astrong signal in the central part of the molecule, sup-pressing significantly the submolecular resolution of themolecule. We attribute the strong signal in the central partto d orbitals of Fe atom just below the Fermi level.On the other hand, both AFM and IETS images exhibit
sharp edges that reveal the backbone of the FePc molecule.At the closest distances the AFM contrast inverts and thecontrast in the IETS map is enhanced. The ΔfðZÞ spec-troscopy shown in Fig. S1 [16] proves that the images wererecorded at tip-sample separations where the repulsiveinteraction plays a dominant role. These observations arefully consistent with the assertion that the characteristicsharp edges in the AFM images are the direct consequenceof the lateral bending of the CO due to the repulsiveinteraction [9]. Since the apparent positions of the sharpedges found in the IETS map correspond almost exactly tothe AFM and STM images taken at the same moment, wecan infer that the effect of CO bending indeed plays an
indispensable role in the IETS imaging as it was predictedtheoretically [10].Next, we focus on the spatial variation of the FT
signal over the FePc molecule. In their seminal work,Chiang et al. [3] performed spatially resolved IETSmeasurements at 600 mK above Co-phtalocyanine mole-cules. The high spectral resolution allowed them to resolvea subtle variation of the FT vibrational energy (frequency)and clearly showed a submolecular contrast. Later a
FIG. 1. Constant current STM images of FePc on Au(111) andIETS signal of a CO-functionalized tip. (a) 16 × 16 nm2 con-stant-current STM image of the Au(111) surface and thecoadsorbed CO and FePc molecules, acquired at the −200 mVand 10 pA set point. (b) STM-IETS of the CO adsorbed on the tipapex taken at the bare Au surface, showing the vibrational modes.The FR and FT modes of the CO are resolved. Bias voltagemodulation was 3 mVat 963 Hz frequency. Stabilization set pointV ¼ 50.0 mV and I ¼ 3.0 nA.
FIG. 2. Simultaneous AFM/STM/IETS images of FePc/Au(111)with a CO-functionalized tip and spatial variation of the FT mode.(a) Set of simultaneous (1.6 × 1.6 nm2) current, Δf, IETS, andnormalized-IETS constant-height images acquired at three differ-ent tip-sample distances with a CO decorated tip. The images wereacquired with bias voltage of 3.0 mV. Both Δf and IETS imagesshow the sharp edges related with the geometric structure of theFePc molecule. (b) Spatial dependence of the frustrated transla-tional mode for the CO-functionalized tip above the FePcmolecule.
PRL 119, 166001 (2017) P HY S I CA L R EV I EW LE T T ER Sweek ending
20 OCTOBER 2017
166001-2
theoretical explanation of the imaging mechanism wassuggested, based on the frequency change of the mode [10].However, the IETS spectra acquired for the FT mode atvarious locations of the FePc molecule at 5 K, shown in theFig. 2(b), reveal that the skeleton of FePc can be clearlyresolved purely from variation of the amplitude of the IETSsignal, even though variation of frequency cannot bedirectly observed due to broadening of the peak.Remarkably, the highest amplitude is detected above the
center of the FePc molecule, similarly to the STM dI=dVimages. The IETS signal is expected to scale with themagnitude of the differential conductance dI=dV measuredat the energy of the FT mode. Indeed, in the normalizedIETS images ðd2I=dV2Þ=ðdI=dVÞ the signal in the center issuppressed and the molecular structure is still clearlyresolved although the normalization impairs the signal-to-noise ratio in the outer regions of the molecule.For a further understanding of the origin of the contrast
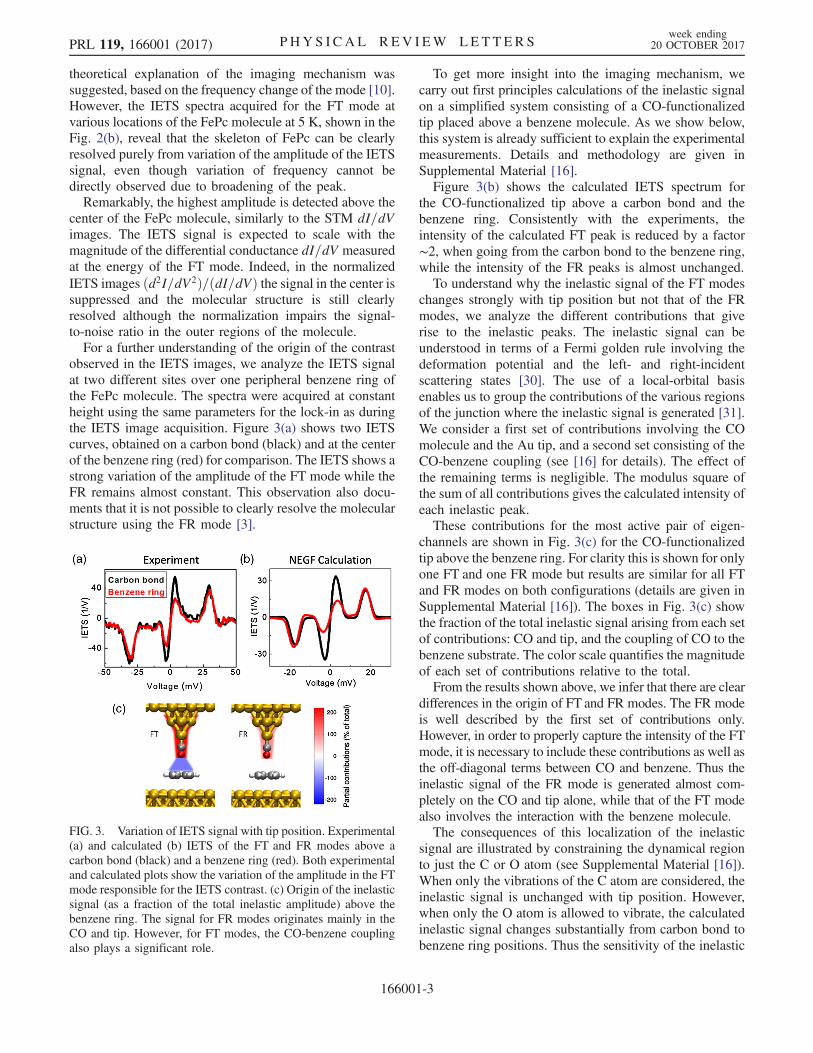
observed in the IETS images, we analyze the IETS signalat two different sites over one peripheral benzene ring ofthe FePc molecule. The spectra were acquired at constantheight using the same parameters for the lock-in as duringthe IETS image acquisition. Figure 3(a) shows two IETScurves, obtained on a carbon bond (black) and at the centerof the benzene ring (red) for comparison. The IETS shows astrong variation of the amplitude of the FT mode while theFR remains almost constant. This observation also docu-ments that it is not possible to clearly resolve the molecularstructure using the FR mode [3].
To get more insight into the imaging mechanism, wecarry out first principles calculations of the inelastic signalon a simplified system consisting of a CO-functionalizedtip placed above a benzene molecule. As we show below,this system is already sufficient to explain the experimentalmeasurements. Details and methodology are given inSupplemental Material [16].Figure 3(b) shows the calculated IETS spectrum for
the CO-functionalized tip above a carbon bond and thebenzene ring. Consistently with the experiments, theintensity of the calculated FT peak is reduced by a factor∼2, when going from the carbon bond to the benzene ring,while the intensity of the FR peaks is almost unchanged.To understand why the inelastic signal of the FT modes
changes strongly with tip position but not that of the FRmodes, we analyze the different contributions that giverise to the inelastic peaks. The inelastic signal can beunderstood in terms of a Fermi golden rule involving thedeformation potential and the left- and right-incidentscattering states [30]. The use of a local-orbital basisenables us to group the contributions of the various regionsof the junction where the inelastic signal is generated [31].We consider a first set of contributions involving the COmolecule and the Au tip, and a second set consisting of theCO-benzene coupling (see [16] for details). The effect ofthe remaining terms is negligible. The modulus square ofthe sum of all contributions gives the calculated intensity ofeach inelastic peak.These contributions for the most active pair of eigen-
channels are shown in Fig. 3(c) for the CO-functionalizedtip above the benzene ring. For clarity this is shown for onlyone FT and one FR mode but results are similar for all FTand FR modes on both configurations (details are given inSupplemental Material [16]). The boxes in Fig. 3(c) showthe fraction of the total inelastic signal arising from each setof contributions: CO and tip, and the coupling of CO to thebenzene substrate. The color scale quantifies the magnitudeof each set of contributions relative to the total.From the results shown above, we infer that there are clear
differences in the origin of FT and FR modes. The FR modeis well described by the first set of contributions only.However, in order to properly capture the intensity of the FTmode, it is necessary to include these contributions as well asthe off-diagonal terms between CO and benzene. Thus theinelastic signal of the FR mode is generated almost com-pletely on the CO and tip alone, while that of the FT modealso involves the interaction with the benzene molecule.The consequences of this localization of the inelastic
signal are illustrated by constraining the dynamical regionto just the C or O atom (see Supplemental Material [16]).When only the vibrations of the C atom are considered, theinelastic signal is unchanged with tip position. However,when only the O atom is allowed to vibrate, the calculatedinelastic signal changes substantially from carbon bond tobenzene ring positions. Thus the sensitivity of the inelastic
FIG. 3. Variation of IETS signal with tip position. Experimental(a) and calculated (b) IETS of the FT and FR modes above acarbon bond (black) and a benzene ring (red). Both experimentaland calculated plots show the variation of the amplitude in the FTmode responsible for the IETS contrast. (c) Origin of the inelasticsignal (as a fraction of the total inelastic amplitude) above thebenzene ring. The signal for FR modes originates mainly in theCO and tip. However, for FT modes, the CO-benzene couplingalso plays a significant role.
PRL 119, 166001 (2017) P HY S I CA L R EV I EW LE T T ER Sweek ending
20 OCTOBER 2017
166001-3

peaks to the interaction with the molecular substrate restson the composition of the vibrational modes of CO. In FRmodes the larger displacement corresponds to the C atom,close to the tip. In FT modes, on the other hand, thedisplacement is larger on the O atom, which, being closer tothe benzene molecule, is more affected by the interactionwith the molecular substrate. The higher sensitivity of FTmodes to the position of CO above the molecule followsintuitively from this result.To describe the variations of the IETS amplitude of the
FT mode, we extend the fast PP-IETS method to calculateIETS maps [10]. We carry out an approximation of theperturbative inelastic transport theory [30] and considerthat the IETS signal is proportional to two terms only:(i) Variation of the tunneling hopping Tmn between theelectronic states of the tip (m) and of the sample (n) withrespect to displacement of PP along vibration eigenmodevλ, and (ii) a prefactor depending on the energy of thevibrational mode ωλ. Intuitively the prefactor represents themagnitude of the CO displacement during vibration, whichis prolonged as the vibration mode becomes softer due toconcave potential over the bonds [10]. The full derivationof the approach can be found in Supplemental Material[16]. This approximation is justified by the NEGF analysis,which revealed dominant contribution of oxygen to theIETS signal of the FT mode [16]. Consequently, the IETSsignal γFT of the FT modes is defined as follows:
γFT ∼X
λ;m;n
C1
ωλMPP
����∂Tmn
∂vλ����2
; ð1Þ
where C is a constant and MPP the effective PP mass [16].The vibrational mode λ goes over two FT modes. This PP-IETS method was implemented into the PP-code allowingsimulation of the HR-STM and AFM images [9–11]. Thecomputational cost of IETS images using this method issimilar to standard STM simulation. The calculation of thehigh-resolution AFM/STM/IETS images relies on atomicand electronic structure of the adsorbed molecules on thesurface. Therefore, we performed total energy DFT sim-ulations of FePc molecule on an Au(111) surface with theFHI-AIMS code [32] using the Perdew-Burke-Ernzerhoffunctional [33] and Tkatchenko-Scheffler vdW model [34]for geometry optimization. The electronic states used asinput for PP-STM and PP-IETS codes were then calculatedwith the hybrid B3LYP functional [35] to provide betterdescription of the metal-organic system.Electronic states of the CO-functionalized tip were
approximated by px, py, and s orbitals on the probe particleto represent π and σ conductance channels [11]. More detailsabout parameters of the total energy DFT and PP-SPMsimulations can be found in Supplemental Material [16].Figure 4 shows the calculated high-resolution AFM,
STM, and IETS images of the FePc molecule on theAu(111) surface for different tip-sample distances. The
simulated images capture well most of the characteristicfeatures observed experimentally in all channels. In theSTM mode, we are able to reproduce the dominant contrastobserved in the center of the molecule, while a sharpcontrast on external benzene rings is visible only in theclose distance. On the other hand, the calculated STMimages contain subtle submolecular features, which are notseen in the experiment. The AFM simulation reproducesvery well both the characteristic sharpening of contrast andthe contrast inversion at close distances. The only discrep-ancy consists of a missing rectangular feature in the centerof the FePc molecule. We attribute these discrepancies to apeculiar charge distribution or structural relaxation betweenFe and ligand, which is not described well within DFTapproximation, or possibly to some chemical force betweena CO tip and Fe atom that cannot be captured using aLennard-Jones force field. The IETS channel resolves themolecular skeleton, with the characteristic bright spot inthe center of the molecule in good agreement with theexperimental evidence.From PP-IETS simulations we can also analyze the
influence of two contributions on the amplitude ofthe IETS signal (see Fig. S13 in [16]). We found that theprefactor 1=ωλ [Eq. (1)] is important only at close tip-sampledistances due to fast decay of Pauli repulsion, which leads toconcave curvature of interaction potential over the bonds.However, the molecular structure is resolved, both in thetheory and experiment, over a range of ≈0.8 Å (see Fig. S1in [16]). The IETS contrast at far distance is mainly causedby spatial variation of inelastic tunneling matrix element, asshown both by NEGF and PP-IETS simulations.
FIG. 4. Theoretical simulations of STM/AFM/IETS of FePc onthe Au(111) surface at three different tip-sample distances. Thetunneling current (top), Δf (middle), and IETS (bottom) imageswere calculated using the PP-SPM model.
PRL 119, 166001 (2017) P HY S I CA L R EV I EW LE T T ER Sweek ending
20 OCTOBER 2017
166001-4

In conclusion, we demonstrated that the high-resolutionIETS imaging with a CO-functionalized tip is feasible at 5 Kwith a spatial resolution superior to STM and comparable toAFM. Thus we believe that the IETS mode is promising forSTM-only setups. The high-resolution contrast observed inall channels simultaneously demonstrates unambiguouslythe common imaging mechanism of the AFM/STM/IETS,related to lateral bending of the CO-functionalized tip. Weprovided detailed theoretical analysis of FT and FR vibra-tional modes showing their different localization in the STMjunction. This explains why FT displays a large variationduring scanning while FR is insensitive. This result opensthe way to tune the surface sensitivity of the inelastic signalthrough appropriate molecular functionalization of the tip.We also showed that the submolecular contrast emerges notonly from the changes of the CO vibrational frequency of theFTmode, but also due to the variation of the amplitude of theIETS signal. Finally, we extended accordingly the probe-particle AFM/STM/IETS model to include these two mainingredients necessary to reproduce the high-resolution IETScontrast.
We thank A. Peronio for fruitful discussions of the IETSsignal. This research was financially supported by: theCzech Science Foundation (GACR) under Grants No. 15-19672S, No. 17-24210Y, the Purkyne Fellowship andPraemium Academiae program of the Academy ofSciences of the Czech Republic, and the EuropeanUnion’s Horizon 2020 research and innovation programunder the Marie Sklodowska-Curie Grant No. 709114. Theauthors also acknowledge support from Ministry ofEducation, Youth and Sport of the Czech Republic(NanoEnviCz, Grant No. LM2015073, and GrantNo. LO1305), Grant No. FP7 FET-ICT “Planar Atomicand Molecular Scale devices” (PAMS) project (funded bythe European Commission under Contract No. 610446),Spanish Ministerio de Economia y Competitividad(MINECO) (Grant No. MAT2016-78293-C6-4-R), andthe Basque Government (Dep. de Educacion and UPV/EHU, Grants No. IT-756-13 and No. PI-2016-1-0027). Wethank CESNET Grant No. LM2015042 and CERITScientific Cloud Grant No. LM2015085, under the program“Projects of Large Research, Development, and InnovationsInfrastructures” for computational resources.
*[email protected]†[email protected]
[1] R. Temirov, S. Soubatch, O. Neucheva, A. Lassise, and F.Tautz, New J. Phys. 10, 053012 (2008).
[2] L. Gross, F. Mohn, N. Moll, P. Liljeroth, and G. Meyer,Science 325, 1110 (2009).
[3] C. Chiang, C. Xu, Z. Han, and W. Ho, Science 344, 885(2014).
[4] L. Gross, N. Moll, G. Meyer, R. Ebel, W. Abdel-Mageed,and M. Jaspars, Nat. Chem. 2, 821 (2010).
[5] B. Schuler, G. Meyer, D. Pena, O. Mullins, and L. Gross,J. Am. Chem. Soc. 137, 9870 (2015).
[6] L. Gross, F. Mohn, N. Moll, B. Schuler, A. Criado, E.Guitian, D. Pena, A. Gourdon, and G. Meyer, Science 337,1326 (2012).
[7] D. de Oteyza, P. Gorman, Y.-C. Chen, S. Wickenburg, A.Riss, D. Mowbray, G. Etkin, Z. Pedramrazi, H.-Z. Tsai, A.Rubio, M. Crommie, and F. Fischer, Science 340, 1434(2013).
[8] P. Hapala, M. Švec, O. Stetsovych, N. van der Heijden,M. Ondracek, J. van der Lit, P. Mutombo, I. Swart, and P.Jelínek, Nat. Commun. 7, 11560 (2016).
[9] P. Hapala, G. Kichin, C. Wagner, F. S. Tautz, R. Temirov,and P. Jelínek, Phys. Rev. B 90, 085421 (2014).
[10] P. Hapala, R. Temirov, F. S. Tautz, and P. Jelínek, Phys. Rev.Lett. 113, 226101 (2014).
[11] O. Krejči, P. Hapala, M. Ondráček, and P. Jelínek, Phys.Rev. B 95, 045407 (2017).
[12] N. Moll, L. Gross, F. Mohn, A. Curioni, and G. Meyer, NewJ. Phys. 14, 083023 (2012).
[13] S. K. Hämäläinen, N. van der Heijden, J. van der Lit, S.den Hartog, P. Liljeroth, and I. Swart, Phys. Rev. Lett. 113,186102 (2014).
[14] T. R. Albrecht, P. Grütter, D. Horne, and D. Rugar, J. Appl.Phys. 69, 668 (1991).
[15] B. Stipe, M. Rezaei, and W. Ho, Science 280, 1732(1998).
[16] See Supplemental Material at http://link.aps.org/supplemental/10.1103/PhysRevLett.119.166001 for moredetails, which includes Refs. [17–26].
[17] L. Bartels, G. Meyer, and K. Rieder, Appl. Phys. Lett. 71,213 (1997).
[18] I. Horcas, R. Fernández, J. Gómez-Rodríguez, J. Colchero,J. Gómez-Herrero, and A. Baro, Rev. Sci. Instrum. 78,013705 (2007).
[19] W. L. Jorgensen and J. Tirado-Rives, J. Am. Chem. Soc.110, 1657 (1988).
[20] M. Brandbyge, J.-L. Mozos, P. Ordejón, J. Taylor, and K.Stokbro, Phys. Rev. B 65, 165401 (2002).
[21] M. Dion, H. Rydberg, E. Schröder, D. C. Langreth, and B. I.Lundqvist, Phys. Rev. Lett. 92, 246401 (2004).
[22] G. Foti, D. Sánchez-Portal, A. Arnau, and T. Frederiksen,Phys. Rev. B 91, 035434 (2015).
[23] G. Román-Pérez and J. M. Soler, Phys. Rev. Lett. 103,096102 (2009).
[24] J. M. Soler, E. Artacho, J. D. Gale, A. García, J. Junquera, P.Ordejón, and D. Sánchez-Portal, J. Phys. Condens. Matter14, 2745 (2002).
[25] J.-T. Lü, R. B. Christensen, G. Foti, T. Frederiksen,T. Gunst, and M. Brandbyge, Phys. Rev. B 89, 081405(2014).
[26] J. Taylor, H. Guo, and J. Wang, Phys. Rev. B 63, 245407(2001).
[27] T. Frederiksen, M. Paulsson, M. Brandbyge, and A.-P.Jauho, Phys. Rev. B 75, 205413 (2007).
[28] C. Xu, C. L. Chiang, Z. Han, and W. Ho, Phys. Rev. Lett.116, 166101 (2016).
[29] N. Okabayashi, A. Gustafsson, A. Peronio, M. Paulsson,T. Arai, and F. J. Giessibl, Phys. Rev. B 93, 165415(2016).
PRL 119, 166001 (2017) P HY S I CA L R EV I EW LE T T ER Sweek ending
20 OCTOBER 2017
166001-5

[30] M. Paulsson, T. Frederiksen, H. Ueba, N. Lorente, and M.Brandbyge, Phys. Rev. Lett. 100, 226604 (2008).
[31] G. Foti and H. Vázquez, Phys. Rev. B 94, 045418 (2016).[32] V. Blum, R. Gehrke, F. Hanke, P. Havu, V. Havu, X. Ren,
K. Reuter, and M. Scheffler, Comput. Phys. Commun. 180,2175 (2009).
[33] J. P. Perdew, K. Burke, and M. Ernzerhof, Phys. Rev. Lett.77, 3865 (1996).
[34] A. Tkatchenko and M. Scheffler, Phys. Rev. Lett. 102,073005 (2009).
[35] S. H. Vosko, L. Wilk, and M. Nusair, Can. J. Phys. 58, 1200(1980).
PRL 119, 166001 (2017) P HY S I CA L R EV I EW LE T T ER Sweek ending
20 OCTOBER 2017
166001-6