submitted to reviews in engineering geology t.n
TRANSCRIPT

LBL-10967 GSRMP-14e-.
Preprint
Submitted to Reviews in Engineering Geology
Earth Sciences Division Lawrence Berkeley Laboratory University of California
T.N. Narasimhan and K.P. Goyal
October 1982
TWO-WEEK LOAN COPY
This is a Library Circulating Copy
which may be borrowed for two weeks.
For a personal copyy call
Tech. Info. Division, Ext. 6782.
Prepared for the U.S. Deportment of Energy under Con'rroct DE-AC03-76SF00098
DISCLAIMER
This document was prepared as an account of work sponsored by the United States Government. While this document is believed to contain correct information, neither the United States Government nor any agency thereof, nor the Regents of the University of California, nor any of their employees, makes any warranty, express or implied, or assumes any legal responsibility for the accuracy, completeness, or usefulness of any information, apparatus, product, or process disclosed, or represents that its use would not infringe privately owned rights. Reference herein to any specific commercial product, process, or service by its trade name, trademark, manufacturer, or otherwise, does not necessarily constitute or imply its endorsement, recommendation, or favoring by the United States Govemment or any agency thereof, or the Regents of the University of Califomia. The views and opinions of authors expressed herein do not necessarily state or reflect those of the United States Govemment or any agency thereof or the Regents of the University of California.

SUBSIDENCE DUE TO GEOTHERMAL FLUID WITHDRAWAL
T. N. Narasimhan and K. P. Goyal
Earth Sciences Division Lawrence Berkeley Laboratory
University of California Berkeley, California 94720
October 1982
LBL-10967
GSRMP-14
This work was supported by the Assistant Secretary for Conservation and Renewable Energy, Office of Renewable Technology, Division of Hydrothermal and Hydropower Technologies of the U. S. Department of Energy under Contract Number DE-AC03-76SF00098.


SUBSIDENCE DUE TO GEOTHERMAL FLUID WITHDRAWAL
T. N. Narasimhan, K. P. Goyal* Earth Science Division
University of California Lawrence Berkeley Laboratory Berkeley, California 94720
ABSTRACT
Single-phase and two-phase geothermal reservoirs are currently being
exploited for power production in Italy, Mexico, New Zealand, the U.S. and
elsewhere. Vertical ground displacements of upto 4.5 m and horizontal ground
displacements of up to 0.5 m have been observed at Wairakei, New Zealand that
are clearly attributable to the resource exploitation. Similarly, vertical
displacements of about 0.13 m have been recorded at The Geysers, California.
No significant ground displacements that are attributable to large-scale fluid
production have been observed at Larderello, Italy and Cerro Prieto, Mexico.
Observations show that subsidence due to geothermal fluid production is
characterized by such features as an offset of the subsidence bowl from the
main area of production, time-lag between production and subsidence and non-
linear stress-strain relationships. Several plausible conceptual models, of
varying degrees of sophistication, have been proposed to explain the observed
features. At present, relatively more is known about the physical mechanisms
that govern subsidence than the relevant thermal mechanisms. Although attempts
have been made to simulate observed geothermal subsidence, the modeling efforts
have been seriously limited by a lack of relevant field data needed to
sufficiently characterize the complex field system.
*Present address: Phillips Petroleum Company, 655 East 4500 South, Salt Lake City, Utah
iii


SUBSIDENCE DUE TO GEOTHERMAL FLUID WITHDRAWAL
CONTENTS
INTRODUCTION • • • •
FIELD OBSERVATIONS ••
Wairakei, New Zealand
Broadlands Geothermal Field, New Zealand •
Cerro Prieto, Mexico ••
The Geysers, California, U.S.A.
Larderello Geothermal Field, Italy •
Geopressured Systems • • • •
Chocolate Bayou, Texas
Summary of Field Observations
PHYSICAL BASIS •••••••
3
5
8
13
16
20
24
24
27
30
Deformation of the Reservoir 32
Mechanical Deformation • • • • • • • • • . 32
The Single-Equation Approach • • • . • • • 38
The Coupled-Equation Approach • • • • • • • • • 40
Thermal Deformation ••
Overburden Deformation
Role of Fractures
Range of Values of Parameters
Wairakei, New Zealand 0 e o o e o e o 0 o e o o
East Mesa, California and Cerro Prieto, Mexico
Pleasant Bayou, Texas ••••••••
41
42
44
44
45
46
48
iii

iv
DATA SYNTHESIS AND PREDICTION . . Reservoir Deformation Models . . . Overburden Deformation Models . . . . . Coupled Reservoir-Overburden Models . Comparison of Geothermal Subsidence Models •
Some Simulation Results
CONCLUDING REMARKS •
ACKNOWLEDGEMENTS •
REFERENCES •
TABLES
FIGURE CAPT IONS
FIGURES ••••
.
.
. .
. .
. . . . 50
50
53
. . . . 54
. . . . . 54
o e e €1 o e 55
57
58
58
72
74
76

l
INTRODUCTION
In many parts of the world geothermal energy is being actively exploited
for power generation. Compared to oil and coal, the energy content of a unit
mass of geothermal water is relatively small. Hence, power production from
geothermal reservoirs, especially those dominated by liquid water, entails the
extraction of large volumes of the fluids, leading invariably to the mining of
these fluids. This depletion of stored fluid volume is compensated largely by
a reduction in the bulk volume of the reservoir with associated reservoir
deformation. Abundant field evidence exists to show that the effects of
reservoir deformation often propagate to the land surface to be manifested as
vertical and horizontal ground displacements. Although the term 11 Subsidence"
is suggestive of vertical downward movement of the ground surface, we shall,
in this paper, use the term in a more general context to include both
horizontal and vertical displacements.
Additionally, the deformations accompanying reservoir depletion may also
lead to the activation of movements along preexisting faults, leading to
seismic events. The ground displacements which may often attain magnitudes of
several meters, can lead to significant environmental consequences in some
areas. For example, vertical movements of only a few feet in some coastal
areas such as in Texas can lead to flooding and loss of valuable urban or
agricultural lands. Abrupt spatial changes in the magnitude of subsidence, on
the other hand, can lead to the rupturing of irrigation canals or pipelines.

2
There exists, therefore, a practical desire to exploit the geothermal resource
in such a fashion that the deleterious effects of land subsidence are minimal
and acceptable. To achieve this end, a proper understanding of the subsidence
mechanism is essential so that the consequences of specific exploitation
strategies can be foreseen and appropriate ameliorative measures taken.
The purpose of this paper is to assess our current status of knowledge
related to subsidence caused by the removal of geothermal fluids. In
particular, we shall address the following questions: What are the patterns
and magnitudes of subsidence that have been observed in different parts of the
world? What are the physical bases that relate fluid withdrawal and ground
displacements? What is our current ability to predict land subsidence with
the help of mathematical models? And finally, what are the key questions that
need to be answered in order to increase our ability to predict subsidence?
We shall begin the paper with a description of case histories relating to
geothermal systems from around the world. Following this, we shall describe
the physical mechanisms that govern subsidence and examine how these physical
mechanisms may be quantitatively analyzed using mathematical models. We shall
close the paper with a discussion of the current status of knowledge and the
identification of key issues requiring resolution.

3
FIELD OBSERVATIONS
In general, geothermal systems can be classified into five categories:
normal gradient~, radiogenic-, high heat flow-, geopressured-and hydrothermal
systems (DiPippo, 1980). Normal gradient systems are systems in which the
temperature gradient in the earth 1 s crust averages about 30°C/km. Exploitation
of such a system would require one to drill deep in the earth 1 s crust,
rendering this resource to be uneconomical at present.
Geothermal energy produced by the radioactive decay of uranium, thorium,
and potassium in the earth 1 s crust forms a radiogenic system. Radioactive
decay of 1 kg granite can release about one-billionth of a watt of heat. Thus,
a fairly large amount of heat energy can be obtained by tapping radiogenic
resource of the earth 1 s crust as a whole. However, this energy is quite
diffused and a suitable medium may not be readily available to permit its
large scale extraction.
Subsurface temperatures are principally controlled by conductive flow of
heat through solid rocks, by convecting flow in circulating fluids, or by mass
transfer in magmas. The conduction dominated, high heat flow areas may be
associated with regions in which the crust is abnormally thin, thus allowing
the mantle to come into closer proximity to the surface, or in which a large,
deep seated magma chamber is enclosed within the earth 1 s crust. Such areas
are often found to have large thermal gradients, sometimes as large as 2 to 4
times the normal gradient as found in the Hungarian Basin (Boldizsar, 1970)
where temperature gradients of 40 to 75°C/km are known. These regions are
expected to yield high temperatures at shallow depths. However, such areas
may not prove feasible for power production because of the diffused nature of
energy contained in them.
The fourth type of geothermal system, the geopressured system, is found in
regions where fluid pressures exist in excess of hydrostatic pressure gradient

4
of 9.8 KPa/m (0.433 psi/ft). It is believed that any or all of the following
processes are responsible for the existence of a geopressured system: Rapid
burial of saturated sediments, with rates of loading exceeding rates of water
expulsion; development of osmotic pressure across clay beds; and liberation of
water through diagenetic alteration of montmorillonite to illite between
temperatures of 80°C to 120°C (Jones, 1969, 1975). Such fields are found
along the northern coast of Gulf of Mexico, and in many other parts of the
world. These fields do not have high temperature gradients but considerable
temperatures are encountered due to great depths (~6 km) involved. Such
systems are of economic importance as they are capable of delivering mechanical
energy, thermal energy and large supplies of methane gas. The Gulf coast of
Texas and Louisiana is currently being explored with deep wells to harness
this resource.
The last geothermal resource, the hydrothermal type, has been extensively
exploited and used for power production, space heating and other applications
throughout the world because of its proximity to the earth's surface and its
amenability to energy extraction. The driving heat energy for such systems is
supplied at the base of the convection loop. Hydrothermal systems may be
subclassified into two types: vapor dominated and liquid dominated systems,
which differ in the physical state of the dominant pressure controlling phase.
In vapor dominated systems, pressure is controlled by the steam phase while in
the liquid dominated systems, it is controlled by liquid water. Among the
geothermal systems discovered to date, hot water systems are perhaps twenty
times as common as vapor dominated systems (Muffler and White, 1972). Among
the liquid dominated systems, Wairakei in New Zealand and Cerro Prieto in
Mexico are currently producing 140 MW and 180 MW of electric power

respectively. Electric power is also being produced from the vapor dominated
systems such as The Geysers in California U.S.A. (900 MW) and Larderello in
Italy (380 MW).
Of the five categories of geothermal systems, only the geopressured and
the hydrothermal systems are presently viable for economic power production.
Therefore, we shall limit our discussion of subsidence to hydrothermal and
geopressured systems.
In the following section field observations are presented from several
geothermal sites. Attempt is made to emphasize the important features
relevant to subsidence. A total of six case histories are discussed. These
include: the liquid-dominated systems at Wairakei and Broadlands in New
Zealand and at Cerro Prieto in Mexico; the vapor-dominated systems at The
Geysers in California and at Larderello in Italy; and the Geopressured system
at Chocolate Bayou in Texas.
Wairakei, New Zealand
Wairakei is located on the North Island of New Zealand. It is situated on
the west bank of the Waikato River and lies 8 km north of Lake Taupo
(Figure 1). This liquid-dominated field occupies an area of 15 km2
5
(Grindley, 1965), and extends about 5 km westward from the river over a
relatively flat valley underlain by Taupo pumice alluvium. On the west, it is
bordered by hills of Wairakei Breccia that rise 90-150 meters above the valleys
and serve as a groundwater recharge area. No boundaries have been indicated
towards north and south as evidenced by the behavior of the wells. The
structure of this field is controlled by numerous fractures associated with the
Wairakei, Kaiapo, and Upper Waiora faults (Grimsrud et a1., 1978). The
geology of the Wairakei field is described in Grindley (1965), Healy (1965),

6
and Grange (1937). The reservoir engineering data have been compiled by
Pritchett et al. (1978) and subsidence related studies are reported in Grimsrud
et al. (1978), Viets et al. (1979) and Miller et al. (1980a, 1980b). A mixture
of steam and water, in a ratio of about 1 to 4 by weight, is yielded by the
Waiora Formation which is considered to be the main geothermal reservoir.
Above the Waiora lies a relatively impermeable Huka mudstone. The Wairakei
ignimbrites, considered to be practically impermeable, underlie the Waiora.
The thickness of the Waiora Formation varies from about 366m (1200 feet) in
the west to more than 793 m (2600 ft.) in the east. The Huka Falls Formation,
a relatively fine grained lacustrine rock, is less than 100m (300ft) towards
southwest of the main production area and thickens to about 310m (1000 ft)
towards northwest and southeast.
Geothermal fluid production at Wairakei started in early 1950. The
production increased significantly in 1958 with the commencement of power
generation. A total of 141 wells were drilled in the field up to 1968 when
drilling activity completely ceased. Of these, 65 bores account for about
95 percent of the total fluid produced from the entire field. It is believed
that the reservoir was originally filled with hot water to the base of the
Huka Falls formation before production started. Based on the early exploration
measurements, initial temperatures and pressures at the sea level were about
250°C and 3965 kPag (575 psig). Data presented by Pritchett et al. (1978)
indicate that initial temperatures in the upper part of the reservoir may have
been 10°-40°C lower than in the deeper parts. Presumably, the hottest fluids
were found in areas close to faults and fissures. In the early years of
production (1958-1962), recharge to the reservoir was about 10 percent of the
fluid produced. This inadequate recharge led to large pressure drops in the
reservoir. For example, pressure drops of the order of 1725 kPag (250 psig)

7
were observed in the western production area and over 2070 kPag (300 psig) in
the eastern production area. However, recharge rose to about 90 percent of
the fluid produced in the following period, leveling off at a pressure drop
rate of less than 69 kPag (10 psig) per year. A total of about 1.05 trillion
kg (2.33 trillion pounds) of fluid had been produced from the Wairakei-Tauhara
region as of December 31, 1976. This large scale extraction of fluids has led
to significant ground deformations in and around the Wairakei field.
Initial surface subsidence measurements were made in 1956 on the basis of
bench marks established in 1950. Periodic measurements since then have shown
that the area affected by subsidence exceeds 3 km2• Subsidence at Wairakei
has been reported by Hatton (1970), Stilwell et al. (1975), and subsequently,
thoroughly reviewed by Pritchett et al. (1978). Observed vertical subsidence
and horizontal ground movements are shown in Figures 2 and 3. As seen in
Figure 2, the area of maximum subsidence occurs east of the main production
zone and the maximum subsidence was of the order of 4.5 meters between 1964
and 1975. The horizontal movements, accompanying vertical subsidence, are
represented by vectors in Figure 3. These vectors point toward the area of
maximum subsidence. Also the observed horizontal deformations increase with
increasing vertical settlement. A horizontal movement of about 0.5 meters can
be observed near the zone of maximum subsidence in Figure 3. A plot of
reservoir pressure drop versus subsidence at bench mark A-97 is shown in
Figure 4. This figure shows that subsidence at Wairakei is characterized by
a) an off-set subsidence bowl, b) a linear relation between reservoir pressure
and subsidence up to 1963 and c) a non-linear relation after 1963.
As discussed elsewhere in this paper, surface and subsurface deformations
may be expected to enhance the fault activity and the seismicity of the area.
In a recent study Evison et al. (1976) found that both micro earthquakes as

8
well as macro earthquakes were many times more frequent in the Taupo fault
belt than either in the adjoining basins or in the Kaingaroa Plateau to the
east. Nevertheless, to our knowledge, no such study exists which specifically
relates subsidence with seismicity in the Wairakei area. It is difficult to
assert at this time that increased seismicity in the Wairakei field is due to
increased subsidence.
At Wairakei spent geothermal fluids with approximately 4400 ppm of
dissolved solids are discharged directly into the Waikato river (Defferding
and Walter, 1978). Since 1968, no new wells have been drilled in the field
and about 140 MW of power is being steadily produced since then.
The surface deformations in the field have disrupted pipelines carrying
steam, cracked drainage canals and caused the main road to sink by 2-meters
(Viets et al., 1979). The recurring cost of repair of steam lines might range
from $2000 to $10,000 per year. Fixing of drainage canal cost about $250,000.
Broadlands Geothermal Field, New Zealand
The Broadlands geothermal field, located about 28 km northeast of Wairakei
is another liquid-dominated geothermal system in New Zealand (Figure 1). Its
behaviour, however, appears to be considerably different from that at Wairakei,
largely due to the presence of significant amounts of carbon dioxide gas. The
New Zealand Electricity Department is expecting to produce 150 MW of
electricity from this field by mid 1980's. The first 50-MW unit may be in
operation by late 1983. The exploration in this area began in early 1960's
and drilling activity started in 1965. As of 1977, a total of 32 wells had
been drilled, of which only 16 are considered to be good producers (DiPippo,
1980). These are wells BR2, 3, 8, 9, 11, 13, 17 to 23, 25, 27 and 28
(Figure 5). The depth of the wells in this field vary between 760 and

9
1400 meters with one well (BR15) reaching down to 2418 meters. Over the field
three thermal anomalies have been recognized (DiPippo, 1980). First is the
Broadlands thermal anomaly covering an area of roughly 365 m radius centered
around well BR7; second is the Ohaki thermal anomaly with an area of about
550-m radius is centered on well BR9 and third is an elongated area between
wells BR6 and BR13 which extends about 1220 meters in north south direction.
Of these, the Ohaki anomaly is associated with best production.
The geology of the Broadland•s area has been extensively studied and
reported in Grindley {1970), Browne (1970), Hochstein and Hunt (1970), and
Grindley and Browne (1975). The subsurface formations in the descending order
include: Recent Pumice alluvium, Huka Falls formation, Ohaki Rhyolite, the
Waiora Formation, Broadlands Rhyolite, Rantawiri Breccia, Rangitaiki
Ignimbrites, Waikora Formation, the Ohakuri group, and the Graywacke basement.
The thickness of these formations is spatially variable. The Waiora Formation
and Rantawiri Breccia are the two main aquifers which provide most of the fluid
produced. The formations below the lower aquifer are quite dense and almost
impermeable. The Huka Falls Formation and the Ohaki Rhyolite provide confine
ment to the Waiora aquifer while the Broadlands Rhyolite apparently acts as a
boundary separating the two aquifers. The local disruption of alternating
permeable and impermeable formations by faults and dikes provides steep
channels, for fluid flow (Browne, 1970). The Ohaki and the Broadlands faults
lie in the respective thermal areas. The lateral extent of the field, as
determined from the resistivity surveys (Risk, 1975) is also shown in
Figure 5. The resistivity of the region, enclosed by bars, is less than
5 ohm-m and the resistivity anomaly encloses an area of about 10 square
kilometers. The boundary between hot and cold ground is essentially vertical
down to a depth of at least 3 km.

10
During a period of five years between 1966 and 1971, a total discharge of
about 34 billion kg (74 billion pounds) of fluid and 4.4 x 10¹⁶ joules (42
trillion BTU) of heat had been extracted from the Broadlands field. The
entire field was almost shut down for over 3 years between August 1971 and
December 1974. Initial temperatures of about 260°C and 300°C existed in the
upper and the lower reservoirs before exploitation.
The response of the Broadlands geothermal field is noticeably different
from that of a conventional liquid dominated system due to the presence of non
condensible gases, mainly co2. The partial pressure of gases reduces the
boiling point of water by 3oC at 300°C and by about 1oC at a temperature of
260°C (Macdonald, 1975). Thus, a two~phase region is expected to exist in the
reservoir within a depth of about 2 km during the preproduction state.
Standard hydrostatic pressures, as defined by Hitchcock and Bixley (1975),
existed in the aquifers of the Broadlands system prior to production. Since
the commencement of production in early 1966, the reservoir pressures have
continued to decline until 1971 when the production ceased almost completely.
During exploitation it was found that in the Ohaki area to the north the
reservoir behaves as a single, interconnected unit, whereas Broadland area to
the south is characterized by considerably lower permeability and contains
several isolated pockets tapped by individual wells. According to Grant
(1977), the communication between the Ohaki bores is also not perfect, as it
takes about a year for pressure transients to propagate across the Ohaki
region. This behaviour is quite different from that observed in the Wairakei
field where the communication between wells is very good (Pritchett et al.,
1978). Another remarkable difference observed between these two fields is in
the size of the pressure drop. A pressure drop of as much as 1400 kPa
(14 bars) was observed in some wells when exploitation ceased in 1971 in the

l1
Broadlands field (Hitchcock and Bixley, 1975). For a comparable amount of
fluid withdrawn, the pressure drop observed in the Wairakei field was quite
small. Apparently, the presence of small quantities of carbon dioxide has
played a major role in determining the response of the Broadlands field. The
lower effective permeability as evidenced at Broadlands can be attributed to
the presence of the two fluid phases, each of which impedes the flow of the
other (Grant, 1977). According to this same author, the pressure drop in the
reservoir is mainly the drop in the partial pressure of the gas, with a little
drop in the steam phase pressure. After the 1971 shut in, pressures in the
field started to build up with a recovery rate of about 173 kPa/year (25 psi/
year) over a three-year period (Hitchcock and Bixley, 1975). Grant (1977)
believes that this pressure recovery is primarily the recovery of gas pressure
and the amount of pressure increase is the measure of the total amount of
co2 recharge to the system.
Under these conditions it is reasonable to infer that in the absence of
co2, the pressure behavior should have been similar to that of Wairakei.
Following the pattern of drawdown and recovery, ground subsidence and rebound
are also observed at the Broadlands field as described below.
An extensive precise level network was established in the Broadlands area
during 1967-69 period. Approximately 500 bench marks were installed over an
area of 65 square kilometers, covering a route distance of about 78 km.
Initially a precise level survey was carried out in May 1968 which was then
resurveyed in September 1969 and in March 1974. Local subsidence surveys were
conducted in September 1969, December 1969, June 1970, January 1971, January
1972, February 1975, and February 1976. Total vertical subsidence observed
between May 1968 and March 1974 is shown in Figure 6 which also includes the
recovery in the ground levels during the shut-down period between 1971 and

12
1974. Thus, the subsidence shown in Figure 6 is in fact smaller than the
maximum magnitudes observed up to August 1971. For example, a maximum vertical
displacement of 220 mm was observed over the period February 1969 to January
1972 compared to 190 mm shown in Figure 6, indicating clearly that a rebound
has occurred. It may also be noted by comparing Figures 2 and 6 that unlike
at Wairakei, the subsidence bowl in the Broadlands occurs directly over the
region of maximum discharge. By using the pressure data from Hitchcock and
Bixley (1975) and subsidence data from the Ministry of Works and Development
(1977), a plot of reservoir pressure drop versus subsidence has been prepared
for bench mark H468A in the vicinity of well BR9 and is shown in Figure 7 for
the period September 1969 to October 1973. For this figure September 1969 is
taken as the datum, at which time a certain amount of subsidence and a pressure
drop of about 600 kpa (6 bars) was already existing at well BR9 (Hitchcock and
Bixley, 1975). A total subsidence of 6 mm took place at H468A between January
1972 and February 1975 (Ministry of Works and Development, 1977). Assuming a
linear relation, we have calculated the subsidence for October 1973. Note from
Figure 7 that the slope of the curve tends to change between January 1971 and
January 1972 and drastically changes beyond January 1972. This is due to the
rebound of the ground surface associated with rising reservoir pressures caused
by the shut in of the field in August 1971. Horizontal displacements
associated with subsidence have also been observed in the Broadlands field and
are shown in Figure 8. As seen in this figure, the maximum movement over a
six year period (1968-1974) is about 120 mm. A reinjection plan is underway
in the Broadlands area to minimize subsidence effects. Reinjection tests were
conducted on wells BR7, BR13, BR23, BR33 and BR34 for periods varying from a
few weeks to 3 years (Bixley and Grant, 1979). In all cases, water, super
saturated with silica, was injected and it was found that the permeability of

13
the injected formation either increased or remained the same. Thus,
reinjection tests are quite encouraging at the Broadlands field and a full
scale reinjection scheme might be coming forth in the future. The potential
problems related to subsidence at this site include flooding by Wairakei rivers
and the role of ground deformation in siting power houses and steam lines.
Broadlands geothermal field, which lies in the Taupo-Reparoa basin, has
very little micro earthquake activity as compared with that in the Taupo fault
belt where the activity is about two orders of magnitude higher (Evison et al.,
1976). It appears that neither geothermal fluid production nor subsidence has
any effect on the microseismicity of the Broadlands area.
Cerro Prieto, Mexico
Cerro Prieto geothermal field is the first liquid dominated system in North
America to be exploited for electric power generation. It is located in the
Mexicali valley in the Colorado River delta and is located about 30 km south
of the border of Mexico and the United States (Figure 9). It occupies a
relatively flat area of about 30 square kilometers and exhibits some surface
geothermal manifestations such as mud volcanoes (5 em to 2m high), steam and
gas vents, hot springs, boiling mud ponds and a 200-m high black volcanic cone
known as Cerro Prieto, after which the geothermal field is named.
Geologically the Cerro Prieto field is underlain by deltaic sediments which
are classified into two units, Unit A and Unit B. Unit A has a thickness of
600 to 2500 meters and contains nonconsolidated and semi-consolidated sediments
of clay silts, sands, and gravels. Unit B consists of layered consolidated
sediment shales and sandstone and is more than 2 km thick. The depths to the
producing layers vary over the field between 600 to 900 meters and 1300 to
1600 meters to the west of the railroad track and between 1800 to 2000 meters
and 2200 meters to 2500 meters to the east.

14
The structure of the Cerro Prieto field is controlled by numerous faults
related to the San Andreas fault system. The locations of some important
faults are shown in Figure 10. Hydrologically, these faults may or may not
act as conduits for the influx of fluids from the basement. For example, the
Cerro Prieto fault is believed to act as a western hydrologic boundary to the
field while the Morelia fault acts as a leaky boundary to the north. The
Delta~, the Patzcuaro~ and the Hidalgo faults appear to act as conduits to
fluid flow. The eastern boundary of the field is not yet well established.
Based on geophysical data and interference tests it has been inferred that
both Cerro Prieto I and Cerro Prieto II areas, lying on the west and east of
the railroad track, respectively, are hydrologically interconnected. According
to Mercado (1975), hot water in the eastern part of the field rises up and
flows towards west.
Electric power generation in the Cerro Prieto field began in 1973. In
April 1979 the capacity of the plant was doubled to 150 MW, as two new units
came into operation (Lippmann and Goyal, 1980). Consequently, fluid production
rate has increased from about 2.8x10⁶ to 4.2x10⁶ kg (2800 to 4200 tonnes
per hour. Total heat and mass produced as of November, 1980 has been estimated
to be 6x1o13 kcal (2.4x1o14 BTU) and 1.9x1o11 kg (1.9x1o8 tonnes),
respectively (Goyal et al., 1981). Figure 10 shows the location of over
60 deep wells that have been completed in the field. These wells produce a
water-steam mixture, the weight ratio of which varies from well to well from
0.5:1 to 4:1. Under natural conditions, the waters in the producing strata are
believed to have existed at or below the boiling point (Truesdell, A.H., 1980,
personal communication). This view is supported by temperature logs which
show that the highest temperature of the water has been equal to the

15
saturation temperature corresponding to the hydrostatic pressure of the hot
saline water. Enthalpies of the produced fluid were found to vary from well
to well from about 200 kcal/kg to 450 kcal/kg. Temperatures of about
300°-310oC and pressure about 10,000 kPa (100 bars) are believed to exist in
the field at a depth of about 1300 meters (Lippmann and Man6n, 1980). Some
approximate locations of isotherms, expected to exist at different depths, are
also shown in Figure 10. These profiles are likely to have changed because
fluid production has been in progress since 1973. Pressure drops and
temperature drops of about 500 to 2000 kPa (5 to 20 bars) and 10-15oC have
been observed in some wells.
Subsidence associated with this large scale fluid extraction was
anticipated to occur in the Cerro Prieto field. Therefore, the Direccion
General de Estudios del Territorio Nacional (DETENAL) and the U.S. Geological
Survey, jointly laid out the first network to measure horizontal and vertical
deformations in the Mexicali Valley in 1977. The second survey conducted in
1978 and reported by Garcia (1980) show both uplift (max. 33 mm) and subsi
dence (max 28 mm) over an area extending from the U.S.A-Mexico border to the
south of the field. According to these results, subsidence in the producing
area was very small. Nevertheless, it must be noted that the interpretation
of these results will depend upon the location of the chosen datum of zero
subsidence. Horizontal contraction of about 31 u strain/year in NW-SE
direction and extension of 0.7 u strain/year in NE-SW was also observed in the
field during the second survey of 1978 (Massey, 1980). It is likely that the
Cerro Prieto area might also be undergoing some tectonic deformations similar
to those observed in the Imperial Valley. Zelwer and Grannell (1982) provide
gravimetric evidence to the effect that between 1977 and 1981 approximately

16
45 em of vertical subsidence has occurred east of the power plant, caused by
the 6.1 magnitude earthquake of June 8, 1980. Their evidence also suggests
that almost all the fluid withdrawn is replenished by recharge.
Increased fluid withdrawal at Cerro Prieto may cause changes in pore
pressure, temperature gradients, volume and stress patterns which in turn may
influence the seismicity of the area (Majer et al., 1980). Seismic studies
have been conducted at the Cerro Prieto field since 1971 and have been reported
by Albores (1980) and Majer et al. (1980). It was found that microearthquake
activity in the production area was lower compared to that in the surrounding
region. One explanation for this may be that the effective stress in the
production zone is increased due to fluid exploitation. This leads to an
increase in the effective strength of the rock against slippage, which in turn
reduces the seismic activity in the production zone. The regional seismicity
may be due to tectonic stresses rather than the geothermal activity.
As of August 8, 1979 reinjection was underway into well M9 with untreated
water separated from well M29. Response of well M9 and that of peripheral
wells is being monitored over a period of time. About 40,000 kg/hr
(40 tonnes/hr) of approximately 165@C fluid is injected into an aquifer located
between 721 and 864 m depth. The injection rate had decreased to about 25,000
kg/hr (25 tonnes/hr) by December 1979 (Alonso, et al., 1979). No
subsidence-related damages have been reported from the Cerro Prieto geothermal
field so far.
The Geysers, California, U.S.A.
The Geysers is a vapor dominated geothermal system and is the largest
producer of geothermal electric power in the world. As of early 1982, Pacific
Gas and Electric Company is generating approximately 960 MW of electricity from
steam supplied by Union Oil of California, Magma Power Company, Aminoil U.S.A.

17
and Thermogenics, Inc. The Geysers field is located about 120 km north of San
Francisco in the northern coast ranges of California (Fig. 11). Electric power
production at The Geysers began in 1960 when a 12.5 MW generating plant went
on line using about 114,000 kg (250,000 pounds) per hour of steam supplied by
four wells. Since then power production at The Geysers has been steadily
increasing through the addition of more wells to the production line. The
field is being exploited by private companies and much of the reservoir
performance data is not in the public domain. Good reviews of subsidence
related literature of the Geysers are contained in Grimsrud et al. (1978) and
Miller et al. (1980a,b).
The Geysers field, a tectonically active area, can be characterized by a
series of generally northwest-trending fault blocks and thrust plates. It is
underlain by four major geologic units; the Franciscan assemblage, the
Ophiolite, the Great Valley sequence and the Clear Lake volcanics. The
Franciscan graywacke, that has undergone slight to moderate metamorphism,
constitutes the reservoir rock. These sandstones are very dense and have low
permeabilities (=1 md) and porosities (=10 percent). The steam is thus
expected to be confined to open fractures and fault zones, the presence of
which have been confirmed by drillers• logs and tested cores. Two reservoirs
are believed to exist at the Geysers: a small, shallow reservoir and a deep
extensive one. The depth to the shallow reservoir, which has produced about
50 billion kg (110 billion pounds) of steam (Garrison, 1972), is about 640 m
(2100 feet). The main deep reservoir is located between 760 to 1520 m (2500
to 5000 feet). These two reservoirs are in communication with each other at
some locations while at others they are not. The vertical extent of the
reservoir is estimated to be greater than 3050 m (10,040 feet), (Lipman et al,

18
1977) and the lateral extent is believed to be 4580 m by 4580 m (15,000 feet
by 15,000 feet). The top of the reservoir is estimated to be near sea level
in elevation.
Prior to 1968 the shallow reservoir was the source of steam for power
production. But by the early 1970's most of the fluid was being produced from
the deep reservoir that is believed to have an initial temperature and pressure
of about 240°C and 3545 kPa (514 psi), respectively. It is speculated that a
deep boiling water table may exist at a depth of about 4580 to 6100 m (15,000
to 20,000 feet) which supplies the steam to the producing wells. Noncondens
able gases up to 2 percent by weight are also produced at The Geysers along
with the steam. By 1975 there were 110 wells in the field, providing about
3.65 million kg (8 million pounds) of steam per hour to generate about 500 MW
of electricity. At present, about 900 MW of electricity is being generated.
Future plans to increase the capacity are underway. This commercial steam
production has reduced reservoir pressures considerably and has caused land
deformations. A pressure drop of 1240 kPa (180 psi) was observed in the
reservoir between 1969 and 1977. The relative changes in the elevations of
the ground surface in The Geysers area are shown in Figure 12. The maximum
subsidence to about 13 em has occurred in the area of maximum fluid withdrawal.
It is interesting to note that the vertical changes in the vicinity of the
power plants 9-10 are minimal, even though large-scale steam productions from
these units since 1972. It was also observed that the reservoir pressure
drops and the rates of subsidence were largest soon after the new sources of
steam were put on line and they gradually diminished as recharge gradients
reached steady state conditions (Grimsrud et al .• 1978). The vertical
displacements observed during 1973-75 and 1975-77 along section AA 11 (Figure 12)
are shown in Figure 13. Two types of ground movements may be observed here.

19
First, a downward local tilt of about 3.5 em towards WNW and second, a
substantial subsidence in the areas of steam production overlapped by circles
in Figure 12. A maximum subsidence rate of about 4 em per year during 1973-75
decreased to about 2 em per year during 1975-77 near power plant 5-6. A
nearly uniform uplift from 1975-77 in the ESE area of the main production zone
can either be due to the thermal expansions of the overburden in the newly
drilled areas or may be attributable to the assumption of zero subsidence at
bench work R1243. Reservoir pressure drop and subsidence along section AA 1
(Figure 12) are shown in Figure 14. As could be seen from this figure, the
areas of maximum subsidence are the areas of maximum pressure drop. Horizontal
displacement rates were found to vary from 1.5 em per year in the areas of
heaviest fluid withdrawal to 0.4 em per year in the peripheral areas (Lofgren,
1978).
In an effort to reduce subsidence and extract maximum thermal energy,
reinjection of the steam condensate back into the formation began in 1969 at
The Geysers. By 1975, six wells were being used to reinject condensate of
about 1.78 x 10⁴ m3 (4.7 million gallons) per day, about 25 percent of
daily steam output, back into the reservoir between 720 and 2450 m (2364 and
8045 feet) depths. The injected condensate flows down by gravity to depths
below adjacent producing wells, in situ steam pressure being less than the
hydrostatic pressures. It is believed that the injected fluid can contribute
to an increase in the seismicity of the region by inducing slippage along the
planes of weaknesses. In addition, microearthquake activity can also be caused
by volume changes due to fluid-withdrawal and subsidence (Majer and McEvilly,
1979). A comparison of the seismic activity during pre-production (1962-63)
and peak production (1975-77) times showed that the regional seismicity
(magnitude ~2) in the area increased to 47 events per year in the latter

20
period as opposed to 25 events per year in the former (Marks et al., 1979).
Also the microearthquakes at The Geysers are strongly clustered around the
regions of steam production and fluid injection. It appears likely that much
of the present seismicity at The Geysers is induced by one or more of the
following phenomena: steam withdrawal, injection of condensate and subsidence.
The exact relationship between these phenomena is not firmly established, it
is suspected that the slippage of fault blocks past one another due to
subsidence movements may in part contribute to the microearthquakes. Or it is
that subsidence may give rise to the formation and propagation of micro
fissures which may enhance micro-seismic activity. Initiation and propagation
of microcracks is also attributed to the thermal stresses produced by
circulating geothermal fluids and this phenomenon is termed "thermal stress
cracking" (Nelson and Hunsbedt, 1979). The mechanisms, by which this increase
in seismicity has occurred warrants further study. No environmental hazards
are reported in the Geysers area due to land subsidence.
Larderello Geothermal Field, Italy
Electric power generation at the Larderello field began as early as 1913,
making it the first geothermal field in the world producing electric power
from geothermal steam (DiPippo, 1980). This field is part of an arch of
high heat flow extending along the east coast of the Italian peninsula from
Tuscany to Sicily (Mongelli and Laddo, 1975). The Larderello system contains
many geothermal anomalies. As of March 1975, the producing anomalies included
San Ippolito, Gabbro, Larderello, Serrazzano, Castelnuovo V.C., Sasso Pisano,
lagoni Rossi, Lago, Monterotondo and Molinetto anomalies. Figure 15 shows the
location of the field and its various anomalies. The Larderello field extends
over a distance of about 20 km from Monterotondo in the south to the Gabbro in
the north. The area covered by this field is about 170 km2 (Ceron et al.,

21
1975). As of March 1975, a total of 511 wells were drilled in the region with
an average depth of about 650 meters. Of these, 194 were connected to the
production line and 9 wells were used as observation wells for reservoir
engineering studies. Installed capacity at this time was about 380 MW with an
average fluid production of about 15,000 kg/hr (15 tonnes/hr) per productive
well at an operating well-head pressure of 100 to 800 kPa abs (Geron et al.,
1975).
The geologic map of the Larderello field along with a cross section view
is shown in Figure 16. From a hydrogeological point of view, the lithology
here can be grouped into three main complexes: The first is an impermeable
cap rock complex made of outcrops of 11 Argille Scagliose" comprising shales,
limestones, etc., and 11Macigno 11 and 11 Polychrome Shales" overlain in places by
clay, sand and conglomeratic sediments. The second is the Tuscan formation,
which constitutes the principal reservoir and forms the circulation region for
the endogenous fluid. It comprises radiolarites to evaporite deposits. The
third is the basement complex, consisting of phyllitic-quartzitic formations,
which is highly impervious where phyllites predominate but may be locally
permeable where intercalations of quartzites and crystalline limestones are
present. Because the cap rock is not continuous, the Tuscan Formation is
exposed at some places and allows the geothermal aquifer to be recharged by
rainfall. The steam produced at the Larderello field originates from the
meteoric water that may have undergone either a deep regional circulation or a
local shallow one (Petracca and Squarci, 1975).
Geophysical studies indicate that the reservoir is characterized by a
distinct resistivity high of greater than 100 ohm-meters and is located at
depths of less than 1000 m. Thermal gradients of the order of 300°C/km to a
maximum of 1000°C/km at some places are found in the area. The accepted normal

22
gradient for the area is about 30°C/km with a heat flow of greater than 3 HFU
(heat flow units). At some places heat flows of 5 to 10 HFU's exist. The
highest reservoir temperature and pressures encountered in the field are 300oC
and 3000 kPa (440 psi), respectively. The geothermal fluid produced consists
of dry saturated or slightly superheated steam and some noncondensible gases.
The amount of noncondensible gases varies over the field from 1 percent to
20 percent by weight with an average of about 5 percent of which co2 is the
dominant one. Temperatures, pressures and flow rates vary from well to well
and from area to area. There has been a significant decrease in the mass flow
rates and reservoir pressures over the decades of production. For example,
wells 85 and Fabiani of the Larderello anomaly show a significant decrease in
the mass flow rate over a 20 to 30 year period (Figure 17). This figure
indicates that flow rates are apparently tending to a steady state. The
productive wells in the Larderello field were first shut-in in 1942 but
systematic measurements of relative pressures began only in 1955 (Celati
et al., 1977). The water table data was used by Celati et al. (1975) to
determine formation pressures during this period. It was found that the
initial pressures in the Larderello region varied from 1960 to 3920 kPa (284
to 568 psi) and that these values were affected by nearby producing zones as a
result of the expansion of the explored area. Pressure depth plots indicated
that in different parts of the field both water dominated and vapor dominated
systems had existed prior to intensive exploitation began. Reservoir pressure
distributions in the Serrazzano area for 1970 are shown in Figure 18. The
highest pressure downhole pressure formed boserved among all Italian steam
fields was measured in the Travale field where a pressure of about 6000 kPa
(about 870 psi) existed in new wells drilled from 1972 onwards. Such high
pressures indicate that the wells in this field have reached a water dominated

23
reservoir. Considering that Larderello is in much the same hydrogeological
and thermal situation as the Travale field, it can be deduced that Larderello,
in undisturbed conditions, might also have had similar pressures (Celati
et al., 1975). Continued production from the field has led to a considerable
drop in the reservoir pressures and water levels. Since 1963-64, water levels
in the western part of the field have dropped by about 100 meters compared to
the other parts where the drop is less than 50 meters (Celati et al., 1977).
In a related study, Atkinson et al. (1978) calculated an initial pressure of
3920 kPa (570 psi) at the Serrazzano field and steam reserves of about
1.7xlo11 kg (170 million tonnes).
To monitor the effects of the injection of liquid wastes on surface and
ground waters, a reinjection program was started in the Larderello region
during the early 1970's. About one fifth of the waste liquid is returned to
the reservoir by reinjection through the wells at the periphery of the field
and the remaining 80 percent is discharged directly into the local streams
(Defferding and Walter, 1978) in spite of high concentrations of boron.
Generally reinjection was successful. However, in one case cold reinjected
liquids reached a production well.
No subsidence has been reported at the Larderello field, although
production has been in progress for 60 years and on a relatively large scale
for 30 years (Kruger and Otte, 1976). Microearthquake studies in the
Larderello area do not seem to have been repeated. However, a few earthquakes
of magnitude 4 in the Larderello area and one earthquake centered about 15 km
east of Larderello have been reported. It seems that microseismicity could be
recorded at the Larderello field if sensitive instruments are used.

24
Geopressured Systems
Several reservoirs of brine at high pressures and moderate temperatures
are known along the Gulf Coast of Louisiana and Texas. Wallace (1979)
estimates 17.1 X 10²¹ Joules of thermal and methane energy in place in the
reservoir fluids underlying a 310,000 km2 area of the northern Gulf of
Mexico basin. Temperatures and pressures of most waters in these areas vary
between 163~204°C and 69 to 103 MPa (10,000 to 15,000 psi), respectively, in
the depth intervals of above 3.5 to 5 km (Wilson et al., 1974). Temperature
gradients of about 20°-40°C/km exist in the Gulf Coast region in the upper
2 km. Geothermal gradients exceeding lOOoC/km are found within and
immediately below the depth interval where maximum pressure gradient change
occurred (Jones, 1970). The depth to the top of the geopressured zone
conforms in a general way with a 120°C isotherm which occurs in the depth
range of a 2.5 to 5 km below sea level (Jones, 1970). The loss of load
bearing strength due to thermal diagenesis which takes place between 80°C to
120°C is considered most responsible for creating the top of the geopressured
zone. The location and depth of occurrence of the geopressured zones in the
Gulf Coast region are shown in Figure 19.
In this paper we shall confine our attention to one geopressure field
which is under exploitation. It is the Chocolate Bayou Field in Texas from
which oil and gas have been produced since the early 1940 1 s.
Chocolate Bayou, Texas
Chocolate Bayou is an oil and gas field in Brazoria County~ Texas~ and is
located about 30 miles south of Houston (Figure 20). Oil and gas production
from both normally and geopressured zones have been responsible for a land
subsidence of about 0.6 m (2 ft) in this area. The Austin Bayou Prospect, a
proposed geothermal exploration site, is located 8 km (5 miles) southwest of

25
Chocolate Bayou and has essentially the same geohydrological conditions. One
should expect that the subsidence at the Austin Bayou prospect will not be
much different from that at Chocolate Bayou under geothermal fluid
production. The Chocolate Bayou field occupies an area of about 69 km2
(25 mi 2) and has a surface elevation of 3 to 12 m (10 to 40 feet) above sea
level with a gentle southeast dip. The formations from surface downwards
include Pliocene to Holocene sand and clay beds in the upper 760 m
(2500 feet), Miocene and Pliocene sands in the next 1200 m (4000 feet); and
Oligocene and Miocene shales in the remaining 610 m (2000 feet) down to a
depth of about 2650 m (8700 feet). Underlying these formations are the
productive geopressured sediments, which might occur down to depths of about
4900 m (16,000 feet). The producing zones are underlain and overlain by thick
shales and vary in thickness from less than 3 to more than 60 m (10 to more
than 200 feet). The depth to the top of the geopressured zone varies from
2,440 m to 3,050 m (8000-10,000 feet). Numerous faults with no surface
expressions exist in the field. Relative fault movement is believed to be
responsible for the generations of abnormal pressure zones by bringing shales
into contact with sands and thereby preventing the communication between upper
and lower aquifers (Miller et al., 1980b). Faults are also believed to act as
complete or partial barriers to the fluid flow (Gustavson and Kreitler, 1976).
Since the early 40's the Chocolate Bayou field has produced more than
4.5x1o11 cubic meters (16 x 1012 standard cubic feet) of natural gas and
5.6x1o6 m3 (35 million barrels) of oil, respectively. Gas wells have
contributed an additional 6.5xlo6 m3 (41 million barrels) of liquid
hydrocarbons. Annual production of the field is shown in Figure 21. The
annual production of brine from the field is not shown in this figure, because
these data are not readily available (Grimsrud et al., 1978). The reinjection

26
of brine since 1965, for the Phillips Petroleum Company's wells, is also shown
in this figure. This reinjection is believed to be about 10 percent of the
brine produced. As may be noted from this figure, brine is the predominant
liquid produced at the field since 1965. Current total production of
hydrocarbons is less than 8x10⁴ m3 (0.5 million barrels) per year and that
of brine is more than 4.8x10⁵ m3 (3 million barrels) per year (Miller
et al., 1980b; Grimsrud et al., 1978). Initial conditions of the reservoir
vary within the field from one location to another. The producing zones in
west Chocolate Bayou area are all normally pressured; in East Chocolate Bayou,
both normally pressured and abnormally pressured zones are present; and in
South Chocolate Bayou all zones are abnormally pressured. Pressure versus
depth relationships in wells located west of the Chocolate Bayou area is shown
in Figure 22. Based on well logs, a temperature gradient of about 3°C/100 m
seems quite reasonable down to about 5000 m. Data presented by Bebout et al.
(1978) for a well from the South Chocolate Bayou field indicates that bottom
hole pressures had declined by 55 to 62 MPa (8000 to 9000 psi) during a
ten-year period 1964 to 1974, although bottomhole temperatures remained fairly
stable at about 162°C (323°F). The reduction in the formation pressures is
expected to cause some land subsidence. In fact, bench mark K691 located in
the Chocolate Bayou area has subsided .55 m (1.8 feet) since 1943
(Figure 23). Besides oil and gas production, ground water withdrawals and
tectonic movements are also considered as potential causes of this subsidence
(Grimsrud et al., 1978). Groundwater withdrawals between 1943 and 1974 have
caused a subsidence of more than 2.13 m (7 feet) in the Houston-Galveston area
and are believed to be responsible for some subsidence in the Chocolate Bayou
area (Miller et al., 1980). Some estimates have been made on the component of
Chocolate Bayou subsidence attributable to groundwater pumpage. It has been

27
suggested that the subsidence of about 0.3 m (1 foot) out of a total of .55 m
(1.8 feet) can be attributed to the groundwater withdrawal (Sandeen and
Wesselman, 1973; Grimsrud et al., 1978). It may be noted from Figure 23 that
the bench marks P53 and M691 located in the Chocolate Bayou field show a
change of slope in late 40's and early 60 1 s. This increased subsidence can be
related to increased production of hydrocarbons as shown in Figure 21.
Another interesting point may also be noted in Figures 21 and 23 that although
the hydrocarbon production at the Chocolate Bayou field has been decreasing
since 1964, the average rate of subsidence from 1964 to 1973 was greater than
that from 1959 to 1964. This suggests either a lag-time of at least several
years between extraction of deep fluids and the appearance of subsidence
effects at the surface or a transition of the sediments from a state of over
consolidation to that of normal consolidation (Holzer, 1980). No surface
effects, such as faulting, ground cracking, disruption of well casings,
damages to structures, etc., are reported in the Chocolate Bayou area due to
ground subsidence.
Summary of Field Observations
There is clear field evidence from different parts of the world to confirm
that geothermal fluid extraction can cause to vertical as well as horizontal
displacements at the land surface. These deformations, which can cause
significant damage to property, often show specific patterns of variations in
space and in time, indicative of complex interaction of physical phenomena.
At Wairakei in New Zealand a well-defined subsidence bowl, with an area of
about 1.5 km2, has developed due to fluid production, with a maximum
vertical displacement in excess of 4.5 m. Within this bowl, pronounced
horizontal displacements directed towards the center have also been observed
with a maximum magnitude of about 0.5 m. Spatially, the subsidence bowl is

28
centered about 1.5 km ENE of the center of the main production area
(Figure 2), presumably controlled by peculiarities of local geology. The
annual rate of vertical displacement also shows a significant relation to
time. An analysis of the subsidence at bench mark A97 in the SSW part of the
bowl suggests that the rate was about 4 em/year between 1953 and 1962. Around
1963 this rate underwent a marked increase and, between 1971 and 1974 had
attained a magnitude of about 15 em/year. An examination of the pressure drop
at the same bench mark suggests that the marked change in the rate of
subsidence is indicative of a marked increase in the compressibility of the
material undergoing subsidence. Although recent studies indicate an increase
in the micro- and macroseismic activity in the Taupo fault belt area (which
passes to the West of the field in a northerly direction), it is difficult to
decide at present whether this increase is to be attributed to the
exploitation activity or to natural tectonism.
The Broadlands field, New Zealand, also exhibits conclusive evidence of
subsidence associated with geothermal fluid production. Unlike at Wairakei,
the subsidence bowl at Broadlands is centered almost directly over the
production area, with a maximum displacement of the order of 0.2 m since the
mid 1960 1 S. The field was almost completely shut down during August 1971 and
again during September 1974. Both these events were followed by a marked
decrease or even a reversal in the direction of ground displacement. Between
1969 and 1972 the average rate of subsidence was of the order of 5 em/year.
As at Wairakei, the horizontal movements at Broadlands are also directed
towards the center of the bowl, with maximum displacements of the order of
10 em. Recent investigation indicate no noticeable seismic activities
attributable to geothermal exploitations at Broadlands.

The liquid-dominated geothermal field at Cerro Prieto, Mexico, has been
producing since 1973. Observations to date indicate that small vertical
displacements, of the order of a few centimeters, have occurred over the field
since 1977. However, these displacements cannot be conclusively attributed to
fluid production. It is probable that the ground deformations and seismicity
that have been measured recently in Cerro Prieto could be attributed by
tectonic activity in this structurally active part of the earth's crust.
The Geysers field in Lake County, California constitutes an excellent
example of a vapor-dominated system. Relative to a 1973 datum, vertical
movements of as much as 13 em have been observed in The Geysers up until
1977. The maximum subsidence rate was about 4 em/year between 1973-75 and
declined to about 2 em/year near Power Plant 5-6. At the same time, a nearly
uniform uplift of about 2 em occurred during 1975-77 was also observed in the
ESE part of the production area. There is evidence that the areas of maximum
subsidence over the field are correlated with areas of maximum pressure drop.
Since 1969, spent condensate fluids have been reinjected into the formation
and provide pressure support to the reservoir. A comparison of the
preproduction seismicity to that of the peak production period, 1975-77, shows
that regional seismicity (magnitude ~2) had increased from 25 to 47
events/year. In addition, micro-earthquake activity is strongly clustered in
regions of production and injection.
Another well known vapor dominated system is the one in and around
Larderello in Italy. Although this field has been under production since
early 1940's, no noticeable subsidence has apparently occurred. A few
earthquakes of approximate magnitude 4 have been reported. No data are
available on the micro-earthquake activity in this region.
29

30
The geopressured geothermal systems of the Gulf Coast in Texas and
Louisiana are currently under exploration. As such, no case histories are now
available to evaluate their deformation behavior in response to fluid
withdrawal. Some clues to their possible behavior, however, can be obtained
by studying the deep oil and gas fields that have been exploited near the
exploration sites. In the Chocolate Bayou oil fields of Texas producing oil
and gas horizons are known between depths of 2650 and 4900 m (8700 to
16,000 feet). These zones may be either normally pressured or may be
geopressured. Within the Chocolate Bayou area maximum subsidence of up to
0.55 m subsidence attributable to oil and gas production between 1944 and 1972
has been measured. It is believed that part of this subsidence could be due
to shallow groundwater development.
PHYSICAL BASIS
As evidenced by field observations the important questions requiring
consideration in analyzing subsidence due to geothermal fluid withdrawal are
as follows:
1. The nature of the size and the shape of the subsidence bowl.
Distributions of horizontal and vertical displacements.
2. The location of the subsidence bowl in relation to the location of the
area of fluid production.
3. The variations in the time-rate of subsidence as a function of time.
4. Differential subsidence.
5. Fault movement and induced seismicity, if any.
The fundamental sequence of events leading to land subsidence is as
follows: (1) fluid withdrawal causes reduction in fluid pressure; (2) fluid
pressure reduction causes an increase in stresses on the rock matrix,
accompanied by a reduction in the reservoir bulk volume; (3) the reduction of

reservoir volume leads to the generation of a three dimensional displacement
field within the reservoir and some deformation may also be induced by
contractions associated with temperature declines; and (4) the reservoir
displacements propagate to the land surface to cause horizontal and vertical
ground displacements.
31
For purposes of analysis, it is convenient to distinguish between the
reservoir proper where the displacements originate, and the overburden through
which the reservoir displacements are merely transmitted. We shall define the
"reservoir" to include those portions of the system from which geothermal
fluids are drained (released from storage) to compensate for the fluids
removed at the wells. Specifically, the reservoir includes the highly
permeable horizons (the aquifers) as well as the slowly draining formations
(aquitards or caprocks). The overburden, on the other hand, has little
hydraulic continuity with the reservoir. Thus, there is no drainage of fluid
from the overburden to make up for the geothermal fluids exploited.
The reservoir and the overburden basically differ in the manner in which
they are subject to loading and deformation. The reservoir is subjected to
loads originating from within the pores (endogeneous loading) whereas the
overburden is subject to stresses or displacements imposed on its boundary
(exogeneous loading). Stated differently, the reservoir is subject to drained
loading while the overburden is subjected to undrained loading.
In practice, it may be hard to define the exact location of the
reservoir~overburden interface. This boundary will obviously change its
disposition with time, unless there exists a sharp impermeable contact between
the two. Nevertheless, there is reason to suspect that results of overall
analysis may not be very sensitive to the uncertainties inherent in locating
this contact.

32
Deformation of the Reservoir
In a geothermal reservoir deformation may occur due to mechanical as well
as thermal causes. Although a reasonable theoretical basis is currently
available to discuss mechanically induced deformations, much remains to be
done to properly explain the complex interactions existing between thermal and
mechanical deformations that occur within a geothermal reservoir under
exploitation.
In the following discussions on reservoir deformation. we shall restrict
ourselves to subsidence caused by fluid withdrawal (that is, endogeneous
loading). The duration of reservoir exploitation is considered to be much
smaller than that over which tectonic stresses change and hence, we will treat
the total stresses on the system to remain unchanged in time.
Mechanical Deformation: This phenomenon can perhaps be best explained by
considering an elemental volume of the reservoir and its response to an
imposed change of fluid mass at constant temperature. Such a change in fluid
mass is indeed induced when geothermal fluid is mined from the reservoir. The
mass of fluid contained in an arbitrary volume element is given by
Mf = VvpfSf• where Mf is mass of fluid, Vv is volume of voids,
pf is fluid density and Sf is fluid saturation. Consequently,
(1)
Of the three quantities on the right hand side of (1) the first, which denotes
the component of ~Mf arising due to pore volume change, is the phenomenon
which is directly determines the magnitude of subsidence. The remaining two
terms, which govern the dynamics of pore-fluid pressure change, indirectly
contribute to subsidence. Therefore, in so far as the mechanism of pore

33
volume change is concerned, we may focus attention on the first term on the
right hand side of (1). Thus, only that term needs further consideration.
As already stated, ~Vv is caused by a reduction in the pore fluid pressure
following removal of fluid mass. In addition to the change in void volume one
has also to consider the change in the volume of the solid grains in order to
evaluate the change in the bulk volume of the element. Note that it is the
change in the bulk volume that controls subsidence. The basic ideas of
combining ~Vv and ~Vs (where Vs is volume of solids) to compute ~V has
been discussed in detail by Skempton (1961). In accordance with Skempton's
development, we can show that when the total stress is constant, that is,
(2)
where c is the compressibility under drained flow conditions in which external
stress is increased with no change in pore pressure (p). And:
where cs is the bulk compressiblity of the solids. As justified
experimentally (Skempton, 1961), the assumption inherent in (3) is that a
medium subjected to the same magnitude of internal fluid pressure and external
stress will behave as if the entire medium was made up of the solids. Based
on the theory of elasticity, Nur and Byerlee (1971) provide a theoretical
justification for this. In (2) and (3) a reduction in volume is associated
with a positive sign. Combining (2) and (3):

34
t:.V V = - Cat:.p ( 4)
where a= (1-c /c). Equation (2) pertains to volume change solely due to s
grain-grain slippage and (3) relates to volume change due to elastic
compression of the grains. Physically, (4) implies that falling pore pressure
will be accompanied by compaction due to grain-grain slippage and a dilation
due to the expansion of the solids. Usually c > cs and hence grain-grain
slippage will dominate the deformation process.
Furthermore (2) implies that for void volume change and bulk volume
change, respectively, the following constitutive relations between effective
stress, cr 1, and pare valid:
For void volume change:
( 5)
For bulk volume change:
(6)
When more than one fluid phase is present in a geothermal system (e.g.,
steam and water), the relation between change is fluid pressure and change
skeletal stresses becomes more complex than (6). No published work, to our
knowledge, addresses this relationship for a two-phase, stream-water system.
The somewhat analogous problem of deformation of soils partially saturated by
water and partially by air has been addressed experimentally by soil
mechanicians. The discussions immediately below outline their findings.
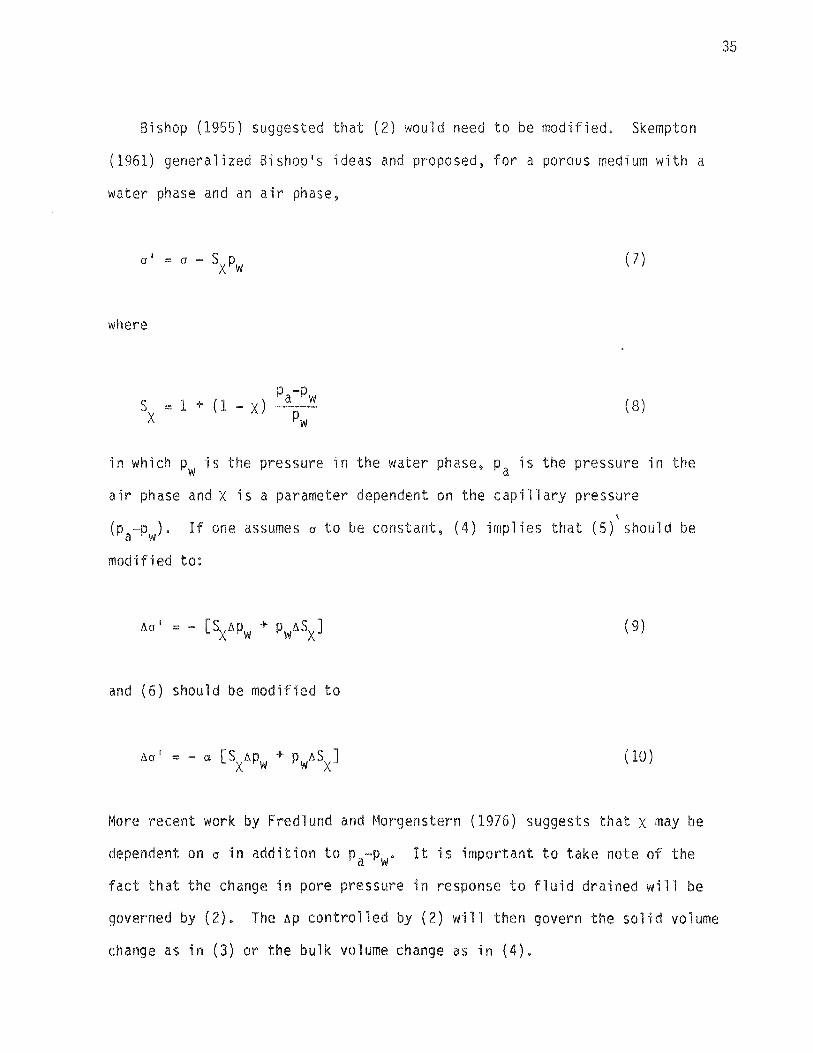
Bishop (1955) suggested that (2) would need to be modified. Skempton
(1961) generalized Bishop's ideas and proposed~ for a porous medium with a
water phase and an air phase,
a 1 = cr- S p X w
where
Pa-Pw s =1+(1-x)--x Pw
(7)
( 8)
in which pw is the pressure in the water phase~ Pa is the pressure in the
air phase and X is a parameter dependent on the capillary pressure '
(pa-Pw). If one assumes a to be constant~ (4) implies that (s)' should be
modified to:
= - ( 9)
and (6) should be modified to
(10)
More recent work by Fredlund and Morgenstern (1976) suggests that x may be
dependent on a in addition to Pa-Pw· It is important to take note of the
fact that the change in pore pressure in response to fluid drained will be
governed by (2). The ~P controlled by (2) will then govern the solid volume
change as in (3) or the bulk volume change as in (4).
35

36
In view of the foregoing, we may express the rate of change of void volume
with reference to fluid pressure by the relation,
t.Vv t.Vv t.pw = !J.cr'
where s~ " [sx replace (11) by
I
S cV X
Noting that c
( 11)
(12)
Skempton (1961) presented data indicating that c5/c is very nearly zero in
almost all unconsolidated sediments. But in rocks such as granite and
quartzite it may attain values of 0.7 or more. Also, for fully saturated I
materials, ~ = \"" 1.0.
Very little is known about the nature of the x and S functions for steam X
water systems at elevated temperatures, although one would suspect that a
steam-water system would obey an expression similar to (12).
Insofar as the phenomenon of fluid flow is concerned, it is the void
volume-change, a scalar quantity, that is of critical importance. However,
for purposes of subsidence analysis it is necessary to be able to evaluate the
vertical and lateral displacements that accompany bulk volume change. How
much of the horizontal displacement seen at the land surface is directly
related to horizontal displacements in the reservoir is one of the important
questions that needs resolution at the present time.
One of the simplest methods of converting volume change to displacement is
to assume that due to the large lateral dimensions of geologic systems,
horizontal strains are essentially negligible and that all volume change is

37
caused by vertical displacements. If so, the change in the vertical dimension
of a regular prism of crossectional area A will be given by, 6h = - (ca6p)h.
Where h is the height of the prism. This is the assumption of one-dimensional
consolidation theory, which has proven engineering validity in many field
situations. In this case, c is usually obtained by testing samples in an
oedometer or a device in which lateral strains are prevented.
For those field situations in which lateral strains may not be neglected,
the general three dimensional deformation field accompanying volume change has
to be considered. The boundary conditions obtaining in such systems cannot
generally be duplicated in the laboratory and hence it is not possible to know
c a priori. In this case, change in bulk volume is a function of linear
displacements in different directions. For simplicity, if we consider a
system with elastic, isotropic materials undergoing small strains, the change
in bulk volume may be related to directional displacements by the relation,
(13)
where £ is the volumetric strain ~V/V and £ , £ and £ are linear V X y Z
strains in the direction of the coordinate axes. The task here is to evaluate
Ex' £Y and £z based on the linear moduli of the material and the
boundary conditions. In addition there also arise distortions of the
elemental volume in addition to displacements. These distortions, caused by
shear forces, do not contribute to volume change. If we assume the porous
medium to be an elastic solid obeying Hooke's Law, then, three dimensional
strain components, Eij' i = 1,2,3 can be related to the three-dimensional I
stress components crij through three material properties, Young's modulus,
E, shear modulus G and Poisson 1 s ratio, v (see for example, Popov, 1968). For

38
purposes of analyzing three dimensional deformation~ the effective stress
relations (5) and (6) may be generalized to (Garg and Nur~ 1973):
(14)
for void volume change and
cr .. =cr .. -aS c. ·P 1J 1J X lJ w (15)
for bulk volume change.
It is widely known from experience that the parameters governing volume
change~ c and E, are often strong functions of effective stress, in addition
to being dependent on the direction of the loading path and having a memory of
past maximum loads. It is practically most expedient to treat these
complexities of behavior by imposing the elasticity assumption over small
ranges of stress increment. Accordingly we will restrict ourselves to the
assumption of linear elasticity.
Having considered the phenomenon of deformation of our elemental volume,
we now proceed to consider the forcing function that causes volume change. In
the present case, the forcing function is the withdrawal of fluid from a
geothermal field and the consequent reduction in fluid storage. The task then
is to relate (12) to the dynamics of transient fluid flow in a deformable
porous medium.
The single-equation approach: The simplest way to couple fluid flow and
deformation is to assume that the boundary condition controlling deformation
in the field can be reproduced in the laboratory (e.g., oedometer test) and

that the compressibility of the porous medium is known. In this case, the
entire problem may be represented by a single governing equation,
(16)
where G is the source/sink term, k is absolute permeability, u is viscosity,
pw is fluid density, z is elevation above datum, g is acceleration due to
* gravity, pw is fluid pressure, and me is a generalized storage
coefficient,
(17)
where n is porosity and cw is compressibility of water. When two phases are
present, an equation similar to (16) has to be set up for the second phase.
The solution of the above equation(s) merely leads to the evaluation of the
39
bulk volume change. If one makes an assumption of the pattern of displacement
(e.g., zero horizontal displacement) one can easily compute vertical
displacements in the reservoir. Essentially such an assumption was used by
Helm (1975) in his one~dimensional simulation of land subsidence. Narasimhan
and Witherspoon (1978) combined this one-dimensional deformation assumption in
conjunction with a three dimensional fluid flow field. This assumption is
perhaps realized within the low-permeability, high~storage aquitards that may
exist in geothermal systems. If this assumption is used, the horizontal
displacements observed at the land surface will have to be explained solely in
terms of the deformation of the overburden. Another limitation of the simple
equation approach is that the stress field evaluation is treated in a
perfunctory manner; that is, only the change in mean principal stress or the
vertical stress is accounted for.

40
The Coupled-Equation Approach. A more comprehensive solution of the
reservoir deformation problem requires that the physics of the problem be
described in terms of two coupled equations: one for fluid flow and the other
for porous medium deformation. These equations will have to be reinforced by
an energy transport equation in geothermal systems, as we shall see later.
The coupled approach was originally propounded by Biot (1941) and later
revised by him in 1955. Biot's approach has since been applied extensively in
the fields of soil mechanics and rock mechanics (e.g., Sandhu and Wilson
(1969), In the general three dimensional situation we need to separate out
the change in void volume and the expansion of water in {16) and then rewrite
equation as,
a o . e. 1 1
a (18)
where eij are the elements of the strain tensor and oij is Kronecker
Delta. Also, 15 •• e .. = e", the volumetric strain. Because the ~:: 1.J.'s 1J lJ ..
are unknown in (18), we need to solve a second equilibrium equation which
balances total loads. That is,
aa . . ~ + F. = 0 (19} ax. 1
J
where crij denotes the total stress tensor and F1 denotes body forces. In
order to couple (18) and (19), we may express crij in (19) in terms of eij
and pw using appropriate consitutive~ stress-strain laws. For an elastic
isotropic material, a 1j may be expressed as (Biot, 1941):

41
(20)
where E is Youngs modulus and v is Poisson's ratio. The physical basis for
fluid flow in a deformable porous medium is provided by (18) and (19) modified
by (20). These equations are subject to appropriate initial conditions,
boundary conditions and sources.
Thermal Deformation: Although the phenomenon of thermal expansion of
solid materials is extremely well known, the role of thermal expansion in
relation to fluid flow in deformable media has so far been treated only in a
simpli ic manner (see for example, Golder Associates, 1980). In this
approach, the volume change due to temperature change is explicitly added to
the volume change due to pore pressure change. In particular, an increase in
temperature leads to an increase in the volume of the solid. Intuitively one
would expect that part of the solid volume expansion will tend to decrease the
pore volume while part of it will contribute to an increase in the bulk
volume. Whether the ensuing decrease in pore volume will generate a pore
pressure component or not will have to depend on the relative thermal
expansivities of the solid and water. If we neglect these questions, the
expansion of the solids due to an increase in temperature will affect bulk
volume change in the same sense as a decrease in pore-fluid pressure. Thus,
if ss is the coefficient of thermal expansion of the solids defined as
ss = 1/Vs (dVs/dT), then the bulk volume change due to a simultaneous
change of apw and aT is (under conditions of constant cr):
(21)

42
It is obvious that 8T has to be obtained by solving a separate energy balance
equation in addition to the fluid flow equation (19) and the force balance
equation (20). In recent years many papers have appeared in the literature on
the formulation of the energy balance equation in single phase and two-phase
system. Notable among these are: Coats (1977), Garg et al. (1975), Mercer
and Faust (1979), Pinder (1979), and Witherspoon et al. (1977).
In summary then, a physical description of the subsidence phenomenon
accompanying geothermal fluid exploitation involves the simultaneous
consideration of three coupled equations: one for the conservation of fluid
mass; one for the maintenance of force balance and one for the maintenance of
energy balance. These equations would need to be supplemented by appropriate
relations between pore pressure on the one hand and skeletal stresses on the
other as well as information on the compressibilities of the bulk medium and
the solids and the thermal expansivity of the solids.
OVERBURDEN DEFORr1ATION
The overall effect of the reservoir deformation is that its interface with
the overburden is deflected downward. In addition, points on this interface
may also be subjected to some horizontal displacements. In response to these
displacements on its bottom boundary, the overburden itself deforms, leading
to vertical as well as horizontal displacements at the land surface.
It is clear at the outset that the overburden deforms essentially in an
undrained fashion. The deformation of the overburden is therefore governed by
a force balance equation such as (19), subject to a prescribed displacement
boundary condition at the bottom and a zero stress, free surface boundary
condition at the top. Additionally, the overburden may be constrained by
other lateral boundaries such as faults and basin margins. The response of

43
the overburden is largely governed by the ratio of its thickness to the radius
of the deformed region as well as the properties of the materials constituting
it. Where the thickness of the overburden is relatively small compared to the
areal extent of deformation, the land subsidence observed will almost be a
replica of the deformation pattern at the reservoir overburden interface.
However, as the thickness increases, the displacements at the
reservoir-overburden interface may be modified and attenuated before reaching
the land surface.
One of the intriguing questions still unanswered concerns the nature of
the mechanisms that cause horizontal displacements at the land surface; does
the horizontal displacement at the surface definitely imply significant
horizontal displacement in the reservoir? In principle it is conceivable that
horizontal displacements may be caused at the land surface simply because of
the elastic overburden system responds to the curvature of the underlying
subsidence bowl. Such horizontal displacements could be accounted for by
means of the force balance equation (19) already mentioned. However, Helm
(1982) has been investigating the possible importance of horizontal
deformations originating within the reservoir by treating the solid grains as
constituting a viscous fluid. ihe chief difficulty in answering this question
is that no field data are presently available on the variation of horizontal
displacements with depth within the overburden. Indeed, a recent report by
01 Rourke and Ranson (1979) indicates that not only are instruments
non-existent at present to measure horizontal displacements along a vertical
profile but that such instruments may not be available in the foreseeable
future. Until sufficient field data is forthcoming, all the hypotheses that
attempt to explain horizontal displacements will remain largely untested.

44
ROLE OF FRACTURES
Our discussion of physical bases has so far centered exclusively on porous
materials. Yet there is reason to believe that many geothermal reservoirs
(e.g., Wairakei, New Zealand, The Geysers, U.S.) are dominated by fractures.
Additionally, the overburden may also be traversed by individual faults or a
system of faults. Despite these physical realities, incorporating fractures
into the physical basis is not easy. Fractures may control subsidence both at
microscopic level, in terms of microfracturing and development of secondary
porosity (Noble and Vander Haar, 1980) or on a macroscopic scale in terms of
differential subsidence across major faults as has been noted at Long Beach,
California. In fractured reservoirs, fractures appear more to constitute
highly permeable channels of fluid flow rather than constituting storage.
Fractures may indirectly govern deformation by influencing the rate of fluid
transmission and discrete discontinuities may contribute to deformation by
acting as failure planes. However, it is doubtful whether the deformation of
fractures themselves will contribute greatly to bulk volume changes in the
reservoir. Apart from this qualitative reasoning, very little quantitative
information is currently available in the literature to evaluate the role of
fractures in the subsidence process.
RANGE OF VALUES OF PARAMETERS
Because of the difficulties associated with the collection of undisturbed
samples from geothermal reservoirs and the difficulties associated with
measuring physical properties of rocks under simulated in situ conditions,
reliable data on physical properties relevant to geothermal subsidence are
very limited in extent. Within the last decade, the U.S. Department of Energy
has funded a few projects aimed at understanding the mechanism of subsidence
in hydrothermal systems as well as geopressureed geothermal systems. As part

45
of this effort physical properties of core samples from the Wairakei reservoir
in New Zealand, East Mesa reservoir of the Imperial Valley in California; the
Cerro Prieto geothermal system in Mexico and the Pleasant Bayou exploratory
geopressured well in Texas have been measured. Even among these, only the
East Mesa samples and the Cerro Prieto samples were subjected to elevated
temperatures and pressures. The ranges of values, as evidenced by these
studies, are as follows.
Wairakei, New Zealand: The producing formation at Wairakei is the Waiora
Formation, which is a volcanic tuff. This is overlain by the Huka Falls
Formation, a mudstone of lacustrine origin which in turn is overlain by the
Pumice zone. Both permeability and mechanical properties of cores from these
formations were measured at room temperature by Hendrickson (1976). The
effective porosities of the aforesaid formations were as follows: Waiora,
35.6 to 41.6 percent, Huka Falls, 39 to 41 percent and Pumice, 48.8 percent.
The permeability of the Waiora Formation was found to be in the
micro-darcy range and was found to be distinctly sensitive to effective
stress. In the effective stress range of 5 to 15 MPa, absolute permeability
of the Waiora was found to decrease from 50 microdarcies (4.93x1o-17m2) to
about 10 microdarcies (9.86xlo-18m2). On unloading, the permeability was
distinctly lower than it was during loading. A sample of the Huka Falls
formation indicated a permeability of 63 microdarcies (6.22x1o-17m2).
The bulk compressibility of the Waiora formation was found to vary from
3.5xlo-10 to 2.44x1o-9Pa-1, with compressiblity decreasing with
increasing confining pressure. The compressibility of Huka Falls mudstone
varied from 4.5xlo-10 to 1.2x10⁻⁹Pa The Pumice was found to be far
more compressible than the other two rock types with compressibility varying

46
-9 -8 from 3.45x10 to 3.13x10 Pa The Waiora rock indicated a linear
thermal expansion of 8.2x10⁻⁶m/moK and specific heat of about 0.18 cal/g°C.
Recently, Schatz (1982)
studied the physical properties of cores from East Mesa and from Cerro Prieto
under elevated conditions of temperature and pressure and in the presence of
fluids similar in chemical composition to the reservoir fluids. In addition,
permeability and compressibility, Schatz also studied the creep behavior of
the samples under elevated temperatures and pressures.
The observations, in regard to mechanical properties, are summarized in
Tables 1 and 2. In all the tests, the samples were first carefully subjected
to confining pressures and pore fluid pressures expected at the appropriate
depth in the reservoir. Following this, the confining pressure was maintained
constant and the pore pressure was dropped by 6.9MPa (1000 psi) to simulated
pressure drop due to fluid production. The accompanying instantaneous strains
were then measured. The compressibilities given in Tables 1 and 2 are the
ratios of observed strains to the change in pore pressure. Both the East Mesa
samples and the Cerro Prieto samples clearly exhibited increased deformation,
when loaded beyond the preconsolidation stress level. The rebound
compressibility varied between 50 to 75 percent of the virgin
compressibility. Porosities of the rocks varied between 15 and 20 percent,
these being functions of lithology as well as depth. The ranges in the
compressibilities of rocks from both reservoirs are remarkably similar,
varying between 6x10~11 to 3x1o-10 Pa-1, depending on lithology and
conditions of testing. The uniaxial compressibility is generally higher than
the corresponding isotropic case.
In order to verify the assumption of the Terzaghi effective stress
concept, Schatz also conducted tests in which the confining pressure was

47
increased by 6.9 MPa (1000 psi) rather than dropping the pore pressure by that
amount, after attaining simulated reservoir conditions. He found that within
statistical limits the strains observed in either case were approximately
equal, suggesting that the concept of effective stress is indeed useful for
geothermal reservoirs.
Considering the fact that hydrothermal systems are very active physically
and chemically, one should expect that the deformation of the system to any
imposed load would require time to equilibrate. Thus, compaction due to creep
or, in other words, the dependence of strains on time at constant loads could
be very important. Schatz (1982) addressed this issue experimentally as well
as theoretically using cores from East Mesa and Cerro Prieto. He also
monitored the chemical composition of the waters expelled during the creep
tests to decipher the physico-chemical mechanisms accompanying creep.
The duration of the creep experiments varied from about a day to a maximum
of about 9 days. The average long-term creep rate (over 4 days or more) was
of the order of lxl0-9sec-1 for East Mesa and 0.3xlo-9sec for Cerro
Prieto. Because of experimental considerations, longer term creep tests were
not feasible. The results suggest that creep rate tended to decrease with
increasing grain size and decrease with decreasing porosity. Under elevated
temperatures and pressures, pressure solution effects exert significant
influence in creep. As a result, less altered materials which are not yet
fully in equilibrium with existing physico~chemical conditions are likely to
creep more than already hydrothermally altered materials. For the 6.9 MPa
(1,000 psi) pore pressure reduction imposed in the experiments the observed
instantaneous compressibility was about 1.5xlo-10Pa-1 (lxl0-6 psi~l)
for the East Mesa and Cerro Prieto rocks. Schatz (1982) estimates that
assuming a long-term creep rate of lxl0-9sec , the bulk strain could

48
increase by a factor of two in a day and by a factor of ten in about three
months over that suggested by the instantaneous value.
During the creep tests, permeability measurements were also made on the
Cerro Prieto cores. The permeability at room temperature varied from 0.5 to
14.5 millidarcies (4.9x1o~16 to 1.4x10~14m2 ) with an average of about 4
millidarcies (4xlo~15m2 ). Measured data indicate that temperature
increase from room temperature to 150°C as well as creep cause permeability to
change by a statistically significant 40 percent. However, permeability
~eduction merely due to pore pressure reduction was not significant. There is
a possibility that pressure solution accompanying creep could selectively
close throats connecting individual pores, thereby leading to permeability
reduction.
In regard to permeability values it must be emphasized that effective
field permeabilities in the field are likely to be larger due to the presence
of interconnected macroscopic fractures and lithology changes, too large to be
manifest in the small cores tested in the laboratory.
Pleasant Bayou, Texas: The U.S. Department of Energy has drilled two
exploratory wells at Pleasant Bayou, Brazoria County, Texas. These wells
reached down to a depth of 4775 meters. Core samples from these wells have
been studied by Gray et al. (1979) in respect of instantaneous compressiblity
and permeability and by Thomson et al. (1979) for creep behavior. All these
studies have been carried out under room temperatures. Little is known about
the possible mechanical behavior of these materials under the observed
reservoir temperatures of about 160@C (320°F).
Data from 25 different depth intervals between 4478 and 4775 m indicate
bulk compressibilities with pore pressure set up to atmosphereic varied from
4.4xlo-11 to 5.1x1o-10Pa~l (0.3xl0~6 to 3.5xl0-6 psi~ 1 ). Under

conditions of elevated pore pressures, however, bulk compressibilities were
somewhat lower, varying from 2.9xlo- 11 to 3.6xlo- 10Pa-l (0.2xlo-6 to
-6 .-1) 2.5xl0 ps1 • Gray et al. (1979) take this to be definitely indicative that
the compressibility of grains cannot be ignored. The uniaxial compressibility
-11 -10 -1 ( -6 for these samples varied from 5.lxl0 to 2.2xl0 Pa 0.35xl0 to
1.5xl0-6psi- 1) and the porosities varied from 2 to 20 percent. Gray et
al. (1979) report that all samples showed that deformation was stress-path
dependent and that the materials stiffened noticeably with increased effective
stress. Thompson et al. (1979) studied the creep behavior of some of the
Pleasant Bayou core samples by holding the stresses constant for up to a third
of a day and observing the dependence of volumetric and distortional strains
as a function of time. They found that the volumetric behavior could be
treated as that of a modified Kelvin body and that distortional behavior could
be treated as that of a Maxwell material. The implication in relation to
subsidence is that the effective long-term compressibilities will be much
larger than the instantaneous, elastic values, leading to slower pressure
declines and larger subsidence potential. The permeabilities of the
sandstones from the geopressured horizons varied from 2 to 100 millidarcies
(2xlo- 15 to lxlo- 13m2).
In summary, the compressibilities of geothermal rocks are of the order of
1.5xl0-6psi-l, which is about one-third the compressibility of water.
Non-elastic and time-dependent deformation (creep) is a rule than the
exception. There is reason to believe that pressure solution and
reprecipitation effects may be significant in controlling creep behavior of
geothermal rocks. The intergranular permeabilities of these rocks are in 1 to
100 millidarcy range and are significantly modified by temperature changes and
porosity changes. The effect of temperature on absolute permeability of
49

50
unconsolidated Ottawa silica sand was investigated by Sageev et al. (1980).
They found that up to 300°F, absolute permeability did not depend on
temperature.
DATA SYNTHESIS AND PREDICTION
The ultimate objective of geothermal subsidence analysis is to forsee the
pattern and magnitude of subsidence for a given production strategy and then
to modify production strategies suitably or prepare for alternate ameliorative
measures to minimize adverse consequencies of subsidence, Predictive models
used for this purpose vary widely in sophistication, Most of these models
have been developed in the fields of petroleum reservoir engineering and
hydrogeology. The simplest of these models is motivated by a need for
engineering solutions in the absence of even a minimum amount of required
field data. At the other extreme, highly sophisticated models have been
developed within the past decade based on detailed theoretical
considerations. Presumably, these models can make detailed predictions; but
their important data requirements far exceed our ability to collect
appropriate field data.
As already discussed under Physical Basis, the task of prediction entails
two aspects: the deformation of the reservoir and the deformation of the
overburden. Predictive algorithms could therefore be developed either
separately for each aspect or a single generalized algorithm could be
developed to handle both in a single frame work. Some of the algorithms that
have appeared in the literature under each of these categories are briefly
discussed below.
Reservoir Deformation Models
The simplest reservoir deformation models involves the direct application
of Terzaghi's one dimensional consideration theory, neglecting the effects of

thermal contraction. The key assumption here is that the reservoir is
compressed vertically over a wide area so that lateral strains are
negligible. Such an assumption is likely to be realistic in those situations
where a) pore pressures decline over a large area in a well ield involving
several production wells or b) when water drains vertically from a low
permeability high storage aquitard to the aquifer characterized by high
permeability and low storage over a large area. The assumption is likely to
be unrealistic where pressure drawdowns are highly localized and strong
spatial gradients in pressure drawdown exist. For the one-dimensional
approximation, the vertical deformation of a prism of the reservoir material
can be computed by
oH = - c He m P (22)
where oH is the change in the prism height, em is the uniaxial
compressibility, H is the prism height and op is the change in pore-fluid
pressure. The simplicity of the expression enables it to be used either for
computing the ultimate deformation where op is the ultimate pressure change or
for computing in a more general fashion, the time-dependent variation of oH in
a transient system. In situations where pore pressures may rise and fall, one
could account for non-recoverable or non-elastic compaction by using either
the normal consolidation value or the rebound value for em. Helm (1975)
used this model with success to simulate the observed subsidence history near
Pixley in the central valley of California over a 11-year period. His model
has subsequently been used by the U.S. Geological Survey to analyze land
subsidence due to groundwater withdrawal in other parts of the United States.
Helm•s approach consisted in modeling only the aquitard material as a
51

52
one~dimensional, doubly-draining column, subject to prescribed time-dependent
variations of fluid potentials at the boundaries.
The one-dimensional approximation of deformation has been used in a more
general context by other workers. Following Narasimhan (1975), Lippmann
et al. (1977) developed an algorithm in which the one-dimensional deformation
approximation is used in conjunction with a general three-dimensional field of
non-isothermal fluid flow. For computing fluid pressure changes, this
algorithm accounts for the temperature dependencies of fluid density and
viscosity and allows for variations of permeability in space or due to stress
changes. To the extent that the assumptions are appropriate, this algorithm
has the advantage of avoiding the need to solve the force balance equation.
Many numerical models have been proposed in the literature to simulate
geothermal reservoirs, neglecting a detailed consideration of pore volume
change in response to fluid withdrawal. The primary goal of these models is
to follow the evolution in time of the fluid pressure and temperature fields
(or equivalently, fluid density and internal energy fields) over the
reservoir. Among these simulators one should include the following: the
two-dimensional, areal, finite element model of Mercer et al. (1975); the
three-dimensional finite difference model of Pritchett al. (1975); the
vertically integrated, two dimensional, finite difference model of Faust and
Mercer (1979); and the three-dimensional, integrated finite difference model
of Coats (1977) and Pruess and Schroeder (1977).
Although these models do not in themselves handle matrix deformation, they
could be readily coupled with an algorithm designed to solve the
stress-strains equation. A good example of such a coupling is the work of
Garg et al. (1976) in which they coupled their finite difference heat-mass
transfer model with a two-dimensional finite element model for static
stress-strain analysis.
Of the algorithms mentioned above, those of Mercer et al. (1975) and
Lippmann et a1.(1977) are for single-phase liquid-dominated systems and the
rest are for two phase, water-steam systems.
Overburden Deformation Models
The goal of overburden deformation models is to ignore the presence of
fluid in the system and to solve the stress equilibrium equation over the
system. The solution itself may be carried out with analytical techniques or
through the use of more general numerical models.
Among the analytical techniques, two deserve special mention. One of
these is the nucleus of strains method, variants of which have been developed
by Gambolati (1972), Geertsma (1973) and others. Essentially these models
involve the superposition of the fundamental exact solution of a uniform
pressure drop within a spherical region in an isotropic, homogeneous, elastic
half space. The superposition enables the handling of irregularly shaped
regions. The second analytical approach involves the use of the more recent
Boundary Integral Equation Method approach. In this approach, the required
solution for the steady state problem is found by integrating the product of
the boundary values and the normal derivative of the appropriate Green•s
function over the surface bounding the domain of interest, using numerical
techniques.
Since the mid-1960 1 5 numerical methods, notably the finite element method,
have been successfully used to solve the problem of static equilibrium in a
loaded linear elastic continuum (Desai and Abel, 1972). Non-linear material
properties can be included in such models by an iterative process using
effective elastic modules. Pritchett et al. (1975) adapted such a model to
53

54
simulate reservoir deformation and overburden response in a geothermal
reservoir. Although not developed specifically for geothermal reservoirs,
several two- and three-dimensional finite element deformations models are
known from the soil mechanics and the rock mechanics literatures (e.g., Sinha,
1979). These could be easily applied to simulate overburden deformation in
geothermal systems, provided that sufficient data is available to characterize
the subsidence.
Coupled Reservoir-Overburden Models
The most sophisticated of all the approaches to modeling is, undoubtedly,
the fully coupled approach in which the fluid flow equation, the energy
transport equation and the force-balance equation are all simultaneously
solved over the entire region extending from the land surface down to the base
of the reservoir. Although no such model is available for geothermal systems
(nor is one apparently warranted due to lack of data), algorithms do exist for
isothermal systems in which the fluid flow equation and the force balance
equation are simultaneously solved. Perhaps the earliest such model is that
of Sandhu and Wilson (1969), which considers an elastic, fluid-saturated
medium in the light of Biot 1 s (1941, 1955) theory. A more recent example of a
fully coupled model is that of Lewis and Schrefler (1978).
Comparison of Geothermal Subsidence Models
Recently, Miller et al. (198Gb) carried out an in-depth comparison of a
set of typical models available for simulating geothermal subsidence. Their
study included reservoir models, deformation models as well as coupled
models. In addition, to comparing the conceptual contents of the models, they
also solved typical problems with different models.
One of their major conclusions is that the lack of suitable data precludes
the need for highly sophisticated, fully coupled models. Indeed, in many

cases full coupling may increase cost more than it does accuracy. Depending
on the stage of activity, exploration, drilling, testing and development,
model sophistication should be commensurate with quality of field data.
Currently available reservoir and deformation models are conceptually adequate
to handle field problems in relation to the inaccuracies introduced by lack of
data. Miller et al. (1980) found that there is a greater need to have the
algorithms in readily usable forms than to develop newer and more
sophisticated models.
Some Simulation Results
In their model calculation studies Miller et al. (1980b) applied models of
varying sophistication to simulate the observed subsidence at The Geysers in
California and at Wairakei in New Zealand.
For The Geyser simulation, they assumed the following parameters: a,
coefficient. of linear thermal expansion = l0-5ft/°C; K, bulk modulus of the
reservoir rock = 1.44xl0-8psf and a temperature versus pressure relation,
AT = 9.31 x l0-4Ap where T is in degrees C and p is in psf. At the outset,
they found that the thermal contraction at the Geysers may be over four times
as large as contraction due to decreasing pore pressure. A comparative study
of the Boundary Integral Element Method, the Nucleus of Strains Method, and
simple, back-of-the envelope type of calculations, indicated that a good match
with field observation could be obtained with any of the methods using
appropriate assumption. However, if one wanted to increase model certainty, a
major program of field investigations would be essential.
The Miller et al. simulation of Wairakei subsidence was restricted purely
to deformation modeling; fluid flow was not considered. The required
pressure-change profiles were obtained from Pritchett et al. (1978). The
methods used for simulation included one-dimensional hand calculations,
55

56
two-dimensional finite element calculations and three-dimensional nucleus of
strain calculations. Although the simulations yielded overall similarities
with several simulations, they could not match the pronounced localization of
the subsidence bowl at Wairakei. Miller et al. concluded that Wairakei
subsidence was dominated by inhomogeneity of pressure drops, strong
variabilities in the thickness of beds or pronounced variations in material
compressibility and that data was grossly inadequate to model these phenomena
accurately.
It is pertinent here to cite two recent attempts at simulating Wairakei
subsidence. Pritchett et al. {1980) have recently carried out detailed one
and two-dimensional simulations of the Wairakei geothermal field, using a
two-phase non-isothermal numerical model. In their approach, the authors
start with the premise that 90 percent of the total reservoir compaction
occurs within the permeable Waiora formation. In addition, they also assumed
that a) the Waiora formation thickens towards the region of maximum subsidence
and b) the late-time subsidence of the Waiora 1 s is about 15 times larger than
that at early times, apparently due to preconsolidation effects. Based on
their simulations they conclude that the subsidence bowl lies close to the
margin of the geothermal field and that local phenomena such as a seismic
slippage along preexisting faults control the offset location of the
s~bsidence bowl from the main production area. Based on available data and
parametric studies, Pritchett et al. (1980) feel that pore collapse cannot
adequately explain the peculiarities of Wairakei subsidence.
Narasimhan and Goyal (1979) carried out a preliminary three dimensional
analysis of a Wairakei-type idealized system to investigate whether the offset
of the subsidence bowl and the plastic deformation noticed in Wairakei could
be explained in terms of a leaky-aquifer-type situation with the Huka Falls

mudstone acting as an aquitard. By assuming variable aquitard thickness and
suitable preconsolidation stresses, they were able to show that the observed
patterns could indeed be simulated in space and time. As pointed out by
Pritchett et al., the compressibility values used by Narasimhan and Goyal were
effectively 6 to 12 times higher than what had been measured on a few core
samples from Wairakei. Although Narasimhan and Goyal did not carry out a
detailed analysis of the field data, their results did indicate that pore
collapse, in the context of heterogeneities and variation of material
compressibility does have a reasonable chance of explaining a major portion of
Wairakei subsidence. As pointed out by Pritchett et al. (1980), very little
subsurface data is available from the area of the subsidence bowl to resolve
this question satisfactorily.
CONCLUDING REMARKS
That deformations of the land surface (vertical displacements, horizontal
displacements, differential subsidence) may accompany geothermal fluid
production under favorable hychogeological and exploitation conditions is very
well documented. Such deformations are induced by volume changes in the
geothermal reservoir caused by depletion of fluid storage as well as thermal
contraction. Conceptual models do exist at the present time to explain the
phenomena that are involved in the subsidence mechanisms. Compared to our
ability to collect field data to characterize the subsidence history as well
as the geologic system itself with adequate resolution, our conceptual models
are exceedingly sophisticated. Even with the present technological
revolution, the cost of collecting imput data to do justice to the resolution
of sophisticated mathematical models appears to be excessive. It is also
doubtful whether certain kinds of data such as the depth-wise change of
57

58
stresses and horizontal displacements within the geologic system will ever
become available in sufficient detail in the near future.
Under the circumstances, the best course of action appears to be to
establish an adequate surface and subsurface, deformation monitoring system,
so that measurements are made continuously as the system evolves in time from
the exploration through the exploitation phase. There is a need to develop
improved, economic measuring devices to measure deformations, especially as a
function of depth. Without this valuable data, most of our sophisticated
mathematical models will be practically useless, since they can never be
validated in a credible fashion.
Mathematical, predictive models have an important role to play. During
the early stages of development, when data is scarce, simple models can be
used to predict a range of consequences and help decide whether a particular
field could be developed in environmentally and economically acceptable
fashion. Models should grow with a field as the field evolves in time and
more and more data are accumulated. The status of modeling at present is such
that even with adequate data-base, only short-term predictions (over a period
of a few years) can be attempted.
ACKNOWLEDGEMENTS
We are grateful to Donald R. Coates, D. C. Helm and M. J. Lippmann for
their critical review of the manuscript and constructive criticisms. Their
suggestions have greatly helped in improving the presentation. This work was
supported by the Assistant Secretary for Conservation and Renewable Energy,
Office of Renewable Technology, Division of Hydrothermal and Hydropower
Technologies, the U.S. Department of Energy under Contract No.
DE-AC03-76SF00098.

REFERENCES
Albores, L. A., Reyes, C. A., Brune, J. N., Gonzalez, J., Garcilazo,G. L.
and Suarez, F., 1980, ~~seismic studies in the Region of the Cerro Prieto
Field 11 l!l Proceedings, First Symposium on the Cerro Prieto Geothermal
Field, Baja California, Mexico, September 1978, Report No. LBL-7098,
Lawrence Berkeley Laboratory, Berkeley, California, p. 227-238.
Alonso, E., Dominguez, H. B., Lippmann, M. J., Molinar, R., Schroeder, R. E.
and Witherspoon, P. A., 1979, 11 Update of Reservoir Engineering Activities
at Cerro Prieto, 11 .ill Proceeding Fifth Workshop, Geothermal Reservoir
Engineering, Stanford University, DEC-12-14, 1979, SGP-TR-40, p. 247-256.
Atkinson, P., Barelli, A., Grigham, W., Celati, R., Manetti, G., Miller, F.,
Neri, G, and Ramey, H. Jr., 1977, 11Well Testing in Travale-Radicondoli
Field: l!l Proceedings, ENEL-ERDA Workshop, Larderello, Italy,n September
12-16, 1977, p. 1-75.
Atkinson, P., Miller, F. G., Marcocini, R., Neri, G. and Celati, R., 1978,
11 Analysis of reservoir pressure and decline curves in Serrazzano,
Larderello Geothermal Field," Geothermics, v. 7, p. 133-144.
Bebout, D. G., Loucks, R. G. and Gregory, A. R., 1978, "Geopressured geothermal
fairway evaluation and test well site location, Frio Formation, Texas Gulf
Coast," Bureau of Economic Geology, University of Texas, Report No.
OR0/4891-4.
Biot, M. A., 1941, "General theory of three dimensional consolidation, 11
Jour. Appl. Phys., v. 12, p. 15 164.
Biot, M.A., 1955, "Theory of elasticity and consolidation for a porous
anisotropic solid," Jour. Appl. Phys., v. 26, p. 182-185.
Bishop, A. W., 1955, "The principle of effective stress," Tek. Ukleblad,
No. 39, Oslo, Norway.
59

60
Bixley, P. F. and Grant, M.A., 1979, "Reinjection testing at Broadlands,"
Proceedings, Fifth Workshop, Geothermal Reservoir Engineering, Stanford
University, December 12-14, 1979, SGP-TR-40, p. 41-47.
Boldizsar, T., 1970, "Geothermal energy production from porous sediments in
Hungary," Proceedings, United Nations Symposium on the Development and
Utilization of Geothermal Resources, Pisa, v. 2, p. 99-109.
Browne, P.R.L., 1970, 11 Hydrotherma1 alteration as an aid in investigating
geothermal fields," Proceedings, United Nations Symposium on the
Development and Use of Geothermal Resources, Pisa, 1970, v. 2, p. 564-570.
Celati, R., Squarci, P, Stefani, G. C. and Taffi, L., 1975, "Analysis of water
levels and reservoir pressure measurements in geothermal wells,"
Proceedings, Second United Nations Symposium on the Development and Use of
Geothermal Resources, San Francisco, v. 3, p. 1583-1590.
Celati, R., Squarci, P., Stefani, G. C. and Taffi, L., 1977, 11 Study of water
levels in Larderello Region geothermal wells for reconstruction of
reservoir pressure trend, 11 Geothermics, v. 6, p. 183-198.
Ceron, P., DiMario, P. and Leardini, T., 1975, "Progress report on geothermal
development in Italy from 1979 to 1974 and future prospects, 11 Proceedings,
Second United Nations Symposium on the Development and Use of Geothermal
Resources, San Francisco, v. 1, p. 59-66.
Coats, K. H., 1977, "Geothermal Reservoir Modeling, 11 Paper No. SPE. 6892, 52nd
Annual Meeting, Soc. Pet. Eng. AIME, Denver, Colorado.
Defferding, L. J. and Walter, R. A., 1978, "Disposal of ligand effluents from
geothermal installations,~~ Transactions, Geothermal Resources Council,
v. 2, sec. l, p. 141-143.
Desai, C. S. and J. F. Abel, 1972, 11 Introduction to the Finite Element Method,"
Von Nostrand Reinhold Company, New York.

DiPippo, R., 1980, 11 Geotherma1 energy as a source of electricity,n Super
intendent of Documents, U.S. Government Printing Office, Washington, D.C.
20402, Stock Number 061-000-00390-8, 370 p.
ENEL, 1976, 11 Geothermoelectric power plants of Larderello and Monte Amiata,
electric power from endogenous steam,n Serie Grandi Impianti ENEL 3,
Publishing and Public Relations Office of ENEL, Italy.
Evison, F. F., Robinson, R. and Arabosz, W. J., 1976, 11 Micro-earthquakes,
geothermal activity and structure, Central North Island, New Zealand, 11
New Zealand Jour. Geol. and Geophysics, v. 19, p. 625-637.
Faust, C. R. and Mercer, J. W., 1979, 11 Geothermal reservoir simulation II:
numerical solution techniques for liquid- and vapor-dominated hydrothermal
systems,n Water Resources Res., v. 15, p. 31-46.
Fredlund, D. and N. R. Morgenstern, 1976, 11 Constitutive relations for volume
change in unsaturated soils,n Canad. Geotech. Jour., v. 13, p. 261-276.
Gambolati, G., 1972, 11 A three dimensional model to compute land subsidence, 11
Bull. Intl. Assn. Hydrological Sci., v. 17, p. 219-227.
Garcia, G., 1980, 11 Geodetic control, first order leveling in the Cerro Prieto
geothermal zone, Mexicali, Baja California,~~ Proceedings, Second Symposium
on Cerro Prieto Geothermal Field, Baja, California, Mexico, Comision
Federal de Electridad, Mexicali, Mexico, p. 274-293.
Garg, S. K. and Nur, A •• 1973, 11 Effective stress laws for fluid saturated
porous rocks, 11 Jour. Geophys. Res., v. 78, p. 5911-5921.
Garg, S. K., Pritchett, J. W. and Brownell, D. H., 1975, 11 Transport of mass
and energy in porous media, 11 Proceedings, Second United Nations Symposium
on the Development and Use of Geothermal Resources, San Francisco, v. 3,
p. 1651-1656.
61

62
Garg, S. K., Pritchett, J. W., Rice, L. F. and Brownell, D. H. Jr., 1976,
11 Study of the geothermal production and subsidence history of the Wairakei
Field, 11 Proceedings, 17th U.S. Symposium on Rock Mechanics, p. 3831-3835.
Garrison, L. W., 1972, 11 Geothermal steam in the Geysers in the Clear Lake
Region, California, 11 Geol. Soc. Amer. Bull., v. 83, n. 5.
Geertsma, J., 1973, 11 Land subsidence above compacting oil and gas reservoirs, 11
Jour. Petroleum Tech., v. 25, p. 734-744.
Goff, F. E., Donnelly, J. M., Thomson, J. M. and Hearn, B. C. Jr., 1977,
"Geothermal prospecting in the Geysers-Clear Lake Area, Northern
California,~~ Geology, v. 5, p. 509-515.
Golder Associates, 1980, 11 Simulating geothermal subsidence, comparison report
No. 1.," Physical Processes of Compaction, Report No. LBL-10794, Lawrence
Berkeley Laboratory, Berkeley, California.
Goyal, K. P., Miller, C. W., Lippmann, M. J., and Vander Haar, S. P., 1981,
11 Analysis of Cerro Prieto production data," Proceedings, Third Symposium
on the Cerro Prieto Geothermal Field, Baja California, Mexico, Report
No. LBL-11967, Lawrence Berkeley Laboratory, Berkeley, California, p.
496-500.
Grange, L. I., 1937, "The geology of the Rotorua-Taupa Subdivision, Rotorua and
Kaimanawa Divisions,~~ Bulletin 37, Department of Scientific and Industrial
Research, New Zealand.
Grant, M.A., 1977, 11 Broadlands--a gas-dominated geothermal field, 11
Geothermics, v. 6, p. 9-29.
Grant, U.S., 1954, 11 Subsidence of the Wilmington Oil Field, California,~~ .1!!,
R. H. Jahns, eds., Geology of Southern California, California Dept. Nat.
Res. Div. Mines Bull. 170, 700 p.

Gray, K. E., Jogi, P. N., Morita, N. and Thompson, T. W., 1979, 11 The
deformation behavior of rocks from the Pleasant Bayou wells," Proceedings,
Fourth U.S. Gulf Coast Geopressure Geothermal Energy Conference, M.H.
Dorfman and W.L. Fisher, eds., Center for Energy Studies, The University
of Texas, p. 1031-1059.
Grimsrud, G. P., Turner, B. L. and Frame, P. H., 1978, "Areas of ground
subsidence due to geofluid withdrawal," Report No. LBL-8618, Lawrence
Berkeley Laboratory, Berkeley, California.
Grindley, G. W., 1965, "The Geology, structure, exploitation of the Wairakei
Field, Taupo, New Zealand," New Zealand Geol. Surv. Bull., v. 75, p. 131.
Grindley, G. W., 1970, "Subsurface structures and relations to steam
productions in the Broadlands Geothermal Field, New Zealand, 11 Proceedings,
United Nations Symposium on the Development and Use of Geothermal
Resources, Pisa, v. 2, p. 248-261.
Grindley, G. W. and Browne, P.R.L., 1975, 11 Structural and hydrological factors
controlling the permeabilities of some hot-water geothermal fields,"
Proceedings, Second United Nations Symposium on the Development and Use of
Geothermal Resources, San Francisco, v. 1, p. 377-386.
Gustavson, T. c. and Kreitler, C. W., 1976, 11 Geothermal resources of the Texas
Gulf Coast: environmental concerns arising from the production and
disposal of geothermal waters, 11 Circular No. 76-7, Bureau of Economic
Geology, University of Texas.
Hatton, J. W., 1970, "Ground subsidence of a geothermal field during
exploitation,~~ Proceedings, United Nations Symposium on the Development
and Use of Geothermal Resources, Pisa, v. 2, p. 1294=1296.
63

64
Healy, J., 1965, "Geology of the Wairakei Geothermal Field," Proceedings Eighth
Commonwealth Mining and Metallurgical Congress, Australia and New Zealand,
New Zealand Section.
Helm, D. C., 1975, "One Dimensional simulation of aquifer system compaction
near Pixley, California, 1. constant parameters," Water Resources Res.,
v. 11, p. 465-478.
Helm, D. C., 1982, "Conceptual Aspects of Subsidence Due to Fluid Withdrawal,"
in T. N. Narasimham, ed., Recent Trends in Hydrogeology, Special Paper
189, Geological Society of America, p. 103-142.
Hendrickson, R. R., 1976, Tests on cores from the Wairakei Geothermal Project,
Wairakei, New Zealand," Report No. TR75-63, Terratek, Salt Lake City,
Utah, 58 p.
Hitchcock, G. W., and Bixley, P. F., 1975, "Observations of the effect of the
three-year shutdown at Broadlands Geothermal Field, New Zealand, 11
Proceedings, Second United Nations Symposium on the Development and Use of
Geothermal Resources, San Francisco, v. 3, 1657-1661.
Hochstein, M. P. and Hunt, T. M., 1970, 11 Seismic, gravity and magnetic studies,
Broadlands Geothermal Field, New Zealand, 11 United Nations Symposium on the
Development and Use of Geothermal Resources, Pisa, v. 2, p. 333-346.
Holzer, T. L., 1981, 11 Preconsolidation stress of aquifer systems in areas of
induced land subsidence, 11 Water Resources Res., v. 17, p. 693-704.
Jones, P. H., 1969, 10 Hydrodynamics of geopressure in the Northern Gulf and
Mexico Basin, 10 Jour. Petroleum Tech., v. 21, p. 803-810.
Jones, P.H., 1970, 11 Geothermal resources of the Northern Gulf of Mexico basin, 11
Proceedings, First United Nations Symposium on the Development and Use of
Geothermal Resources, Pisa, v. 2, p. 14-26.

65
Jones, P. H., 1975, "Geothermal and hydrodynamic regimes in the Northern Gulf
of Mexico basin," Proceedings, Second United Nations Symposium on the
Development and Use of Geothermal Resources, San Francisco, v. 1,
p. 429-440.
Kruger, P. and Otte, C., 1976, 11 Geothermal energy-resources production,
stimulation," Stanford University Press, Stanford, 360 p ••
Lewis, R. W. and Schrefler, B. A., 1978, "A fully coupled consolidation model
of the subsidence of Venice, 11 Water Resources Res.; v. 14, p. 223-230.
Lipman, S. C., Strobel, C. J. and Gulati, M. S., 1977, "Reservoir performance
of the Geysers Field," Presented at the Larderello Workshop on Geothermal
Assessment, Larderello, Italy.
Lippmann, M. J., and Goyal, K. P., 1980, 11 Numerical modeling studies of the
Cerro Prieto Reservoir, 11 Proceedings, Second Symposium on the Cerro Prieto
Field, Baja California, Mexico, Comision Federal de Electricidad,
Mexicali, Mexico, p. 497-507.
Lippmann, M.J and Man6n, A., 1980, 11Minutes of the Cerro Prieto
Internal DOE/CFE Workshop," Vallombrosa Center, Menlo Park, CA.
Lippmann, M. J., Narasimhan, T. N. and Witherspoon, P. A., 1977, 11 Numerical
simulation of reservoir compaction in liquid-dominated geothermal
systems, 11 Proceedings, International Association of Hydrological Sciences,
pub. No. 121, p. 179=189.
Lofgren, B. E., 1978, 11Monitoring crustal deformation in The Geysers-Clear Lake
Geothermal Area, California,~~ U.S. Geological Survey, Open File Report
78-597.
Lofgren, B. E., 1979, 11Measured crustal deformation in the Imperial Valley,
California,~~~ Proceedings, First Symposium on the Cerro Prieto
Geothermal Field, Baja California, Mexico, September 1978, Report No.
7098, Lawrence Berkeley Laboratory, Berkeley, California, p. 141-145.

66
Macdonald, W.J.P., 1975, 11 The useful heat contained in the Broadlands
Geothermal Field, 11 Proceedings, Second United Nations Symposium on the
Development and Use of Geothermal Resources, San Francisco, v. 2,
p. 1113-1119.
Majer, E. L. and McEvilly, T. V., 1979, 11 Seismological investigations at the
Geysers Geothermal Field," Geophysics, v. 44, p. 246-269.
Majer, E. L., McEvilly, T. V., Albores, L.A. and Diaz., S., 1979,
"Seismological studies at Cerro Prieto, 11 l!l. Proceedings, First Symposium
on the Cerro Prieto Geothermal Field, Baja California, Mexico, September
1978, Report No. 7098, Lawrence Berkeley Laboratory, Berkeley, California,
p. 239-249.
Marks, S. M., Ludwin, R. S., Louie, K. B. and Bufe, C. G., 1979, "Seismic
monitoring at the Geysers Geothermal Field, California,~~ U.S. Geological
Survey, Open File Report No. 78-798.
Massey, B. L., 1980, 11 Measured crustal strain, Cerro Prieto Geothermal Field,
Baja California, Mexico, 11 l!l. Proceedings, Second Symposium on the Cerro
Prieto Geothermal Field, Baja California, October 1979, Report No. 7098,
Lawrence Berkeley Laboratory, Berkeley, California, p. 294-298.
Mercado, G. S., 1975, "Movement of geothermal fluids and temperature
distributions in the Cerro Prieto Geothermal Field, Baja California,
Mexico, 11 Proceedings, Second United Nations Symposium on the Development
and Use of Geothermal Resources, v. 1, p. 487=494.
Mercer, J. W. and Faust, C. R., 1979, 11 Geothermal resource simulation:
application of liquid and vapor dominated hydrothermal modeling techniques
to Wairakei, New Zealand," Water Resources Res., v. 15, p. 653-671.
Mercer, J. W., Pinder, G. F. and Donaldson, I. G., 1975, "A Galerkin-Finite
Element analysis of the hydrothermal system at Wairakei, New Zealand, 11
Journ. Geophys. Res., v. 80, p. 2608-2621.

67
Miller, I., Dershowitz, W., Jones, K., Meyer, L., Roman, K. and Schauer, M.,
1980a, "Simulation of geothermal subsidence," Report No. LBL-10794,
Lawrence Berkeley Laboratory, Berkeley, California, 160 p.
Miller, I., Dershowitz, W., Jones, K., Myer, L., Roman, K. and Schauer, M.,
1980b, "Case study data base," Comparison Report No. 3, Report No.
LBL-10794, Lawrence Berkeley Laboratory, Berkeley, California.
Ministry of Works and Development, 1977, 11 Broadlands Geothermal Field
Investigation Report, 11 Compiled by the Office of the Chief Power Engineer.
Mongelli, F. and Laddo, M., 1975, 11 Regional heat flow and geothermal fields in
Italy, 11 Proceedings, Second United Nations Symposium on the Development
and Use of Geothermal Resources, San Francisco, v. 1, p. 495-498.
Muffler, L.J.P. and White, D. E., 1972, 11 Geothermal Energy, 11 The Science
Teacher, v. 39, p. 40-43.
Narasimhan, T. N., 1975, 11 A unified numerical model for saturated-unsaturated
ground water flow," Ph.D. Dissertation, Department of Civil Engineering,
University of California, Berkeley.
Narasimhan, T. N. and Goyal, K. P •• 1979, 11 A preliminary simulation of land
subsidence at the Wairakei Geothermal Field in New Zealand, 11 Report No.
LBL-10299, Lawrence Berkeley Laboratory, Berkeley, California, 1979.
Narasimhan, T. N. and Witherspoon, P. A., 1978, 11 Numerical model for saturated
unsaturated flow in deformable porous media, Part 3, Applications, 11 Water
Resources Res., v. 14, p. 1017-1034.
Nelson, D. V. and Hunsbedt, A., 1979, 11 Progress in studies of energy extraction
from geothermal reservoir, 11 .:!!:!. Proceedings, Fifth Workshop, Geothermal
Reservoir Engineering, December 12-14, 1979, Stanford University,
SGP-TR-40, p. 317-325.

68
Noble, J. E. and Vander Haar, S. P., 1980, "Evaluation of secondary dissolution
porosity in the Cerro Prieto geothermal reservoir,~~ 55th Technical
Conference, Soc. Petroleum Engineers, AIME, Sept 21-24, Dallas, Texas,
Abstract.
Nur, A., and Byerlee, J. 0., 1971, 11 An exact effective stress law for elastic
deformation of rock with fluids,u Jour. Geophys. Res., v. 76, p. 6414-6420.
0 1 Rourke, J. E. and Ranson, B. B., 1979, 11 Instruments for subsurface monitoring
of geothermal subsidence," Report No. LBL-8616, Lawrence Berkeley
Laboratory, Berkel , California.
Petracca, C. and Squarci, P., 1975, 11 Hydrologica1 balance of Larderello
geothermal region, 11 Proceedings, Second United Nations Symposium on the
Development and Use of Geothermal Resources, San Francisco, v. l,
p. 521-530.
Pinder, G. F., 1979, 11 State of the art review of geothermal reservoir
modeling,u Report No. LBL-9093, Lawrence Berkeley Laboratory, Berkeley,
California.
Popov, E P., 1968, Introduction to Mechanics of Solids, Prentice Hall, Inc.
Pritchett, J. W., Rice, L. F. and Garg, S. K., 1978, 11 Reservoir engineering
data: Wairakei Geothermal Field, New Zealand,~~ v. 1, Report No.
SSS-R-78-3597-1, Systems, Science and Software, La Jolla, California.
Pritchett, J. W., Rice, L. F. and Garg, S. K., 1980 11 Reservoir simulation
Studies: Wairakei Geothermal Field, New Zealand, 11 Report No. LBL-11497,
Lawrence Berkeley Laboratory, Berkeley, California.
Pritchett, J. W., Garg, S. K., Brownell, D. H. Jr., and Levina, H. B., 1975,
11 Geohydrological Environmental Effects of Geothermal Power Production, 11
Report No. 555-R-75-2733, Systems Science and Software, La Jolla,
California.

69
Pritchett~ J. W., Garg, S. K, and Brownell, D. H. Jr., 1976, "Numerical
simulation of production and subsidence at Wairakei, New Zealand," Report
SGP-TR-20, Stanford Geothermal Program, Stanford~ California~ p. 310-323.
Pruess, K. and Schroeder, R. C., 1980, 11 SHAFT79 Users' Manual," Report No.
10861, Lawrence Berkeley Laboratory, Berkeley, California.
Risk, G. F., 1975, 11 Monitoring the boundary of the Broadlands Geothermal
Field, New Zealand," Proceedings, Second United Nations Symposium on the
Development and Use of Geothermal Resources, San Francisco, v. 2, p.
1185-1189.
Risk, G. F., Macdonald, W.J.P. and Dawson, G. B., 1970, "D. C. Resistivity
surveys of the Broadlands Geothermal Region, New Zea1and, 11 United Nations
Symposium on the Development and Utilization of Geothermal Resources,
Pisa, v. 2, p. 287-294.
Sageev, A., Gobran, B. D., Brighamn, W. E. and Ramey, H.J.J., 1980, "The effect
of temperature on the absolute permeability to distilled water of
unconsolidated sand cores," Proceedings, Sixth Workshop, Geothermal
Reservoir Engineering, Stanford University, December, 1980, Report No.
SGP-TR-50, p. 297-302.
Sandeen, W. N., and Wesselman, J. 8.,1973, "Ground water resources of Brazoria
County, Texas, 11 Report No. 163, Texas Water Development Board, 199 p.
Sandhu, R. S. and Wilson, E. L., 1969, 11 Finite element analysis of land
subsidence," Proceedings, International Association of Hydrologic
Sciences, Pub. 88, p. 383-400.
Schatz, J. F., 1982, "Physical processes of subsidence in geothermal
reservoirs," Report No. TR82-39, Terratek, Salt Lake City, Utah, 136 p.
and Lawrence Berkeley Laboratory, Report LBL-14605.
Sinha, K. P., 1979, "Displacement-discontinuity technique for analyzing stress
and displacements in steam deposits," Ph.D. Dissertation, University of
Minnesota, Minneapolis.

70
Skempton, A. W., 1961, "Effective stress in soils concrete and rocks, in Pore
Pressure and Suction in Soils," Butterworths, London, p. 4-16.
Stilwell, W. B., Hall, W. K. and Tawhai, J., 1975, "Ground movement in
New Zealand Geothermal fields," Proceedings, Second United Nations
Symposium on the Development and Use of Geothermal Resources, San
Francisco, v. 2, p. 1427-1434.
Thompson, T. W., Gray, K. E., MacDonald, R. C. and Jogi, P. N., 1979, "A
pre 1 imi nary creep analysis of rocks from the Pleasant Bayou We 11 s, 11
Proceedings, Fourth U.S. Gulf Coast Geopressured Geothermal Energy
Conference, M.H. Dorfman and W.L. Fisher, eds., Center for Energy Studies,
University of Texas, p. 1060-1080.
Viets, V. F., Vaughan, C. K. and Harding, R. c., 1979, "Environmental and
economic effects of subsidence,~~ Lawrence Berkeley Laboratory, Berkeley,
California, LBL-8615.
Wallace, R. H., Jr., 1979, 11 0istribution of geopressured-geothermal energy in
reservoir fluids of the Northern Gulf of Mexico Basin, 11 Proceedings,
Fourth United States Gulf Coast Geopressured-Geothermal Energy Conference,
M.H. Dorfman and W.L. Fisher, eds., p. 1097-1136.
Wilson, J. S.~ Shepherd, B. P. and Kaufman, S., 1974, 11 An analysis of the
potential use of geothermal energy for power generation along the Texas
Gulf Coast, 11 Dow Chemical U.S.A., Texas Division, 63 p.
Witherspoon, P. A., Neuman, S. P., Sorey, M. L. and Lippman, M. J., 1975,
11Modeling geothermal systems,~~ .J!!. Attidei Conveghi lincei, Roma, Italy,
v. 30, p. 173-221.

71
Zelwer, R. and Grannell, R. B., 1982, 11 Correlation between precision gravity
and subsidence measurements at Cerro Prieto, 11 Proceedings, Fourth
Symposium on the Cerro Prieto Geothermal Field, Baja California, Mexico,
August 10-12, 1982, To be published by the Comisi6n Federal de
Electricidad, Mexicali, Mexico.

Table l Mechanical Properties of Reservoir Rocks from the East Mesa Geothermal Reservoir, California (from Schatz 1982). "-..! (llote: In all the tests external stresses ~ere maintained constant and pore pressure discussed by N
>, Compressibility Pa-l ... I nit ia 1 Values I so tropic
.<:: "' l'llea11 Deviator Pore Rodt ... 01>0 Effective Stress Pressure llormal 0.:£ ... Type ... 0 Test Stress, Hl'a HI' a Hi' a Compaction Rebound lllliaxial c "'-
19.3 Isotropic 13.31 0 9.5 6.9 1.6x1Q-l0 l.Odo-lo 150 Compress loo
>, 2.sx1o-10 l.lido-10 "' 20.0 Isotropic 10.7 3.8 9.5 6.9 150 ...
'-" Compress loo ... "'"' 0 ·~ 0 ..... a ... .,. 0
'-" .... ~
19.1 Isotropic 8.2 7.6 9.5 6.9 3.0x1Q-l0 2.0x1Q-l0 150 -av; "'
Compress loo :;;:
17.1 IJniaxhl 10.6 3.8 9.5 6.9 4.-'hlo-lo 150
18.5 Isotropic 22.8 0 15.9 6.9 1 .Jxlo-n 5.8xw-U 150 Compress ioo
"0 19.9 Isotropic 18.4 6.5 15.9 6.9 2 .2x1o-10 1.2x1o-10 HiO "'"' Compress ion "'"' ·~ 0
'"" ...... '-"' .... '-"""' '"" '"'
~
20.3 Isotropic 14 l3 15.9 6.9 3.4xlO-lO 2.3do-lo 150 .,., "'"' Compress ioo ...
19.!1 Uniaxial 18.4 6.5 15.!1 6.9 l.Jxto-lo 150
16.9 Isotropic 29.3 0 20.1 6.9 L2do-lO !lxlQ-11 150 Compress ioo
-o
"' 15 Isotropic 23.8 8.1! 20.1 6.!1 1.ox1o-10 7.3xto-H 150 " "'"' Compress io11 s...s:: <!>O 0..,
0
"'"' "'"' 00
15.2 Isotropic 18.2 1 .Sxlo-10 s.7xlo-n ·~"' c;:; 16.8 20.1 6.9 150 ........ Compress ioo "' c "' >
15.9 Uniaxial 23.8 1!.4 20.1 6.9 l.ld0-10 150

Table 2 Mechanical Properties of Rocks from the Cerro Prieto Geothermal Reservoir. Mexico Schatz. {Note: In all the tests external stresses were maintained constant and pore pressure discussed .
:t:? Compressibility Pa-l
Initial Values Isotropic .&::
..... Type Mean Oev iator Pore "' Rock +" 0~ of Effect he Stress Pressure Normal D.:E I.. ~IP Type IU 0 Test Stress. Ml'a Mil' a Mil' a Mil' a Rebound Uniaxial Q Q..
18.9 Isotroph: 26.5 0 21.4 6.9 S.?xl0-11 7 150 "0 Compress ion lUlU cc
..... 0 ..,.., ...., ~... .... .- 18.96 Isotropic 15.9 15.9 21.4 6.9 1 1 .J:do-11 150 ~ ... ;;:; I.- Compress i<m w· .... .,.., I..
"' 0 u 13.4 Uniaxial 15.9 15.9 21.4 6.9 l 150
19.6 I sotrop1c 21.2 0 22.1 6.9 1.2x1o-10 6do-11 150 "0 Compression lUlU cc
..... 0 ..,.., ...., !...VI I' 19.4 Isotropic 16.2 16.4 22.1 6.9 l.Jxto-10 1 150 ~"0 ,.... i c N ion WI!! CVl .,....
lA-
20.4 Uniaxial 16.2 16.4 22.1 6.9 150
"0 19.6 Isotropic 30.4 6.9 8.7xl0-ll 4.4xlO-ll 150 w 0 24.8 c ..... Compress ion
<OW LC ~0
19.3 Isotropic 18.1 18.4 24.8 6.9 7.3xlo-n 150 i +" 0 4. Will ¢ c-o ¢ Compression ..... I: N
IA-<0 Vl
t' 19.3 Uniaxial Hl.l 1.2xlQ-lO w 18.4 24.8 6.9 150 >
'-I w

74
Figure 1. Location of the Wairakei geothermal field (from Mercer et al.,
1975).
Figure 2. Vertical displacements due to geothermal fluid withdrawal at
Wairakei, New Zealand, 1964~1975 (from Stillwell et al., 1975).
Figure 3. Horizontal displacements due to geothermal fluid withdrawal at
Wairakei, New Zealand, 1964~1975 (after Stillwell et al., 1975).
Figure 4. Relation between reservoir pressure drop and subsidence at
Wairakei, New Zealand (from Pritchett et al., 1976).
Figure 5. Locations of wells and resistivity boundary at the geothermal field
at Broadlands, New Zealand.
Figure 6. Subsidence at the Broadlands geothermal field between May 1968 and
March 1974. Contour values are in mm. (from Ministry of Works and
Development, 1977).
Figure 7. Relation between reservoir pressure drop and subsidence at
Broadlands, New Zealand, 1969-1973.
Figure 8. Observed horizontal displacements at the Broadlands geothermal
field, New Zealand, 1968-1974 (from Stilwell et al., 1975).
Figure 9. Location of the Cerro Prieto geothermal field, Mexico.
Figure 10. Location of major faults and wells, Cerro Prieto geothermal field,
Mexico (from Lippmann and Manon, 1980).
Figure 11. The Geysers geothermal field, Lake County, California.
Figure 12. Vertical displacement field, 1973 to 1977, The Geysers,
California. Circles denote areas of steam production supporting
the power plant at the center (from Grimsrud et al., 1978).
Figure 13. Vertical displacements along section A-A', the Geyser area,
California relative to 1973 (from Lofgren, 1978).
Figure 14. Profiles of reservoir pressure drop and subsidence along section
AA" of Figure 12, The Geyser area, California (from Lofgren, 1978).

Figure 15. Location map of the Larderello geothermal field, Italy (from
Atkinson et al., 1977).
Figure 16. Geologic map and cross section of the Larderello geothermal field
(from ENEL, 1976).
Figure 17. Production history of well 85 and the Fabiani well, Larderello,
Italy (from ENEL, 1976).
Figure 18. Spatial pressure distribution, Serrazano area, Larderello, Italy
during 1970. Contour values are in kg/cm2 (from Celati et al.,
1976).
Figure 19. Location and depth of occurrence of the geopressured zone in the
northern Gulf of Mexico basin (from Wallace, 1979).
Figure 20. Chocolate Bayou location map (from Grimsrud et al., 1978).
Figure 21. History of fluid production and injection, Chocolate Bayou Area,
Texas (from Grimsrud et al., 1978).
Figure 22. subsurface fluid pressure gradients from wells in the Austin Bayou
area, 8 km SW of Chocolate Bayou area (from Bebout et al., 1978).
Figure 23. Vertical displacements individual bench marks in the Chocolate
Bayou area (from Grimsrud et al., 1978).
75

76
0 10 20 km
N
Rotorua 0
Woiotapu 0
Korako
Broadlands 0
White Island
XBL 7912-13630
Figure 1. Location of the Wairakei geothermal field (from Mercer et a1.,
1975).

500
N
Area mum discharge/.,...--====--- - ..... .... / ,.....- ____ -- ...... '
~ I / - ........ _ -, ', I ?/?; -- ' ...-- e I ~<>; ....... ',"
o Geot her mol bores
0 500 1000 Meters
\
' \ \ I
contours (meters)
XBL7911-13203
Figure 2. ical displacements due geothermal fluid 1 at
rakei, Zeal , 1964-1975 (from Still 1 et al.~ 1975).
"--.! "--.!

I.
·~~ -(}'\ /-
~~/ ,'l;f.,o//
S"/ /
~ 0 200 400 600 800 F3 t==":r=-::::c:..:.._::_~=r-"1
scale 0 500 1000 melers f ~3 ·- -· --3 ,
'@ RP.I.3 GS -
~
. X"~oi"" ~~\Q; ~ni.'<lo
:// ~o\o GS.4.
GS.3.0
Q ~= \. -~---
,o ·~(}
~~ XBL809- 2780
f1 3. zontal displacements to geothermal fluid at
, Zeal , 1964-1915 {after Still l et al., 1975).
'-1 00

-"" !., ~
.&:1
c. Q ..
Q
~ b :::!
"" lfl ~ b
1:1.
b -0 :;;. 1,. ~
"' <II Cil::
30
25
0.5 1.0
Wairakei. New Zealand (from Pritchett et al .• 1976)
1.5 2.0 2.5
XBL 773-8173
Figure 4. Relation between reservoir pressure drop and subsidence at
Wairakei~ New Zealand (from Pritchett et al., 1976).
79

80
460000
r
<I> 28 @
27
t N
--" " 16@> ' ,, \
\\\ \\11 Resistivity boundary
0 Scale
lkm g ........._ __ __. =
453000 = .....,
X8L 809-2779
Figure So Locations of wells and resistivity boundary at the geothermal field
at Broadlands, New Zealando

615000 N
N
614000 N
613000 N
0
< 0 a::
100 0 500 1000 1500 2000 meters '~==~======~=5
eWELL XBL 809-2783
Fi 6. Subsidence at the Broadlands geothermal field between May 1968 and
March 1974. Contour values are in mme (from Ministry of Works and
Development, 1977).
81

w '-0
8 0.. 0 '-
"'0 Q.) '-
w w
'--0 > '-
I
c
JLsept ~~9 0 5
Figure 7.
J n I
se in e rese 'r ssu shut in
to 68 ne r
I I
10 15 20 s • ' s1 e I c
L809- 82
Rel ion between reservoir pressure subsidence at
ands$ Zealand, 1969-1973.
00 N

.--
I I
I I ~~:::_j_ __
-/~ I
I I
9422
/
/ ' / ' - / ' '< /,... .....
' / ' / ' /
I
,,
/ I
I -- --
level M!HI
' ~
0 melers L_ I
0 100 300 400 mm I I ==--L - ---- ----------x-----1
Ve Scale
809-2784
figure 8. served horizontal displacements at lands geothermal
fi d~ Zealand, 1968-1974 (from Stil l al., 1 5).

84
To
Son Diego
To Tijuana
To Brawley
-------~:L·-. -~--·-· -MEXtCO Mexicoli
Yuma
To """---....,.~~~~"Son Luis R.C.
To Son Felipe
XBL 774-53 68
Figure 9. Location of the Cerro Prieto geothermal field~ Mexico.

N
250"C 600-IOOOm
/
350°C 1500-3000m
XSL 809-2785
85
Figure 10. Location of major faults and wells, Cerro Prieto geothermal field,
Mexico (from Lippmann and Manon, 1980).

86
I I
I
I I
I I
I I
~ '"'Sacramento ' ' an Franctsco
', "'
,/
I I
' Los Angeles
\ \
\ \
\ \
\ \
\
I
\
,/
I ,/
\ \
\ \
/:';, 0t.t1
wm Vapor- 1
~dominated area CJ Hot water-200 oc \ Approximate outline of
' steam production area 5km
XBL 809- 275!
Figure llo The Geysers geothermal field, Lake County, Californiae

~
,,0 'Qq 0 ,!Alii "'"!.-·
Ill s
Ill Subsidence ( 1978)
/ Inferred subsidence r, /
2 ervol is I em
pp i-20
number
A-A11 subsidence
* N
)\ ·~' 'Qo,~ ~
~~~'~~ ~ .~
~~~~
XBL809-2781
fi 12. ical displacement fi dD 1973 to 1977D The Geysers,
Ca11 ia. Circles denote areas of steam ion i
e pl at the center (from et a l., 1 ) • co "-..j

CD co
'<t '<t'<t '<t '<t'<t '<t '<t '<t '<t v I() I() I() I{) I() I() I() I() g-<) g-<) g-<)
v '<t '<t v V'<t v '<t v v v v v v v v v "' "' v "' "' N NN N NN N N NN ~ N N N N N N N N N N N - -- - -- - - - - - - - - -a: QOVI >3; 1- :;) X>- N <11 w -,I.!) u. 0 w u 1- N IJC
A I I I I II I I I I I I I I I I I I I I I I 2
Uil 0 II-Q) -
1973 Bose --I
I Q)
E --c --Q) u -4 - -c
-
- -8 Q) -
c Q) c::Jl- -c 0
..c. u -12 0 I 2
-
-14 ----- ----·-·-
X8l809- 2778
fi 13. Vertical displacements along section ~~ the Geyser area,
Cali ia rel ive 1973 ( en, 1 •

0 500 _a--2 \ I - ~E m -- ....... :::::~ E \ -- _co - \ /,.,. m -a m _SJ:!bsia // I ;::; Q) u -....., el}c: ,.. «./) > c 10 "" e ., I 4 «.n m - '~ '..:.,19;;;. / ~ -~ ~ ,ese,. ', ~- "1 I I a.. o c ' "'o. ' I -~ m m """'I r - o «.n U ~ >C - """ ~'"es ll- o «.n Soar m
..0 ........... ~ e as «./) m :::~ 20 --. - - _... m E
U) 300 0:: ----
XBL 809- 2775
fi • iles reservoir pressure subsidence al s ton
of figure 12, Geyser area, lt ta ( en, 1 ).
co lO

90
LARDERELLO SERRAZZANO ~ ·~CASTELNUOVO
SASSO• TRAVALE ~ ~
LAGO MONTEROTONDO \;::gl vmeno
Mt. Am iota ~
BAGNORE• • P!ANCASTAGNAIO
• TORRE ALFINA
r;:).o di \.s~isena
v
km
C)
Vlterbo
XB L 809 - 2798
Figure lSe Location map of the Lardere11o geothermal field~ Italy (from
Atkinson et ale, 1 )e

D Clays, sandstones, etc. Argille scagliose
f:~;;:J Macigno and polychrome shales
Tuscan Formation ~Basement Complex
X8L809-2799
Figure l6e Geologic map and cross section of the Larderello geothermal field
(from ENEL, 1976).
q: - J.

"-
' «A 4)
c
""" ... "-
31:
-lL
. I
o~~~~~~~~~~~~~~~~~~~~
I 5 r
9- 6
fi 17. Production history of well 85 e fabiani 1, larderello$
I y ( l~ 1976).
1.0 N

+
• • •
0 ikm 1::1 ::::t:=±::=i::::::il
• Wells used for contours
•
•
no l() N
• + •
XBL809- 87
Figure 18. Spatial pressure distribution, Serrazano area, Larderello, Italy
during 1970. Contour values are in kg/cm2 (from Celati et al.,
1976).
93

94
~XI>\.AII!Al'IOII!
!li~""" 011 ~~~.lii'i i!!lll:'l'li:IIS MI.OI§ ~~ !lUI 1.~
·~
' .
. • ) ' '
XBL 828-2371
Figure 19. Location and depth of occurrence of the geopressured zone in the
northern Gulf of Mexico basin (from Wallace, 1979).

95'"00'
• 0 ••••
• ~ • 0 • •
... GAL.VESTON · . ·:·:·:·:·BAY.·:·:·
" • • • • • ~ $ • •
XBL 828-2373
Figure 20. Chocolate Bayou location map (from Grimsrud et a1., 1978).
95

96
:Ill(
~
u e
120
100
80 Brine !njeciion (Phinips1 Wells)
tO 0 -
XBL 828-2374
Figure 21. History of fluid production and injection, Chocolate Bayou Area,
Texas (from Grimsrud et al., 1978).

- ~ I=
"" "" "" "" 0 011 8 0 ;;!! <0! if! ::I
~ '0 I=
""
97
" 6 • • ~ ~ •
BOTTOM MOLE IIIRESSU~E ITMOUSAHOS OF li"SIA I
XBL 828-2375
Figure 22. subsurface fluid pressure gradients from wells in the Austin Bayou
area, 8 km SW of Chocolate Bayou area (from Bebout et ale, 1978).

98
0. '52 '56 '60 164 •sa '72
02
~ 0.4 F53 CT> """"' • ~ 0.6 CT> -Q; 0.8 If Liverpool
1.0 RM2 <I) (,) N691 a3 1.2 "0 'in
P53 .0 ~ 1.4 N <I) ~ ChoccMa1e > ~ 1.6
..: Bayou M69l ~ Fi~d ~ - a; f't) ~Df't)O') en :::;, w u 1.8 1:0 ~I:OW ~ Lt.. -JO..~ ~ K691
0 50000 feet
XBL 828-2372
Figure 23. Vertical displacements individual bench marks in the Chocolate
Bayou area (from Grimsrud et al., 1978).