submitted to doi: 10.1002/ adma.201604424 article type
TRANSCRIPT
Submitted to
1
DOI: 10.1002/ adma.201604424
Article type: Communication
Exciton Diffusion Length and Charge Extraction Yield in Organic Bilayer Solar Cells
Bernhard Siegmund*, Muhammad T. Sajjad, Johannes Widmer, Debdutta Ray, Christian
Koerner, Moritz Riede, Karl Leo, Ifor D. W. Samuel*, Koen Vandewal*
B. Siegmund, Dr. J. Widmer, Dr. C. Körner, Prof. K. Leo, Prof. K. Vandewal
Dresden Integrated Center for Applied Physics and Photonic Materials (IAPP) and Institute
for Applied Physics, Technische Universität Dresden, George-Bähr-Straße 1, 01062 Dresden,
Germany
E-mail: [email protected], [email protected]
Dr. M. T. Sajjad, Prof. I. D. W. Samuel
Organic Semiconductor Centre, SUPA, School of Physics & Astronomy, North Haugh, St
Andrews, KY16 9SS, United Kingdom
E-mail: [email protected]
Prof. D. Ray
Currently: Department of Electrical Engineering, I.I.T. Madras, Chennai 600036, India
Prof. M. Riede
Currently: Clarendon Laboratory, Parks Road, Oxford OX1 3PU, United Kingdom
Keywords: exciton diffusion length, charge carrier extraction, organic photovoltaics, bilayer,
photocurrent modelling
Submitted to
2
Organic light emitting diodes (OLED), solar cells, and photo-detectors have proven their
potential to outperform their inorganic counterparts regarding flexibility, light-weight,
transparency, scalability, and fabrication costs as demonstrated by the successful comer-
cialisation of OLEDs. Hereby, all organic opto-electronic devices share a series of electrical
and optical processes mediated by a Coulombically bound electron-hole pair called an exciton.
Driven by concentration gradients, these electrically neutral quasi-particles cover an average
distance ℓd within their lifetime of typically a few nanoseconds by means of Förster or Dexter
energy transfer. The so defined exciton diffusion length is one of the critical material
parameters determining the performance of organic opto-electronics. Organic photovoltaics
and photodetectors with a blended photoactive layer[1]
benefit from a long ℓd: As the absorber
phase separation can be increased, charge recombination is reduced, resulting in an increased
operating voltage.[2]
Meanwhile, photo-sensitive devices with a planar photoactive structure
such as multilayer cascades[3]
benefit from a long ℓd resulting in enhanced short-circuit
currents as excitons generated further away from the charge dissociating heterojunction are
harvested. For OLEDs on the other hand, a short ℓd for singlet excitons is required when
containing both (efficient) phosphorescent and (stable) fluorescent emitter layers to confine
singlet excitons to the latter.[4]
In amorphous or polycrystalline organic semiconductors, the diffusion length of singlet
excitons is often 10nm or less as a result of exciton trapping.[5,6]
However, reliability and
comparability of ℓd measurements still remain an issue, even within one technique.[7-9]
For
example, for the thermally stable and chemically inert small molecule zinc phthalocyanine
(ZnPc), reported ℓd-values range over one order of magnitude (see Table S1 in the
Supplementary Information (SI)). Many of these differences can be attributed to a discrepancy
upon modelling of the photo-current, as discussed further in Section SI.1. Therefore, this
article provides a refined technique based on modelling photocurrent spectra of solar cells
Submitted to
3
comprising the material of interest. Our method gives consistent results even for rigorously
differing samples architectures and the obtained diffusion length agrees well with
complementary measurements based on photoluminescence (PL) quenching.
In contrast to PL based techniques, electrical measurements also allow to study ℓd of non-
fluorescent materials. A key advantage of our photovoltaic approach is the simultaneous
quantitative access to both the exciton diffusion length and the yield of charge extraction. To
account for potential losses during the splitting of excitons at the donor-acceptor (DA)
interface or the subsequent charge transit to the desired electrode, via recombination processes,
we introduce a charge collection yield ηc. It mediates between exciton diffusion towards the
DA-interface, leading to a generation flux of CT states φCT(ℓd) , and the extracted photo-
current density jphoto via
jphoto = e ηcφCT(ℓd) (1)
with e as elementary charge.[10]
The value of ηc is often hard to determine, both in experiment
and simulation (details in SI.2). This uncertainty affects the accuracy of ℓd when determining
it using Equation 1. On the other hand, for known exciton dynamics, steady-state or
transient[11]
measurements of jphoto seem a suitable choice to access ηc. In this study, however,
we demonstrate access to ℓd and ηc at the same time, based on easy and standardised methods,
namely measurements of photovoltaic external quantum efficiencies (EQE) and thin-film
optics. For this purpose, we utilise a simultaneous variation of the layer thickness xo and the
excitation wavelength λ in conjunction with optical simulations.
In our exemplary study of ZnPc, we build pin-type bilayer solar cells with C60 as efficient
quencher for ZnPc excitons.[12]
This allows characterising the material in an application
oriented layer sequence, as often used in organic solar cells (alternative exciton quenchers for
Submitted to
4
high band-gap absorbers are discussed in SI.3a). A first set of solar cells comprises as electron
transport layer (ETL) C60 n-doped with W2(hpp)4 (chemical nomenclatures in Experimental
Section) and as hole transport layer (HTL) BF-DPB p-doped with C60F36. As shown in Figure
1 (top), we center the maximum of the optical field in the ZnPc layer for 680nm, a wavelength
close to which ZnPc has its peak absorption (details in SI.3b). For centering, we adjust the
thickness of HTL and ETL for all ZnPc thicknesses xo by means of numerical transfer-matrix-
simulations[13]
.
As shown in Figure 2, the measured EQE maximises for a ZnPc thickness xp between 15nm
and 18nm, increasing with λ. This already indicates ℓd to be much smaller than the absorption
length which for ZnPc is above 100nm. For modelling the measured photocurrent data as
function of xo and λ, we consider the general exciton diffusion equation
(2)
where n denotes the density distribution of singlet excitons at position x in the absorber film
(here ZnPc), D the diffusion coefficient and G(x,t) the time dependent exciton generation
profile. The radiative decay rate in absence of quencher sites is kPL, whereas kFRET denotes the
rate of Förster resonance energy transfer (FRET) in presence of a neighbouring material with
equal or smaller optical gap. α quantifies the rate for exciton-exciton-annihilation.
Exciting the samples under steady-state conditions and low intensities (translating to exciton
densities far below the annihilation threshold[14]
of 1018
cm-3
) permits to apply Equation 2
with the following simplifications: ∂n/∂t=0, kPL= τo-1
=D/ℓd2, α=0 with τo as intrinsic exciton
lifetime. Considering only low energy photons (λ>635nm, see SI.3b) allows to draw exclusive
conclusions about the exciton dynamics in ZnPc, due to its smaller optical bandgap (1.5eV) in
2
2
2
nαnxkntktx,G+x
nD=
t
n
FRETPL
Submitted to
5
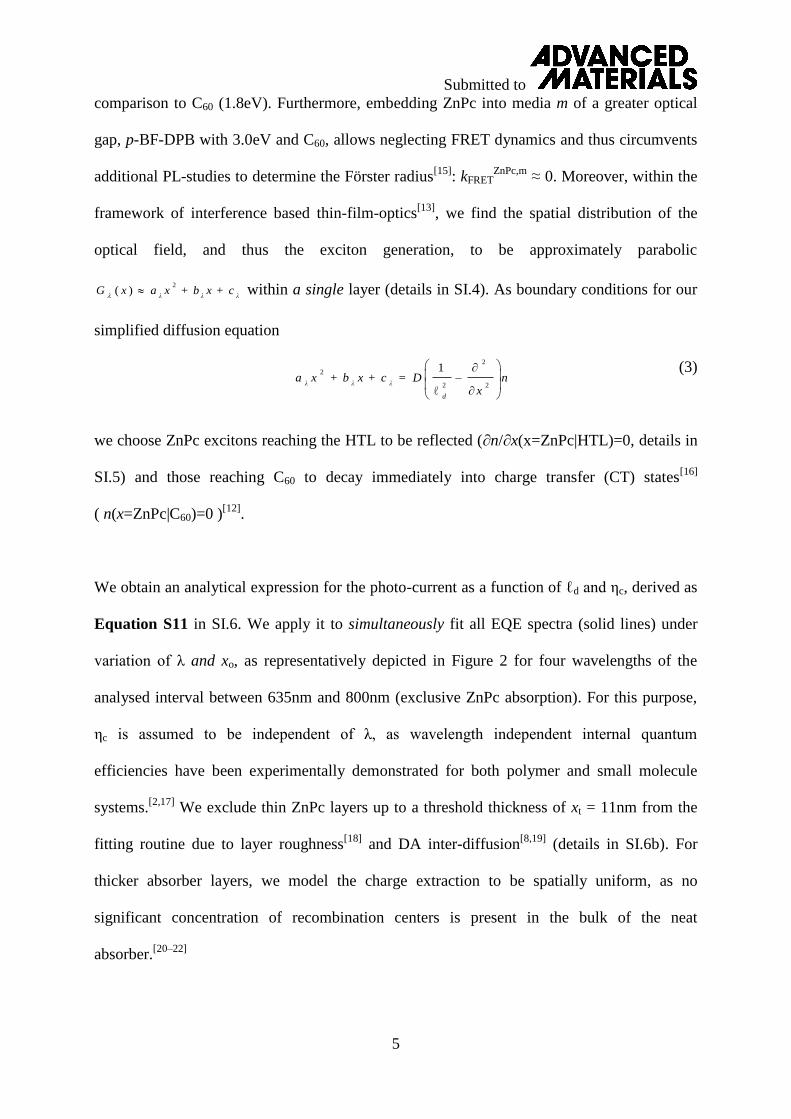
comparison to C60 (1.8eV). Furthermore, embedding ZnPc into media m of a greater optical
gap, p-BF-DPB with 3.0eV and C60, allows neglecting FRET dynamics and thus circumvents
additional PL-studies to determine the Förster radius[15]
: kFRETZnPc,m
≈ 0. Moreover, within the
framework of interference based thin-film-optics[13]
, we find the spatial distribution of the
optical field, and thus the exciton generation, to be approximately parabolic
λλλc+xb+xaxG
2)(
within a single layer (details in SI.4). As boundary conditions for our
simplified diffusion equation
(3)
we choose ZnPc excitons reaching the HTL to be reflected (∂n/∂x(x=ZnPc|HTL)=0, details in
SI.5) and those reaching C60 to decay immediately into charge transfer (CT) states[16]
( n(x=ZnPc|C60)=0 )[12]
.
We obtain an analytical expression for the photo-current as a function of ℓd and ηc, derived as
Equation S11 in SI.6. We apply it to simultaneously fit all EQE spectra (solid lines) under
variation of λ and xo, as representatively depicted in Figure 2 for four wavelengths of the
analysed interval between 635nm and 800nm (exclusive ZnPc absorption). For this purpose,
ηc is assumed to be independent of λ, as wavelength independent internal quantum
efficiencies have been experimentally demonstrated for both polymer and small molecule
systems.[2,17]
We exclude thin ZnPc layers up to a threshold thickness of xt = 11nm from the
fitting routine due to layer roughness[18]
and DA inter-diffusion[8,19]
(details in SI.6b). For
thicker absorber layers, we model the charge extraction to be spatially uniform, as no
significant concentration of recombination centers is present in the bulk of the neat
absorber.[20–22]
nx
D=c+xb+xa
d
λλλ
2
2
2
2
ℓ
1
Submitted to
6
Following this procedure unfolds an exciton diffusion length in ZnPc of ℓd=(10.0±0.8)nm and
a collection yield of ηc =(58±6)%. Note that a successful EQE fit features a peak position xp
coinciding with the experimental data (Figure 2). As the optical field is constructed to be
approximately constant in ZnPc, xp is found in proximity to the diffusion length. However, for
smaller ℓd it would be desirable to achieve a peak position xp much greater than the diffusion
length to still overcome the thickness threshold for uniform charge extraction (xp>xt).
For this purpose, we introduce a pronounced slope in the optical field in the absorber rising
with distance to the quenching interface. It aims to extend the exciton diffusion towards this
interface, at the cost of overall exciton density. A second set of solar cells (Figure 1 bottom) is
prepared showing such a field gradient in absence of thicknesses variations of both transport
layers. It also differs with respect to its electronic polarity through inverse layer stacking and
its transport layers. Here, BPhen is used as ETL and as HTL MeO-TPD (optical gap of 2.9eV)
p-doped with F6-TCNNQ. Comparing to set 1, we observe a pronounced shift of the EQE
peak position to xp≳25nm (see Figure S3 in SI.7). Taking the respective field distribution into
account and assuming complete exciton reflection at the interface between ZnPc and intrinsic
MeO-TPD, we obtain ℓd=(10.2±0.8)nm in ZnPc and a collection yield of ηc=(58±6)% which
confirms the previous results within the measurement uncertainty.
The agreement of the fitted values proves the modelling approach to be independent of the
considered device geometry and underlines the thickness of maximum photo-current xp
typically not be identical with ℓd. Furthermore, the result implies equally efficient charge
extraction for the transport layers of set 1 and 2, as expected. For both device architectures,
CT-states at the DA-interface formed upon successful exciton diffusion are inefficiently
harvested as extracted photo-current. This can be attributed to incomplete CT dissociation and
has been observed in ZnPc-C60-cells before by Rand et al.[23]
The authors attributed this
Submitted to
7
finding to an unfavourable orientation of the ZnPc molecules with regard to the interface with
C60. Beyond, the measurements recorded in such an exciton diffusion study can be used to
evaluate the potential of a corresponding blended absorber system as discussed in SI.8.
To obtain an independent confirmation of the outlined method, an alternative method to
determine ℓd based on the transient decay of PL is performed.[8,24]
A sequence of ZnPc thin-
films with varying layer thickness is prepared on quartz glass substrates in the absence and
presence of 50nm C60, as shown in Figure 3 (top). The ZnPc-C60-interface acts as a complete
quencher[12]
and reduces the effective exciton lifetime. Meanwhile, ZnPc excitons at the
interface with quartz glass or vacuum are expected to reflect, with vacuum being known as an
imperfectly reflecting medium.[25]
For a conjoint analysis (details in SI.9) of both thin-film
sets, a remarkably good agreement is obtained between all measured and modelled PL decays
(Figure 3 bottom). The diffusion length ℓd= (9.6±0.8)nm is obtained using a Förster radius of
(1.4±0.4)nm, and agrees well with the value obtained via spectral modelling, presented earlier.
As the interface between ZnPc and vacuum is modelled to completely reflect excitons, it
yields the possibility of a slight underestimation of ℓd.
In summary, we have demonstrated an experimentally easily accessible approach to determine
the singlet exciton diffusion length ℓd. We demonstrate its validity using ZnPc as an example
but believe it to be applicable to a wider range of organic absorbers. The analysis involves i)
preparing a series of bilayer solar cells with varying absorber thickness, ii) measuring their
external quantum efficiency spectra, and iii) evaluating the respective device optics. The
approach allows the determination of the exciton diffusion length and also the product of the
combined yield of charge-transfer state dissociation with subsequent charge extraction ηc. For
ZnPc-C60 as photoactive system, this procedure yields an exciton diffusion length in ZnPc ℓd
of (10.1±0.9)nm and ηc = (58±6)%. Two rigorously differing solar cell architectures were
Submitted to
8
studied and give consistent results. The value of ℓd is furthermore in excellent agreement with
time resolved measurements of photoluminescence quenching resulting in a diffusion length
ℓd of (9.6±0.8)nm, which underlines the reliability of the newly proposed method.
Experimental Section
Preparation of solar cells: Substrates with pre-structured indium tin oxide (ITO, 90nm,
32Ω/, Thin Films Devices, USA) are purchased as bottom electrode. All organic and metal
layers are deposited via thermal evaporation in ultra high vacuum (K. J. Lesker, UK) with a
base pressure of around 10-8
mbar. Quartz crystal micro-balances are used to monitor the
deposition rates (for organics 0.3-0.4 Å/s) and thus to control layer thicknesses and doping
ratios. Set 1 follows nip-type layer sequence (40nm-xo/2) of C60 n-doped with 3 weight(wt)%
Tetrakis(1,3,4,6,7,8-hexahydro-2H-pyrimido[1,2-a]pyrimidinato)ditungsten(II) (W2(hpp)4),
20nm of intrinsic C60, xo of ZnPc (Supplier: TCI Europe N.V., Belgium), (82nm-xo/2) of
N4,N4'-bis(9,9-dimethyl-9H-fluoren-2-yl)-N4,N4'-diphenylbiphenyl-4,4'-diamine (BF-DPB)
p-doped with 10 wt% C60F36, and 100nm of aluminium (Al) as reflecting top electrode
(photoactive area of 6.4mm2). Set 2 follows the pin-type sequence 1nm of dopant 2,2'-
(perfluoronaphthalene-2,6-diylidene)dimalononitrile (F6-TCNNQ), 20nm of N,N,N',N'-
tetrakis(4-methoxyphenyl)-benzidine (MeO-TPD) p-doped with 2wt% F6-TCNNQ, 5nm of
intrinsic MeO-TPD, xo of ZnPc, 20nm of C60, 6nm of 4,7-diphenyl-1,10-phenanthroline
(BPhen) and 100nm of Al. Besides the n-dopant W2(hpp)4, all organic materials are purified
at least once by vacuum gradient sublimation. After deposition, both sets are sealed under
nitrogen with a cover glass and a humidity getter via a UV-hardened epoxy glue.
Analysis of solar cells: For measuring the EQE, xenon light (Oriel Xe Arc-Lamp Apex
Illuminator, Newport, US) is filtered to 5nm spectral width with a monochromator
(Cornerstone 260 1/4 m Monochromator, Newport, US). Excitation light chopped at 215Hz
excites the sample on a mask area of 2.8 mm2. jphoto is detected via a lock-in amplifier (Signal

Submitted to
9
Recovery SR 7265, National Instruments, US). A calibrated silicon diode (S1337, Hamamatsu,
Japan) monitors the excitation intensity. A compact CCD spectrometer (USB4000, Ocean
Optics, US) reads out the relative excitation spectrum. The optical constants are determined
via transmission and reflection (UV-3100 Spectrometer, Shimadzu, Japan) of thin films with
varying layer thickness and subsequent optical modelling.
Preparation of PL quenching samples: The same evaporation system is used to deposit thin
films of ZnPc and optionally C60 onto quartz substrates. Storing and analysis of the sample are
performed under vacuum.
Analysis of PL quenching samples: Samples are excited with 100fs pulses at 400nm from a
frequency doubled Ti:Sapphire laser. The subsequent decay of the PL is detected between
810nm and 830nm with a time resolution of ~2ps via a streak camera (C6860, Hamamatsu,
Japan) in synchroscan mode with the laser at 80MHz.

Submitted to
10
Supporting Information Supporting Information is available from the Wiley Online Library or from the author.
Acknowledgements
We thank the German BMBF for funding within the scope of the projects InnoProfile 2.2
(03IPT602X) and MEDOS (03EK3503A) as well as the European Commission within the
scope of Career Integration Grant (FP7, MSCA, 630864). We also thank Caroline Walde and
Andreas Wendel from IAPP for sample preparation as well as Dr. Mauro Furno and Sim4tec
for providing the software for optical transfer matrix calculations. I.D.W.S. and M.T.S.
acknowledge support from the European Research Council (grant number 321305). I.D.W.S.
also acknowledges a Royal Society Wolfson Research Merit Award. K.L. is a fellow of the
Canadian Institute for Advanced Research (CIFAR).
Received: ...
Revised: ...
Published online: ...
Submitted to
11
[1] R. Meerheim, C. Körner, B. Oesen, K. Leo, Appl. Phys. Lett. 2016, 108, 103302.
[2] K. Vandewal, S. Albrecht, E. T. Hoke, K. R. Graham, J. Widmer, J. D. Douglas, M.
Schubert, W. R. Mateker, J. T. Bloking, G. F. Burkhard, A. Sellinger, J. M. J. Fréchet,
A. Amassian, M. K. Riede, M. D. McGehee, D. Neher, A. Salleo, Nat. Mater. 2014, 13,
63.
[3] K. Cnops, B. P. Rand, D. Cheyns, B. Verreet, M. A. Empl, P. Heremans, Nat. Commun.
2014, 5, 3406.
[4] Y. Sun, N. C. Giebink, H. Kanno, B. Ma, M. E. Thompson, S. R. Forrest, Nature 2006,
440, 908.
[5] S. Athanasopoulos, E. Hennebicq, D. Beljonne, A. B. Walker, J. Phys. Chem. C 2008,
112, 11532.
[6] O. V. Mikhnenko, M. Kuik, J. Lin, N. Van Der Kaap, T.-Q. Q. Nguyen, P. W. M.
Blom, Adv. Mater. 2014, 26, 1912.
[7] J. D. A. Lin, O. V. Mikhnenko, J. Chen, Z. Masri, A. Ruseckas, A. Mikhailovsky, R. P.
Raab, J. Liu, P. W. M. Blom, M. A. Loi, C. J. García-Cervera, I. D. W. Samuel, T.-Q.
Nguyen, Mater. Horizons 2014, 1, 280.
[8] P. E. Shaw, A. Ruseckas, I. D. W. Samuel, Adv. Mater. 2008, 20, 3516.
[9] M. T. Sajjad, A. J. Ward, C. Kästner, A. Ruseckas, H. Hoppe, I. D. W. Samuel, J. Phys.
Chem. Lett. 2015, 6, 3054.
[10] A. K. Ghosh, T. Feng, J. Appl. Phys. 1978, 49, 5982.
[11] T. K. Mullenbach, R. J. Holmes, Appl. Phys. Lett. 2015, 107, 123303.
[12] Y. Terao, H. Sasabe, C. Adachi, Appl. Phys. Lett. 2007, 90, 103515.
[13] L. A. A. Pettersson, L. S. Roman, O. Inganäs, J. Appl. Phys. 1999, 86, 487.
[14] A. J. Lewis, A. Ruseckas, O. P. M. Gaudin, G. R. Webster, P. L. Burn, I. D. W. Samuel,
Org. Electron. 2006, 7, 452.
[15] W. A. Luhman, R. J. Holmes, Adv. Funct. Mater. 2011, 21, 764.
[16] K. Vandewal, K. Tvingstedt, A. Gadisa, O. Inganäs, J. V. Manca, Phys. Rev. B 2010,
81, 125204.
[17] K. Vandewal, Z. F. Ma, J. Bergqvist, Z. Tang, E. G. Wang, P. Henriksson, K.
Tvingstedt, M. R. Andersson, F. L. Zhang, O. Inganas, Adv. Funct. Mater. 2012, 22,
3480.
[18] C. Schünemann, C. Elschner, A. A. Levin, M. Levichkova, K. Leo, M. Riede, Thin
Solid Films 2011, 519, 3939.
[19] M. Drees, R. M. Davis, J. R. Heflin, Phys. Rev. B 2004, 69, 165320.
Submitted to
12
[20] F. Yang, S. R. Forrest, ACS Nano 2008, 2, 1022.
[21] A. Foertig, A. Wagenpfahl, T. Gerbich, D. Cheyns, V. Dyakonov, C. Deibel, Adv.
Energy Mater. 2012, 1483.
[22] W. Tress, A. Petrich, M. Hummert, M. Hein, K. Leo, M. Riede, Appl. Phys. Lett. 2011,
98, 063301.
[23] B. P. Rand, D. Cheyns, K. Vasseur, N. C. Giebink, S. Mothy, Y. Yi, V. Coropceanu, D.
Beljonne, J. Cornil, J. L. Brédas, J. Genoe, Adv. Funct. Mater. 2012, 22, 2987.
[24] A. J. Ward, A. Ruseckas, I. D. W. Samuel, J. Phys. Chem. C 2012, 116, 23931.
[25] O. V Mikhnenko, F. Cordella, A. B. Sieval, J. C. Hummelen, P. W. M. Blom, M. A.
Loi, J. Phys. Chem. B 2009, 9104.
Submitted to
13
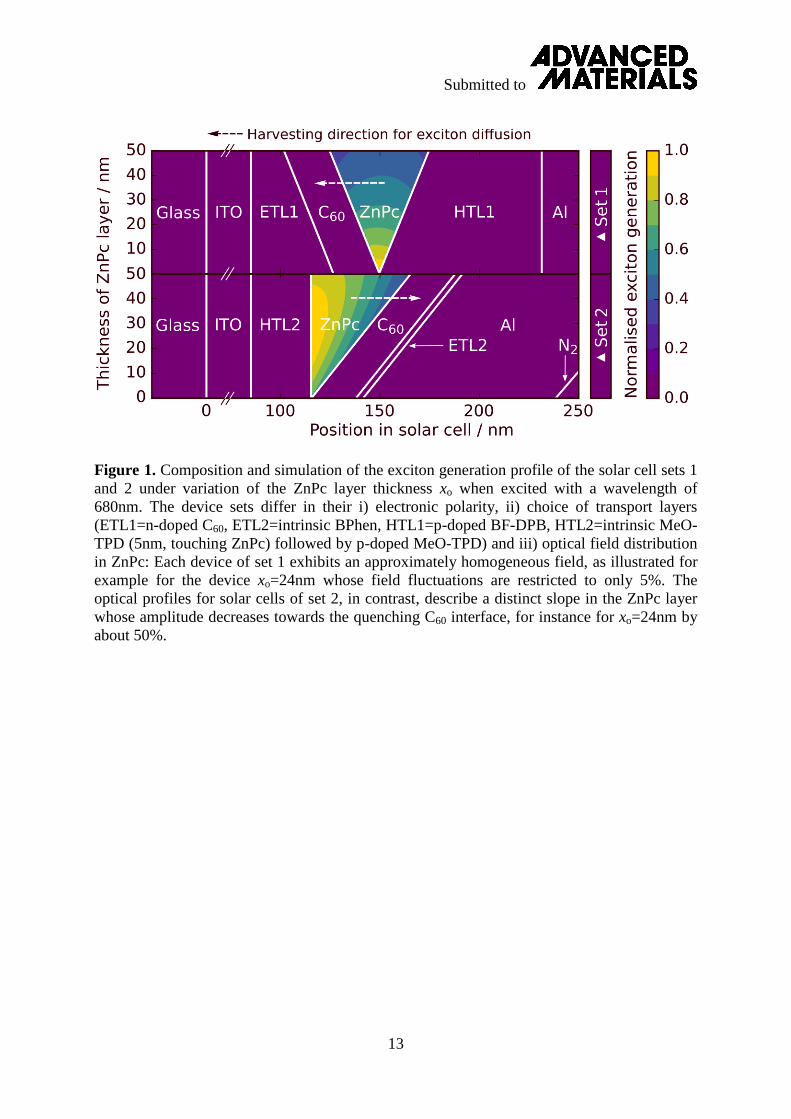
Figure 1. Composition and simulation of the exciton generation profile of the solar cell sets 1
and 2 under variation of the ZnPc layer thickness xo when excited with a wavelength of
680nm. The device sets differ in their i) electronic polarity, ii) choice of transport layers
(ETL1=n-doped C60, ETL2=intrinsic BPhen, HTL1=p-doped BF-DPB, HTL2=intrinsic MeO-
TPD (5nm, touching ZnPc) followed by p-doped MeO-TPD) and iii) optical field distribution
in ZnPc: Each device of set 1 exhibits an approximately homogeneous field, as illustrated for
example for the device xo=24nm whose field fluctuations are restricted to only 5%. The
optical profiles for solar cells of set 2, in contrast, describe a distinct slope in the ZnPc layer
whose amplitude decreases towards the quenching C60 interface, for instance for xo=24nm by
about 50%.
Submitted to
14
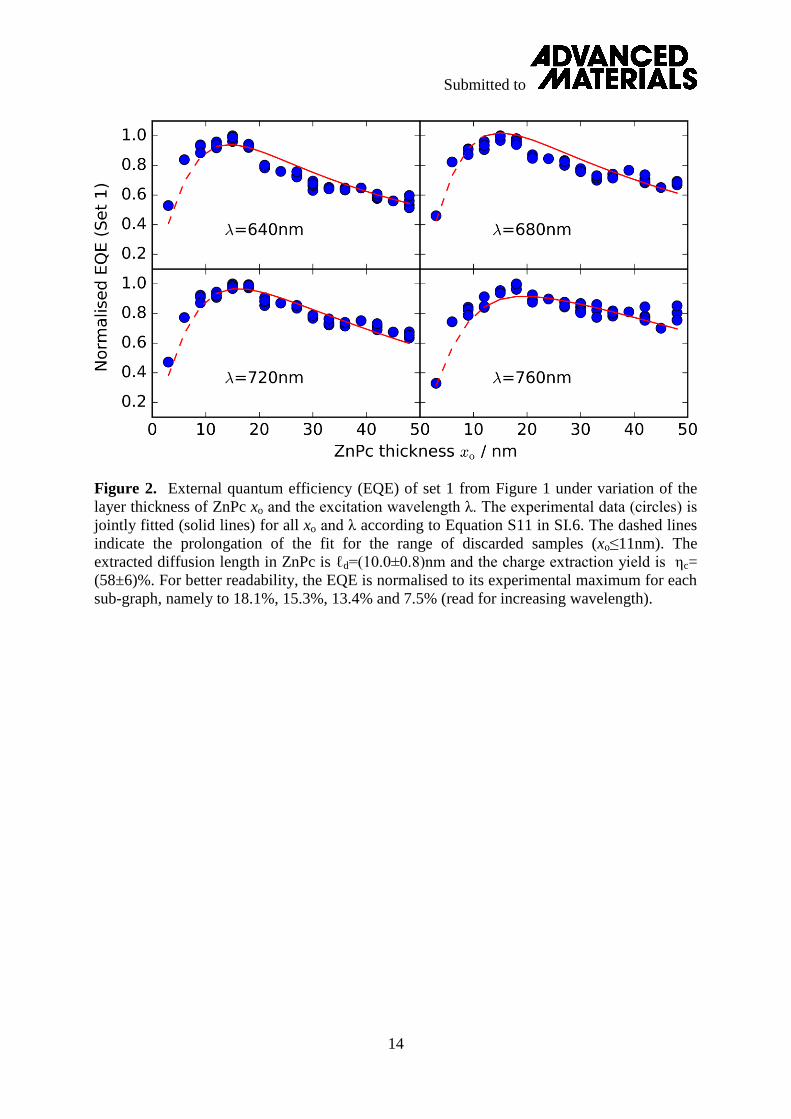
Figure 2. External quantum efficiency (EQE) of set 1 from Figure 1 under variation of the
layer thickness of ZnPc xo and the excitation wavelength λ. The experimental data (circles) is
jointly fitted (solid lines) for all xo and λ according to Equation S11 in SI.6. The dashed lines
indicate the prolongation of the fit for the range of discarded samples (xo≤11nm). The
extracted diffusion length in ZnPc is ℓd=(10.0±0.8)nm and the charge extraction yield is ηc=
(58±6)%. For better readability, the EQE is normalised to its experimental maximum for each
sub-graph, namely to 18.1%, 15.3%, 13.4% and 7.5% (read for increasing wavelength).
Submitted to
15
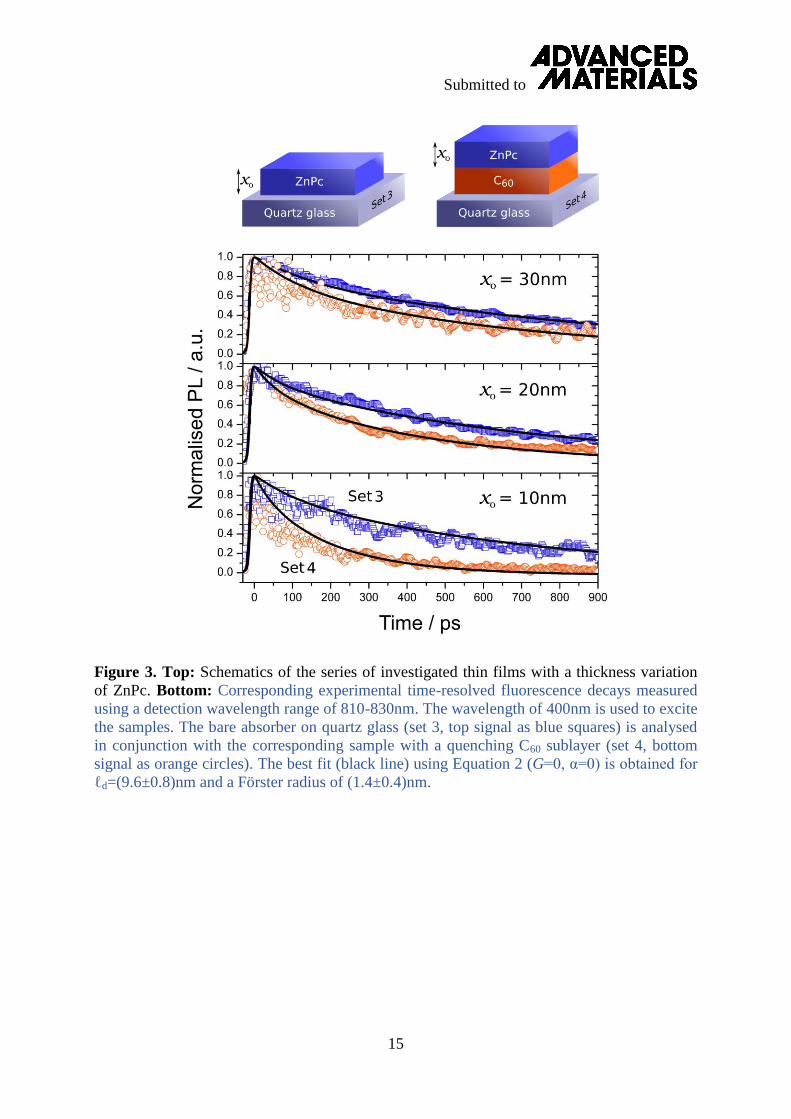
Figure 3. Top: Schematics of the series of investigated thin films with a thickness variation
of ZnPc. Bottom: Corresponding experimental time-resolved fluorescence decays measured
using a detection wavelength range of 810-830nm. The wavelength of 400nm is used to excite
the samples. The bare absorber on quartz glass (set 3, top signal as blue squares) is analysed
in conjunction with the corresponding sample with a quenching C60 sublayer (set 4, bottom
signal as orange circles). The best fit (black line) using Equation 2 (G=0, α=0) is obtained for
ℓd=(9.6±0.8)nm and a Förster radius of (1.4±0.4)nm.
Submitted to
16
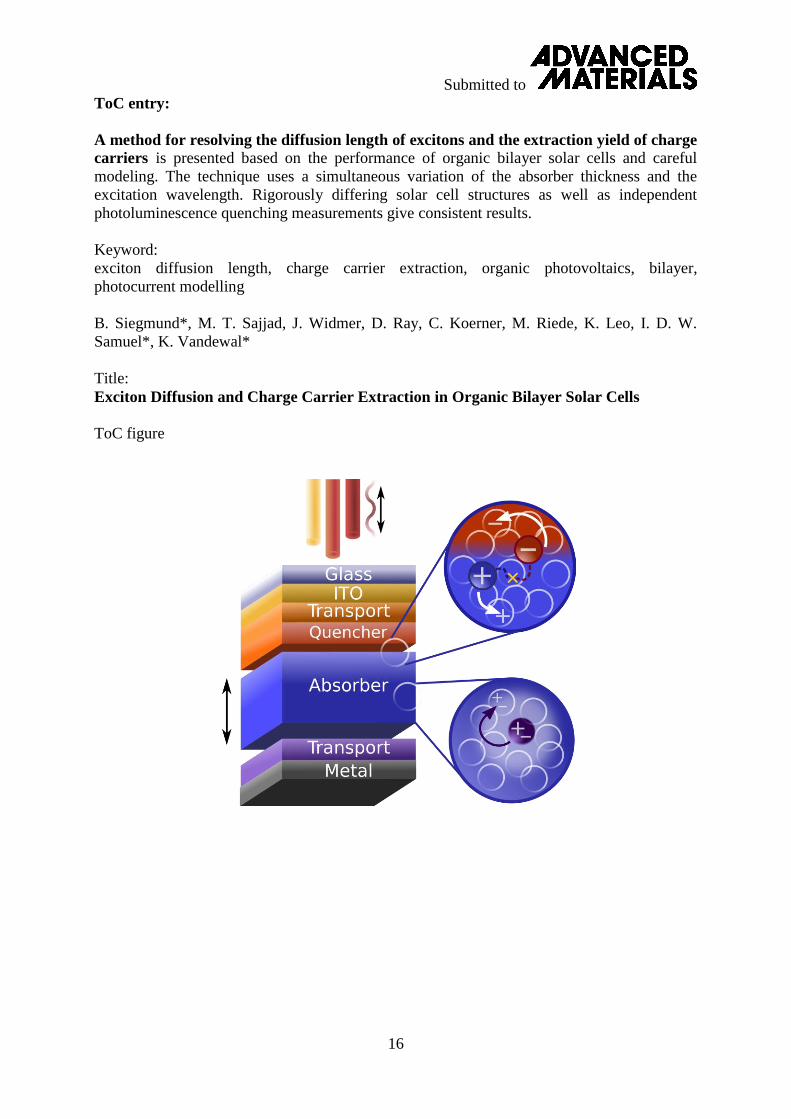
ToC entry:
A method for resolving the diffusion length of excitons and the extraction yield of charge
carriers is presented based on the performance of organic bilayer solar cells and careful
modeling. The technique uses a simultaneous variation of the absorber thickness and the
excitation wavelength. Rigorously differing solar cell structures as well as independent
photoluminescence quenching measurements give consistent results.
Keyword:
exciton diffusion length, charge carrier extraction, organic photovoltaics, bilayer,
photocurrent modelling
B. Siegmund*, M. T. Sajjad, J. Widmer, D. Ray, C. Koerner, M. Riede, K. Leo, I. D. W.
Samuel*, K. Vandewal*
Title:
Exciton Diffusion and Charge Carrier Extraction in Organic Bilayer Solar Cells
ToC figure