submitted to cornerstones for kids · submitted to cornerstones for kids february 2006 national...
TRANSCRIPT


Submitted to
Cornerstones for Kids
February 2006
NATIONAL COUNCIL ON CRIME AND DELINQUENCYHeadquarters Office 1970 Broadway Suite 500, Oakland, CA 94612(510) 208-0500 FAX (510) 208-0511
Midwest Office 426 S. Yellowstone, Suite 250, Madison, WI 53719(608) 831-8882 FAX (608) 831-6446

2
Table of Contents
Cornerstones for Kids Introduction……………………………………………………………….3Executive Summary ...…………………………………………………………………………….4Introduction................................................................................................................................ 4Study Description....................................................................................................................... 4Findings ..................................................................................................................................... 5Workplace Characteristics ........................................................................................................ 10Salary....................................................................................................................................... 10Caseloads ................................................................................................................................. 13Summary of Findings on Workplace Characteristics................................................................. 14System Efficiency .................................................................................................................... 15Investigations ........................................................................................................................... 15In-Home Services..................................................................................................................... 16Out-of-Home Placement........................................................................................................... 17Summary of Findings on System Efficiency ............................................................................. 17System Effectiveness................................................................................................................ 17Summary of Analyses .............................................................................................................. 20
Table of Tables
Table 1: Characteristics of the Three Agency Clusters/Typologies ............................................. 8Table 2: Turnover Rates ............................................................................................................. 9Table 3 : General Characteristics of Counties within Clusters................................................... 10Table 4: Minimum Annual Salaries Paid to Workers and Supervisors....................................... 11Table 5: Agency Benefits/Requirements................................................................................... 12Table 6: Agency Supervision Profile ........................................................................................ 13Table 7: Average Weekly Case Count (November and December 2002)................................... 14Table 8: Referral/Investigation Compliance Measures Monthly Average for 2002.................... 16Table 9: Turnover Rates and Recurrence of Maltreatment ........................................................ 18Table 10: Recurrence of Maltreatment* for 2002...................................................................... 19

3
The Relationship between Staff Turnover, Child Welfare SystemFunctioning and Recurrent Child Abuse
Introduction
The Human Services Workforce Initiative (HSWI) is focused on the frontline workers servingvulnerable children and families. HSWI’s premise is that human services matter. Delivered well,they can, and do, positively impact the lives of vulnerable children and families, often at criticalpoints in their lives.
We believe that the quality of the frontline worker influences the effectiveness of services theydeliver to children and families. If workers are well-trained and supported, have access to theresources that they need, possess a reasonable workload and are valued by their employers, itfollows that they will be able to effectively perform their jobs. If, however, they are asvulnerable as the children and families that they serve, they will be ineffective in improvingoutcomes for children and families.
Unfortunately, all indications today are that our frontline human services workforce is struggling.In some instances poor compensation contributes to excessive turnover; in others anunreasonable workload and endless paperwork renders otherwise capable staff ineffective; andkeeping morale up is difficult in the human services fields and it is remarkable that so manyhuman services professionals stick to it, year after year.
HSWI’s mission is to work with others to raise the visibility of, and sense of urgency about,workforce issues. Through a series of publications and other communications efforts we hope to:
ß Call greater attention to workforce issues.ß Help to describe and define the status of the human services workforce.ß Disseminate data on current conditions.ß Highlight best and promising practices.ß Suggest systemic and policy actions which can make a deep, long term difference.
This paper, authored by the National Council on Crime and Delinquency (NCCD), addresses theimportant issue of staff turnover in the child welfare system, and links the impact of turnover tothe children served. Importantly, NCCD identifies “change points” that agencies can address tomake a difference.
Additional information on the human services workforce, and on HSWI, is available at http://www.cornerstone.to/index.htm.
Cornerstones For Kids2006

4
The Relationship between Staff Turnover, Child WelfareSystem Functioning, and Recurrent Child Abuse
Executive Summary
IntroductionAnnual turnover in child welfare agencies has been estimated between 20 and40 percent. High turnover rates have several potential costs: time spent hiring and training newworkers, money spent on administrative needs rather than services, strain on the existingworkforce, and service degradation. Resources channeled to replace workers, rather than toprovide services, are likely to negatively affect the functioning of the system and ultimately thechildren and families served by the agency. While it is logical to conclude that a high turnoverrate is a main component of an underperforming child welfare system, this conclusion has notbeen documented by research.
Study DescriptionThis study is a first look at a very complex issue. It examines the relationships amongfactors that contribute to the overall level of functioning, including turnover rates, workplacecharacteristics, system efficiency, and case outcomes. Data were drawn from twelve Californiacounties representing a wide array of economic conditions, child welfare practices, and politicalenvironments. Cluster analysis was used to explore the relationships among turnover, efficiency,and effectiveness. With cluster analysis, organizations that are most similar group or clustertogether and thus can be described in terms of turnover rates.
FindingsThree distinct clusters emerged from the analysis. In general, these clusters representedthree levels of organizational functioning: high, moderate, and low. The highest functioningcluster contained three agencies that had the lowest turnover rates, best paid staff, generallybest compliance with recognized practice standards, and lowest rates of re-abuse. The lowestfunctioning cluster was composed of two agencies that had the highest turnover rates, loweststaff pay, and the highest average rates of re-abuse.
The analysis also showed three distinct levels of average turnover rates for highest,moderate, and lowest functioning clusters (9, 13, and 23 percent, respectively).
Workplace CharacteristicsThe analysis suggests that there are three types of organizations characterized by maindifferences in workplace characteristics. First, the highest functioning organizations have the

5
lowest turnover rates, highest salaries, and no requirements for being on call or workingovertime. Higher functioning agencies also provided more training for new workers.
System EfficiencyContrary to expectations most of the system efficiency measures did not show a statisticalrelationship to turnover rates. These data show that by most indications, agencies with highturnover are able to maintain practice standards; however, their systems are showing the stress.Investigation procedures seem to some extent protected from the effects of system stress.However, fewer case plans are approved and permanency cases are closed more quickly in thecluster of agencies that have the highest turnover. It is likely that workers have less time tocomplete their paperwork and thus try to close cases more quickly to reduce their load.
System EffectivenessThe most important measure of the effectiveness of the child welfare system is the recurrenceof maltreatment. The cluster analysis showed a clear relationship between agency functioningand this measure of system effectiveness. The lowest functioning cluster of agencies (with thehighest levels ofturnover) had about twice as many recurrences of abuse or neglect.
ConclusionThis study points to system issues that are related to better agency functioning andreduced child maltreatment and that can be impacted by policy makers and administrators.These important change points are increasing the salaries of child welfare workers andsupervisors, not allowing or expecting overtime, not requiring “on-call” work, and focusing on
the completion of written and approved case plans.

6
The Relationship between Staff Turnover, Child Welfare
System Functioning and Recurrent Child Abuse
INTRODUCTION
Child welfare workers often predict that they will leave their jobs at high rates. In one
study, two-thirds (68 percent) predicted that they would stay two years or less in their current
position (Harrison, 1980). Another study found that nearly 45 percent of child welfare workers
were likely to look for a new job with another employer in the next year (Jayaratne & Chess,
1984). Annual agency turnover in child welfare agencies has been estimated at between 20 and
40 percent (Annie E. Casey Foundation, 2003; Reagh, 1994).
High turnover rates have several potential costs: time spent hiring and training new
workers, money spent on administrative needs rather than services, strain on the existing
workforce, and service degradation. Resources channeled to replace workers, rather than
provide services, are likely to negatively affect the functioning of the system, and ultimately the
children and families served by the agency. While it is logical to conclude that a high turnover
rate is a main component of an underperforming child welfare system, this conclusion has not
been documented by research.
It is important to consider that real world systems function dynamically and it is difficult
to know whether job turnover causes a malfunctioning system or is a symptom of it. For
example, it is difficult to discern whether poor outcomes for abused children are a result of high
turnover or are the cause of staff burnout and short tenure. It is likely that both of these
relationships exist in a dynamic system. Thus, this study will examine the relationships among
factors that contribute to an overall level of functioning. Describing “system functioning” for
this study includes defining the relationship among turnover rates, workplace characteristics,
system efficiency, and case outcomes.
STUDY DESCRIPTION
The data analyzed in this study were drawn from twelve California counties. These
counties ranged from large metropolitan centers to small rural counties in various geographic
areas of the state. They represent a wide array of economic conditions, child welfare practices,
and political environments.

7
The data are from each county’s SafeMeasures® 2002 database. NCCD created
SafeMeasures® to provide real time data reports for each county on measures of compliance with
agency, state, and federal standards, as well as on a number of outcome measures such as
subsequent allegations, investigations, substantiations, and placements. In addition, NCCD
surveyed the twelve counties in the study to obtain information on salaries, benefits, turnover
rates, and number of staff at each level in the organization. The resulting database represents
nearly 3,000 workers and over 40,000 cases. However, all analyses were conducted using
aggregate measures since turnover is an agency-based statistic.
Given the small sample size (twelve counties), the most appropriate analyses were
exploratory. In order to study the relationships among turnover, efficiency, and effectiveness,
cluster analysis was used. Cluster analysis allows for the exploration of the data by creating
typologies of organizations. Organizations that are most similar group or cluster together and
thus can be described in terms of turnover rates. The data will show whether organizations with
low turnover rates are also the most efficient and most effective. To further illuminate the
clustering, the statistical significance of the bivariate relationships was also explored.
FINDINGS
Three distinct clusters emerged from the analysis. In general, these clusters represented
three levels of organizational functioning: high, moderate, and low. The highest functioning
cluster contained three agencies that had the lowest turnover rates, best paid staff, generally best
compliance with recognized practice standards, and lowest rates of re-abuse. The lowest
functioning cluster was composed of two agencies that had the highest turnover rates, lowest
staff pay, and the highest average rates of re-abuse. Table 1 shows a summary of the cluster
analysis, as well as the variables that are significantly related to job turnover.1 Each of the
notable differences between the clusters will be explored in the sections that follow.
1 Tests of statistical significance for the clusters are inappropriate because the analysis intentionally createsdivergence in the variables across clusters. Statistical significance in this report refers to the bivariate correlations.

8
Table 1: Characteristics of the Three Agency Clusters/Typologies
Cluster 1
HighestFunction
Cluster 2
ModerateFunction
Cluster 3
LowestFunction
Correlationwith
Turnover(p<.05)
Number of agencies 3 7 2Turnover Rate – 2002 9.0 13.1 23.4
Workplace CharacteristicsAverage minimum salary for child welfare workers $56,671 $41,154 $32,245 -.80Average minimum salary for supervisors $70,057 $51,199 $38,576 -.75Average worker caseload 13.4 11.4 10.5Training days for new workers 48 31 14Ratio of workers to supervisors 5.6:1 6.8:1 6.8:1Educational reimbursement offered Yes Yes Mixed -.73Flex time allowed Mixed Mixed MixedOvertime allowed Mixed Yes YesOn-call allowed Optional Mixed Required
Efficiency MeasuresInvestigationsNon-compliance with standard time for investigation 8.9% 26.7% 17.3%Time from first actual contact to close - % more than 60 days 18.2% 7.4% 40.3%
In-Home Case ManagementCurrent case status plan approved for keeping the child in thefamily home
64.7% 59.0% 33.4%-.82
Cases compliant with face-to-face contact standards forchildren left in family home
64.9% 76.3% 66.2%
Cases open for more than 18 months for in-home cases 6.6% 4.9% 10.1%
Out-of-Home PlacementCurrent case status plan approved for family reunificationcases
69.8% 61.9% 38.4%-.69
Compliant with face-to-face contact standards for childrentaken from family home but intended for reunification
69.2% 80.5% 78.6%
Cases open more than 18 months for children taken fromhome but intended for family reunification 10.2% 4.9% 7.1%
Out-of-Home – Permanency PlacementCurrent case status plan approved for child taken from homeand undergoing permanency placement 42.1% 56.7% 37.6%
Cases compliant with face-to-face contact standards forchildren in permanency placement process
31.3% 62.0% 61.0%
Cases open more than 18 months for children undergoingpermanency placement 78.5% 60.1% 55.1%
-.61
General Practice StandardsCare providers given health and education documents 43.9% 38.2% 17.1%Compliant with child receiving standard physical health exam 71.1% 80.4% 51.0%
Effectiveness - Case OutcomesSubstantiated re-abuse or re-neglect cases within 3 months 6.1% 8.4% 14.9% .79Substantiated re-abuse or re-neglect cases within 6 months 10.0% 12.6% 18.2% .72Substantiated re-abuse or re-neglect cases within 12 months 14.6% 16.9% 21.8% .60
9
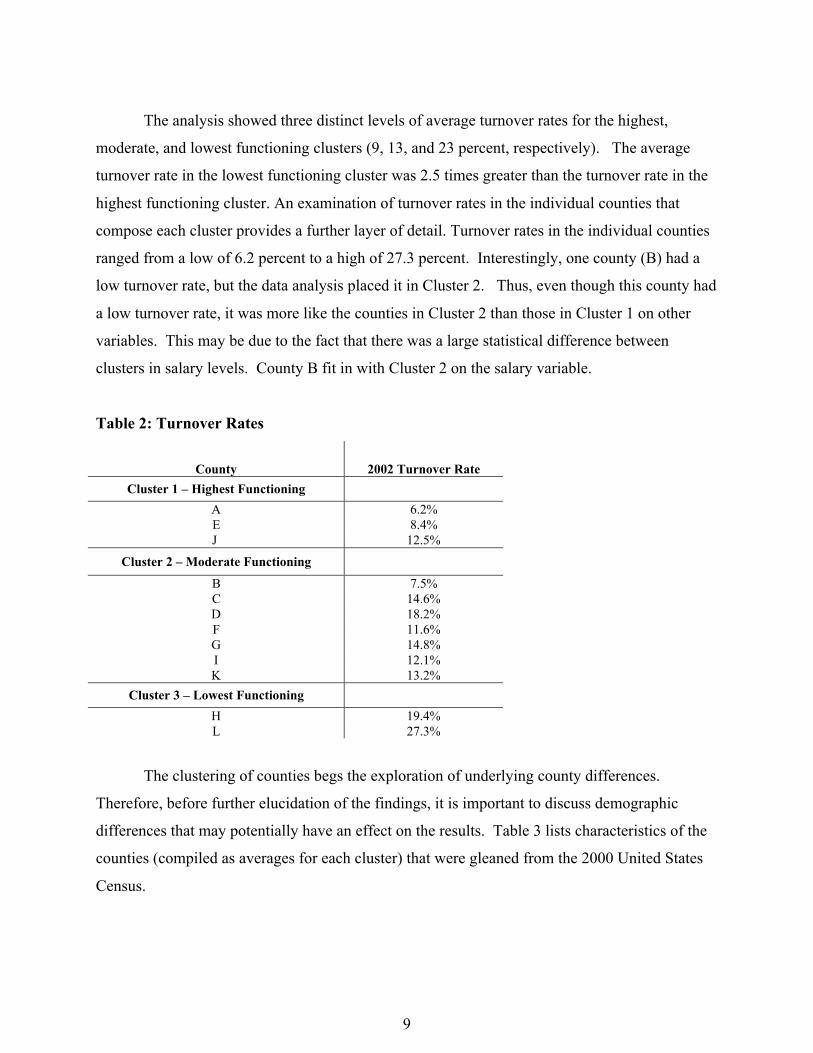
The analysis showed three distinct levels of average turnover rates for the highest,
moderate, and lowest functioning clusters (9, 13, and 23 percent, respectively). The average
turnover rate in the lowest functioning cluster was 2.5 times greater than the turnover rate in the
highest functioning cluster. An examination of turnover rates in the individual counties that
compose each cluster provides a further layer of detail. Turnover rates in the individual counties
ranged from a low of 6.2 percent to a high of 27.3 percent. Interestingly, one county (B) had a
low turnover rate, but the data analysis placed it in Cluster 2. Thus, even though this county had
a low turnover rate, it was more like the counties in Cluster 2 than those in Cluster 1 on other
variables. This may be due to the fact that there was a large statistical difference between
clusters in salary levels. County B fit in with Cluster 2 on the salary variable.
Table 2: Turnover Rates
County 2002 Turnover Rate
Cluster 1 – Highest Functioning
A 6.2%E 8.4%J 12.5%
Cluster 2 – Moderate Functioning
B 7.5%C 14.6%D 18.2%F 11.6%G 14.8%I 12.1%K 13.2%
Cluster 3 – Lowest Functioning
H 19.4%L 27.3%
The clustering of counties begs the exploration of underlying county differences.
Therefore, before further elucidation of the findings, it is important to discuss demographic
differences that may potentially have an effect on the results. Table 3 lists characteristics of the
counties (compiled as averages for each cluster) that were gleaned from the 2000 United States
Census.

10
Table 3: General Characteristics of Counties within Clusters
Cluster 1Average of 3 counties
Cluster 2Average of 7 counties
Cluster 3Average of 2 counties
Median S.D.* Median S.D. Median S.D.
Total population 776,733 599,543 799,407 1,182,202 390,352 513,140
Percent under poverty level 11% 2.6% 14.2% 4.0% 14.7% 7.8%
Persons per square mile 1,957 8,932 146 1,292 218 269
Median household income $55,946 $9,085 $42,887 $7,706 $44,654 $21,230
Emergency response referrals** 4,474 3,523 11,853 14,758 4,094 4,779
* The standard deviation is a measure of variability.** The number of emergency referrals to the county Department of Social Services in 2002.
In general, the clusters did not show any discernable pattern of demographic differences.
However, there are some distinctions that should be noted. The median population size of
Cluster 3 is smaller than that of the other two clusters. On average the counties in Cluster 1
(with the lowest turnover rate) have a slightly lower poverty rate, tend to be more urban (higher
population per square mile), and have higher household incomes. Cluster 2 shows the most
variability in general because there are more counties composing this cluster. There are a few
counties in Cluster 2 that have a large volume of emergency referrals, thus the median number of
referrals is substantially larger.
Workplace Characteristics
Salary
There were significant differences between the clusters on salaries paid to workers and
supervisors. The highest functioning cluster of organizations paid the highest salaries. In fact,
the employees in the highest functioning cluster were paid almost twice as much on average as
the workers in the lowest functioning cluster. Minimum annual salaries for workers and
supervisors are presented in Table 4. The lowest starting salary for workers was $28,262; the
highest starting salary was $58,500. For supervisors, average minimum salaries ranged from
$36,062 to $76,154.
Salary was closely related to turnover rates. The correlation between average minimum
worker salary and agency turnover rate was an extremely strong -.8, and the correlation between
turnover and average minimum supervisor salary was -.75. Thus, the higher the salary, the lower
the turnover rate.

11
Table 4: Minimum Annual Salaries Paid to Workers and Supervisors
County Workers Supervisors
Cluster 1 – Highest Functioning
A $58,500 $70,252E $55,464 $63,764J $56,050 $76,154
Cluster 2 – Moderate Functioning
B $45,851 $54,478C $41,379 $51,501D $40,752 $48,318F $40,651 $52,896G $33,704 $48,490I $41,469 $51,348K $44,274 $51,360
Cluster 3 – Lowest Functioning
H $36,227 $41,090L $28,262 $36,062
Benefit packages across the twelve counties were much more consistent than salary
levels. However, levels of training, overtime policy, and on-call requirements varied (see Table
5). Most counties provided educational reimbursement at some level, allowed flex time
schedules, and paid caseworkers for overtime. However, educational reimbursement had a
significant statistical relationship to turnover because one of the two highest turnover counties
did not provide education reimbursement. Also, the highest functioning cluster (with the lowest
average turnover rate) was less likely to require that workers be on call and less likely to allow
overtime. In fact, regardless of cluster, the counties where on-call status was not required had
an average turnover rate of 8.7 percent, compared to 16.4 percent for counties where on-call
status was required.

12
Table 5: Agency Benefits/Requirements
County
OngoingStaff
TrainingRequired
TrainingRequired for
New Staff
Agency ProvidesEducation
ReimbursementFlex TimeAvailable
PaidOvertimeAvailable
On CallStatus
Cluster 1 – Highest Functioning
A No 40 days Yes Yes Yes OptionalE No 60 days Yes Yes No OptionalJ No 45 days Yes No No Not Required
Cluster 2 - Moderate Functioning
B No 15 days Yes Yes Yes OptionalC Yes 30 days Yes Yes Yes RequiredD Yes 30 days Yes Yes Yes RequiredF No 80 days Yes Yes Yes RequiredG No 30 days Yes No Yes RequiredI Yes 13 days Yes Yes Yes RequiredK Yes 20 days Yes Yes Yes Required
Cluster 3 – Lowest Functioning
H Yes 15 days Yes Yes Yes RequiredL No 13 days No No Yes Required
Salary and some other workplace characteristics were highly correlated. Interestingly, the
counties that paid the highest salaries were also the least likely to allow overtime or keep their
employees on call. This implies that these counties placed a high value on their employee’s time
as well as their finances. Another study recently conducted by NCCD, “Job Turnover in Child
Welfare and Juvenile Justice: The Voices of Former Frontline Workers,” showed that being on
call and working long hours were the main reasons caseworkers left their jobs.
Training requirements, particularly for new staff, also varied substantially. More training
was provided for new employees in the highest functioning cluster (more than nine weeks on
average) compared to an average of less than three weeks in the lowest functioning cluster. On
average, the agencies with the lowest turnover had the highest number of training days for new
employees, and agencies with the highest turnover invested a lower number of days in new staff
training.
A profile of agency supervision levels is presented in Table 6. This is intended to
provide an illustration of the range of workforce conditions represented in the study. A U.S.
General Accounting Office study (2003) noted that one reason cited for workers leaving an
agency was the level of supervision provided. As one measure of this, the ratio of workers to
supervisors was computed for each agency. In the twelve agencies in the study, worker to

13
supervisor ratios ranged from just over 4:1 to 12.5:1. As the cluster analysis presented in Table 1
illustrates, worker to supervisor ratio was slightly smaller in the highest functioning cluster.
However, the relationship between job turnover and supervisor/worker ratio was not statistically
significant. Other factors that were not significantly related to turnover were the number of staff
and stability in agency leadership. In this sample, there was general instability in agency
directors, with an overall average of two new directors in five years.
Table 6: Agency Supervision Profile
County Supervisors Case WorkersWorker to
Supervisor Ratio
Years in Agencyof CurrentDirector
Number of AgencyDirectors
(last five years)
Cluster 1 – Highest Functioning
A 61 283 4.6:1 2.42 3E 42 342 8.1:1 3.67 2J 8 33 4.1:1 12 1
Cluster 2 – Moderate Functioning
B 131 581 4.4:1 2 2C 100 755 7.6:1 1.25 3D 68 436 6.4:1 3 2F 12 61 5.1:1 0.75 2G 43 285 6.6:1 2.5 3I 2 25 12.5:1 10 1K 11 52 4.7:1 3.75 2
Cluster 3 – Lowest Functioning
H 17 113 6.7:1 1.33 2L 2 14 7.0:1 3 3
Total 497 2,980 6.0:1 3.8 2.2
Caseloads
To determine the average caseload in each agency, a nine-week period at the end of 2002
was sampled (November and December 2002). Against theory, the average caseload of the
highest functioning cluster was higher than that of the lower functioning clusters. This
difference is likely an artifact of the small sample size as one county in Cluster 1 had an aberrant
caseload statistic.
As Table 7 illustrates, caseloads varied greatly among the twelve agencies, ranging from
a low of 7.5 to a high of 21.2. The 21.2 average was something of an anomaly among the twelve
agencies. It was over 40 percent higher than the next highest caseload level (15) and nearly
double the average for all twelve agencies. Seven agencies (58 percent) had average caseloads

14
between 10 and 15 cases, and five agencies had average caseloads of less than 10. With the
exception of County A, caseloads were within or below standards established by the Child
Welfare League of America. In this study, caseload was not statistically related to turnover.
Unfortunately, the available measure of caseload in this study was not optimal because it was
only for the last two months of the year.
Table 7: Average Weekly Case Count (November and December 2002)
County Worker Average
Cluster 1 – Highest Functioning
A 21.2E 8.7J 10.2
Cluster 2 – Moderate Functioning
B 10.6C 12.2D 15.0F 7.5G 8.6I 13.7K 12.0
Cluster 3 – Lowest Functioning
H 8.4L 12.6
Study Average 11.7
Note: This reflects all cases, including investigations, divided by the number of workers in each agency.
Summary of Findings on Workplace Characteristics
The analysis suggests that there are three types of organizations characterized by main
differences in workplace characteristics. First, the highest functioning organizations have the
lowest turnover rates, highest salaries, and no requirements for being on call or working
overtime. The highest functioning agencies also provided more training for new workers. These
findings are generally supported by other NCCD research that asked former caseworkers why
they left their agencies. The most common responses were too much overtime, being on-call,
high caseloads, and low salaries. The issue of high caseloads was not relevant for most counties
in this sample because the caseload size did not exceed the recommended maximums.

15
System Efficiency
In theory, agencies with high turnover rates would also experience a disruption in case
management that would manifest itself in lower levels of compliance with agency standards.
Practice standards are the basic tenets of casework and are established with the presumption that
good casework, timely completion of required tasks, and regular contact with children and
families are essential to achieve positive outcomes for children.
Performance measures and their relationship to the three clusters as well as turnover are
presented below. These measures are divided into three principal categories: 1) investigations
and response to allegations, 2) in-home services provided to families, and 3) out-of-home
services provided to children in foster care or undergoing permanency placement.
Investigations
A differential pattern was not found among high, moderate, and low functioning clusters
in our measures of the investigation process. Also, the turnover rate was not related to any of the
variables describing compliance with investigation standards. A possible explanation is that
investigatory responsibilities are given precedence and thus maintained. Almost all the agencies
were compliant with time to first contact standards for the vast majority of cases.
Investigation compliance measures for all twelve counties are presented in Table 8.
These data illustrate the wide divergences in practice found in the twelve counties in this study.
For example, the percentage of referrals responded to within 24 hours ranged from 11.4 percent
to over 60.0 percent.

16
Table 8: Referral/Investigation Compliance Measures Monthly Average for 2002
Time to First Contact
County Compliantwith
Standards
ContactedWithin
24-HoursContacted in
2-9 Days
ContactedAfter More
than 10 DaysNo ContactRecorded
Percent of CasesRequiring 60 or
More Daysto CompleteInvestigation
Cluster 1 – Highest Functioning
A 91.0% 37.6% 53.2% 8.8% 0.4% 40.8%E 85.0% 35.6% 51.2% 12.9% 0.3% 12.8%J 97.3% 25.2% 71.9% 2.8% 0.1% 0.9%
Cluster 2 – Moderate Functioning
B 95.1% 37.3% 58.2% 4.4% 0.1% 3.1%C 87.5% 36.6% 49.1% 13.8% 0.5% 7.0%D 78.9% 24.7% 54.1% 20.8% 0.4% 8.2%F* 34.4% 11.4% 24.4% 19.2% 45.0% 11.8%G 72.7% 60.4% 17.2% 22.6% 0.6% 7.5%I 82.3% 29.0% 49.7% 20.2% 1.1% 5.6%K 62.5% 23.9% 35.5% 40.2% 0.5% 8.6%
Cluster 3 – Lowest Functioning
H 79.4% 18.4% 61.1% 20.1% 0.4% 13.5%L 86.0% 38.2% 41.7% 19.7% 0.4% 67.0%
* The percentage of cases with no contact may be a data entry issue rather than a compliance issue. The 45% figure,given the level of consistency found among other agencies, is highly suspect.
In-Home Services
One important measure of system efficiency for in-home cases was different among the
three clusters of agencies. The highest functioning cluster had a greater percentage of cases that
had an approved case plan—approximately twice the percentage of approved case plans
compared to the lowest functioning cluster agencies. This factor, case plan approved by
supervisor, also demonstrated an exceptionally strong relationship to staff turnover (-.82).
Maintenance of case service plans is undoubtedly difficult in agencies that experience high
turnover rates. As a subsequent section of this report documents, this disruption appears to have
a strong negative impact on case outcomes. Having an approved case plan for in home services
also showed a significant relationship to the percentage of children receiving a physical exam
(.61). Surprisingly, compliance with case contact standards did not seem to be affected by
turnover. This may point out the issue of quality versus quantity. It may be that agencies are
able to keep up most of the appearances of being able to handle the caseload, while quality of the
interactions (which is extremely difficult to measure) suffers.

17
Out-of-Home Placement
A similar pattern of relationships was apparent for out-of-home placement cases that
were slated for family reunification. Agencies in Cluster 1, the highest functioning cluster, had
higher rates of approved case plans for family reunification cases than did the lowest functioning
agencies. Again, agencies with lower turnover were more likely to have approved case plans.
For those cases slated for permanent out-of-home placement, there were no clear
differences among clusters in case plan approval. Interestingly, in the highest functioning
agencies of Cluster 1, cases were more likely to be left open longer. These agencies seemed to
leave more time for permanency planning. The vast majority (79 percent) of cases were still
open more than 18 months later as opposed to only 55 percent of the cases in the lowest
functioning (highest turnover) cluster. In support of this finding, bivariate analysis showed that
agencies that closed their permanency cases more quickly generally had a higher turnover rate.
Summary of Findings on System Efficiency
Contrary to expectations most of the system efficiency measures did not show a statistical
relationship to turnover rates. These data show that by most indications, agencies with high
turnover are able to maintain practice standards; however, their systems are showing the stress.
Investigation procedures seem to some extent protected from the effects of system stress.
However, fewer case plans are approved, and permanency cases are closed more quickly in the
cluster of agencies that have the highest turnover. It is likely that workers have less time to
complete their paperwork and they try to close cases more quickly to reduce their load. The
findings suggest that services to ongoing cases may be the first casualty of high staff turnover as
efforts are made to protect the “front end” of the child protection system.
System Effectiveness
The most important measure of effectiveness of the child welfare system is the recurrence
of maltreatment. We have defined recurrence as a new substantiated allegation of abuse or
neglect within three, six, or twelve months. The cluster analysis showed a clear relationship
between agency functioning and system effectiveness. The lowest functioning cluster of
agencies (with the highest levels of turnover) had about twice as many recurrences of abuse or

18
neglect. The results of the cluster analysis depicted in Table 1 at the beginning of this report,
shows that within three months, 6 percent of Cluster 1 (highest functioning) cases have another
substantiated abuse incident, compared to almost 15 percent of cases in the agencies in Cluster 3
(lowest functioning). Within 12 months, almost 15 percent of cases in the highest functioning
agencies had another substantiated case of abuse, compared to almost 22 percent of the cases in
the lowest functioning agencies.
In support of these disturbing findings, the correlation between turnover rate and
maltreatment recurrence at every time point was strong and statistically significant (see Table 9).
The higher the turnover rate, the higher the re-abuse rate, although the relationship declines as
time from initial referral increases. Thus, turnover appears to have its greatest impact in the first
few critical months of services.
Table 9: Turnover Rates and Recurrence of Maltreatment
Correlation with 2002 Turnover Rate
Recurrence at 3 months for all cases .79Recurrence at 6 months for all cases .72Recurrence at 12 months for all cases .60Recurrence at 3 months for children left in the home .81Recurrence at 6 months for children left in the home .70Recurrence at 12 months for children left in the home .61
Recurrence rates delineated by county are presented in Table 10. Substantiated re-abuse
levels varied significantly across counties. It should be noted that abuse recurrence rates in
County H are not consistent with those found in the other county within Cluster 3.

19
Table 10: Recurrence of Maltreatment* for 2002
All Cases: Recurrence of Maltreatment In-Home Cases Only: Recurrence of Maltreatment
Within 3Months
Within SixMonths
Within 12Months
Within 3Months
Within 6Months
Within 12Months
Cluster 1 – Highest Functioning
A 4.8% 7.2% 11.4% 4.3% 6.3% 9.7%E 8.1% 10.5% 16.6% 8.1% 10.9% 17.7%J 5.5% 12.4% 15.9% 6.1% 13.2% 17.1%
Cluster 2 – Moderate Functioning
B 4.1% 6.6% 10.0% 4.1% 6.8% 10.6%C 9.2% 11.7% 15.2% 8.2% 11.0% 14.6%D 11.7% 15.0% 18.2% 11.0% 15.2% 19.1%F 10.1% 14.3% 20.7% 9.5% 14.3% 20.9%G 6.0% 8.3% 12.2% 5.0% 7.3% 11.1%I 4.1% 11.8% 14.6% 5.6% 15.9% 19.6%K 13.8% 20.3% 27.3% 13.3% 20.7% 28.5%
Cluster 3 – Lowest Functioning
H 8.9% 9.8% 12.8% 9.4% 10.2% 13.5%L 20.8% 26.5% 30.8% 22.2% 28.5% 33.7%* Defined as a new substantiation.

20
Summary of Analyses
While this is a small study involving twelve child welfare agencies in a single
state, much can be learned from the findings. In sum, the analyses conducted here
support the following conclusions:
1. The data support three typologies of child welfare agencies based on their overall
functioning, including workplace characteristics for the caseworkers, system
efficiency, and effectiveness in preventing further child maltreatment. These
agencies fell into highest, moderate, and lowest functioning categories, while
high, moderate, and low job turnover rates were a defining characteristic of the
ability of the agency to function.
2. Salary levels for workers and supervisors were related to turnover rates. Along
with significantly higher salaries, organizations with lower turnover had
employees who were not required to work overtime or to be on call. Given the
cost of turnover, both in financial and human terms, an increased investment in
staff resources could lead to better protection of children and perhaps save money
in the long run. A larger study could delve into the costs/benefits of better
compensation, educational benefits, and training programs.
3. There is some evidence that staff turnover is negatively related to the efficiency of
the agency and disrupts case planning. The intake process (referrals and
investigations) does not seem to be affected as quickly as ongoing services,
possibly because agencies strive to maintain the crucial front-end of the child
protection system when staff shortages occur.
4. High turnover rates are significantly related to higher rates of maltreatment
recurrence. The correlation between turnover and recurrence within three months
of service is especially strong (.81). Counties with a turnover rate exceeding 15
percent had a six-month recurrence rate (an important “yardstick” in the federal
Child and Family Service Reviews) that was 125 percent higher than those with
turnover rates below 8.5 percent.

21
Future studies that include larger samples and use multivariate analysis that
considers and controls for interactions among variables will be better able to measure the
impact of turnover on service delivery and child safety. There is great promise that larger
databases will soon be available. The database used in this study, for example, has been
implemented in several states other than California. A larger pool of data from many
agencies around the country will permit analyses of the effect of different policy and
practice approaches to child welfare on both turnover and case outcomes.
This study should be viewed as a preliminary analysis (or first look) at a very
complex issue. That said, it does offer evidence that staff turnover is related to child
safety. The strength of the correlation between turnover and recurrence may be due, in
part, to the size of the sample. However, it is such a strong correlation that it would
probably remain highly significant in larger studies.
Even though we cannot infer causality from these analyses, we can focus on the
factors that are most easily affected by policy and administrative changes. This study
points to system issues that are related to better agency functioning and reduced child
maltreatment and that can be impacted by policy makers and administrators. These
important change points are increasing the salaries of child welfare workers and
supervisors, not allowing or expecting overtime, not requiring “on-call” work, and
focusing on the completion of written and approved case plans. Although these points of
suggested change do not necessarily cause job turnover, they are related to overall agency
efficiency and effectiveness, and improvement in one part of the system is likely to show
benefits in other parts of the system.

22
References
Annie E. Casey Foundation. 2003. The unsolved challenge of system reform: The
condition of the frontline human services workforce. Baltimore, MD: Annie E.
Casey Foundation.
Harrison, W. D. 1980. Role strain and burnout in child-protective service workers. Social
Service Review 54: 31-44.
Jayaratne, S., & Chess, W. A. 1984. Job satisfaction, burnout, and turnover: A national
study. Social Work 29: 448-453.
Reagh, R. 1994. Public child welfare professionals-those who stay. Journal of Sociology
and Social Welfare 21(3): 69-78.
United States General Accounting Office. 2003. Child welfare: HHS could play a greater
role in helping child welfare agencies recruit and retain staff. (Publication No.
GAO-03-357). Washington, DC: General Accounting Office. Retrieved March
24, 2004 from http://www.cwla.org/programs/workforce/gaohhs.pdf.