submission to the productivity commission executive
TRANSCRIPT

Submission to the Productivity Commission Executive Remuneration Inquiry
Production Commission Locked Bag 2 Collins St. East Melbourne VIC 8003 By e‐mail: [email protected] This submission to the public inquiry on executive remuneration conducted by the Productivity Commission does not necessarily aim at answering most of the questions outlined in the issues paper produced by the Commission, but rather at attempting an answer to one question that is surprisingly not often asked and has yet to receive a more precise answer: considering that the Australian population generally agrees that company executives, especially CEOs and managing directors, are overpaid, what is the quantum or the relative level of this overpayment? This submission is largely based on the work and methodology I developed in my research project on CEO remuneration, completed in 2007 for the attainment of a Masters degree in Applied Finance at the Financial Services Institute of Australasia (FINSIA; now dispensed by Kaplan Professional). I have updated the sample used in the analysis to include all ASX200 companies between 2000 and 2008. While I refer to various results from my research project occasionally in this submission, I am focusing here on the methodology used to measure excess CEO remuneration and on the analysis of these measurements. For the interest of brevity, I chose not to include or attach to this document a copy of my report. Should the Commission be interested in the other results from my research project, I will obligingly supply a copy of the report on request. Patrick Robitaille 29th May 2009

…but we must never forget that excellent leaders cannot be
produced by rational methods, but only by luck. ‐ Karl Popper, The Open Society and Its Enemies,
Volume One: The Spell of Plato (p. 171)
CEO compensation shows on average a significant pay for luck. […] Well governed firms display less pay for luck. […] Better governance
means that there is more of an active principal and optimal contracting fits better. Worse governance means that there is less of an active principal and the CEO is more likely to set his own pay.
‐ M. Bertrand & S. Mullainathan, “Do CEOs Set Their Own Pay? The Ones Without Principal Do”, working paper,
January 2000 Lake Wobegon1 Ever heard of Lake Wobegon? Brainchild of 70’s American radio personality Garrison Keillor, this fictional place is characterized by the fact that “all the women are strong, all the men are good looking and all the children are above average”. In fact, almost everything from Lake Wobegon is above average, especially its population. Over the last 20 years, this charming location has experienced an influx of new inhabitants, attracted by the similarity between the town’s characteristics and their own assessment of their abilities, achievements and worth. These new inhabitants are known as “executives” and originated in larger numbers from the United States, but also from most of the industrialised nations of the world, including Australia. The initial pioneers from this influx visited Lake Wobegon at the beginning of the 90’s, not long after the war cry voiced by Jensen and Murphy, that executives were paid like bureaucrats and that we should encourage them to have some skin in the game by inciting them to increase (or create) their shareholding in the firm. One helpful instrument to achieve was the executive stock option, a product that was available in great abundance in Lake Wobegon. Some CEOs enjoyed their sojourn so much that they elected to stay permanently at Lake Wobegon and became company directors after retiring. After a few years, Lake Wobegon became quite popular, so much so that various governments showed interest and perhaps some concern, and required the inhabitants of the town to disclose some of their personal information, such as their level of remuneration and the composition of their packages. At around the same time, the popularity of Lake Wobegon and the greater availability of information about their inhabitants incited many remuneration consultants to become official travel agents for the town. The brochures about the location were full of comparisons between selected inhabitants, never referred to the outside world and clearly 1 I borrowed this idea from Bebchuk and Fried (2004), p.71.

identified the average and the median of all the remuneration components enjoyed by the inhabitants of Lake Wobegon. These travel brochures were not only made available to aspiring and incumbent CEOs, but mainly to company directors, the majority of them having chosen Lake Wobegon as their new abode. These directors would generally welcome migrating CEOs by offering them packages above the average or the median advertised in the brochures, in order to ensure that they will stay longer and maybe settle permanently, in order to ensure the continuous growth of the town and of its wealth. While Lake Wobegon prospers and prospers, the outside world is becoming increasingly unhappy with the privileges granted to the town’s inhabitants. Further, a risky joyride from some of the CEOs, under the supervision of some careless directors, has led to a disaster named “credit crunch” or “global financial crisis”, and has exacerbated the ill feelings of the outside world towards Lake Wobegon.
*** While this introduction appears highly caricatural, it nevertheless reflects the current state of executive remuneration in industrialised countries, including Australia. There is a general outcry from the public and even from governments against the excessive levels of remuneration awarded to some CEOs and the hubris shown by some company directors and executives in trying to justify that these pay packages are fully deserved. A lot of academic studies have been conducted on the current population from Lake Wobegon, mostly of American origin, and focusing mainly on identifying the main determinants of their remuneration. While this body of research has generated many interesting findings, there is one important question that has not really been examined: if CEOs and other executives are truly overpaid, what is the size of their excess remuneration? To attempt at answering this question, I will draw from the analysis framework I have built in my masters’ research project, which is based on the level of work theories of Elliott Jaques. The next section will outline the principles underlying the levels of work theories. The analysis methodology and the definition of the analysis sample will follow. The next three sections will present results from the analysis and supportive evidence for some of the elements of the Lake Wobegon caricature. I will then touch on briefly some of the results from my prior research project on CEO remuneration, before concluding with some commentary on a small number of topics related to the Productivity Commission inquiry.

The level of work methodology Most of the literature about executive compensation in the last twenty years was derived from two main theories: the agency theory and the managerial approach theory. The latter approach gave rise to theories that were more “structural” in their expression and had for objective to achieve some equity between compensation levels both within and outside the firm. For example, Simon, in the 50s, postulated that the compensation received by the top rank individuals in a firm was a function of the number of individual organizational levels present in a firm. While these theories and the practices they engendered, such as job evaluations, salary surveys and points systems, have been much criticised for being too deterministic, they are still widely used by human resources and remuneration consultants, and most likely have gained in popularity during the 1990’s. The equitable payment theories developed by Elliott Jaques2 in the 50’s and 60’s added more substance to the work of Simon and other earlier structural compensation theorists. Jaques’ theories have been developed following research and observations made about employee remuneration at the Glacier Metal Company and five other companies in the UK. His theories go beyond the simple definition of remuneration scales, as they also dictate a whole organisational framework that Jaques has labelled “requisite organization”. Jaques’ theories hinge on two main concepts: the time span of discretion and the felt‐fair payment for work or equitable payment. The time span of discretion aims to define the level of work of an individual and is defined as “the longest period which can elapse in a role before the manager can be sure that his subordinate has not been exercising marginally sub‐standard discretion continuously in balancing the pace and quality of his work”.3 In other words, it represents the estimated duration of the task with the longest target completion time over which the individual has complete responsibility in performance and outcome. For example, in a general insurance company, we would most find at the lowest organisational level claims officers whose tasks can be roughly summarized as dealing with claims and enquiries from customers; managing paperwork and correspondence in relation to these claims; investigating, assessing and reaching decisions on these claims; in more complex cases, litigating and reaching settlement on these claims. While most claims could be resolved in a matter of days, the most complex case could require (for example) up to two months. Therefore, the time span of discretion for these claims officers could be about two months. Jumping to the next organisational level, we can find the claims manager, generally responsible for a team of claims officers covering a defined geographical area. The claims manager could be responsible for the management and training of the claims officers; dealing with the most complex claims that can’t be handled by the claims officers; manage the yearly expense budget allocated to her team; organise the team’s workload in order to achieve yearly performance and budgetary targets. Based on these tasks, most of them being of a yearly nature, we could argue that this manager’s time span of discretion could be up to 12 months.
2 Jaques is also famous for having studied and described the phenomenon he coined as “mid‐life crisis”. 3 Jaques (1964) , Time‐Span Handbook, p. 17

Then, at the top echelon, you have the CEO or Managing Director (MD), whose time span of discretion will be much longer and depend on the size and scope of the company’s operations (e.g. is she leading a small, niche insurance operation in a defined market or a fully diversified general insurance conglomerate with overseas subsidiaries? Does she want to expand business in a new area of the local market or set up operations in a new country?) and can vary in the Australian context between 2 and 20 years. The time span of discretion defines the level of work (LOW) of a role or, put differently, the size of the position or how heavy the responsibility is in a specific role.4 The longer the time span of a role, the higher the level of work. Jaques has defined up to 8 LOWs based on work activity, complexity and time span of discretion. The table on the next page (Table 1) provides a description of each of the LOWs and their respective time spans, as proposed by Jaques. The second concept underlying Jaques’ theories is the concept of felt‐fair payment for work or equitable payment. Jaques defines equitable payment as “the common norms of payment which have been discovered to be held by individuals in roles of the same time span, when asked under confidential conditions to state what they would consider to be fair pay”.5 He derived these common norms from his investigations at Glacier, whose results suggested the “existence of an unrecognized system of norms of fair payment for any given level of work, unconscious knowledge of these norms being shared among the population engaged in employment work”.6 In a nutshell, this means that different roles or jobs, however different, but having in common the same time span of discretion, should be rewarded with comparable levels of remuneration. This also implies that differential patterns of payment between different time spans or levels of work should remain constant over time. Based on Jaques’ proposed LOWs and prior investigations, the table below (Table 2) provides an estimate of the pay differentials between each of the LOWs.
Table 2: Remuneration differentials by level of work Level Time span Remuneration
8 Lower bound: 50 years Lower bound: 32X 7 Upper bound: 50 years
Lower bound: 20 years Upper bound: 32X Lower bound: 16X
6 Upper bound: 20 years Lower bound: 10 years
Upper bound: 16X Lower bound: 8X
5 Upper bound: 10 years Lower bound: 5 years
Upper bound: 8X Lower bound: 4X
4 Upper bound: 5 years Lower bound: 2 years
Upper bound: 4X Lower bound: 2X
3 Upper bound: 2 years Lower bound: 1 year
Upper bound: 2X Lower bound: 1X
2 Upper bound: 1 year Lower bound: 3 months
Upper bound: 1X Lower bound: 0.55X
1 Upper bound: 3 months Upper bound: 0.55X
4 Jaques (1990), Requisite Organization, page pair 37 5 Jaques (1964), Time‐Span Handbook, p. 7. Jaques received some criticism on the methodology he used to investigate the felt‐fair pay concept. In Dornstein (1991; p. 24), it is reported that “the potential of interviewer bias is great in the absence of clear established criteria for perceiving an interviewee’s ‘system of unrecognized norms’”, that “the definition, identity, and importance of the social referent and the pay‐related dimension [of comparison] are not presented explicitly in Jaques’ theory of equity”, and that no measures of dispersion (variance or other) have been reported for Jaques’ results. Neverthless, discussions with compensation consultants seem to indicate that other compensation methodologies (such as job evaluation and the Hay points system) provide scales of pay that are similar to the model proposed by Jaques and that this pay hierarchy seems to happen “naturally”. 6 Jaques (1970), Equitable Payment, p. 146

Lower bound: Less than 1 day Lower bound: 0.31X
Source: Jaques (1991), page pair 41


Table 1: Levels of work – Time spans, themes and description Level Time span Typical Title Theme Level of work – Definition Likely company classification
8 Over 50 years International Managing Director/ Chief Executive
Visionary Anticipates the needs and trends of society globally and nationally and develops concepts and/or products that leave a profound imprint for current and future generations. Contributions to societal and cultural changes
Microsoft; General Electric; Wal‐Mart
7 Up to 50 years Managing Director/Chief Executive
Vision & Strategy Judges the needs of society globally and nationally and determines the business entities to create to satisfy them. Relates society’s culture to that of the corporation.
Rio Tinto; Telstra; National Australia Bank
6 Up to 20 years Group Executive Strategic Develops concepts and judges corporate priorities. Networks globally. Understands and attempts to influence national and international activities in areas of responsibility. Balance sheet accountability.
Suncorp; Woolworths; Qantas
5 Up to 10 years General Manager/Chief Executive
Planning Determines and implements policy and direction for a business entity. Continuously monitors and anticipates changes that affect the entity (both internal and external) and makes appropriate adjustments.
David Jones; Bank of Queensland; CSL
4 Up to 5 years Chief Manager Organisational Pursues composite goals by planning and implementing several projects at the same time. Adjusts the interaction of projects as required.
Cabcharge; Seek; GUD Holdings
3 Up to 2 years Manager Operational Develops plans with several ways of getting the work done. Determines the best way and implements it. Anticipates problems and can switch to a better option if judged necessary.
Most companies outside ASX/S&P 300
2 Up to 1 year Team Leader/Supervisor
Organising Performs tasks where output cannot be fully anticipated. Able to reflect on events, anticipate problems and determines solutions. First level of supervision.
1 Up to 3 months Officer/Team Member Actioning Hands‐on work at operating level. Performs tasks with prescribed outputs. Solves problems using previously learned methods or seeks further instruction.
Sources: Robitaille (2007); adapted initially from material provided by Godfrey Remuneration (reproduced with permission) and Jaques (1991), page pair 41

While Jaques recommends that an organization should have as few organizational levels as there are LOWs present within the firm7, the remuneration within each LOW should be subdivided into smaller strata or pay and progression bands, reflecting the exact nature of the role, its time‐span of discretion and the achieved standard of effectiveness and competency of its incumbent8. In Australia, Jaques’ theories have found a first direct application in the 80’s and 90’s at CRA (now Rio Tinto) under the then‐CEO Roderick Carnegie.9 More recently, the financial services conglomerate Suncorp has reviewed its whole organisational structure using the salient aspects of Jaques’ theories, following the acquisition of GIO from AMP.10 The theories have also triggered some interest within other financial services companies, such as Insurance Australia Group (IAG)11 and Westpac12. While this does not constitute evidence of widespread application of Jaques’ theories within Australian corporations, this model can still be applied to proxy or predict the level of CEO remuneration for specific companies, according to their estimated number of LOWs. From these predictions and the observed level of remuneration, we can derive a measure of excess CEO remuneration.
7 Jaques (1991), Requisite Organization, page pair 41 8 See Table 2.3 in Robitaille (2007). 9 For an overview of the impact it had on CRA/Rio Tinto, see Botsman (1996) and Trinca (1997). 10 I have witnessed and experienced first‐hand these changes and their implementation, having been an employee at Suncorp at the time of the restructure. 11 See Hall (2004). 12 See Fox and Trinca (2001). We could probably also include Fairfax Holdings, as Fred Hilmer, CEO of Fairfax until 2005, was a consultant with McKinsey in the 80’s and has had dealings with both Jaques and Rod Carnegie (see Trinca (1997)).
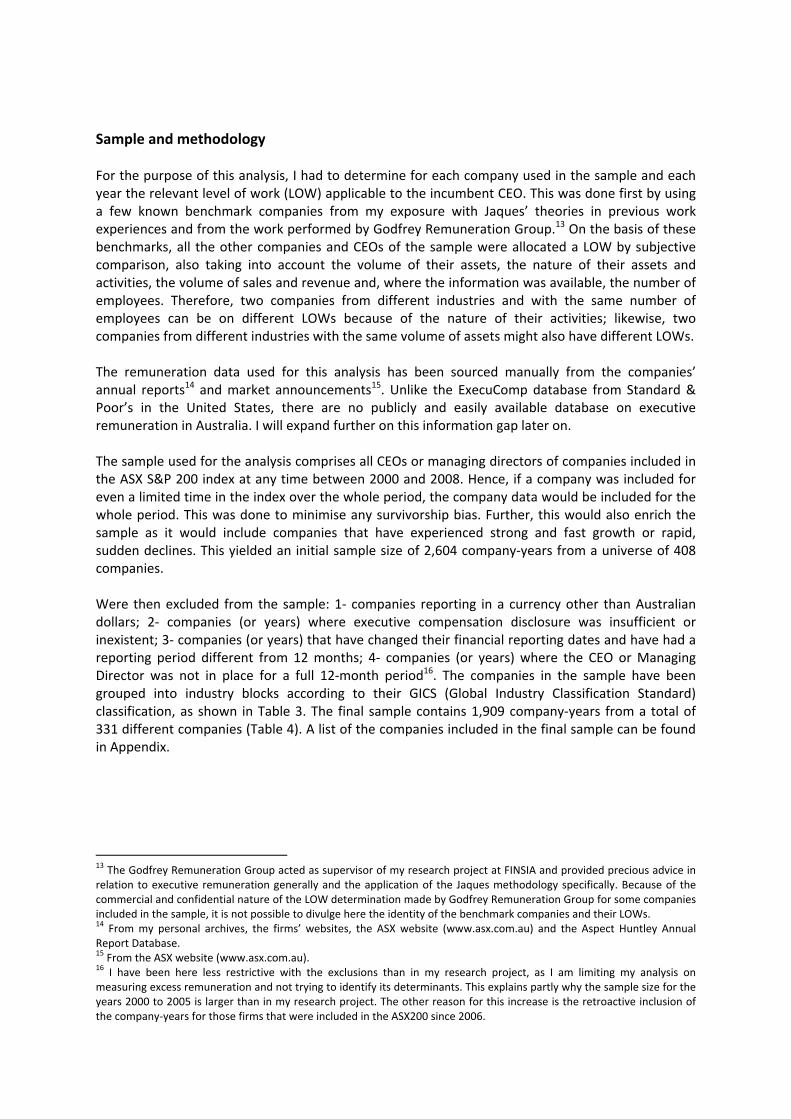
Sample and methodology For the purpose of this analysis, I had to determine for each company used in the sample and each year the relevant level of work (LOW) applicable to the incumbent CEO. This was done first by using a few known benchmark companies from my exposure with Jaques’ theories in previous work experiences and from the work performed by Godfrey Remuneration Group.13 On the basis of these benchmarks, all the other companies and CEOs of the sample were allocated a LOW by subjective comparison, also taking into account the volume of their assets, the nature of their assets and activities, the volume of sales and revenue and, where the information was available, the number of employees. Therefore, two companies from different industries and with the same number of employees can be on different LOWs because of the nature of their activities; likewise, two companies from different industries with the same volume of assets might also have different LOWs. The remuneration data used for this analysis has been sourced manually from the companies’ annual reports14 and market announcements15. Unlike the ExecuComp database from Standard & Poor’s in the United States, there are no publicly and easily available database on executive remuneration in Australia. I will expand further on this information gap later on. The sample used for the analysis comprises all CEOs or managing directors of companies included in the ASX S&P 200 index at any time between 2000 and 2008. Hence, if a company was included for even a limited time in the index over the whole period, the company data would be included for the whole period. This was done to minimise any survivorship bias. Further, this would also enrich the sample as it would include companies that have experienced strong and fast growth or rapid, sudden declines. This yielded an initial sample size of 2,604 company‐years from a universe of 408 companies. Were then excluded from the sample: 1‐ companies reporting in a currency other than Australian dollars; 2‐ companies (or years) where executive compensation disclosure was insufficient or inexistent; 3‐ companies (or years) that have changed their financial reporting dates and have had a reporting period different from 12 months; 4‐ companies (or years) where the CEO or Managing Director was not in place for a full 12‐month period16. The companies in the sample have been grouped into industry blocks according to their GICS (Global Industry Classification Standard) classification, as shown in Table 3. The final sample contains 1,909 company‐years from a total of 331 different companies (Table 4). A list of the companies included in the final sample can be found in Appendix.
13 The Godfrey Remuneration Group acted as supervisor of my research project at FINSIA and provided precious advice in relation to executive remuneration generally and the application of the Jaques methodology specifically. Because of the commercial and confidential nature of the LOW determination made by Godfrey Remuneration Group for some companies included in the sample, it is not possible to divulge here the identity of the benchmark companies and their LOWs. 14 From my personal archives, the firms’ websites, the ASX website (www.asx.com.au) and the Aspect Huntley Annual Report Database. 15 From the ASX website (www.asx.com.au). 16 I have been here less restrictive with the exclusions than in my research project, as I am limiting my analysis on measuring excess remuneration and not trying to identify its determinants. This explains partly why the sample size for the years 2000 to 2005 is larger than in my research project. The other reason for this increase is the retroactive inclusion of the company‐years for those firms that were included in the ASX200 since 2006.

Table 3: Industry blocks Industry block GICS classification Consumers Consumer Durables & Apparel; Consumer Services; Food & Staples
Retailing; Food, Beverage & Tobacco; Media; Retailing Financials Banks; Diversified Financials; Insurance and Real Estate Industrials Automobile & Components; Capital Goods; Commercial Services & Supplies;
Transportation; Utilities Resources Materials and Energy Technology Health Care, Equipment & Services; Pharmaceuticals, Biotechnology & Life
Sciences; Semiconductors & Semiconductor Equipment; Software & Services; Technology, Hardware & Equipment; Telecommunication Services
Table 4: Final sample (number of companies, by financial year) Industry block 2000 2001 2002 2003 2004 2005 2006 2007 2008 Consumers 40 40 42 40 39 44 41 38 34 Financials 32 26 32 36 39 41 43 35 34 Industrials 38 35 38 33 41 42 37 41 42 Resources 50 58 59 71 69 61 69 64 55 Technology 41 38 44 43 35 36 36 29 28
Total 201 197 215 223 223 224 226 207 193 Level of work 2000 2001 2002 2003 2004 2005 2006 2007 2008
LOW 3 27 22 20 23 20 18 17 10 6 LOW 4 72 84 90 90 89 83 78 69 64 LOW 5 77 72 81 83 87 92 103 97 97 LOW 6 19 13 19 21 23 26 24 26 22 LOW 7 6 6 5 6 4 5 4 5 4 Total 201 197 215 223 223 224 226 207 193
The measurement of excess CEO remuneration involves two separate components: a measure of actual, observed CEO remuneration and an estimate of total CEO remuneration using Jaques’ levels of work model. To determine the actual CEO remuneration under analysis, I only considered two components of the usual CEO pay package: first, the base salary, which will include the cash salary, contributions to superannuation, and any additional non‐cash benefits17, as disclosed in the annual reports; second, the short‐term incentives (STI) or annual bonuses, regardless of the manner they have been paid (cash or shares). I deliberately left aside all long‐term incentives or equity‐based payments, for methodological reasons detailed in my research project, revolving around the lack of comparability caused by the use of different valuation assumptions and methods across companies. Nevertheless, this omission should not impede the demonstration that CEOs are on average overpaid. If the data demonstrates that Australian CEOs are on average overpaid compared to the expected wages attached to their LOW, on the basis of the sole base salary and short‐term incentives, we can conclude that long‐term incentives just add to this overpayment and that the increasing trend in the use of option plans in the 90s and performance rights in recent years cannot be justified as an increase of the at‐risk portion of CEO remuneration replacing a portion of cash
17 The only non‐cash benefit that has not been included is the value of the interest foregone on preferential or interest‐free employee or executive loans. This was omitted for various reasons: first, the details of these loans have not always been fully disclosed (if disclosed at all); second, when disclosed, the assumptions related to the interest rate applicable varied greatly from one company to another, so much so that all amounts would have required recalculation using uniform assumptions; third, the exact purpose of these loans would have warranted in some cases (e.g. loans to purchase shares or options) a reclassification as long‐term incentive costs rather than short‐term. Therefore, the amount of foregone interest has been left out of the non‐cash benefits unless it was impossible to isolate these costs from the overall amount of non‐cash benefits.

salary, but rather as an incremental component of remuneration. Prior research efforts have led to the same conclusion. Goodwin and Kent (2004) showed that the level of remuneration paid to the CEO is significantly and positively related to the existence of an executive stock option (ESO) plan, which suggests that firms are using these plans as an additional component of remuneration rather than a replacement. In order to develop an estimate of CEO remuneration using the pay differentials and the level of work theory proposed by Jaques, I have used a bottom‐top approach where I first gathered wage information in order to define the upper and lower bounds of the first level of work (LOW 1). Once these bounds defined, I would then extrapolate these bounds for each of the LOWs, following Jaques’ pay differentials. This “pay structure” would then be replicated at various points across the time period under examination to take into account wage inflation. To define the LOW 1 bounds, I have used the data from the biennial wage survey Employee Earnings and Hours, Australia (6360.0), conducted and published by the Australian Bureau of Statistics (ABS). The surveys for May 1998, 2000, 2002, 2004 and 2006 were used. Specifically, the data from the table Average Weekly Total Earnings and Hours Paid For, full‐time adult non‐managerial employees, detailed occupation, was extracted and normalised onto a 40‐hour week wage. The upper and lower bound were determined by selecting the occupations with the highest and lowest weekly wage whose duties corresponded to LOW 1. Those occupations were Hairdresser (lower bound) and Police Officer (upper bound)18. The data points from the surveys were interpolated across the whole period of this analysis using supplementary data on the evolution of specific occupation wage indices from Labour Price Index, Australia, Total Hourly Rate of Pay Excluding Bonuses (6345.0) by the ABS and by applying cubic spline interpolation techniques. Monthly interpolation has been performed to enable matching with the varying financial year dates adopted by companies. Table 5 below shows the lower and bounds for LOWs 3 to 8 for the month of June during the period under analysis. Table 5: Estimated lower and upper bounds by level of work Lower bounds 1999 2000 2001 2002 2003 2004 2005 2006 2007 LOW 3 $85,389 $87,630 $90,230 $93,068 $96,032 $99,182 $102,580 $106,184 $109,933 LOW 4 $170,777 $175,261 $180,460 $186,137 $192,065 $198,365 $205,159 $212,369 $219,866 LOW 5 $341,555 $350,522 $360,920 $372,273 $384,129 $396,730 $410,319 $424,737 $439,733 LOW 6 $683,109 $701,043 $721,841 $744,546 $768,259 $793,459 $820,637 $849,474 $879,465 LOW 7 $1,366,219 $1,402,087 $1,443,682 $1,489,092 $1,536,518 $1,586,918 $1,641,274 $1,698,948 $1,758,931 LOW 8 $2,732,437 $2,804,174 $2,887,363 $2,978,185 $3,073,035 $3,173,836 $3,282,549 $3,397,897 $3,517,862 Upper bounds 1999 2000 2001 2002 2003 2004 2005 2006 2007 LOW 3 $168,114 $177,557 $180,505 $182,179 $187,280 $194,538 $202,134 $210,175 $218,944 LOW 4 $336,227 $355,114 $361,009 $364,358 $374,561 $389,075 $404,268 $420,350 $437,888 LOW 5 $672,454 $710,228 $722,019 $728,717 $749,122 $778,151 $808,537 $840,700 $875,776 LOW 6 $1,344,908 $1,420,457 $1,444,038 $1,457,433 $1,498,244 $1,556,301 $1,617,073 $1,681,399 $1,751,553 LOW 7 $2,689,817 $2,840,914 $2,888,075 $2,914,867 $2,996,488 $3,112,603 $3,234,146 $3,362,798 $3,503,106 LOW 8 $5,379,633 $5,681,827 $5,776,151 $5,829,734 $5,992,976 $6,225,205 $6,468,292 $6,725,597 $7,006,211
The excess CEO remuneration is simply the difference between the actual CEO remuneration and the estimated CEO remuneration using the LOW bounds. The LOW bounds chosen are the ones applicable at the beginning of the company’s financial year (hence, 30/06/2007 for financial year ending 30/06/2008). Two measures of excess CEO remuneration (base salary only and base salary plus STI) will be used against the LOW bounds for the analysis. Therefore, the excess CEO
18 It could be argued that the choice of these two occupations leads to a gender bias in terms of remuneration. This bias could lead to broader wage differential between the bounds compared to Jaques’ model. The choice of two gender‐neutral professions would perhaps have yielded a differential closer to Jaques’ values.

remuneration will be expressed as a range, the lowest bound being the measure of excess CEO remuneration above the LOW upper bound (minimum excess) and the highest bound being the measure of excess CEO remuneration above the LOW lower bound (maximum excess). The use of a range of excess CEO remuneration rather than an absolute figure is dictated by the fact that the measurement only takes into account the level of work applicable to the CEO and that the current analysis ignores other factors that could influence remuneration19. For example, has the company recently “graduated” to a higher LOW, with estimated remuneration closer to the lower bound, or is it close to move to a higher LOW, with estimated remuneration closer to the upper bound of the current LOW? Also, performance might also have an impact, especially in the case of the STIs received by the CEO. Finally, as implied from the agency theory propounded by Jensen and Meckling, CEOs are majority or substantial shareholders of their companies are expected to earn less than other CEOs with no shareholdings; hence, we should expect a lower excess remuneration.
19 This is a different approach from the one I used in my research project, where I only considered the measure of excess CEO remuneration based on the lower bound of the LOWs. This earlier choice was necessary as I wanted to identify the determinants of excess remuneration

Main results and analysis I will first present a relative measure of the excess CEO remuneration according to the respective LOWs. The results for the excess salary are shown in Table 6, while Table 7 contains the results for the excess measure including both salary and STI components. The tables are divided in two sections corresponding to the measures of minimum and maximum excess remuneration based respectively on the upper and lower bounds of the LOWs. A first finding from Table 6 is that, in 2008, CEOs on average receive a base salary that is between 32.7% and 164.7% above what they should normally earn. These percentages have increased continuously since 2000 (except in 2004), from respective values of 10.8% and 118.9%. As the bounds of the LOWs follow the evolution of the Labour Price Index, it confirms irrefutably what has been reported over the years: CEO salaries are rising faster than the salaries of the rest of the population. Brown and Samson (2003) report that the ratio of CEO remuneration to the average weekly earnings varies from 27 to 50 times from the mid‐90’s to 2003. Shields (2005) estimated that this ratio increased from 18 times in 1990 to 63 times in 2005. The percentages of excess salary vary in magnitude and over time from LOW to LOW. While the percentages have been generally above the average for LOW 3 companies, a different story emerges for the other LOWs. Companies in LOW 4 and 5 experienced a steady increase of the excess salary bounds, always around the overall average. The percentages for LOW 6 companies were well below average until 2005, after which they have been the highest of all LOWs. Finally, companies in LOW 7 appeared to have been underpaying their CEOs in 2000 with negative excesses, but have since caught up. The results for LOW 7 are harder to interpret because of the small number of companies in this sub‐sample20. Table 6: Average excess CEO remuneration (salary only) by level of work, relative to the LOW bounds Excess salary from upper bound 2000 2001 2002 2003 2004 2005 2006 2007 2008
LOW 3 28.88% 30.17% 24.35% 33.62% 26.57% 41.46% 22.86% 46.12% 37.77% LOW 4 6.60% 8.09% 12.81% 21.34% 22.56% 28.99% 28.54% 26.20% 34.56% LOW 5 15.84% 14.87% 18.43% 18.57% 16.85% 20.71% 21.81% 27.45% 29.14% LOW 6 1.07% 16.30% 10.58% 10.05% 8.93% 35.77% 44.93% 51.43% 48.92% LOW 7 ‐53.08% ‐48.17% ‐43.25% ‐40.92% ‐33.10% ‐31.60% 9.41% ‐8.06% ‐7.43%
All sample 10.83% 11.86% 14.50% 18.84% 18.29% 26.02% 26.45% 30.09% 32.70% Excess salary from lower bound 2000 2001 2002 2003 2004 2005 2006 2007 2008
LOW 3 154.52% 163.91% 148.63% 161.69% 147.24% 177.69% 142.10% 189.23% 174.78% LOW 4 110.67% 119.14% 125.49% 137.68% 139.38% 153.32% 153.48% 150.08% 168.20% LOW 5 128.63% 132.85% 136.78% 132.24% 128.29% 137.22% 140.49% 152.72% 157.59% LOW 6 99.84% 135.73% 120.92% 115.63% 113.00% 166.84% 186.13% 200.33% 197.31% LOW 7 ‐5.34% 5.50% 13.24% 15.89% 30.96% 34.80% 116.37% 82.66% 84.96%
All sample 118.95% 126.79% 128.88% 132.78% 131.09% 147.59% 149.52% 157.89% 164.67%
Fairly similar (but more spectacular) conclusions can be reached from the examination of Table 7, where the excess CEO remuneration now includes short‐term incentives. The excess CEO remuneration would range in 2008 between 97.2% and 293.1% above what they would normally earn. In 2000, it was ranging from 48.5% to 193.1%. LOW 3 companies have been under the average and weakly increasing over the whole period, owing perhaps to their more limited capacity to pay 20 On a very simplistic level, if we had a sufficient sample for each of the LOWs, if the companies within these LOWs fully represent on average these LOWs and if their CEOs were on average reasonably remunerated, the percentage of excess salary from the upper bound would be around ‐25% and the percentage of excess salary from the lower bound would be around 50%.

cash incentives. LOW 4 and LOW 7 were generally tracking below the average, but increasing at a reasonable trend. LOW 5 and especially LOW 6 companies have been the most generous towards their CEOs when it comes to short‐term incentives, with their lower excess bound being in excess of 100% and their upper excess bound exceeding 300%. Table 7: Average excess CEO remuneration (salary + STI) by level of work, relative to the LOW bounds Excess salary + STI from upper bound 2000 2001 2002 2003 2004 2005 2006 2007 2008
LOW 3 32.30% 40.98% 31.74% 42.56% 32.41% 59.50% 34.83% 47.91% 37.77% LOW 4 22.21% 22.74% 31.09% 47.02% 53.14% 66.45% 87.86% 107.88% 74.31% LOW 5 84.07% 72.85% 78.48% 79.56% 70.41% 95.30% 108.15% 106.66% 102.75% LOW 6 48.90% 60.47% 62.55% 101.00% 117.74% 157.48% 182.79% 207.78% 158.80% LOW 7 ‐21.75% ‐19.16% ‐4.24% 1.54% 19.40% 38.36% 75.22% 85.50% 77.77%
All sample 48.47% 44.30% 50.96% 62.53% 64.08% 87.68% 102.97% 116.42% 97.17% Excess salary + STI from lower bound 2000 2001 2002 2003 2004 2005 2006 2007 2008
LOW 3 161.26% 185.83% 163.41% 179.18% 158.63% 213.09% 165.68% 192.76% 174.78% LOW 4 141.39% 148.82% 162.06% 187.94% 199.02% 226.81% 270.39% 311.75% 247.36% LOW 5 262.97% 250.33% 256.92% 251.61% 232.75% 283.53% 310.61% 309.50% 304.20% LOW 6 194.01% 225.24% 224.89% 293.66% 325.19% 405.57% 457.78% 509.79% 416.14% LOW 7 56.34% 64.29% 91.29% 99.00% 133.34% 172.01% 246.05% 267.84% 254.66%
All sample 193.07% 192.52% 201.83% 218.30% 220.39% 268.53% 300.31% 328.76% 293.06%
Even allowing for a certain portion of the excess remuneration to truly represent performance of some nature, the fact is that CEOs on average are earning almost twice as much as the amount they should be earning, including short‐term incentives. And we won’t even consider long‐term incentives… The next two tables present absolute measures of the excess CEO remuneration according to the respective industry blocks. The average absolute measures reflect the same values underlying the average relative measures of Tables 6 and 7. We can see, from Table 8, that the average excess CEO salary in 2008 is contained between $273,303 and $705,673. The averages are lowest for companies in the Technology and the Resources block. The average for the Industrial block generally tracked the overall average. The Consumers block had the highest averages until 2007‐2008, when the Financials block took the mantle after years of catching up from an apparent situation of either CEO under‐remuneration or reasonable remuneration in 2000. Table 8: Average excess CEO remuneration (salary only) by industry block, relative to the LOW bounds Excess salary from upper bound 2000 2001 2002 2003 2004 2005 2006 2007 2008 Consumers $222,590 $241,519 $216,423 $220,292 $252,427 $283,872 $415,107 $409,929 $415,925 Financials ‐$197,567 ‐$249,031 ‐$137,190 ‐$138,533 ‐$58,072 $126,106 $233,998 $271,403 $426,383 Industrials $62,808 $68,323 $72,486 $157,470 $117,256 $210,992 $213,866 $243,861 $271,577 Resources ‐$30,472 $8,782 $34,479 $71,161 $85,822 $106,057 $97,979 $224,779 $183,759 Technology ‐$15,306 ‐$2,358 $67,832 $34,612 $8,553 $61,094 $134,661 $90,476 $92,714
Average $14,015 $30,442 $58,014 $69,784 $83,446 $157,104 $206,207 $251,615 $273,303 Excess salary from lower bound 2000 2001 2002 2003 2004 2005 2006 2007 2008 Consumers $545,296 $561,125 $568,382 $577,220 $609,574 $679,858 $824,823 $833,760 $911,867 Financials $257,228 $299,048 $327,061 $350,285 $396,365 $651,043 $735,034 $887,733 $1,020,486 Industrials $363,992 $356,066 $395,346 $497,953 $447,420 $563,581 $575,195 $652,546 $669,286 Resources $211,297 $263,758 $295,324 $320,218 $342,619 $376,673 $408,450 $568,166 $546,692 Technology $221,476 $238,987 $313,742 $279,450 $290,813 $345,189 $439,541 $424,795 $439,885
Average $316,021 $340,416 $374,837 $389,611 $409,843 $516,432 $578,376 $667,583 $705,673
If we include the short‐term incentives Table 9, the average excess CEO remuneration in 2008 would range from $936,255 to $1,368,625. These figures are lower than the 2007 averages, mainly due to

the removal from the Financials sub‐sample of firms that were either affected by the global financial crisis (e.g. Babcock & Brown) or that changed CEOs during the financial year (e.g. Macquarie Group). Since 2000, the bounds of this range have more than tripled, as they were only respectively $295,319 and $597,325. We can isolate the contribution of short‐term incentives to the excess CEO remuneration by simply subtracting the results of Table 8 from the results of Table 9. Hence, STIs have added an average of $281,304 to the average excess CEO remuneration in 2000; this amount has crept to $662,952 in 2008, while it peaked in 2007 at $832,848. Table 9: Average excess CEO remuneration (salary + STI) by industry block, relative to the LOW bounds Excess salary + STI from upper bound 2000 2001 2002 2003 2004 2005 2006 2007 2008 Consumers $495,650 $434,590 $456,639 $537,325 $777,727 $753,926 $1,042,965 $968,672 $1,141,192 Financials $496,736 $553,393 $680,595 $789,616 $767,160 $1,558,635 $2,029,913 $2,648,827 $1,487,398 Industrials $253,167 $266,062 $376,778 $643,616 $389,905 $632,860 $690,237 $911,659 $946,769 Resources $60,759 $124,681 $174,503 $259,749 $330,902 $375,279 $405,130 $638,800 $646,624 Technology $267,785 $137,424 $184,589 $160,502 $247,129 $414,198 $447,083 $576,012 $571,304
Average $295,319 $271,764 $342,758 $432,746 $483,042 $720,804 $883,343 $1,084,464 $936,255 Excess salary + STI from lower bound 2000 2001 2002 2003 2004 2005 2006 2007 2008 Consumers $818,357 $754,195 $808,598 $894,253 $1,134,875 $1,149,911 $1,452,681 $1,392,503 $1,637,135 Financials $951,531 $1,101,472 $1,144,846 $1,278,434 $1,221,597 $2,083,571 $2,530,948 $3,265,157 $2,081,502 Industrials $554,352 $553,804 $699,638 $984,099 $720,070 $985,449 $1,051,566 $1,320,345 $1,344,477 Resources $302,529 $379,657 $435,348 $508,806 $587,699 $645,894 $715,601 $982,187 $1,009,557 Technology $504,567 $378,769 $430,499 $405,340 $529,388 $698,293 $751,963 $910,330 $918,475
Average $597,325 $581,739 $659,581 $752,573 $809,440 $1,080,132 $1,255,512 $1,500,431 $1,368,625
Before moving on to further analysis, I would like to address here one great fallacy concerning executive remuneration, especially CEO remuneration: the concept of remuneration at risk. Since the introduction of disclosure requirements regarding executive remuneration and the greater desire expressed by investors and the population in general for a better relationship between performance and remuneration, most annual reports now state the percentages of executive remuneration allocated between base salary, short‐term incentives and long‐term incentives, often labelling the latter two as remuneration “at‐risk”21. Over the years, a noticeable shift occurred from the percentage of base salary to the percentages of short‐term incentives and long‐term incentives. As noted by Brown and Samson (2003), in the mid‐90s, a typical CEO pay package would have comprised 70% salary, 20% in annual bonus and 10% in long‐term incentives. In 2003, it was estimated that the balance had become 52% salary, 17% short‐term incentives and 31% long‐term incentives. It is not infrequent now to see packages like “40% salary, 30% STI and 30% LTI” detailed in annual reports. For the average punter (and investor), it really looks like the poor CEO is putting a lot at risk, as he might end up with only 40% of what he could deserve if he fails to deliver. But I believe that this is, knowingly or not, another trick of spin designed by the travel agents to Lake Wobegon. First, these percentages hide the reality of the exaggerated monetary quantum of each of the components of remuneration. So, for example, a base salary of $1,000,000 might become more acceptable to the masses because it only represents, say, 40% of the overall package and that the other 60% is supposedly “at risk”. Second, as I have demonstrated above, Australian CEOs earn on average a base salary that is at least 32.7% in excess of what they should be earning. Since they are already earning what they should be worth, none of their remuneration is actually at risk. At worst,
21 Rather than using “performance‐based”, which is an equally dubious term, especially in instances where the performance benchmarks do not really set meaningful challenges to the executives, for example, when executive share options were not benchmarked against any neutral indicator or group of companies.

there is nothing more; otherwise, it is all upside, regardless of the percentage “at‐risk”. Finally, it is quite ironic that the word “risk”, defined in most dictionaries as “a chance or probability of danger, loss, injury, or other adverse consequences”, is used in executive remuneration as something that is only upside or nothing, rather than a loss. If remuneration consultants and company directors were truly serious about including some elements at risk within executive remuneration packages, they would probably design packages using the following logic: ‐ Determine the equitable level of annual remuneration for the executive/CEO, in consideration
with the overall company’s organisational structure and remuneration policies ‐ Set the base salary portion at 75% of this equitable level ‐ Set the short‐term incentive portion at a maximum value of 60% of this equitable level, so that
the maximum annual remuneration does not exceed 135% of this equitable value ‐ Choose a suitable set of benchmarks and, upon achievement of an average performance equal
to the benchmarks, award 41.6% of this amount (that is, 25%/60%) as STI; the “average” performing CEO would then earn 100% of the equitable level of his remuneration; the badly performing CEO could earn as little as 75% of this value and the high performing one would earn at most 135%
‐ Upon hiring (and only once), award long‐term incentives for a present value equal to a maximum of 100% of the current equitable level of remuneration, vesting only after at least five years, with suitable relative benchmarks and exercise scale; these incentives lapse if the CEO leaves the company before the end of the vesting period
Such a package would ensure that there is some downside in case of bad performance, while offering a reasonable relationship between performance and remuneration. Further, the single allocation of long‐term incentives instruments aims at curbing the overuse of this type of instrument (why do some CEOs get performance rights allocations every year?), while offering some incentive for the CEO to build long‐term value for the company22.
22 I have to admit that I did not spend much time thinking about or researching the long‐term incentive aspect of this proposed package. Perhaps the value of the single allocation might be greater. Nevertheless, the three principles around LTIs should remain: 1‐ one allocation only; 2‐ a reasonable present value to motivate the CEO; 3‐ adequate relative benchmarks in order to foster long‐term value building.

The survivors Of the overall sample used, only 30 CEOs or managing directors have remained at the helm of their companies for the nine years under analysis. Their identity and base salary over the last nine years are shown in Table 10. This table also displays as a comparison the evolution of the average weekly earnings over the same period. If we compare the average base salary increase for this sub‐sample against the growth of the average weekly earnings for the whole period, we can see that the average CEO base salary has grown around 3.5 times faster than the average weekly earnings. While some of this above‐average growth can be legitimately attributed to the company’s growth (e.g. the meteoric rise of Paladin Resources (PDN) from a small uranium explorer to a global uranium supplier explains a major part of the increase of CEO Borshoff’s base salary), it provides yet another proof of the ever increasing excess CEO remuneration we have shown in the preceding section. Only four CEOs have received a total increase in base salary that is lower than the growth of the average weekly earnings, while one saw his base salary decreased over the period (Blackman from Institute of Drug Technology (IDT)). I have italicized the CEOs whom I believe were reasonably paid over the whole period, that is, CEOs whose base salaries were contained within the bounds of the LOW applicable to their companies. Only seven CEOs fitted this criterion. However, it should be noted that three of them (Page from Harvey Norman (HVN), Tudehope from Macquarie Corporate Telecommunications (MAQ), Abedian Snr. from Sunland Group (SDG)) are either related to or one of the founders and majority shareholder of their company, while a fourth one (Tan from Autron (AAT)) is a substantial shareholder of his company. According to the tenets of the agency theory, these CEO‐principals, due to their related interest in a substantial shareholding, would normally earn less than other CEO‐agents. This leaves three CEOs (Simmons from Hills Industries (HIL), Dixon from Healthscope (HSP), Goldschmidt from Sonic Healthcare (SHL)) receiving a reasonable base salary without having strong connections to a substantial shareholding. Twelve CEOs have enjoyed increases greater than 200%, that is, their base salaries have more than tripled over the nine years under observation. The application of the level of work methodology on my sample led me to observe two approximate rules of thumb to justify an increase of 100% of base salary: either the number of employees has increased tenfold or the volume of assets of the company has grown tenfold. This means that we would expect these CEOs with tripled salaries to be at helm of companies that have grown 100 times the size they were in 2000. With the exception of Paladin Resources (PDN), none of the other eleven companies can claim to have experienced this type of growth. In fact, there is even one company (Toll Holdings (TOL)) that has shrunk in size by about a third in 2007 after a spin‐off (Asciano (AIO)), yet its CEO’s base salary increased by 10% in 2008…
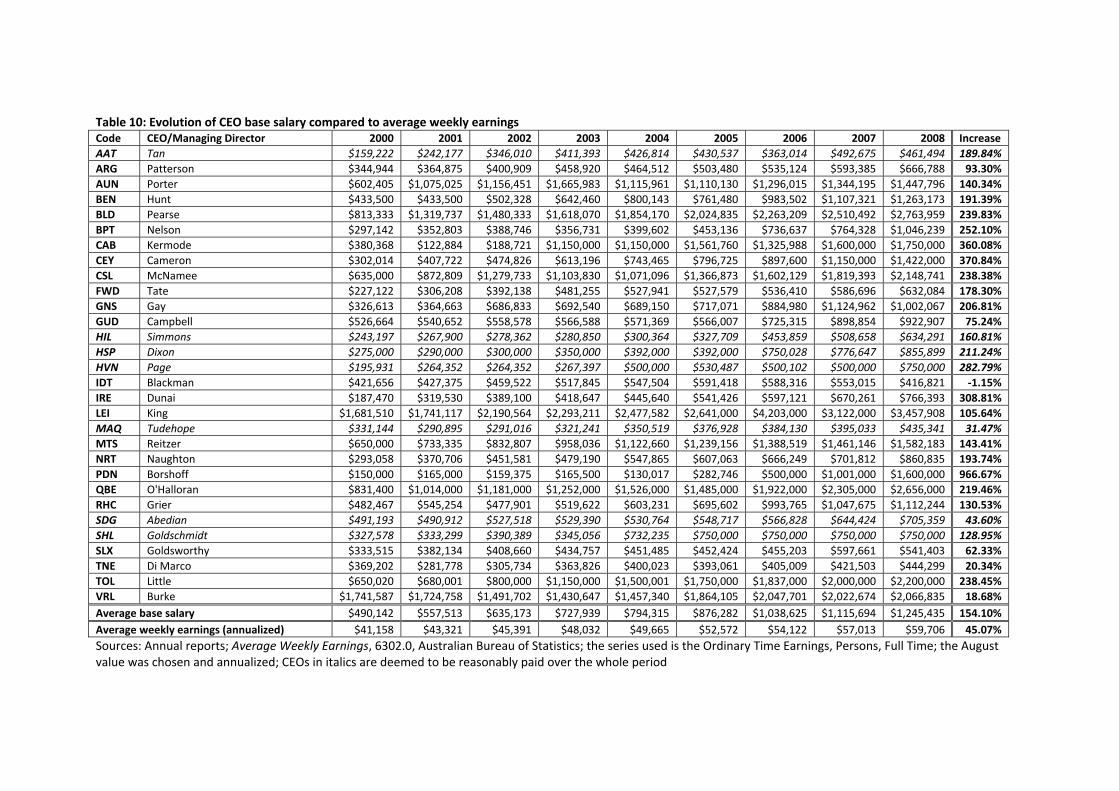
Table 10: Evolution of CEO base salary compared to average weekly earnings Code CEO/Managing Director 2000 2001 2002 2003 2004 2005 2006 2007 2008 Increase AAT Tan $159,222 $242,177 $346,010 $411,393 $426,814 $430,537 $363,014 $492,675 $461,494 189.84% ARG Patterson $344,944 $364,875 $400,909 $458,920 $464,512 $503,480 $535,124 $593,385 $666,788 93.30% AUN Porter $602,405 $1,075,025 $1,156,451 $1,665,983 $1,115,961 $1,110,130 $1,296,015 $1,344,195 $1,447,796 140.34% BEN Hunt $433,500 $433,500 $502,328 $642,460 $800,143 $761,480 $983,502 $1,107,321 $1,263,173 191.39% BLD Pearse $813,333 $1,319,737 $1,480,333 $1,618,070 $1,854,170 $2,024,835 $2,263,209 $2,510,492 $2,763,959 239.83% BPT Nelson $297,142 $352,803 $388,746 $356,731 $399,602 $453,136 $736,637 $764,328 $1,046,239 252.10% CAB Kermode $380,368 $122,884 $188,721 $1,150,000 $1,150,000 $1,561,760 $1,325,988 $1,600,000 $1,750,000 360.08% CEY Cameron $302,014 $407,722 $474,826 $613,196 $743,465 $796,725 $897,600 $1,150,000 $1,422,000 370.84% CSL McNamee $635,000 $872,809 $1,279,733 $1,103,830 $1,071,096 $1,366,873 $1,602,129 $1,819,393 $2,148,741 238.38% FWD Tate $227,122 $306,208 $392,138 $481,255 $527,941 $527,579 $536,410 $586,696 $632,084 178.30% GNS Gay $326,613 $364,663 $686,833 $692,540 $689,150 $717,071 $884,980 $1,124,962 $1,002,067 206.81% GUD Campbell $526,664 $540,652 $558,578 $566,588 $571,369 $566,007 $725,315 $898,854 $922,907 75.24% HIL Simmons $243,197 $267,900 $278,362 $280,850 $300,364 $327,709 $453,859 $508,658 $634,291 160.81% HSP Dixon $275,000 $290,000 $300,000 $350,000 $392,000 $392,000 $750,028 $776,647 $855,899 211.24% HVN Page $195,931 $264,352 $264,352 $267,397 $500,000 $530,487 $500,102 $500,000 $750,000 282.79% IDT Blackman $421,656 $427,375 $459,522 $517,845 $547,504 $591,418 $588,316 $553,015 $416,821 ‐1.15% IRE Dunai $187,470 $319,530 $389,100 $418,647 $445,640 $541,426 $597,121 $670,261 $766,393 308.81% LEI King $1,681,510 $1,741,117 $2,190,564 $2,293,211 $2,477,582 $2,641,000 $4,203,000 $3,122,000 $3,457,908 105.64% MAQ Tudehope $331,144 $290,895 $291,016 $321,241 $350,519 $376,928 $384,130 $395,033 $435,341 31.47% MTS Reitzer $650,000 $733,335 $832,807 $958,036 $1,122,660 $1,239,156 $1,388,519 $1,461,146 $1,582,183 143.41% NRT Naughton $293,058 $370,706 $451,581 $479,190 $547,865 $607,063 $666,249 $701,812 $860,835 193.74% PDN Borshoff $150,000 $165,000 $159,375 $165,500 $130,017 $282,746 $500,000 $1,001,000 $1,600,000 966.67% QBE O'Halloran $831,400 $1,014,000 $1,181,000 $1,252,000 $1,526,000 $1,485,000 $1,922,000 $2,305,000 $2,656,000 219.46% RHC Grier $482,467 $545,254 $477,901 $519,622 $603,231 $695,602 $993,765 $1,047,675 $1,112,244 130.53% SDG Abedian $491,193 $490,912 $527,518 $529,390 $530,764 $548,717 $566,828 $644,424 $705,359 43.60% SHL Goldschmidt $327,578 $333,299 $390,389 $345,056 $732,235 $750,000 $750,000 $750,000 $750,000 128.95% SLX Goldsworthy $333,515 $382,134 $408,660 $434,757 $451,485 $452,424 $455,203 $597,661 $541,403 62.33% TNE Di Marco $369,202 $281,778 $305,734 $363,826 $400,023 $393,061 $405,009 $421,503 $444,299 20.34% TOL Little $650,020 $680,001 $800,000 $1,150,000 $1,500,001 $1,750,000 $1,837,000 $2,000,000 $2,200,000 238.45% VRL Burke $1,741,587 $1,724,758 $1,491,702 $1,430,647 $1,457,340 $1,864,105 $2,047,701 $2,022,674 $2,066,835 18.68% Average base salary $490,142 $557,513 $635,173 $727,939 $794,315 $876,282 $1,038,625 $1,115,694 $1,245,435 154.10% Average weekly earnings (annualized) $41,158 $43,321 $45,391 $48,032 $49,665 $52,572 $54,122 $57,013 $59,706 45.07% Sources: Annual reports; Average Weekly Earnings, 6302.0, Australian Bureau of Statistics; the series used is the Ordinary Time Earnings, Persons, Full Time; the August value was chosen and annualized; CEOs in italics are deemed to be reasonably paid over the whole period

Spot the difference Table 11 presents the evolution of CEO base salary for a selected company subset that experienced all their CEO changes at the beginning of a financial year (or within a few days of the date). These companies have had one or many CEO changes over the period under analysis. They all display the same pattern except for one company. What seems to be the pattern and which company differs from the others? Table 11: Evolution of CEO base salary for selected companies
Year CEO ASX Code Base Salary
CEO ASX Code Base Salary
CEO ASX Code Base Salary
2000 Clarke ALS $469,800 McFarlane ANZ $1,200,000 Kirby CSR $1,356,300 2001 Clarke ALS $499,703 McFarlane ANZ $1,500,000 Kirby CSR $1,426,600 2002 Clarke ALS $523,894 McFarlane ANZ $1,500,000 Kirby CSR $1,505,567 2003 Clarke ALS $550,059 McFarlane ANZ $1,500,000 Kirby CSR $1,655,115 2004 Clarke ALS $606,226 McFarlane ANZ $2,390,493 Brennan CSR $1,155,806 2005 Clarke ALS $600,000 McFarlane ANZ $2,303,971 Brennan CSR $1,197,935 2006 Clarke ALS $600,000 McFarlane ANZ $2,719,312 Brennan CSR $2,288,035 2007 Ryan ALS $700,000 McFarlane ANZ $3,624,446 Brennan CSR $2,404,235 2008 Ryan ALS $791,666 Smith ANZ $3,566,567 Maycock CSR $1,236,520
Year CEO ASX Code Base Salary
CEO ASX Code Base Salary
CEO ASX Code Base Salary
2000 Newman FCL $1,204,365 Emery LYC $232,744 Switkowski TLS $1,000,909 2001 Newman FCL $1,270,537 Emery LYC $258,054 Switkowski TLS $1,150,832 2002 Newman FCL $1,381,182 Curtis LYC $282,680 Switkowski TLS $1,245,850 2003 Newman FCL $1,277,076 Curtis LYC $278,222 Switkowski TLS $1,363,051 2004 Wozniczka FCL $1,216,800 Curtis LYC $350,487 Switkowski TLS $1,439,142 2005 Wozniczka FCL $1,257,719 Curtis LYC $400,000 Switkowski TLS $1,957,107 2006 Wozniczka FCL $1,324,360 Curtis LYC $339,988 Trujillo TLS $5,745,011 2007 Wozniczka FCL $1,444,301 Curtis LYC $416,715 Trujillo TLS $3,621,275 2008 Wozniczka FCL $1,653,523 Curtis LYC $432,640 Trujillo TLS $3,324,201
If we examine these companies one by one and hide the CEO column, you would see an almost continuous trend of base salary increases for five of these companies, as if there had been any change in CEO. The exception is CSR. It has reduced significantly the base salary of every new CEO incumbent23. The other companies either reduced only slightly the base salary on appointing a new CEO (ANZ, FCL) or increased it, sometimes quite substantially (ALS, LYC, TLS). There is definitely something wrong with this type of practice. In general, for any type of role in a company, from a clerk to a divisional manager, a new incumbent is expected to earn less than his/her predecessor, especially if his/her level of experience for the role is lesser than his/her predecessor. The same rule does not seem to apply to the majority of CEOs, even though new incumbents never had any experience as CEOs. This truly is a Lake Wobegon effect, whereby you should expect to treated as above‐average because you have attained an above‐average (if not the highest) position.
23 It must be said though that Brennan was appointed in 2003 just after the demerger of Rinker (RIN), which further justifies the reduction in base salary.

Other findings from research project As mentioned previously, my 2007 research project not only purported to measuring excess CEO remuneration, but also to identifying the determinants of CEO remuneration. In summary, here are some of the other findings made:
• After splitting the sample between overpaid CEOs and more reasonably paid CEOs, a statistically significant difference could be found in terms of tenure (overpaid CEOs have longer tenures) and of the proportion of non‐executive directors (NEDs) on the board (overpaid CEOs deal with greater proportions of NEDs)
• Regression on excess remuneration measures yielded: significant relationships with firm size, even after controlling for the LOW as a proxy for size; little or no relationship with various performance measures; governance and ownership variables (especially proportion of NEDs, tenure and CEO shareholding) provide some explanatory power to the models, but of fairly small magnitude, and sometimes in contradiction from one model to the other
• The influence of firm size on excess remuneration of overpaid CEOs is five times stronger when only base salary is considered and 2.27 times stronger when STIs are included; it also appears to be growing when CEOs reach higher levels of work; its influence also increases with the passage of time
• The best regression fit was obtained on the Resources block sub‐sample. The model showed positive and significant relationship between excess CEO remuneration and firm size, CEO tenure, board size and the proportion of busy directors (sitting on three boards or more); a significant negative relationship was found with leverage (gearing)
Because firm size was revealed as the most significant variable explaining excess CEO remuneration and most governance variables had practically no impact, I made the hypothesis that these results were the sign of a systemic effect across all companies; that is, regardless of other company fundamentals and of the corporate governance environment, directors seem to be mesmerised by firm size when they make decisions on executive pay. This hypnotic state has been further fuelled by the greater amount of information available on executive compensation following the introduction of greater disclosure requirements.24 Armed with all this information, these directors indulge into comparisons with other similarly sized companies when setting the terms of executive pay package. On the other hand, some have advanced the existence of a global market for corporate talent, pushing the price tag up for quality CEOs. However, Chaudri (2003) provides anecdotal evidence that seems to define the boundaries for movement of human capital within the local and regional markets and that boards of our major companies are almost entirely comprised of former Australian senior executives, with little international representation. Also, as Kerin (2003) noted, “Australian executives care much more about getting paid 5% less than the person down the hall than they do about getting paid a small fraction of what they could get paid overseas”. Therefore, it is conceivable that the firm size effect is a symptom of systemic “ratcheting”, where boards will offer to the CEO a pay package that is at least equal to the median of a group of comparable companies. Such “ratcheting” behaviour in the US is also reported in Bebchuk and Fried (2004). If the problem is systemic, it is proof that not only corporate governance is failing, but that a whole chain of agency links is broken. While the agency theory focused mainly on the obligations between the owners and the managers, other agent‐principal relationships are often forgotten when corporate governance is examined. The board directors act as agents for the shareholders, some of
24 This does not mean that disclosure must be avoided. Nevertheless, there is evidence that greater disclosure has caused a substantial increase in executive pay packages. See Craighead et al. (2004) for evidence in the Canadian context.

whom are institutional investors. These investors (managed funds, superannuation funds, etc.), through fiduciary duty obligations, are in turn agents of their beneficiaries. There are many claims made to the effect that board directors do not adequately represent the views of the shareholders and are more likely to side with the CEO; that institutional investors aren’t putting enough effort to represent the interests of their beneficiaries; and that the minority of engaged shareholders aren’t able to make itself heard. The easy way out, as proposed by many, would be to regulate executive remuneration and, for example, provide a binding nature to the votes of the remuneration reports and on CEO contracts. I do not subscribe to this point of view, as ill‐advised regulation is likely to cause more problems than resolve any. The Americans remember too well the effect of the tax deductibility limitations on executive remuneration and, more recently, the limited effectiveness of the Sarbanes‐Oxley Act. Further, I don’t think that too much regulation would fix the heart of the problem: average‐to‐bad corporate governance and limited shareholder involvement. While the following solution might not be the panacea, it might be worth giving some thought. For most publicly listed companies25, a shareholder council should be formed in addition to the board of directors. This shareholder council should comprise 3 to 5 members, all of whom are obviously shareholders, but neither a director, nor an executive or an employee of the company. The council’s main responsibilities would be to undertake the responsibilities of the nomination and remuneration committees, with representation from one non‐executive director on each committee. The council members should be elected at the annual general meeting and would be remunerated with the existing committee fees. With respect to the remuneration committee, the council would be responsible to obtain the relevant advice with respect to executive remuneration, with no specific budget restriction from the company’s management. The non‐executive director attending the council’s meetings would then report to the board any decision taken. This mechanism would certainly create an avenue through which shareholders, especially institutional investors, can become more active and can have some of their concerns better heard by the board. It would remove some of the influence, if not all, that the CEOs have on decisions regarding remuneration. Finally, it can create more opportunities for new directors to join the board, other than the usual board‐backed (and perhaps management‐backed) nominations.
25 I would probably exclude any company where a controlling interest greater than 40% exists.

Other aspects to consider In this final section, I will cover other aspects relative to the current inquiry, some of which evoked in the Issues Paper. These are not presented in any particular order. The ASX Corporate Governance Principles On page 10 of the Issues Paper, questions about the relationship between executive remuneration and other company employees are being raised. While most of this submission hinges on the demonstration of a model where this relationship is crucial, I would like to expose a subtle change made (inadvertently or not, I do not know) to the ASX Corporate Governance Principles which proves to some extent that this relationship is relatively unimportant for the members of the ASX Corporate Governance Council. The previous version (2003) of the corporate governance principle on remuneration read like this (bold characters are my emphasis): Principle 9: Remunerate fairly and responsibly Ensure that the level and composition of remuneration is sufficient and reasonable and that its relationship to corporate and individual performance is defined. This means that companies need to adopt remuneration policies that attract and maintain talented and motivated directors and employees so as to encourage enhanced performance of the company. It is important that there be a clear relationship between performance and remuneration, and that the policy underlying executive remuneration be understood by investors. How to achieve best practice Recommendation 9.1: Provide disclosure in relation to the company’s remuneration policies to enable
investors to understand (i) the costs and benefits of those policies and (ii) the link between remuneration paid to directors and key executives and corporate performance.
Recommendation 9.2: The board should establish a remuneration committee. Recommendation 9.3: Clearly distinguish the structure of non‐executive directors’ remuneration from that
of executives. Recommendation 9.4: Ensure that payment of equity‐based executive remuneration is made in accordance
with thresholds set in plans approved by shareholders. Recommendation 9.5: Provide the information indicated in Guide to reporting on Principle 9.
The current version (2007) of the same principle has been somewhat streamlined and morphed into the following: Principle 8: Remunerate fairly and responsibly Companies should ensure that the level and composition of remuneration is sufficient and reasonable and that its relationship to performance is clear. The awarding of remuneration is a key area of focus for investors. When setting the level and structure of remuneration, a company needs to balance its desire to attract and retain senior executives and directors against its interest in not paying excessive remuneration. It is important that there be a clear relationship

between performance and remuneration, and that the policy underlying executive remuneration be understood by investors. Recommendation 8.1: The board should establish a remuneration committee. Recommendation 8.2: Companies should clearly distinguish the structure of non‐executive directors’
remuneration from that of executive directors and senior executives. Recommendation 8.3: Companies should provide the information indicated in Guide to reporting on
Principle 8.
The difference? The old version referred to many possible remuneration policies applicable to directors and employees. It implied that the principle of remunerating fairly and responsibly covered all employees, not only the executives, and that, by extension, the policies needed to be inter‐related and to consider the different types of employees. The new version refers only to one policy, the executive remuneration policy. Other employees are not mentioned anywhere in the new principle, nor is the existence of other remuneration policies. Therefore, one can only assume that directors need not worry about creating a fair and equitable remuneration structure covering all employees, including executives. I cannot believe that some members of the ASX Corporate Governance Council missed this disappearance… Perhaps the Commission should suggest to the ASX Corporate Governance Council to reintegrate the employees into their remuneration principle. Also, it could suggest that companies should not only report on their executive remuneration policy, but also its relationships with the other existing company policies on remuneration. The use of derivatives and financial engineering services by CEOs In recent years, there were a few examples reported in the press (see MacFarlane (2002), West (2006)) of executives entering into complex derivative transactions in order to protect or improve any possible upside arising from their long‐term incentives. While companies have been encouraged to voluntarily outlaw these types of transactions, very few are actually actively enforcing such restrictions. As mentioned above, I am not an advocate of regulatory solutions to resolve all problems. However, in this case, I believe that this type of transactions should be forbidden by law, not only on derivatives involving the company’s shares, but also on any benchmark (or companies included in such benchmarks) used to assess entitlements to long‐term incentives. ASIC should also be given some power to fine the companies or individuals who have advised on and facilitated such transactions. I would also support any regulation limiting the use of margin loans for executive desiring to buy their own company’s shares. The recent global financial crisis has provided many examples showing us the disadvantages of allowing such a practice. Ethics courses Since executive remuneration is intimately linked to corporate governance, I was surprised to see that the issue of director and executive education has not been mentioned in the Issues Paper. More specifically, I am more concerned that most executives, whether or not they have an MBA, and directors might not have, one day or the other, taken a course in ethics, considering the findings exposed in this submission.

I took some time to check in some Australian MBA programs and some courses provided by professional institutions whether ethics are being taught as a specific subject or just a topic of secondary importance. The results are interesting, even though my sample is quite small. The MBA program at Melbourne Business School has a “Management and Ethics” subject which is optional and requires the completion of the “Managing People” subject as a pre‐requisite (?!?). At AGSM (UNSW), there is also a “Business Ethics” subject offered as optional, but I fear that it might not be so popular, as there are 41 optional subjects available, with students having to choose only 7 from these. MGSM’s program does not offer any specific subject on ethics, but it is included as a specific topic in a compulsory subject (Organisational Behaviour). Kaplan Professional (ex‐FINSIA) offers one topic dedicated to ethics (out of seven) in its subject “Law, Regulation and Ethics”. Finally, the Australian Institute of Company Directors (AICD) makes mention of ethics in two modules of its Company Directors Course (The Role of the Board and the Practice of Directorship; Decision Making), but I cannot ascertain from the information available on their website what proportion is actually devoted to the topic of ethics. While this might be outside the scope of the current inquiry, I still believe that the Commission suggests a greater coverage of ethics in MBA programs (maybe a compulsory course) and other professional courses, including the AICD (maybe a full module). Data sources and research on executive remuneration I share the same feeling as the Commission when it wrote “Data sources?”. Upon beginning my research project at FINSIA three years ago, this was one of the disappointing aspect of the task ahead: dealing with the absence of an existing, easily available database on Australian executive remuneration. I ended up having to build my own personal database, limiting my capture of information on the cash remuneration (base salary, non‐monetary benefits, retirement benefits, short‐term incentives) of all directors and executive directors of the ASX 200 companies, plus a few variables on corporate governance and director shareholdings. I am not the only student who faced this predicament: Wright (2005), while completing her doctoral thesis at the University of Technology in Sydney (UTS), participated with others in the development of a similar database on Australian executive remuneration. In the United States, Standard & Poor’s offers the ExecuComp database covering the details of executive remuneration for all the S&P 1500 companies. However, the database has been criticised by many scholars for providing data on some variables that can be hard to compare across companies. Perhaps it should be suggested that ASIC be given the mandate (and the budget) to build a comprehensive database on executive and director remuneration that could be made available to institutions and the public in general for a reasonable fee.

Appendix A: Companies included in the sample
ASX Codes Company ASX Codes Company AAC Australian Agricultural Company BLD Boral Limited AAP AAPT BLY Boart Longyear AAT Autron BNB Babcock & Brown AAX Ausenco BOL Boom Logistics ABB ABB Grain BOQ Bank Of Queensland Limited. ABC Adelaide Brighton Limited BPC Burns Philp & Company Limited ABP Abacus Property Group BPT Beach Petroleum ABS ABC Learning Centres BRL BRL Hardy ADB Adelaide Bank Limited BRS Bristile ADZ Adsteam Marine Limited BRZ Brazin Limited AED AED Oil BSG Bolnisi Gold AEO Austereo Group Limited BSL Bluescope Steel Limited AFI Australian Foundation Investment Company BTA Biota Holdings AGL/AGK Australian Gas Light Company (The) BWA Bank of Western Australia AGO Atlas Iron CAA Capral Aluminium Limited AHD Amalgamated Holdings CAB Cabcharge Australia AIO Asciano Group CBA Commonwealth Bank Of Australia ALH Australian Leisure & Hospitality Group CCL Coca‐Cola Amatil Limited ALL Aristocrat Leisure Limited CDO Colorado Group Limited ALN/AAN Alinta Gas CDR Commander Communications ALS Alesco Corporation Limited CEU Connecteast Group ALU Altium CEY Centennial Coal ALZ Australand Property Group CGF Challenger Financial Services AMC Amcor Limited CIY City Pacific AMP AMP Limited CLH Collection House ANM Australian Magnesium/Advanced Magnesium CLI Challenger International ANN/PDP Ansell Limited/Pacific Dunlop CML/CGJ Coles Myer Limited/Coles Group ANZ ANZ Banking Group Limited CMQ Chemeq AOE Arrow Energy CMR Compass Resources AOR Aurion Gold CNP Centro Properties Group APA Australian Pipeline Trust COA Coates Hire Limited API Australian Pharmaceutical Industries COH Cochlear Limited APL Australian Plantation Timber CPU Computershare Limited APN APN News & Media Limited CRG Crane Group Limited AQA Aquila Resources CRS Croesus Mining ARG Argo Investments CSL CSL Limited ARQ ARC Energy CSM Consolidated Minerals ASB Austal Limited CSR CSR Limited ASX Australian Stock Exchange Limited CTL Citect Corporation AUD Ausdoc Group CTX Caltex Australia Limited AUN Austar United Communications CWN Crown Limited AUW Australian Wealth Management CWO Cable & Wireless Optus AUY/FLX Auiron Energy/Felix Resources CXP Corporate Express Australia AVO Avoca Resources DGD Delta Gold AWB AWB DJS David Jones Limited AWC Alumina Limited DOW Downer Group AWE Australian Worldwide Exploration DRT DB RREEF Trust AXA AXA Asia Pacific Holdings Limited DVC DCA Group AXN Axon Instruments ECP Ecorp AZZ Antares Energy/Amity Oil EDI Evans Deakin BAM British American Tobacco Australasia EHL Emeco Holdings BBG Billabong International EML Email BBI/PIF Babcock & Brown Infrastructure Group ENE Energy Developments Limited BBP Babcock & Brown Power ENV Envestra Limited BBW Babcock & Brown Wind ERA Energy Resources of Australia BCA/VEA Baycorp Advantage Limited/Veda ERG ERG Limited BCM Babcock & Brown Capital ETR Etrade Australia BDG Bendigo Mining EXL Excel Coal BDL Brandrill FCL Futuris Corporation Limited BEN Bendigo Bank Limited FGL Foster's Group Limited BIL/BXB Brambles Industries Limited FHF FH Faulding

BIR Burswood FKP FKP Property Group BJT Babcock & Brown Japan Property Trust FLT Flight Centre BKN Bradken FMG/AMS Fortescue Metals/Allied Mining & Processing
ASX Codes Company ASX Codes Company FNC Foundation Health Care MIM MIM Holdings FWD Fleetwood Corporation MLB Melbourne IT FXJ Fairfax (John) Holdings Limited MMX Murchison Metals GAS Gasnet Australia MND Monadelphous Group GBG Gindalbie Metals MRE/ANL Minara Resources/Anaconda Nickel GCL Gloucester Coal MRL/SFH Miller's Retail/Specialty Fashion Group GGL Gribbles Group MTS/MTT/DVD Metcash Limited/Davids GHG Grand Hotel Group MXG Multiplex Group GNF/GFF Goodman Fielder MYO Myob Limited GNS Gunns NAB National Australia Bank Limited GPT GPT Group NCM Newcrest Mining Limited GRD GRD Limited NDY Normandy Mining GTP Great Southern Plantations Limited NEV Neverfail Ltd GUD GUD. Holdings Limited NFD National Foods Ltd GWT Gwa International Limited NLX Nylex Ltd HDR Hardman Resources NRT Novogen Limited HFA HFA Holdings NUF Nufarm Limited HIH HIH Insurance NVS Novus Petroleum HIL Hills Industries NWH NRW Holdings HPX HPAL NXS Nexus Energy HSP Healthscope OEC Orbital Engine Corporation HTA Hutchison Telecommunications Australia OMP OAMPS HVN Harvey Norman Holdings Limited ONE OneTel HWE Henry Walker Eltin Group OPS OPSM HWI Housewares International ORG Origin Energy Limited IAG Insurance Australia Group Limited ORI Orica Limited IDT Institute Of Drug Technology Australia Limited OST OneSteel IFL IOOF Holdings OTT Open Telecommunications IFM Infomedia Limited OXR/OZL Oxiana Resources/Oz Minerals IGO Independence Group PAS Pasminco IHG Intellect Holdings PBB Pacifica Group Limited ILU Iluka Resources Limited PBG Pacific Brands ION ION PBL/CMJ Publishing & Broadcasting Limited IPG Investa Property Group PCO/NMB/LIC Pracom/Namberry/Lifestyle Communities IPL/ICT Incitec Pivot/Incitec PDN Paladin Resources Limited IRE Iress Market Technology Limited PEM Perilya IVC Invocare PHY Pacific Hydro JBH JB Hi‐Fi PLA Platinum Australia JBM Jubilee Mines NL PMM Portman JFG James Fielding Group PMN Promina Group JHX/HAH James Hardie Industries N.V. PMP PMP Limited JST Just Group PMV Premier Investments JUP Jupiters PNA PanAust KAR Karoon Gas Australia PPH Pan Pharmaceuticals KAZ Kaz Computer Services PPT Perpetual Trustees Australia Limited KCN Kingsgate Consolidated PPX Paperlinx KYC Keycorp PRK/LAC Patrick Corporation/Lang Corporation KZL Kagara Limited PRT Prime Television LEI Leighton Holdings Limited PTD/AAH Peptech Limited/Arana Therapeutics LLC Lend Lease Corporation Limited PTM Platinum Asset Management LNC Linc Energy PWR PowerLan LNN Lion Nathan Limited PWT PowerTel LYC Lynas Corporation QAN Qantas Airways Limited MAH MacMahon Holdings QBE Qbe Insurance Group Limited MAQ Macquarie Corporate Telecommunications QGC Queensland Gas Company MAY/SYB Mayne Group/Symbion Health QRL QCT Resources MBL/MQG Macquarie Bank/Macquarie Group RCD/AFG Record Investments/Allco Finance MCC Macarthur Coal RCL Repco Corporation Limited MCR Mincor Resources REL/SAE Renewable Energy Corp/Salinas Energy MGM/MGQ/GMG Macquarie Goodman Management RHC Ramsay Healthcare MGR Mirvac Group RIC Ridley Corporation Limited

MGW McGuigan Simeon Wines RIN Rinker Group MGX Mount Gibson Iron RIV/WAV Riversdale Mining/Wave Capital MIA MIA Group ROC Roc Oil Company Limited
ASX Codes Company ASX Codes Company SBC Southern Cross Broadcasting Limited TEM Tempo Services SBM St Barbara TEN Ten Network Holdings Limited SDG Sunland Group THG Thakral Holdings Group SDL/SFG Sundance Resources/St Francis Mining TIM Timbercorp Limited SEK Seek Ltd TLS Telstra Corporation Limited. SEV Seven Network Limited TMN Telemedia Networks International SFE SFE Corporation Limited TMS/GTV Television & Media/Global Television SGB St George Bank Limited TNE Technology One Limited SGN STW Communications Group TOL Toll Holdings Limited SGP Stockland TPI Transpacific Industries SGW Sons of Gwalia TSE Transfield Services SGX Sino Gold Mining TSI Transfield Services Infrastructure Fund SHL Sonic Healthcare Limited TTS Tattersalls Ltd SIG/SIP Sigma Company Limited. UEC UEComm SKE Skilled Group Limited UEL United Energy SLX Silex Systems Limited UGL United Group Limited. SMI Howard Smith UTB UniTAB Limited SMS/SGM Sims Group Limited UXC/DVT UXC/Davnet SMX/SAS Sms Management & Technology Limited. VBA Virgin Blue Holdings SMY Sally Malay Mining VCR/MMD Ventracor/Micromedical Industries SNX SecureNet VNA/AFT Voicenet (Australia)/AFT Corporation SOH Solution 6 Holdings VPG Valad Property Group SPC SPC Ardmona VRL Village Roadshow Limited (PA) SPN SP Ausnet VSL Vision Systems SPP Southern Pacific Petroleum WAN West Australian Newspapers Holdings Limited SPT Spotless Group Limited WBC Westpac Banking Corporation SRL Straits Resources WDC Westfield Group SRP Southcorp Ltd WES Wesfarmers Limited SSX Smorgon Steel Group Limited. WMR WMC Resources STO Santos Limited WOR Worleyparsons Limited SUN Suncorp‐Metway Limited. WOW Woolworths Limited SWS Simeon Wines WPL Woodside Petroleum Limited SYM Symex Holdings WSA Western Areas TAB TAB WSF Westfield Holdings TAH Tabcorp Holdings Limited WTF Wotif.com Holdings TAL Tower Australia WYL Wattyl Limited TAP TAP OIL Limited ZFX Zinifex Limited TCL Transurban Group

Bibliography ASX Corporate Governance Council (2003), Principles of Good Corporate Governance and Best Practice Recommendations, Sydney ASX Corporate Governance Council (2007), Corporate Governance Principles and Recommendations, Sydney Australian Bureau of Statistics, Employee Hours and Earnings, Australia, May 1998 (6306.0), March 1999 Australian Bureau of Statistics, Employee Hours and Earnings, Australia, May 2000 (6306.0), March 2001 Australian Bureau of Statistics, Employee Hours and Earnings, Australia, May 2002 (6306.0), March 2003 Australian Bureau of Statistics, Employee Hours and Earnings, Australia, May 2004 (6306.0), March 2005 Australian Bureau of Statistics, Employee Hours and Earnings, Australia, May 2006 (6306.0), February 2007 Australian Bureau of Statistics, Labour Price Index, Australia, Total Hourly Rates of Pay Excluding Bonuses: Sector by Occupation (6345.0), February 2009 Bebchuk, L and Fried, J. (2004) Pay without Performance: The Unfulfilled Promise of Executive Compensation, Harvard University Press, Cambridge, MA Bertrand, M. and Mullainathan, S. (2000) “Do CEOs Set Their Own Pay? The Ones without Principals Do”, working paper Botsman, P. (1996), “The Workplace Jaques Built”, Australian Financial Review, 16 August 1996, p.28 Brown, M. and Samson, D. (2003) “Executive Compensation: Balancing Competing Priorities”, The Australian Economic Review, vol. 36, no. 3, pp. 316‐323 Chaudri, V. (2003) “Executive Compensation: Understanding the Issues”, The Australian Economic Review, vol. 36, no. 3, pp.300‐305 Craighead, J., Magnan, M. and Thorne, L. (2004) “The Impact of Mandated Disclosure on Performance‐Based CEO Compensation”, Contemporary Accounting Research, vol. 21, no. 2, pp. 369‐398 Fox, C and Trinca, H. (2001) “The Big Idea?”, Australian Financial Review, 13 July 2001, p.32 Hall, J. (2004) “Our Top Leaders”, Boss Magazine (in Australian Financial Review), 13 August 2004, p. 58

Jaques, E. (1964) Time‐Span Handbook: the Use of Time‐Span of Discretion to Measure the Level of Work in Employment Roles and to Arrange an Equitable Payment Structure, Heinemann Educational Books, London Jaques, E. (1970) Equitable Payment: a general theory of work, differential payment and individual progress, Second Edition, Heinemann Educational Books, London Jaques, E. (1989) Requisite Organization: The CEO’s Guide to Creative Structure and Leadership, Cason Hall, Arlington, VA Jensen, M.C. and Meckling, W.H. (1976) “Theory of the Firm: Managerial Behavior, Agency Costs and Ownership Structure”, Journal of Financial Economics, vol. 3, pp. 305‐360 Jensen, M.C. and Murphy, K.J. (1990a) “Performance, Pay and Top‐Management Incentives”, Journal of Political Economy, vol. 98, pp. 225‐264 Jensen, M.C. and Murphy, K.J. (1990b) “CEO Incentives: It’s not how much you pay, but how”, Harvard Business Review, vol. 68, pp. 138‐153 Kerin, P. (2003) “Executive Compensation: Getting the Mix Right”, The Australian Economic Review, vol. 36, no. 3, pp. 324‐332 MacFarlane, D. (2002) “Labor attacks executive options rort”, The Australian, 5 December 2002, p. 3 Popper, K., The Open Society and its Enemies, Volume One: The Spell of Plato, Routledge, London, 2007 ed. Robitaille, P. (2007) CEO Remuneration in Australia: Is it fair and reasonable?, research project, Financial Services Institute of Australasia, Sydney Shields, J. (2005) “Setting the Double Standard”, Journal of Australian Political Economy, no. 56, pp. 299‐324 Trinca, H. (1997) “The Art of War”, Sydney Morning Herald, 8 December 1997, p. 11 West, M. (2006) “Execs hedge incentives to protect pay”, The Australian, 4 March 2006, p. 33 Wright, A.P. (2005) CEO Compensation Structure and Firm Performance, thesis, University of Technology, Sydney