submission to the australian energy regulator on ergon ... · 1 . submission to the australian...
TRANSCRIPT
1
SUBMISSION TO THE AUSTRALIAN ENERGY REGULATOR ON ERGON ENERGY’S REGULATORY PROPOSAL FOR THE 2015-2020 REVENUE DETERMINATION
CHAMBER OF COMMERCE AND INDUSTRY QUEENSLAND SUBMISSION
30 January 2015
Chamber of Commerce & Industry Queensland

2
CONTENTS 1.0 OVERVIEW........................................................................................................................3
2.0 REVENUE AND SOLAR BONUS SCHEME…………………………………………….…5
3.0 CAPITAL EXPENDITURE..................................................................................................8
- Replacement expenditure………………………………………………………………....11
- Augmentation……………………………………………………………………………….13
4.0 OPERATING EXPENDITURE………………………………………………………………..15
5.0 RATE OF RETURN…………………………………………………………………………….16
- Departures from AER guidelines………………………………………………………….16
- Return on debt………………………………………………………………………………17
- Return on equity…………………………………………………………………………….18
6.0 CONSUMER ENGAGEMENT…………………………………………………………………20
7.0 INCENTIVE SCHEMES………………………………………………………………………21
8.0 CONCLUSION…………………………………………………………………………………..22
3
1.0 Overview
1.1 The Chamber of Commerce and Industry Queensland (CCIQ) welcomes the opportunity to
provide a submission to the Australian Energy Regulator (AER) on the Queensland electricity
distribution network determination process for 2015-2020 for Ergon Energy.
1.2 As Queensland’s peak industry body, we wish to work with Government bodies to achieve the
best possible outcomes for businesses in this state. There is much to be done to realise the
potential of the energy sector to enable Queensland small businesses to make a significant
contribution to our economy.
1.3 In particular, electricity price rises since 2007 are taking a toll on small businesses who are failing
to keep pace. This in turn impacts on Queensland’s economy as increases in the price of power
increase the cost of doing business and the cost of goods and services in Queensland.
Queensland’s small and medium enterprises (SMEs) play a pivotal role in achieving the growth of
our four pillar economy.
1.4 The supply and cost of energy is a key issue for Queensland businesses. Businesses rightfully
expect a reliable, efficient and cost-effective energy sector.
1.5 Queensland’s electricity costs represent a major area where we can either stimulate or suppress
ongoing economic growth. As with other ‘costs of doing business’ CCIQ believes we should
champion the need to keep them as low as possible and develop an energy sector that is
nationally and internationally competitive.
1.6 CCIQ believes that the energy sector must deliver greater certainty, operational efficiency,
strategic future focused planning and investment, service excellence and be integrated and
harmonised with energy efficiency policy. Above all it must be conducive to and support
business and economic growth in Queensland.
1.7 The AER revenue determination process is particularly pertinent, as the network cost
component makes up the majority of the average electricity bill. Therefore, in order for small
businesses to see real cost savings, the network charges must be drastically reduced.

4
1.8 Many Queensland small businesses have done all they can do to reduce usage and exercise
operational efficiencies. It is now time for the electricity industry to submit revenue proposals
that will deliver real price reductions for electricity consumers in Queensland.
1.9 It is pertinent to recognise that without significant cost reductions, small businesses will be
forced to seek alternative arrangements or inevitably close their doors.
1.10 CCIQ understand that Ergon Energy is differs from other energy distributors and other
factors need to be considered when assessing their proposal. One of the main points to consider
is that regions of Queensland outside of SEQ are covered by the Queensland Government’s
Uniform Tariff Policy which allows Ergon Energy customers to pay the same tariffs as customers
in SEQ. This policy combats the tyranny of distance for Queensland customers regionally.
1.11 CCIQ acknowledge that Ergon Energy has proposed to deliver price stability in the coming
years and purport to have taken positive steps to minimise the impact of rising electricity prices.
Ergon Energy has proposed lower rates of return on their assets than in the 2010-15 period
where they received 9.72 per cent. Ergon Energy has also proposed lower capex and opex than
they spent in the 2010-15 period. Ergon Energy has proposed capex 18 per cent lower compared
to 2010-15 and opex 13 per cent lower.
1.12 Despite this, Ergon Energy’s asset base is proposed to continue to grow over the 2015-20
period as proposed capex continues to exceed asset depreciation. The growth in the asset base
will continue to require financing in the coming years which translates to proportionally high
prices for consumers and on-going financial burden.
This submission will address the following concerns:
Revenue and solar bonus scheme;
Capex;
opex;
rate of return;
consumer engagement; and
incentive schemes.

5
2.0 Revenue and solar bonus scheme
The total revenue requirement is the amount of money needed to efficiently manage and operate a
network business during the 2015-20 regulatory period in order to deliver a safe and reliable
electricity service. Ergon Energy is required to develop a building block proposal which encompasses
five broad components:
- return on capital
- return of capital (depreciation)
- operating expenditure
- tax allowance; and
- revenue increments/decrements
The following graph (figure 1) shows Ergon Energy’s proposed total revenue compared to their
actual and allowed revenues in the previous period. The proposed revenues for the 2015-20 period
are shown both with and without the expected Solar Bonus Scheme feed in tariff costs.
Figure 1
Ergon Energy – proposed total revenue ($million 2014-15)
Source: AER issues paper Qld electricity distribution regulatory proposals 2015-16 to 2019-20
$0
$500
$1,000
$1,500
$2,000
2005-06 2007-08 2009-10 2011-12 2013-14 2015-16 2017-18 2019-20
Actual Allowed Proposed (excl. FiT) Proposed (incl. FiT)

6
The key drivers in Ergon Energy’s revenue proposal are opex and return on capital. Ergon Energy’s
Regulatory Asset Base (RAB) is proposed to grow by 27 per cent despite weak demand forecasts and
lower capex. As can be seen in Figure 2 Ergon Energy’s revenue per customer class has almost
doubled in 7 years.
Figure 2
Source: Ergon Energy 2006-13 Economic Benchmarking Regulatory Information Notice 30 April 2014
public version
Ergon Energy is proposing a total revenue requirement of $7.62 billion, up from $7.11 billion in the
previous 5 year period.
One of the major drivers of revenue in the 2015-20 period is the solar bonus scheme. Currently,
payments for the Queensland Government Solar Bonus Scheme are funded through Ergon Energy’s
revenue and network electricity prices. This scheme pays eligible customers for the surplus
electricity generated from solar energy systems that is exported back into the electricity grid. Under
the Electricity Act 1994 (Qld) distributors are required to pay the amount credited to eligible
customers through the feed in tariff. Ergon Energy intends to continue to recover payments made
under the scheme by passing through these costs to all customers based on a two year lag between
the year in which the payments are made, and the year in which the prices are collected. Should the
Queensland Government fund these payments in a different manner, Ergon Energy has proposed
that their revenue and network prices would decrease proportionately as a result.
0
200,000
400,000
600,000
800,000
2006 2007 2008 2009 2010 2011 2012 2013
Rev
enu
e ($
00
0s)
Ergon Revenue by Customer Class
Residential Non Res Volume Tariffs
LV Demand Tariffs HV Demand Tariffs
2 per. Mov. Avg. (Residential )

7
Ergon Energy have reportedly experienced significant under-recovery of revenue in the previous
regulatory period and are in turn now seeking compensation for this variation against budget
through their 2015-2020 proposal. This under-recovery has arisen from lower than forecast energy
usage resulting from increased energy conservation, use and installation of energy efficient
appliances and the high uptake of solar PV. Ergon Energy forecasts average annual feed in tariff costs
over the 2015-20 period of around $105 million. CCIQ oppose this recovery. The following graph
show the impact of the feed in tariff revenue on Ergon Energy’s proposed total revenue for standard
control services.
Figure 3 Ergon Energy proposed total revenues – feed in tariff impacts ($million, nominal)
Source: AER issues paper Qld electricity distribution regulatory proposals 2015-16 to 2019-20
CCIQ is aware that the Queensland LNP Government has mandated to remove the cost of the Solar
Bonus Scheme as part of their Strong Choices Cost of Living Fund. However, if this plan is not
implemented Queensland consumers should not have to continue to subsidise the cost of solar
usage through their power bills. Queensland consumers are already heavily burdened by the impost
of costs associated with the Solar Bonus Scheme and it is unacceptable that they should be
responsible for compensating the failure of Energex to adequately forecast demand. CCIQ urges the
AER as part of its determination to prevent Ergon Energy from recovering these costs from
consumers and recommends that these charges should be absorbed by Ergon Energy.
$0
$500
$1,000
$1,500
$2,000
2014-15 2015-16 2016-17 2017-18 2018-19 2019-20
Excluding FiT (smoothed) Including FiT (smoothed)
8
CCIQ is concerned that Ergon Energy’s proposal appears to consider that ongoing price increases are
acceptable. It is important to stress that Queensland small businesses are struggling to cope with
current prices.
Recommendation 1: CCIQ urges the AER to prevent Ergon Energy from recovering the Solar Bonus
Scheme costs from consumers and recommends that these charges should be absorbed by Ergon
Energy.
3.0 Capital Expenditure
The elements that make up the total capex consist of network augmentation (augex), asset
replacement expenditure (repex) and customer connections. Capex refers to the capital expenses
incurred in the provision of network services. CCIQ has a number of concerns surrounding the
calculations provided by Ergon Energy in relation to their capital expenditure (capex). Ergon Energy
has proposed reductions in capex of approximately 18 per cent. These lower capex forecasts reflect
lower forecast expenditure on augmentation, while expenditure on aged asset replacement is
expected to rise. Ergon Energy suggests weaker demand and less onerous requirements for network
security and reliability are the drivers on lower augmentation expenditure. Ergon Energy anticipates
a substantial increase in expenditure relating to customer connections.
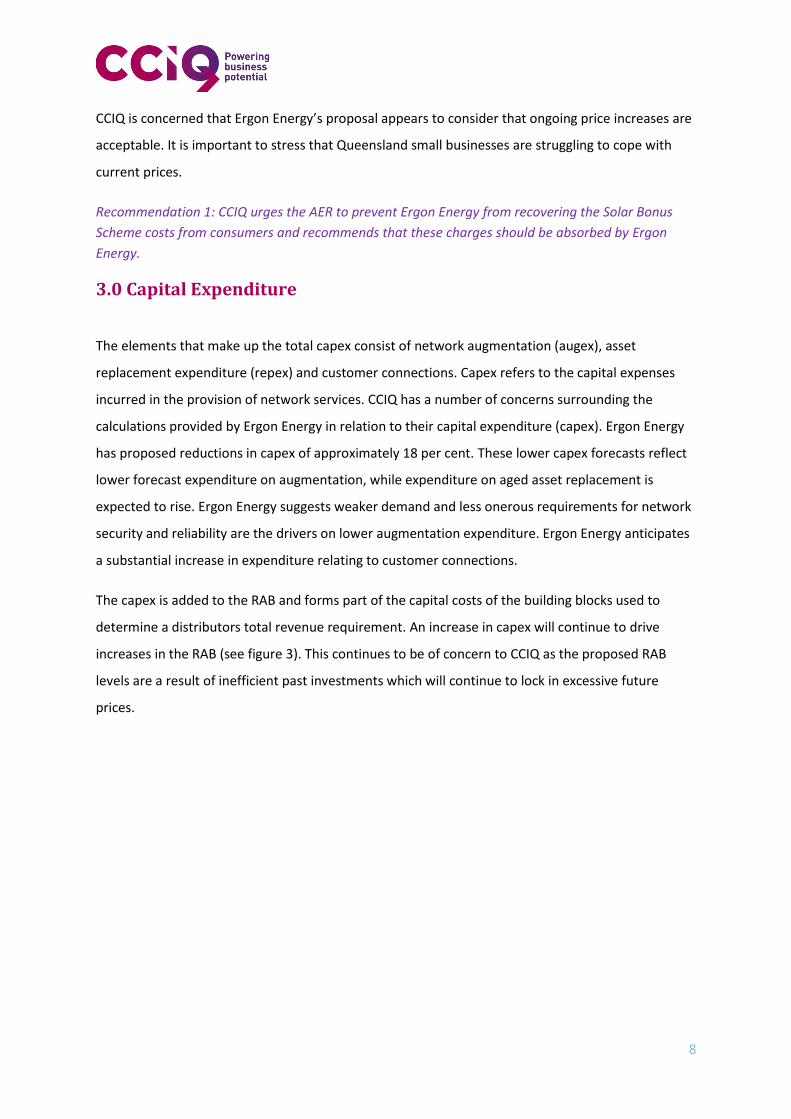
The capex is added to the RAB and forms part of the capital costs of the building blocks used to
determine a distributors total revenue requirement. An increase in capex will continue to drive
increases in the RAB (see figure 3). This continues to be of concern to CCIQ as the proposed RAB
levels are a result of inefficient past investments which will continue to lock in excessive future
prices.

9
Figure 3
Source: Ergon Energy 2006-13 Economic Benchmarking Regulatory Information Notice 30 April 2014
public version
During the previous regulatory period, Ergon Energy significantly under spent their capex allowance
(see figure 5). This means that their opening RAB for the 2015-20 period is lower than anticipated.
This reflects a number of factors, such as that the previous allowance may have been higher than
necessary. This lower spending compared to the allowances approved by the AER may be due to
lower than forecast peak demand, revised security and reliability standards and improved
governance processes. Ergon Energy’s historical and proposed RAB growth will triple over 15 years
(Figure 4).
400
500
600
700
800
900
3,000
5,000
7,000
9,000
2006 2007 2008 2009 2010 2011 2012 2013 Reg
ula
ted
Cap
ex (
$M
)
Reg
ula
ted
Ass
et B
ase
($
M)
ERGON: Asset Base & Capex
Regualated Asset Base (mid-yr) (LHS)
Regulated Capex (RHS)
10
Figure 4
Source: Ergon Energy 2006-13 Economic Benchmarking Regulatory Information Notice 30 April 2014
public version
Figure 5 Ergon Energy capital expenditure
Source: AER issues paper Qld electricity distribution regulatory proposals 2015-16 to 2019-20
0
200
400
600
800
1000
1200
1400
$million,2014-15
Actual capex Final year estimate Proposal forecast AER allowance

11
Ergon Energy has proposed that their high capex is influenced by a need to maintain high levels of
reliability and to replace ageing assets. Ergon Energy has also provided that capex has also been
attributed to responding to pockets of growth in certain areas.
The proposed levels of augmentation capex are inconsistent with the flat/declining demand trends
and reduced reliability standards that have been recorded throughout Queensland. Additionally, the
proposed levels of replacement capex are significantly above the underlying needs and CCIQ
questions Ergon Energy’s classification of supposed ‘ageing assets’. These lower capex forecasts
reflect lower forecast expenditure on augmentation, while expenditure on aged asset replacement is
expected to rise.
Ergon Energy’s capital expenditure requirement is comprised of two separate classifications - system
and non-system capex. The components under system and non-system are categorised in the
following table:
System Non system
Asset renewal Fleet
Customer initiated Property
Reliability and quality Tools and equipment
Other system costs IT systems
Other non-system
3.1 Replacement expenditure:
The majority of Ergon Energy’s capex spend is on asset renewal and customer connection initiated
capital works. Asset renewal is described by Ergon Energy as recurrent, non-demand driven capital
expenditure. It arises from the need to maintain Ergon Energy’s RAB in order to continue efficiently
delivering a reliable service. Asset renewal involves refurbishing, repairing and replacing asset
components that reach the end of their economic lives, as determined by their age, condition and
environment. It is therefore relevant to assess the age and condition of the network to ascertain
how much more improvement of the system is required.
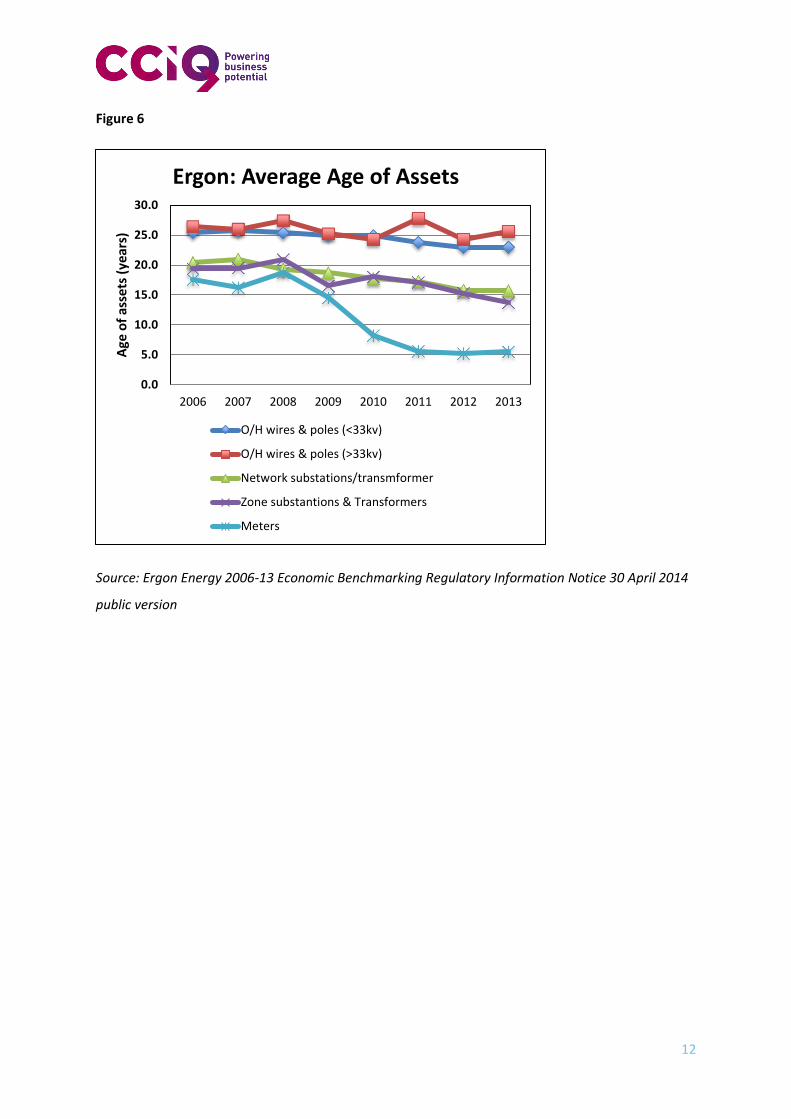
Ergon Energy is proposing a 23 per cent increase in replacement capex compared to its actual spend
in the previous period. CCIQ suggests that the amount being spent on Ergon Energy’s asset renewal
is excessive and unnecessary given the decreasing age and life of assets as evidenced in Figure 6.
12
Figure 6
Source: Ergon Energy 2006-13 Economic Benchmarking Regulatory Information Notice 30 April 2014
public version
0.0
5.0
10.0
15.0
20.0
25.0
30.0
2006 2007 2008 2009 2010 2011 2012 2013
Age
of
asse
ts (
year
s)
Ergon: Average Age of Assets
O/H wires & poles (<33kv)
O/H wires & poles (>33kv)
Network substations/transmformer
Zone substantions & Transformers
Meters
13
Figure 7
Source: Ergon Energy 2006-13 Economic Benchmarking Regulatory Information Notice 30 April 2014
public version
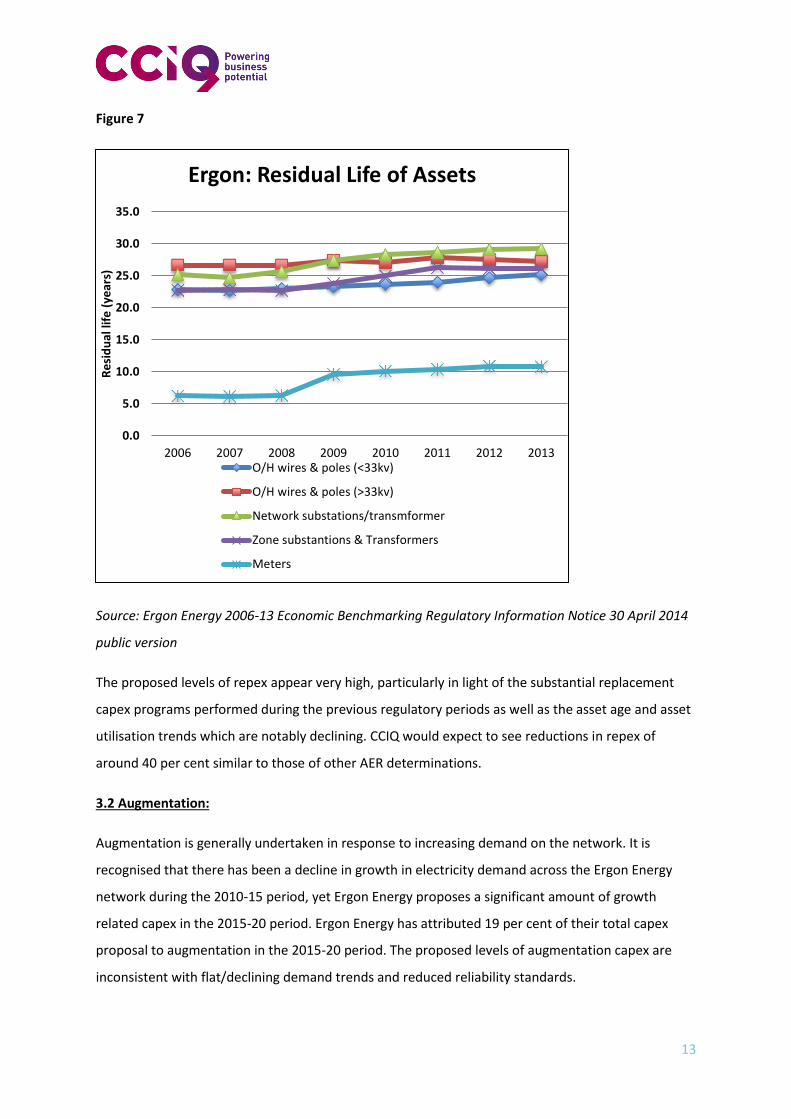
The proposed levels of repex appear very high, particularly in light of the substantial replacement
capex programs performed during the previous regulatory periods as well as the asset age and asset
utilisation trends which are notably declining. CCIQ would expect to see reductions in repex of
around 40 per cent similar to those of other AER determinations.
3.2 Augmentation:
Augmentation is generally undertaken in response to increasing demand on the network. It is
recognised that there has been a decline in growth in electricity demand across the Ergon Energy
network during the 2010-15 period, yet Ergon Energy proposes a significant amount of growth
related capex in the 2015-20 period. Ergon Energy has attributed 19 per cent of their total capex
proposal to augmentation in the 2015-20 period. The proposed levels of augmentation capex are
inconsistent with flat/declining demand trends and reduced reliability standards.
0.0
5.0
10.0
15.0
20.0
25.0
30.0
35.0
2006 2007 2008 2009 2010 2011 2012 2013
Re
sid
ual
life
(ye
ars)
Ergon: Residual Life of Assets
O/H wires & poles (<33kv)
O/H wires & poles (>33kv)
Network substations/transmformer
Zone substantions & Transformers
Meters
14
When reviewing revenue attributed to the growth of the network it is important to assess whether
the forecasts of energy demand and peak demand are accurate. More specifically, peak demand is
notably the key driver in augmentation requirements. In light of this, annual demand and customer
growth must be evaluated.
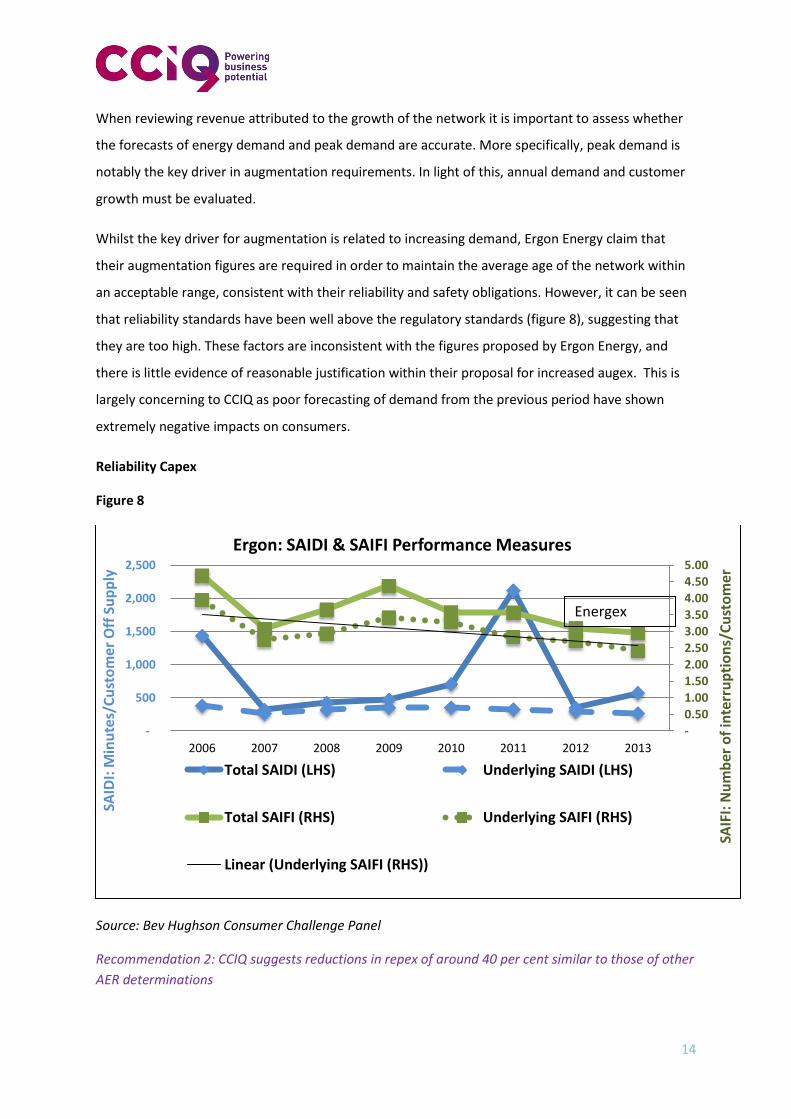
Whilst the key driver for augmentation is related to increasing demand, Ergon Energy claim that
their augmentation figures are required in order to maintain the average age of the network within
an acceptable range, consistent with their reliability and safety obligations. However, it can be seen
that reliability standards have been well above the regulatory standards (figure 8), suggesting that
they are too high. These factors are inconsistent with the figures proposed by Ergon Energy, and
there is little evidence of reasonable justification within their proposal for increased augex. This is
largely concerning to CCIQ as poor forecasting of demand from the previous period have shown
extremely negative impacts on consumers.
Reliability Capex
Figure 8
Source: Bev Hughson Consumer Challenge Panel
Recommendation 2: CCIQ suggests reductions in repex of around 40 per cent similar to those of other
AER determinations
-
0.50
1.00
1.50
2.00
2.50
3.00
3.50
4.00 4.50
5.00
-
500
1,000
1,500
2,000
2,500
2006 2007 2008 2009 2010 2011 2012 2013
SAIF
I: N
um
ber
of
inte
rru
pti
on
s/C
ust
om
er
SAID
I: M
inu
tes/
Cu
sto
mer
Off
Su
pp
ly
Ergon: SAIDI & SAIFI Performance Measures
Total SAIDI (LHS) Underlying SAIDI (LHS)
Total SAIFI (RHS) Underlying SAIFI (RHS)
Linear (Underlying SAIFI (RHS))
Energex
15
4.0 Operating Expenditure
Ergon Energy has proposed reductions in their operating expenditure (opex) of around 13 per cent
lower than its actual spend in the previous period, proposed to be driven by maintenance and
management efficiencies.
Ergon Energy’s opex figures do not include any opex associated with type 5 or 6 meters or solar
feed-in-tariffs as was done in the previous period thus making them appear less. These omissions are
a deliberate display of veiling the true costs being proposed.
Other opex issues to consider include the possibility of adjusting other operational activities. Firstly,
should the solar bonus scheme continue to be financed through network tariffs, CCIQ suggest that it
may be more appropriate to alter the recovery arrangements more moderately, such as being
spread over 5 years rather than 2. This would drastically reduce the detrimental price impacts on
customers in the first two years.
Secondly, labour costs such as salaries and the size of the workforce should be appropriately
assessed. Given the reduced capex and opex forecasts going forward from the previous period, the
size of the workforce should be presumably less. Furthermore, salaries of staff/labour should take
account of lower demand, weak economic conditions and rigidities in industrial relations
arrangements.
Additionally, CCIQ understand the importance of maintaining sufficient workforce numbers in order
to service the network when needed. However, provided Ergon Energy reported that feedback
confirmed customers were not willing to increase reliability or service from current standards, it is
not clear what is driving the opex increases in the last 3 years of the proposed period.
Recommendation 3: Ergon Energy’s workforce size should appropriately reflect the reduced capex
and opex forecasts.
Recommendation 4: Workforce salaries should take account of lower demand, weak economic
conditions and rigidities in industrial relations arrangements.

16
5.0 Rate of Return
The allowed rate of return provides a distributor a return on capital to service the interest on its
loans and give a return on equity to investors. To estimate this cost, two sources of funds for
investments are considered – equity and debt:
- the return on equity is the return shareholders of the business will require to attract new
investment; and
- the return on debt is the interest rate the distributor pays when it borrows money to invest
in capex.
Ergon Energy’s rate of return is defined as a nominal Weighted Average Cost of Capital (WACC).
Ergon Energy has proposed a rate of return of 8.02 per cent. This rate is lower than what was
afforded to them in the 2010-15 period (9.72 per cent). CCIQ believes that the proposed rate
remains excessively high. Ergon Energy’s overall rate of return reflects:
- a return on debt of 5.91 per cent
- a return on equity of 10.5 per cent
- gearing of 60 per cent
CCIQ agrees with the findings in the Consumer Challenge Panel’s papers to the AER on the AER’s
approach to determining the rate of return. Here it is asserted that the overall WACC should be
below 6 per cent (assuming the current risk free rate). This would still deliver generous returns to
Ergon Energy and better reflect consumers’ long term interests.
5.1 Departures from the AER guidelines:
The AER formulated and published a Rate of Return Guideline in December 2013 which whilst not
binding, is the preferred approach distributors are to use in determining their rate of return. Ergon
Energy has departed from the AER guidelines in calculating their rate of return, specifically in the
following areas:
- choice of rate of return model

17
- estimating the return on equity
- return on debt benchmark credit rating
- method for averaging the return on debt estimates
- estimating the value of imputation credits
Under the National Electricity Rules (NER) the regulated rate of return is calculated on the basis of
the WACC. The objective of the NER in relation to the allowed rate of return is as follows:
The allowed rate of return objective is that rate of return for a DNSP is to be commensurate with the
efficient financing costs of a benchmark efficient entity with a similar degree of risk as that which
applies to the DNSP in respect of the provision of standard control services.
Therefore, the rate of return proposed by Ergon Energy is expected to represent the efficient
financing cost of a benchmark efficient entity of similar degree of risk, in CCIQ’s opinion it is not.
5.1.1 Return on debt
Ergon Energy considers that the benchmark credit rating should be based on recent observations
and therefore proposed to use BBB as the benchmark, instead of BBB+ as advised in the AER’s
Guidelines. Ergon Energy believes that applying a 10 year horizon to ascertain the credit rating data
is too long and thus misleading. Ergon Energy has instead used more recent data from the last 5
years and arrived at an assumption of a BBB rating.
The AER Guideline sets a benchmark credit rating of BBB+ based on the median credit rating for a
sample of Australian utilities from 2002 to 2012. CCIQ believe that the credit ratings of BBB and
BBB+ are both too low for Ergon Energy given their low cash flow volatility. It is CCIQ’s view that
Ergon Energy has the opportunity to manage debt funding risk, base interest risk, credit cost risk and
inflation risk completely independently from one another. These flexibilities demonstrate that as a
utility provider Ergon Energy has significantly more policy and product flexibility to reduce debt costs
and manage risks than private sector borrowers. Additionally, CCIQ believes that a BBB credit rating
is an inaccurate estimate. Due to recently falling rates, CCIQ believes that Ergon Energy would have
arrived at a higher estimate.
Ergon Energy has proposed the following:

18
Ergon Energy has used data from the Reserve Bank of Australia (RBA) to estimate the debt risk
premium. Because the RBA’s ten year estimate reflects a term to maturity of less than 10 years, the
estimate has been extrapolated to produce a 10 year estimate based on the slope of the RBA’s yield
curve. Ergon Energy has estimated the return on debt as the Australian Financial Markets Association
(AFMA) swap rate plus the RBA’s margin to swap. For the first year of the regulatory control period,
the indicative risk free rate (for the cost of debt) and the debt risk premium reflects the mid-point of
an averaging period that is between one and 12 months. The resulting estimate is 6.36 per cent.
The cost of debt has been estimated using a different debt estimation period than Energex, resulting
in Ergon Energy arriving at a different estimate of the cost of debt. Ergon Energy’s resulting overall
rate of return (8.02 per cent) is slightly higher than Energex’s (which is 7.75 per cent).
5.1.2 Return on equity
Ergon Energy propose to depart from the AER Guidelines by not applying the foundation model
approach to estimate the return on equity, but rather applied an approach developed by SFG
Consulting.
The AER consider the Sharpe-Lintner Capital Asset Pricing Model (SLCAPM) to be the superior model
for their purposes in calculating an appropriate return on equity. CCIQ believes that Ergon Energy
has chosen not to apply the Sharpe-Lintner model as it under-estimates the return on equity for low
risk companies such as electricity distributors.
The risk free interest rate is an input into the cost of equity calculation in the CAPM. The SLCAPM is
estimated by adding the risk free rate to the product of the equity beta and market risk premium.
The AER’s approach is to estimate the risk free rate based on market conditions that prevail as close
as possible to the commencement of the regulatory control period. The AER Guideline proposes to
use 10-year Commonwealth government securities based on the ‘prevailing’ yield averaged over a
short period close to the date of the determination. The AER’s point estimate for equity beta is 0.7
and market risk premium is 6.5 per cent, resulting in an equity risk premium of 4.55 per cent. Ergon
Energy has proposed an equity beta of 0.91 and market risk premium of 7.57 per cent in applying
their foundation model approach. CCIQ assert that a low market risk premium be used preferably
within the range of 5 per cent – 7.5 per cent. Furthermore, the risk free rate should be set over a
term shorter than 10 years.

19
The assessment of the equity beta is an important factor in determining the overall return on equity.
The equity beta for a firm or industry modifies the market risk premium calculated for the market as
a whole, based on the relative risk. It is widely accepted and acknowledged that Australian utilities
face a much more stable business environment than the market as a whole. Network businesses are
able to present themselves to investors as providing stable long term regulated cash flows and as
regulated monopolies with high barriers to entry. It was decided during the 2013 Better Regulation
process that an equity beta of well below 1 reflects the very low risks of the regulated network
businesses compared to the market as a whole. Additionally the AER conducted a number of
empirical studies, including the extensive 2009 study undertaken by Professor O Henry which
included multiple analyses of Australian utility data returns. The AER concluded from these studies
that the range of equity betas derived from the empirical analysis was between 0.4 and 0.7. CCIQ
believe that Ergon Energy’s proposed equity beta of 0.82 is an inaccurate calculation given Ergon
Energy’s significantly reduced risk compared to the risks in the market as a whole.
CCIQ recommends an equity beta of lower than 0.7 be used. An equity beta of 0.7 would still be at
the top end of the estimated range of 0.4 to 0.7. The following table depicts other equity regulatory
benchmarks for a variety of sectors. In comparison, Ergon Energy’s proposed rate of equity of 10.53
per cent is well in excess of the average rate other regulated sectors have been approved.
Figure 10

20
Source: AER Explanatory Statement RoR Guideline, Appendix C, p32
Recommendation 5: The overall WACC should be below 6 per cent (assuming the current risk free
rate). This would still deliver generous returns to Ergon Energy and better reflect consumers’ long
term interests.
Recommendation 6: CCIQ believe that the credit ratings of BBB and BBB+ are both too low for Ergon
Energy given their low cash flow volatility and thus a higher rating should be applied.
Recommendation 7: CCIQ assert that a low market risk premium be used preferably within the range
of 5 per cent – 7.5 per cent. Furthermore, the risk free rate should be set over a term shorter than 10
years.
Recommendation 8: CCIQ believe that Ergon Energy’s proposed equity beta of 0.91 is an inaccurate
calculation given Ergon Energy’s significantly reduced risk compared to the risks in the market as a
whole. CCIQ recommends an equity beta of lower than 0.7 be used.
6.0 Consumer Engagement
CCIQ participated extensively in Ergon Energy’s consumer engagement program in the lead up to
their regulatory proposal submission. Ergon Energy conducted a number of information sessions
designed to inform rather than consult with consumer groups on specific aspects of their proposal.
There were approximately 8 workshops which were held from March 2014 up until the submission
of the proposals in October 2014. Ergon Energy has dedicated lengthy material in their proposal to
represent the extent of their consumer engagement activities. However, it is not clearly evident
where consumer feedback has been used to sway Ergon Energy’s decision making.
Whilst CCIQ has been actively involved in consultation engagement with Ergon Energy over the past
8 months in relation to their regulatory proposal, it is worth noting that there continues to remain
many barriers for encouraging consumer engagement with network service providers. CCIQ takes
the view that the sheer size of Ergon Energy’s proposal acts as a significant barrier to consumers’
participation in the regulatory process. Despite Ergon Energy producing a number of ‘overview’ and
‘summary’ documents, there remains a significant amount of spin within the proposal. It was
particularly difficult to locate necessary figures within Ergon Energy’s documents and CCIQ felt Ergon
Energy omitted a lot of relevant information such as the figures from the previous regulatory period.
This made it notably difficult to compare data. A large proportion of the documents are also
dedicated to justifying variations from the AER Guidelines, which would otherwise not be necessary
if a more strategic approach was adopted.
21
Ergon Energy had explained that their initial workshops had been aimed at informing consumer
groups on the regulatory process. Whilst CCIQ found these information sessions useful, they stopped
short of meeting consultative requirements that are prescribed under the AER Guidelines. There
were significant delays in postulating proposed facts and figures that were likely to be included in
the final proposal, which made it difficult for consumer groups to provide meaningful comment.
Many of the initial interactions lacked the transparency needed for CCIQ to engage effectively.
Despite being required to sign a confidentiality agreement in order to participate, CCIQ felt Ergon
Energy remained wary of divulging appropriate detail, particularly in relation to capex, opex and rate
of return figures. Once this information was eventually disclosed, CCIQ felt there was minimal
opportunity to influence change or digression from what was to be proposed.
Whilst CCIQ understands that this was the first time that Ergon Energy has conducted consultation
sessions with consumer groups of this nature, CCIQ believes there is much room for improvement.
CCIQ recommends that in future, Ergon Energy engage with consumer groups much earlier in the
process. CCIQ also recommends that consumer groups be afforded more opportunity to actively
influence Ergon Energy’s decision making process.
Recommendation 9: Ergon Energy should seek to engage with consumer groups much earlier in the
regulatory process to allow for consumers to actively influence Ergon Energy’s outcome.
7.0 Incentive schemes
Incentive schemes are provided to the distributors as a means of motivation to find efficiencies in
investment decisions and operational expenditure, balanced with appropriate performance
standards. Revenue from the various regulatory incentive schemes are both carried forward from
the previous period and anticipated and then adjusted to move into the next regulatory period.
It is useful to discuss incentive schemes separately to opex as they are not strictly part of the opex
calculation. There are a number of incentive schemes however most noteworthy are the following:
- Efficiency Benefit Sharing Scheme (EBSS)
- Demand Management Incentive Scheme (DMIS)
The EBSS seeks to provide a financial incentive for Ergon Energy to improve the efficiency of their
operating expenditure and to share any resulting efficiency gains (or losses) with their customers.
Any efficiency gains (or losses) are retained by Ergon Energy for five years after the gain (or loss) is

22
realised. This means the EBSS revenue adjustment in the next regulatory control period relates to
their performance under the EBSS in the current period and so forth.
Ergon Energy underspent their opex forecast in the previous control period, which has resulted in an
overall EBSS reward for Ergon Energy in the next period. This reward is set to be passed onto
customers through network charges. CCIQ understands the principle behind the incentive scheme
however CCIQ believes that good business practice would be to pass all cost savings onto customers.
Additionally, CCIQ notes that distributors are also able to pass on 30 per cent of their inefficient
costs to consumers. CCIQ believes that Ergon Energy should absorb any inefficient expenditure that
they have incurred, rather than passing it on to consumers.
The DMIS seeks to provide incentives to Ergon Energy to implement efficient non-network
alternatives for managing expected demand on the network and efficiently connect embedded
generators. In its Framework and Approach Paper, the AER proposed to apply Part A of the DMIS in
the next regulatory control period (the Demand Management Innovation Allowance DMIA). Ergon
Energy has proposed a total DMIA allowance of $5 million over the next regulatory control period.
The outcomes of the incentive schemes to date would suggest that the AER has consistently set
allowances and targets above the efficiency level. CCIQ recommends that the AER need to negotiate
targets that deliver genuine efficiency improvements and incentivise best practice.
Recommendation 10: CCIQ believes that the AER should negotiate targets that deliver genuine
efficiency improvements and incentivise best practice.
8.0 Conclusion
Queensland small businesses have been struggling with the rising costs of electricity for the past
several years. The network revenue determination process is one area where suitable influence can
realise real cost savings for energy consumers. Given the network component of the average
electricity bill makes up over 50 per cent, it is reasonable to expect that considerable concern
surrounds this regulatory process. The last regulatory period saw excessive overspend on network
infrastructure which inevitably saw prices skyrocket. Ergon Energy’s proposal suggests some price
stability for consumers before 2020, but CCIQ believes there is significant fat to be trimmed off the
network business to bring costs down.
23
Ergon Energy is seeking a total of $7.62 billion (up from $7.11 billion in the previous five-year
regulatory period). CCIQ is unaware of any private sector business at present that could increase
their prices by the magnitude of what is being proposed. The practical result of this complex issue is
that Queensland electricity consumers will be paying a higher electricity price than they otherwise
should have to if Ergon Energy were to adopt comparable industry benchmarks.
CCIQ believes that the figures proposed by Ergon Energy in relation to their capex, opex and rate of
return are excessive and will result in continuing price increases for Queensland small businesses in
the coming 5 years. CCIQ urge the AER to consider that current prices are unsustainable and
decreases in electricity prices are necessary for small business survival.