submesoscale+circulation+in+the+northern+gulf+of+mexico ... ·...
TRANSCRIPT

Submesoscale+circulation+in+the+Northern+Gulf+of+Mexico:+
Deep+phenomena+and+dispersion+over+the+continental+slope+
+
Annalisa+Bracco1*,+Keshav+Joshi1,2,+Hao+Luo1,3,+James+C.+McWilliams4+
+
!
1!School!of!Earth!and!Atmospherics!Sciences,!Georgia!Institute!of!Technology,!Atlanta,!GA!
30332,!USA!
2!School!of!Physics,!Georgia!Institute!of!Technology,!Atlanta,!GA!30332,!USA!
3!Department!of!Marine!Sciences,!University!of!Georgia,!Athens,!GA!30602,!USA!
4!Department!of!Atmospheric!and!Oceanic!Sciences,!University!of!California,!Los!Angeles,!CA!
90095,!USA!
+
Corresponding!Author:!
Annalisa!Bracco,!School!of!Earth!and!Atmospheric!Sciences,!!
311!Ferst!Dr,!Atlanta,!GA,!30332,!USA!
email:[email protected]!
Ph:!404Q894Q1749!
! !

!
Abstract+
This! study! examines! the! mesoscale! and! submesoscale! circulations! along! the!
continental! slope! in! the!northern!Gulf!of!Mexico!at!depths!greater! than!1000!m.!The!
investigation! is! performed! using! a! regional! model! run! at! two! horizontal! grid!
resolutions,!5!km!and!1.6!km,!over!a!three!year!period!from!January!2010!to!December!
2012.!!!
Ageostrophic! submesoscale! eddies,! and! vorticity! filaments! populate! the! continental!
slope,!and!they!are!stronger!and!more!abundant!in!the!simulation!at!higher!resolution,!
as!to!be!expected.!They!are!formed!from!horizontal!shear!layers!at!the!edges!of!highly!
intermittent,! bottomQintensified,! alongQslope! boundary! currents! and! in! the! cores! of!
those! currents! when! they! are! confined! on! steep! slopes.! The! horizontal! resolution!
influences!the!representation!of!the!lateral!and!vertical!transport!of!neutrally!buoyant!
tracers.! This! is! exemplified! by! a! passive! dye! deployed! near! the! Macondo! Prospect,!
where!the!Deepwater(Horizon!rig!exploded!in!2010,!and!at!the!largest!known!natural!
hydrocarbon! seep! in! the! northern! Gulf,! known! as! GC600,! located! few! hundred!
kilometers!to!the!west!of!the!rig!wellhead.!The!first!site!is!characterized!by!weak!mean!
currents!and,!in!the!high!resolution!run,!by!intense!submesoscale!eddies!that!form!to!
the!west!of!the!Macondo!Prospect!near!the!ocean!bottom.!GC600,!on!the!other!hand,!is!
surrounded! by! a! complicated! bathymetry,! and! its! flow! is! strong! and! highly! variable!
and,! in! the!higher! resolution!case,! characterized!by! short! lived! submesoscale!eddies.!!
The!trapping!exerted!by!the!submesoscale!eddies!and!vorticity!filaments!near!the!rig!
constrain! the! spreading! in! the! vicinity! of! the! Macondo! Prospect,! and! as! a! result,!

patchiness! in! the! passive! tracer! distributions! differs! in! the! two! integrations,! despite!
similar! diffusivities! expressing! the! average! spreading! rate.! The! tracer! released! at!
GC600,!on!the!other!hand,! is!dispersed!more!effectively! in!the! first!six!months! in!the!
higher!resolution!case!due!to!enhanced!nearQbottom!turbulent!mixing.!
Keywords:+Near!bottom!circulation,!Continental!slope,!Submesoscales,!ROMS,!USA,!
Gulf!of!Mexico,!Northern!Gulf! !

1.+Introduction+
Processes! and! dynamics! occurring! at! the! oceanic! submesoscales! (horizontal! length!
scales!between!~!100!m!and!~!10!km,!and!time!scales!between!a!few!hours!and!a!few!
days)! have! been! shown! to! impact! the! stirring! and! dispersion! of! natural! and!
anthropogenic! tracers! in! the! upper! ocean.! Submesoscale! circulation! patterns! can!
modify! the! mixedQlayer! stratification,! and! manifest! as! ageostrophic! fronts! and,!
whenever!these!fronts!are!unstable,!meanders!and!eddies!(Capet!et!al.,!2008b;!Thomas!
et! al.,! 2008;!McWilliams!et! al.,! 2009a;!Taylor! and!Ferrari,! 2011).! ! !The!generation!of!
submesoscale!fronts!and!consequent!instabilities!has!been!investigated!in!a!number!of!
papers!(Capet!et!al.,!2008a;!McWilliams!et!al.,!2009b;!Thomas!and!Ferrari,!2008).!!
A!heuristic!description!of!front!generation!that!is!relevant!to!this!work!is!presented!in!
Lévy!et!al.!(2012):!!submesoscale!ageostrophic!frontogenesis!can!take!place!whenever!
density!gradients!steep!enough!that!their!Rossby!number,!Ro,!defined!as!U/fL!(where!U!
is!the!characteristic!flow!velocity,!f(is!the!Coriolis!frequency,!and!L! is!the!width!of!the!
flow! pattern)! is! O(1).! In! the! oceanic! interior! any! density! anomaly! generated! by! the!
stirring! and! straining! of! the! mesoscale! field! is! quickly! damped! by! overturning!
circulations!that!reduce!the!local!steepness!in!the!density!field!to!restore!geostrophic!
balance,!with!the!end!result! that!almost! flat!density!surfaces!are!maintained.! ! !At! the!
top!and!bottom!of! the!ocean,!however,! those!overturning! circulations! are! limited!by!
the!presence!of!the!airQsea!and!bottom!boundaries,!and!must!develop!along!horizontal!
surfaces,!with!the!end!result!of!contributing!to!further!sharpening!the!density!fronts,!
and!therefore!to!frontogenesis.!!!

Several! recent! studies! attempted! to! characterize! submesoscale! dynamics! near! the!
ocean! surface! (Boccaletti! et! al.,! 2007;! Capet! et! al.,! 2008a,b;! Thomas! et! al.,! 2008;!
Thomas!and!Ferrari,!2008)!and! to!quantify! their!role!on! the! transport!and!mixing!of!
tracers!with!numerical!tools!in!both!idealized!and!realistic!domains!(Klein!and!Lapeyre,!
2009;! Koszalka! et! al.,! 2009;! Lévy! et! al.,! 2010;! Lévy! et! al.,! 2011;! Zhong! et! al.,! 2012;!
Zhong!and!Bracco,!2013;!Gula!et!al.,!2014)!and!with!targeted!field!campaigns!(D’Asaro!
et!al.,!2011;!Poje!et!al.,!2014;!Shcherbina!et!al.,!2013).!!
Little!is!known,!however,!about!those!dynamics!and!their!effects!!at!depth,!near!the!sea!
floor,! with! the! exception! of! the! California! Current! System,! where! ageostrophic!
submesoscale!motions!have!been!shown!to!contribute!to!the!generation!of! longQlived!
subsurface!anticyclones!through!centrifugal!instability!(Molemaker!et!al.,!2015;!Dewar!
et!al.,!2015).! !In!this!work!we!investigate!the!impact!of!submesoscale!dynamics!along!
the!continental!slope!in!the!northern!Gulf!of!Mexico!(hereafter!GoM).!!
The! GoM! basin! is! characterized! by! a! broad,! highly! variable! slope! that! hosts! a! large!
number!of!natural!hydrocabon!seeps!(Peccini!and!MacDonald,!2008;!GarciaQPineda!et!
al.,!2009)!found!predominantly!at!depths!greater!than!1000!m.!!It!was!impacted!by!the!
largest! deepQwater! oil! spill! ever! recorded! following! the! explosion! of! the!Deepwater(
Horizon!rig!on!April!20,!2010.!The!spill!discharged!approximately!3!x!108!kg!of!gas!and!
between!6!and!8!x!108!kg!of!oil,! about! a! third!of!which!was! confined! in!underwater!
plumes! found! in! several! layers! between! 700! m! and! the! ocean! seafloor! (Joye! et! al.,!
2011).!!!
In! this! paper! we! address! two! main! questions! with! the! goal! of! improving! our!
understanding!of!transport!and!mixing!along!continental!slopes:!!

• Are! submesoscale! dynamics! relevant! to! the! circulation! along! the! continental!
slope! in! the! northern! Gulf! of! Mexico,! and! if! so! what! are! the! mechanisms!
responsible!for!their!generation?!!!!
• Which! role,! if! any,! does! model! resolution! play! in! the! representation! of!
transport!and!mixing!of!passive,!neutrally!buoyant! tracers! released!along! the!
slope!and!in!particular!in!the!vicinity!of!the!Deepwater(Horizon!site?!!
We!consider!two!simulations!of!the!northern!Gulf!of!Mexico,!performed!with!5!km!and!
1.6! km! horizontal! grid! resolutions! and! spanning! three! years,! from! January! 2010! to!
December!2012;!the!first!resolves!fully!the!mesoscale!dynamics,!while!the!second!one!
is!submesoscale!permitting!(i.e.,!has!partial!resolution).!We!concentrate!on!dynamics!
relevant!for!the!deep!layer!in!the!GoM,!considering!only!depths!approximately!equal!
or!greater!than!1000!m.!After!analyzing!the!vorticity!structures!that!characterize!the!
flow!in!the!two!runs,!we!present!how!passive!tracers!deployed!at!two!locations!evolve!
over!one!year,!and!quantify!the!tracer!diffusivities.!!While!the!simulations!we!consider!
are! probably! not! directly! relevant! to! the! 2010! oil! spill! QQQ! particular! realizations! of!
oceanic!eddies!are!inherently!unpredictable!without!observational!constraints!QQQ!the!
answers! to! the! questions! above! may! guide! better! hindcasting! and! forecasting!
capabilities!for!deep!pollutant!releases.!!
!
2.+Model+setup,+domain+and+forcing+fields+
The!Gulf!of!Mexico!circulation!is!simulated!with!the!Regional!Oceanic!Modeling!System!
(ROMS)!in!the!version!developed!by!the!Institut!de!Recherche!pour!le!Développement!
(IRD),!ROMSQAgrif!2.2!(Debreu!et!al.,!2012).!The!model!domain!covers!the!whole!Gulf!

of!Mexico! (GoM),! but!we! concentrate! on! its! northern!portion! and! specifically! on! the!
area! comprised! between! 96.31oW! Q! 86.93oW! and! 25.40oN! Q! 30.66oN,! indicated! as!
northern!Gulf!in!the!following!(Fig.!1).!!This!region!contains!a!large!number!of!natural!
hydrocarbon!seeps!(MacDonald!et!al.,!2002)!and!coincides!with!the!area!that!was!the!
most!affected!by!the!Deepwater(Horizon!spill!in!2010!(Joye!et!al.,!2011).!!!In!this!work!
we!consider!two!integrations!differing!only!in!their!horizontal!grid!resolutions!of!5!km!
(LR,! for! Low! Resolution)! and! 1.6! km! (HR,! for! High! Resolution).! HR! is! obtained!
exploiting! the! twoQway! nesting! capabilities! of! ROMSQAgrif! 2.2! in! the! focus! area.! The!
vertical!resolution!is!70!terrainQfollowing!layers!enhanced!near!the!surface!and!bottom.!
The!model!bathymetry!is!derived!from!the!2!min!Gridded!Global!Relief!Data!Collection!
topography!ETOPO2!!(Sandwell!and!Smith,!1997),!interpolated!at!5!km!and!smoothed!
with! a! maximum! slope! parameter! of! 0.35! ! (Penven! et! al.,! 2008)! to! avoid! spurious!
currents!generated!by!pressure!gradient!errors.!In!the!nested!solution!the!bathymetry!
is!interpolated!from!its!5!km!version,!so!that!no!new,!smallQscale!topographic!features!
are!added.!Both!runs!span!three!years,!from!January!2010!to!December!2012,!and!they!
are!identically!forced!by!6Qhourly!momentum!and!12Qhourly!heat!fluxes!from!the!ERAQ
Interim! reanalysis! (Dee! et! al.,! 2011).! The! open! ocean! boundaries! are! nudged! to! the!
monthly! fields! from! the! HYCOM! –! NCODA! (Hybrid! Coordinate! Ocean! Model! Q! Navy!
Coupled!Ocean!Data!Assimilation)!ocean!prediction!system!(GOMI0.04!expt.!30.1,!http:!
//www7320.nrlssc.navy.mil/hycomGOM).! Fresh! water! fluxes! are! prescribed! by!
nudging! the! surface! salinity! field! to! the!World! Ocean! Atlas! 2009! (WOA09)!monthly!
varying! climatology! (Antonov! et! al.,! 2010)! without! any! synoptic! or! interannual!
variability.!More! information! about! the!model! configuration,! spinQup,! and! validation!

can!be!found!in!Luo!et!al.!(2015)!(LBCM!in!the!following).! !Configuration!and!forcing!
files!are!also!available!through!the!Gulf!of!Mexico!Research!Initiative!Information!and!
Data!Cooperative!(GRIIDC)!under!number:!R1.x132.141:0005.!
!
Figure+1.!Bathymetry!over!the!northern!Gulf!(HR)!domain.!The!1000,!1500,!and!2000!
m! bathymetric! contours! are! indicated! by! the! black! lines! and! major! topographic!
features! are! named.! The! sites!where! the! passive! tracer! is! released! are! indicated! by!
black!stars.!
!In!both!integrations!passive!tracers!are!deployed!at!a!site!6!km!to!the!southQsoutheast!
of!!Mississippi!Canyon!Block!252!(abbreviated!MC252),!where!the!Deepwater(Horizon!
oil! drilling! rig! was! located,! MC297! (Q88.36oW,! 28.70oN,! depth! 1562! m).! A! second!
release! is! carried! out! at! Green! Canyon! Block! 600! (GC600,! Q90.57oW,! 27.36oN,! depth!
1249.3!m),!the!largest!natural!oil!and!gas!seep!in!the!northern!Gulf!located!at!roughly!
the! same! water! depth! of! MC252! but! to! the! west! of! the! Mississippi! Fan,! along! the!
eastern!edge!of!the!Central!Slope.! !Both!deployment!sites!have!been!visited!regularly!

by!cruises!of!the!ECOGIG!consortium!(https://ecogig.org)!between!2010!and!2013.!The!
tracers!are! released!on!April!20,!2010!and!are!advected! for!12!months,!using!a! split!
tracer!advection!and!diffusion!scheme!and!the!rotated!biharmonic!diffusion!with!flowQ
dependent! hyperdiffusivity! that! satisfies! the! Peclet! constraint! ! (Marchesiello! et! al.,!
2009;!Lemarié!et!al.,!2012).!!!!!
3.+Mean+Circulation+at+depth+
The!circulation! in!the!Gulf!can!be!approximated!as!a!twoQlayer!system.!The!top! layer!
extends!approximately!over!the!upper!1000!m!and!its!circulation!is!dominated!by!the!
anticyclonic!Loop!Current!and!the!Rings!or!Loop!Eddies!that!detach!from!it!on!average!
every! tenQeleven! months! (Vukovich,! 2007),! together! with! associated! pycnocline!
mesoscale! and! surfaceQlayer! submesoscale! currents.! Underneath,! the! mean! flow! is!
cyclonic! around! the! basin! away! from! the! continental! slope,! as! indicated! by! currentQ
meter! observations,! Lagrangian! circulation! (PALACE)! floats,! and! the! temperature!
structure!in!the!basin!(DeHaan!and!Sturges,!2005;!Hamilton,!1990;!Weatherly,!2004).!
InQsitu! measurements! reveal! that! vortex! stretching! and! topographic! Rossby! waves!
(TRWs)!with!periodicities!ranging!from!10!to!50!days,!contribute!to!the!instantaneous!
deep!flow!measured!in!the!modeled!portion!of!the!northern!Gulf!(DeHaan!and!Sturges,!
2005;!Hamilton,!2009;!Kolodziejczyk!et!al.,!2012;!PérezQBrunius!et!al.,!2013).!TRWs!in!
particular! are! responsible! for! the! bottom! intensification! of! currents! aligned! and!
trapped!along!the!continental!slope!where!the!bathymetry!is!steep!(Dukhovskoy!et!al.,!
2009;!Hamilton,!2007;!Hamilton!and!LugoQFernandez,!2001).!!
Model! simulations! confirm! the!mean! flow! direction! (Lee! and!Mellor,! 2003;! Cardona!
and! Bracco,! 2014)! and! the! approximate! periodicity! of! the! intraQseasonal! variability!

(see! Appendix).! Fig.! 2! shows! the! modeled! mean! velocities! at! 1500! m! depth!
superimposed! on! the! mean! speed,! u 2 + v 2 !,! where! u(x, y) !and! v (x, y) !are! the!
horizontal!velocity!components!timeQaveraged!over!the!integration!period.!!!A!cyclonic!
current!dominates!the!circulation!south!of!26oN.!Over!the!slope!the!mean!flow!consists!
of! numerous! closed! recirculations! generated! by! the! interaction! with! the! complex!
bathymetry,!with!similar!patterns!in!the!two!integrations.!!!The!mean!speed!at!1500!m!
in!Fig.!2,!while!representing!only!a!small!portion!of!the!total!kinetic!energy!of!the!flow,!
is! about!35%!higher! in!HR! than! in!LR.!The!difference! in!mean! speeds! should!not!be!
attributed! to! resolution,! but! is!more! an! expression! of! the! intrinsic! variability! of! the!
system,! likely! linked! to! the! different! realizations! of! the! upper! layer! dynamics! in!
relation!to!the!modeled!LC!variability1.! !The!cyclonic!current!pattern!south!of!26.3oN!
over! the!deeper!portion!of! the!basin! is! the!most!prominent! feature! in! the!mean!flow!
independent! of! resolution,! and! it! is! a! major! contributor! to! the! HR! versus! LR!mean!
speed! amplitude! difference.! This! current! is! coherent! throughout! the! deep! layer! in!
agreement!with!the!analysis!of!trajectories!from!36!RAFOS!floats!deployed!for!a!year!
or! less! between! April! 2003! and! April! 2004! at! depths! between! 1000! and! 3000! m!
(Hamilton,!2009).!Additionally,! its!amplitude!increases!with!depth,!both!in!the!model!
and!in!the!observations.!!!
Despite! the! identical! atmospheric! forcing! and! boundary! conditions,! the! mesoscale!
dynamics!and!in!particular!the!Loop!Current!evolution!are!not!deterministic!(Cardona!
and! Bracco,! 2014),! and! the! outcomes! differ! in! the! two! runs! (LBCM);! note! that! no!
!!!!!!!!!!!!!!!!!!!!!!!!!!!!!!!!!!!!!!!!!!!!!!!!!!!!!!!!1!We! have! verified! that! the! mean! speed! of! a! different! 8Qyear! long! run! at! 5! km!resolution! presented! in! Cardona! and! Bracco! (2014)! is! indeed! comparable! to! HR! in!both!patterns!and!intensity.!

observational!data!are!assimilated.! !The!domain!averaged!eddy!kinetic!energy! (EKE)!
differs!between!HR!and!LR,!and!it!is!larger!in!HR.!The!slightly!greater!amplitude!of!the!
instantaneous!velocity!field!in!HR!usually!compares!better!with!the!(limited)!available!
observations! (DeHaan! and! Sturges,! 2005,! Hamilton! and! LugoQFernández,! 2001,! Oey!
and! Hamilton,! 2012;! Weatherly,! 2004).! Modeled! nearQbottom! velocities! are! further!
validated!in!the!Appendix.!
Figure+ 2.!Mean! velocity! vector! field! in! the!whole! Gulf! of!Mexico!with! zooms! in! the!
northern!portion! in! both!HR! (top! left)! and!LR! (top! right).! ! ! ! The! color! bar! indicates!
speed!in!cm!sQ1.!
!
EKE! time! series! at! various! depths,! calculated! as! ,! where! <>! designates!
spatial!averaging!over! the!northern!Gulf! (96.31oW!Q!86.93oW!and!25.40oN!Q!30.66oN)!
12
u '2+ v '2( )

and!the!mean!velocity!components!at!each!grid!point!have!been!subtracted,!are!shown!
in!Figure!3.! ! The! time! series!highlight! the! increase!of!EKE!with!depth,! its! coherency!
through! the! deep! layer,! and! its! intensification! at! irregular! intervals! between! 2Q7!
months! in!both!runs.!The!EKE!peaks!have!comparable!amplitudes! in!HR!and!LR,!and!
they! are! associated! with! the! intermittent! strengthening! of! the! alongQslope! current!
system! contributing! to! the! recirculation! region! centered! at! Q89.5oW,! and! with! the!
formation! of! a! mesoscale! cyclone! as! discussed! in! the! next! section.! Large! velocity!
fluctuations!with!a!timeQscale!comparable!to!the!modeled!ones!have!been!recorded!in!
the!same!area!(Hamilton!and!LugoQFernández,!2001),!but!their!generation!mechanism!
remains!unexplained.!As!noted!in!Cardona!and!Bracco!(2014),!the!deep!Gulf!circulation!
does!not!exhibit!any!seasonality,!and!the!EKE!variability!below!1000!m!is!uncorrelated!
to!the!surface!EKE!(see!Figure!A.1!in!LBCM!for!the!surface!EKE!time!series!in!both!HR!
and!LR!runs).!!!
!
!
Figure+3.!Eddy!Kinetic!Energy!time!series!averaged!over!the!northern!Gulf!at!different!
depths! across! the! deep! layer.! HR! run! on! top! (thick! lines)! and! LR! integration! below!

(thin! lines).! The! black! dots! indicate! the! generation! of! mesoscale! ! cyclones! at! the!
Mississippi!Fan.!Unit:!cm2sQ2!
!
4.+Mesoscale+and+submesoscale+dynamics+at+depth+++
Two!typical! snapshots!of! relative!vorticity!normalized!by! the!Coriolis!parameter,!ζ/f,!
depthQaveraged!between!1200!and!the!ocean!bottom,!are!shown!in!Fig.!4!(September!
2011! in! HR! and! August! 2010! in! LR).! ! Both! snapshots! include! an! occurrence! of! the!
largest,! strongest! (ζ( ≥! 0.8! f)! feature! found! in! the! deep! layer! in! the! northern! Gulf:! a!
bottom!intensified!mesoscale!cyclone!that!forms!at!the!Mississippi!Fan.! !The!episodic!
generation!of!this!cyclonic!eddy!is!indicated!by!the!black!dots!in!the!EKE!time!series.!!!
!
+

Figure+ 4.! Snapshots! of! relative! vorticity! normalized! by! the! Coriolis! frequency,! ζ/f,!
depthQaveraged!from!1000!m!to!the!bottom.!Top!panel:!HR;!Bottom!panel:!LR.!
!
The! cyclone! formed! at! the! Fan! is! coherent! throughout! the! lower! layer! and! bottomQ
intensified,!as!indicated!by!the!synchronous!peaks!in!the!EKE!timeQseries!at!!different!
depths!in!Fig.!3.!The!vorticity!generation!at!the!Fan!results!from!the!interaction!of!the!
temporally! varying! current! and! the! bathymetry.! Analogous! cyclogenesis! has! been!
detected!using!bottom!current!meters!in!the!Kuroshio!Extension!!(Greene!et!al.,!2009).!!!
The!along!slope!lowerQlayer!flow!to!the!west!of!the!Fan!is!generally!advected!eastward!
contributing! to! the!recirculation!zone!centered!around! Q89.5oW! in!Fig.!2.! If! the!zonal!
velocity!is!weak,!the!flow!is!inhibited!from!moving!over!the!seamount,!but!if!the!alongQ
slope!current!is!strong!enough,!the!flow!is!advected!over!and!around!the!topographic!
feature,!where!vortex!lines!are!compressed!and!anticyclonic!vorticity!is!generated!as!a!
consequence! of! potential! vorticity! conservation,! as! in! the! case! of! a! uniform! flow!
impinging!on!a!seamount!modeled!in!Huppert!and!Bryan!(1976).!In!our!runs,!a!portion!
of!the!flow!is!advected!around!the!Fan,!decreasing!somewhat!the!anticyclonic!vorticity!
induced!atop!the!Fan.!At!the!same!time,!for!sufficiently!strong!currents,!the!fluid!atop!
the!Fan!is!advected!eastward!and!cyclonic!vorticity!results!from!vortex!stretching!(Fig.!
5,! top!panel).!The!anticyclonic!vorticity! is! trapped!on! the!Fan,!while! the! cyclone! can!
drift!downstream!(Fig.!5,!middle!and!bottom!panels)!and!away!from!the!topographic!
feature!until!it!is!entrained!in!the!mean!cyclonic!current!south!of!26.3oN!that!brings!it!
west!(see!the!video!of!the!2500!m!vorticity!field!in!the!Supplementary!Material).!The!
cyclone! lifespan! is! between! two! and! four! weeks.! The! eddy! first! looses! its! strength!

moving! south! into! deeper! waters! and! then! is! dissipated! by! interactions! with! the!
bathymetry!(see!the!vorticity!video!available!as!Supplementary!Material).!!!
Assuming!that!the!lower!layer!is!uniform!and!its!potential!vorticity!(PV)!is!conserved,!
and! that! the! relative! vorticity! atop! the! Fan! is! close! to! zero! at! times! preceding! the!
cyclone!generation!when!local!currents!are!weak,!the!strength!of!the!cyclones!can!be!
evaluated!considering!the!topographic!stretching!induced!by!the!Fan,!following!Greene!
et! al.! (2009).! ! The! Fan! extends! between!~! 2700! and! 1800!m,!while! the! cyclonic! PV!
anomaly!extends!upward!to!~!1000!m!once!the!eddies!begin!drifting!away!from!it.!The!
vorticity!generated!by!stretching!is!therefore!approximately!!!!!!
!
The!modeled!relative!vorticity!at!the!cyclone!cores!in!HR!is!indeed! !around!
2700!m,!depending!on!the!event!considered,!and!decreases!to!about!0.8!±!0.1!at!1500!
m.!At!the!time!of!formation,!the!cyclone!intensity!depends!on!resolution!and!in!LR!the!
modeled!Fan!eddies!are!weaker! than! in!HR!with!maximum!vorticity! |ζ|/f!�! 0.9.! !The!
vertical!extent!of! the!deep!eddies! is!approximately!consistent!with!a!scale!H!~! fL/N,!
where! L! is! the! topographic! feature! width! and! N! is! the! subQpycnocline! buoyancy!
frequency.!
ζ =HPVanom
Hatop
−1"
#$$
%
&'' f =
2700−10001800−1000
−1"
#$
%
&' f ≈1.1 f
1≤ζ
f≤1.3

+
Figure+5.!Snapshots!of!depthQaveraged!relative!vorticity!at!the!Mississippi!Fan!during!
the!formation!of!one!of!the!mesoscale!cyclones!in!the!HR!run.!!!
!
Owing! to! the! resolutionQdependent! characteristics! of! these! flow! structures! that!
dominate! the! lower! layer! vorticity,! the! domain! averaged! ζ/f! ! is!more!positive! in!HR!
than! LR! below! 1000! m,! as! shown! in! Fig.! 6! (left! panel).! ! In! the! upper! 1000! m,! the!
anticyclonic!vorticity!of! the!Loop!Current!and!Eddies!dominate! the!domain!averaged!
vorticity!budget.! In!HR,!however,! the!LC!contribution! is!partially!compensated! in! the!
mixed!layer!by!submesoscale!cyclonic!eddies!(see!Fig.!6!in!LBCM).!

+
Figure+6.!Left:!Vertical!profiles!of!relative!vorticity!ζ!averaged!over!the!northern!Gulf!
domain! in! HR! and! LR;! Right:! PDFs! of! ζ/f! in! HR! and! LR! at! the! depth! of! 1000! m,!
normalized!to!have!unit!integral!probability.!!The!skewness!!γ!of!the!two!distributions!
is!listed.!!!!
!
Many! cylonic! and! anticyclonic! eddies,! smaller! than! the! ones! formed! over! the! Fan,!
occupy!the!continental!slope!(Fig.!4).!At!1000!m!the!shape!of!the!PDFs!of!ζ/f! !(Fig.!6,!
right!panel)! indicates!that!both!cyclonic!and!anticyclonic!structures!contribute!to!the!
tails! of! the! distributions,! and! that! model! resolution! plays! an! important! role! in! the!
representation!of! those! features.!Below!2000!m! fewer!eddies!beside! the!Fan!cyclone!
can! be! found! at! both! resolutions,! and! those! formed! are! mostly! cyclonic! (with! an!
approximate! ratio! of! 3! cyclones! to! 1! anticyclone),! so! the! tails! of! the! PDFs! are!more!
skewed! towards! positive! values! (not! shown).! ! These! smaller! eddies! increase! in!

number! and! strength! approaching! the! slope! independent! of! resolution,! but! they! are!
more! intense! and! numerous! in! HR,! in! agreement!with! the! exploration! of! resolution!
dependence! in! the! representation! of! the! California! Undercurrent! (Molemaker! et! al.,!
2015).!!!
The!eddies!and!filaments!found!along!the!GoM!continental!slope!are!generated!through!
instabilities!of!horizontal!shear!layers!generated!near!the!bottom,!where!steep!density!
gradients!can!develop,!by!two!mechanisms.!Firstly,!those!layers!can!be!associated!with!
the!presence!of!strong!and!highly!variable,!zonal,!frontQlike!currents,!and!are!formed!at!
the! front! boundary,! as! in! the! case! of! the! cyclonic! structure! at! 26.2oN! in! Fig.! 7.! The!
submesoscale! cyclone! is! formed! in!presence!of! a!negative! !gradient,! for! the! zonal!
velocity! varies! from!nearly! zero! to!highly!negative! for! increasing!y.! ! Zonal! velocities!
along! the! northern! Gulf! of! Mexico! slope! are! highly! intermittent! in! direction! and!
strength!as!observed!in!mooring!data!(Hamilton,!2007;!Kolodziejczyk!et!al.,!2012).!This!
is!confirmed!in!Fig.!7!and!further!in!Fig.!8!through!maps!of!nearQbottom!speed!and!its!
standard!deviation!(STD)!at!the!two!resolutions.!The!mean!nearQbottom!velocity!at!or!
below! 1000!m! is!westward! over!most! of! the! northern! Gulf! (including! over! the! Fan,!
while!the!anticyclonic!recirculation!appears!at!approximately!50!m!above!the!bottom)!
and!similar!in!pattern!and!direction!in!HR!and!LR.!The!speed!of!near!bottom!currents,!
,! however,! is! greater! in!HR.! ! In!both! runs! the!STD! is! larger! than! the!mean!
value,!and!bottom!currents!often!reverse!their!direction.!The!STD!also!increases!from!
LR! to! HR,! with! the! consequent! generation! of! a! larger! number! of! both! cyclones! and!
anticyclones!in!HR.!!!
∂u∂y
u2 + v2( )

!!! !
a)!!!!!!!!!!!!!!!!!!!!!!!!!!!!!!!!!!!!!!!!!!!!!!!!!!!!!!!!!!!!!!!!!!!!!!!!!!!!!!!!!!b)!
!
!!!!!!!!!!!!!!!!!!!!!!!!!!!!!!!!!!!!!!!!!!!!c)!
Figure+7.!Mean!(a)!and!instantaneous!snapshot!(b)!of!zonal!velocity!in!cm!sQ1,!and!!the!
corresponding! instantaneous! relative! vorticity! normalized! by! the! Coriolis! frequency!
(c)!along!the!Q93.5oW!transect!in!the!HR!run.!Density!isolines!(mean!or!instantaneous)!
are!superimposed!on!the!velocity!plots.!!
!

Secondly,!shear!layers!are!formed!by!the!mechanism!of!current!bottom!drag!on!a!slope!
acting!within!the!bottom!boundary!layer,!as!proposed!by!Molemaker!et!al.!(2015).!In!
this! case,! the! horizontal! shear! layer! results! from! the! bottom! boundary! layer!
parameterization!employed!by!ROMSQAgrif!(KPP,!Large!et!al.,!1994)!that!exerts!a!drag!
on!the!lowest!model!layers!proportional!to!the!square!of!the!near!bottom!velocity!(see!
schematic!in!Figure!7!in!Molemaker!et!al.!!(2015)).!Again,!the!shear!layer!supports!the!
generation!of!vertical!vorticity! !at!the!slope,!where!u!has!to!approach!zero,!and!
the!sign!of!the!alongQslope!current!corresponds!to!the!sign!of!ζ!at!the!bottom!boundary!
layer.!!Whenever!high!values!of!vorticity!are!achieved!(|(ζ!|/f(!>!0.2),!small!scales!eddies!
and! filaments! are! generated! often! in! association! with! boundary! current! separation.!
This!mechanism!is!exemplified!in!Fig.!7!by!the!anticyclonic!eddy!centered!in!the!middle!
of!the!zonal!'jet',!at!26.4oN,!in!correspondence!of!the!core!of!the!jetQlike!zonal!current.!
In!this!case,!the!horizontal!boundary!layer!width!is!proportional!to!the!boundary!layer!
vertical! thickness! and! inversely! proportional! to! the! crossQshelf! bottom! slope!
(Molemaker!et!al.,!2015),!which!is!highly!variable!in!the!domain!considered!but!often!
as! steep! as! 0.25! between!1000! and!2700!m,! despite! the! 5! km! smoothing! applied! to!
both!solutions.!Therefore,!the!horizontal!boundary!layer!is!partially!resolved!in!HR!and!
mostly!not! resolved!by!LR.! ! !Preferred! locations! for! the! formation!of! the!alongQslope!
eddies!can!be!found!in!Fig.!9,!where!vorticity!maxima!and!minima!are!shown!at!1000!
m!depth!in!both!runs,!and!in!Fig.!10,!where!the!variance!of!the!horizontal!divergence!
field,! ∂u∂x+∂v∂y,! normalized! by! the! Coriolis! frequency! quantifies! the! departure! from!
geostrophic! balance.! Anticyclones! dominate! the! vorticity! maxima! at! the! Northwest!
ς ≈ −∂u∂y

Slope! and! in! the! De! Soto! Canyon,! while! cyclones! apart! from! the! Fan! eddies! are!
preferentially! formed!along! the!Mississippi!and!Central!Slopes,! and!at! the!Northwest!
Slope.! Figure! 9! confirms! the! LR! underestimation! of! both! strength! and! number! of!
eddies! generated! along! the! continental! slope.! Finally! the! divergence! field! (Fig.! 10)!
supports! relatively! large! vertical! velocities! for! the! flows! along! the! continental! slope!
and! atop!major! topographic! features,!which! is! indicative! of! ageostropic! dynamics! of!
appreciable!amplitude.!
!
!
Figure+8.+Mean!nearQbottom!speed!and!its!standard!deviation!at!each!model!grid!point!
in!HR! (left)! and!LR! (right)!with! superimposed!horizontal! velocity! streamlines! in! the!
bottom!model!layer.!Unit:!cm!sQ1!

!
Figure+9.! !Maxima!(top)!and!minima!(bottom)!of!ζ/f(!at!each!model!grid!point! in!HR!
(left)!and!LR!(right)!at!the!depth!of!1000!m.!!The!association!with!the!continental!slope!
is!strong.!
!

!
Figure+ 10! Standard! deviation! of! horizontal! divergence! normalized! by! the! Coriolis!
frequency!at!1000,!1500!and!2000!m!in!HR!(top)!and!LR!(bottom).!
+
5.+Passive+tracer+releases+
Passive!tracers!are!released!in!the!bottom!model! layer,!over!approximately!the!same!
volume! in! the! two! simulations! near! the! DWH! site,! at!MC297,! and! along! the! eastern!
edge!of!the!Central!Slope,!at!GC600!(Fig.!1).!The!tracer!advection!and!diffusion!scheme!
adopted! (Marchesiello!et!al.,!2009;!Lemarié!et! al.,! 2012)!does!not!guarantee!positive!
concentrations,! although! it! does! greatly! diminish! false! extrema! and!diapycnal! tracer!
flux2.!Negative!values!appear!in!correspondence!of!large!tracer!gradients!and!they!are!
retained! to! evaluate! the! impact! of! resolution! on! the! scheme! accuracy.! The! LR!
simulation!is!impacted!more!dramatically:!in!the!first!month!after!deployment!15%!of!
the!concentration!values!in!the!LR!simulation!are!negative.!Such!percentage!decreases!
!!!!!!!!!!!!!!!!!!!!!!!!!!!!!!!!!!!!!!!!!!!!!!!!!!!!!!!!2!Alternative!advection!schemes!avoid!negative!concentrations,!but!they!are!generally!more!erroneously!diffusive.!We!prefer!to!accept!the!error!levels!shown!here!to!retain!the!weakly!diffusive!behavior!of!the!advection!operator!in!ROMS.!

to!5%!or!less!past!the!first!trimester!of!tracer!integration.!In!the!HR!case!percentages!
are!limited!to!5%!in!the!first!month,!and!decrease!to!1%.!!
The!two!deployment!sites!differ!significantly! in!their!circulation.!Around!the!MC!site,!
the!nearQbottom!mean!circulation!consists!of!very!weak!cyclonic!currents!(less!than!1!
cm! sQ1)!with! the! lowest! standard! deviation! in! the! deep! domain! but! still! sufficient! to!
reverse!the!mean!direction!at!times!(Fig.!8).!Sporadic,!intense!submesoscale!eddies!of!
both!signs!form!along!the!continental!slope!and!populate!the!Mississippi!and!De!Soto!
Canyon! areas! in! HR,! while! weaker,! less! coherent! and! shorter! living! structures! are!
found! in! the!LR!solution!(see!videos!of! the!vorticity! field!at!1000!and!1500!m! in! the!
Supplementary!Material).!At!GC600!HR!and!LR!differ!mostly! in! the!representation!of!
the!mean!alongQslope!cyclonic!currents!to!the!east!and!west!of!the!site,!that!reaches!!5!
cm!sQ1!at!HR!but!at!most!2.5!cm!sQ1!in!LR,!and!of!their!variance,!underestimated!in!LR.!
The! circulation! in! the! immediate! proximity! of! GC600! is! affected! by! topographically!
constrained!mesoscale!eddies! that! form!along!the!Mississippi!slope!at! the!site’!depth!
independently! of! resolution! but! are! generally!more! intense! in!HR,! and! are! advected!
towards!the!Central!Slope!(Fig.!4!and!vorticity!field!video!at!1500!m).!Over!the!Central!
Slope! vorticity! shows! little! coherency! at! about! the! GC600! depth! (~1250! m)!
independently! of! resolution! due! to! the! complex! bathymetry! that! quickly! erode! the!
submesoscale! eddies! formed! in! HR! near! the! bottom! at! depths! of! 1700Q2200! m,! as!
highlighted!by!the!vorticity!videos.!
In! the! case! of! the!MC! tracer,! the! alongQ! and! acrossQslope! spreading! is! initially!more!
confined! in! HR,! due! to! the! improved! resolution! of! the! meridional! extension! of! the!
alongQslope!currents!and!to!the!trapping!exerted!by!the!submesoscale!eddies!formed!in!

the!Canyons!(Fig.!11).!!
!
Figure+ 11! DepthQintegrated! concentration! of! the! tracer! deployed! at! MC297! (black!
star)! after! 3,! 6! and! 12! months! after! deployment! in! the! HR! (left)! and! LR! (right)!
integrations.!The!1000,!1500!and!2000!m!isobaths!are!also!shown.!
!
In!the!HR!run!three!months!after!deployment!most!of!the!MC297!tracer!can!be!found!in!
the!immediate!proximity!of!the!site,!in!a!narrow!100!km!long!filament!to!the!west!of!it!
and,! in!very!small!amount,! in!a! filament! the!east,! extending! into! the!De!Soto!Canyon!
along!the!1500!m!isobath.!The!tracer!to!the!west!follows!very!closely!the!trajectory!of!
the! deep! oil! plume! identified! in! June! 2010! (Camilli! et! al.,! 2010)! matching! well! the!
plume! zonal! and!meridional! extension.!During! the! 2010! spill,! small! negative! oxygen!

anomalies,!indicative!of!microbial!oil!consumption,!were!also!recorded!in!the!De!Soto!
area! (http://www.noaa.gov/deepwaterhorizon/maps/dissolved_maps.html).! Six!
months! after! deployment! large! concentrations! of! the! MC297! tracer! are! still! found!
within!75!km!of!the!site,!while!some!tracer!has!spread!west!of!the!Mississippi!mouth!
carried! by! the! alongQslope! currents! and! submesoscale! eddies.! The! patchiness! and!
overall!extension!of!the!westward!propagating!tracer!is!associated!with!advection!by!a!
chain!of!submesoscale!eddies!that!form!regularly!along!the!1500!m!isobath!to!the!west!
of! the!Mississippi! Fan! in! the! HR! case! (see! Fig.! 4! and! vorticity!movies).! Comparable!
patchiness! and! distribution! was! found! in! the! postQspill! dissolved! oxygen! negative!
anomalies!integrated!between!1000!and!1300!m!and!July!22nd!and!October!16th!2010!
(http://www.nodc.noaa.gov/Images/profile_rost_chartLarge.jpg).! One! year! after!
deployment!the!HR!tracer!has!occupied!most!of!the!area!comprised!between!the!1500!
and!2000!m!isobaths,!but! it! is!not!uniformly!distributed!and!a!significant!percentage!
(~10%)!of! tracer! is! still! concentrated! to! the! immediate! south! and! southQwest! of! the!
deployment! site.! Such! spreading! is! broadly! consistent! with! the! limited! footprint! of!
DWH!oil!deposited!on!the!ocean!floor!by!the!deepQwater!plume!(Valentine!et!al.,!2014).!!
In!LR! the!MC297! tracer!after! three!months!has!spread! into!a!blob!and!moved! to! the!
west,!and!after!six!months! is!distributed! further! to! the!west,!along!a!narrow!band!of!
uniform!concentration! that! follows! the!bathymetry!contours!as! far!as! Q91oW.!Only! in!
the! last! six!months!mesoscale!dynamics,! and!particularly! the! cyclones! formed!at! the!
Mississippi! Fan! introduce! patchiness! in! the! tracer! distribution! (see! videos! of! the!
evolution!of!the!tracer!concentration!from!3!to!12!months!after!deployment!in!HR!and!
LR!in!the!Supplementary!Material).!!
!
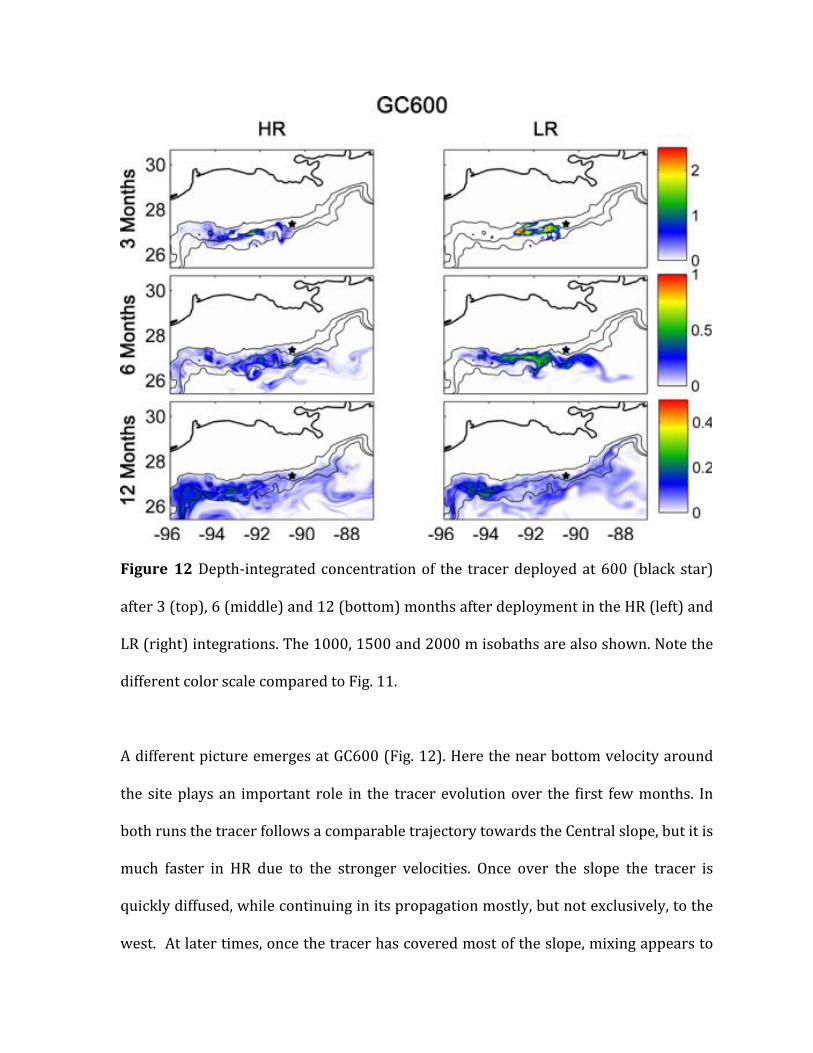
Figure+ 12!DepthQintegrated!concentration!of! the! tracer!deployed!at!600! (black!star)!
after!3!(top),!6!(middle)!and!12!(bottom)!months!after!deployment!in!the!HR!(left)!and!
LR!(right)!integrations.!The!1000,!1500!and!2000!m!isobaths!are!also!shown.!Note!the!
different!color!scale!compared!to!Fig.!11.!
!
A!different!picture!emerges!at!GC600!(Fig.!12).!Here!the!near!bottom!velocity!around!
the! site!plays!an! important! role! in! the! tracer!evolution!over! the! first! few!months.! In!
both!runs!the!tracer!follows!a!comparable!trajectory!towards!the!Central!slope,!but!it!is!
much! faster! in! HR! due! to! the! stronger! velocities.! Once! over! the! slope! the! tracer! is!
quickly!diffused,!while!continuing!in!its!propagation!mostly,!but!not!exclusively,!to!the!
west.!!At!later!times,!once!the!tracer!has!covered!most!of!the!slope,!mixing!appears!to!

be!slightly!more!efficient!in!the!LR!case,!due!to!the!limited!number!of!trapping!eddies.!
After!one!year!the!GC600!tracer!can!be!found!in!small!concentrations!over!most!of!the!
domain!in!waters!deeper!than!1000!m,!with!the!exception!of!the!De!Soto!Canyon.!
To! quantify! differences! and! similarities! in! tracer! patchiness! and! lateral! spreading!
efficiency!in!the!two!releases,!Table!1!presents!the!cumulative!percentage!of!the!total!
amount!of!tracer!contained!in!the!250!km2!with!highest!concentration!in!both!runs.!
Date!! MC297!HR! MC297!LR! GC600!HR! GC600!LR!
07/20/2010! 45%! 27%! 4%! 7.5%!
10/20/2010! 15.5%! 7%! 2%! 2%!
1/20/2011! 6.5%! 5.5%! 0.8%! 1.3%!
4/20/2011! 3%! 1.7%! 0.5%! 0.9%!
!
Table+ 1:! Cumulatively! percentage! of! total! tracer! contained! in! the! 250! km2! with!
strongest!concentration!3,!6,!9!and!12!months!after!release.!
!
We! estimated! the! tracerQbased! horizontal! (meridional! and! lateral)! diffusivities! from!
depthQintegrated!concentrations,!C(x,y).!Our!estimates!are!based!on!the!growth!of!the!
second!moment!of!the!tracer!cloud!under!the!assumption!that!once!the!velocities!are!
decorrelated! the! growth! is! linear! in! time! (Taylor,! 1921;! Garrett,! 1983),! following!
previous!applications!(Ledwell!et!al.,!1993;!Klocker!et!al.,!2012).!For!example,!the!zonal!
diffusivity!component!is!given!by!
!Kx,t =12∂∂t
x − xb( )2C∫∫ (x, y)dxdyC(x, y)dxdy∫∫

where! C! is! interpolated! with! a! volume! weight! to! conserve! the! total! mass! over! the!
whole! Gulf! domain! and! xb! is! the! xQcoordinate! of! the! tracer! cloud! center! of! mass!
.!!
The! diffusivities! are! shown! in! Fig.! 13! and! are! calculated! retaining! the! negative!
concentrations! (bold! lines)! or! setting! them! to! zero! at! each! time! step! (thin! lines)! to!
highlight! the! uncertainties! associated! with! numerical! noise.! Uncertainties! are!
negligible!in!HR!but!considerable!and!across!all!times!in!LR!due!to!the!large!negative!
values!generated! in! the! first! few!weeks!of! simulation.!The!second!order!moments!of!
the! tracer!cloud!evolve!similarly! in!HR!and!LR! in! the!MC297!deployment,!and!so! the!
diffusivities,! despite! the! different! patchiness.! Diffusivities! are! higher! in! the! HR! run!
around!GC600!due!to!the!fast!spread!of!the!dye!in!the!second!month!of!integration,!but!
level! off! after! about! six! month,! while! they! continue! to! grow! in! both! zonal! and!
meridional! direction! in! LR.! The! asymptotic! value! of!Kx! in! the!GC600!deployments! is!
twice!as!large!the!MC297!case,!while!Ky!is!independent!of!the!site!in!the!HR!run.!Ky!is!5!
to!10!times!smaller!than!Kx!and!none!of!the!curves!follow!a!simple!diffusive!behavior!
(ballistic!and/or!RichardsonQlike).!
!
!
xb =xC(x, y)dxdy∫∫C(x, y)dxdy∫∫

!
Figure+13!Zonal!(Kx)!and!meridional!(Ky)!diffusivities!as!function!of!time!in!HR!(red)!
and! LR! (blue),! including! concentrations! that! include! negative! values! (bold)! or! after!
removing!them.!Note!the!different!yQaxis!for!Kx!and!Ky.!Unit:!m2!sQ1.!
!
The!variability! in!K(t)!and! the!patchiness!of! the! spatial!patterns! in!Figs.!11Q12!show!
considerable! sampling! fluctuations! compared! to! ensembleQmean! statistics! expected!
from!multiple! realizations.! !While! acknowledging! this! limitation,!we! have! chosen! to!
restrict! our! attention! here! to! a! single! realization! for! each! tracer! release! due! to! its!
relevance!to!interpret!episodic!pollutant!releases,!as!in!the!case!of!the!2010!spill.!
Finally,! we! evaluated! how! the! vertical! distribution! of! the! tracers! is! affected! by!
resolution.! In! the!MC!deployment! differences! between! the! two! runs! are! large! in! the!
first!six!months,!when!the!tracers!in!HR!is!trapped!in!bottom!intensified!submesoscale!
filaments!and!eddies,!and!spread!less!effectively!through!the!water!column!than!in!LR.!
After! one! year,! the! patch! of! tracer! confined! around! the! deployment! site! in! HR! has!

moved! to! the! south! reaching! greater! depths! than! in! the! LR! case! (Fig.! 14).! ! Modest!
differences! in! vertical! spreading! are! found! in! the! GC600! deployment,! due! to! the!
absence!of!long!lasting!trapping!features!over!the!Central!slope!at!depths!of!1500!m!or!
less!(not!shown).!!
+
Figure+ 14+ Vertical! profiles! of+ horizontally! averaged! tracer! mass! (concentration!
multiplied!by!the!volume!occupied)! in!density!space!3!(blue),!6!(red)!and!12!(green)!
months!after!deployment!at!MC297!transformed!into!depth!z!through!the!3Qyear!mean!
density!profile!calculated!over!an!area!covering!the!tracer!6!months!after!deployment.!
The! black! line! indicates! the! release! depth.! Depth! unit:! m;! σ! =! ρ! –! 1000! kg! mQ3,!
integrated!mass!of!the!tracer:!1010.!
!
We! estimated! the! standard! deviation! and! vertical! diffusivity! of! pairs! of! profiles!

separate! by! a! time! Δt! using! a! Gaussian! fit.! The! diapycnal! diffusivity! k! is! given! by!
k = 12σ f2 −σ i
2( ) /Δt !where!σ f2 and!σ i
2 are! the! standard! deviation! of! the! vertical! spread!
obtained!from!the!Gaussian!fit!at!the!final!and!initial!time!(here!taken!as!6!days).!!!!!
+
+
Table+2:+Diapycnal!diffusivity!coefficients,!k,!calculated!from!the!standard!deviation!of!
Guassian!fits!to!the!tracer!profiles!in!10Q3!m2!sQ1.!
!
While! the! vertical! spreading! behaviors! in! Fig.! 14! have! a! plausible! pattern,! the!
diffusivity! values! in! Table! 2! are! somewhat! higher! than! usually! measured! by!
microstructure! and! dye! release! (in! particular! during! the! deep! release! experiment!
conducted! in! 2012! in! the! vicinity! of!MC297;! Jim! Ledwell,! personal! communication).!!
Because!discrete! advection! errors! can! cause! false! diapycnal! tracer! flux! in!ROMS,!we!
cannot! say! how! much! this! might! be! contaminating! our! k! estimates.! ! Nevertheless,!
submesoscale!currents!are!known!to! influence!energy!dissipation!and!thus!diapycnal!
flux,! and! the!estimated!k! values!are!at! least! suggestive! that! they!might!be! important!
! HR!MC297! LR!MC297! HR!GC600! LR!GC600!
23QMay! 0.7! 1.7! 3.7! 3.5!
25QJun! 0.7! 2.1! 2.9! 1.5!
20QJul! 0.4! 0.9! 2.2! 2.2!
20QOct! 0.6! 0.8! 2.1! 1.2!
20QJan! 0.6! 0.9! 1.5! 1!
20QApr! 0.5! 0.8! 1.1! 0.9!

over!slope!regions.!
!
6.+Conclusions+
The!occurrence!and! impact!of! submesoscale! currents!below!1000!m! in! the!northern!
Gulf! of! Mexico! has! been! investigated!with! two! threeQyear! long! regional! simulations!
differing!only! in! their!horizontal! resolution.! In! the! first! integration!dx!=!1.6!km!(HR)!
and!the!submesoscale!processes!are!partially!resolved,!while!in!the!second!one!dx!=!5!
km!(LR)!and! the!submesoscales!are!mostly!unresolved.! !A!combination!of!mesoscale!
and!submesoscale!eddies!are!generated!over!the!continental!slope.!The!largest!eddy!in!
both! integrations! is! a! bottomQintensified! cyclone!with! a! diameter! of! about! 70! km.! It!
forms!by!vortex! stretching!whenever! the! circulation! in! the!anticyclonic! recirculation!
zone! over! the! Mississippi! Slope! is! sufficiently! strong! to! advect! the! flow! over! the!
Mississippi!Fan.!The!submesoscale!eddies!are!(partially)!resolved!only!in!the!HR!run,!
are!not! in!geostrophic!balance,! and!are! formed! through! instabilities!of!bottom!shear!
layers.!Those!layers!are!generated!by!the!juxtaposition!of!alongQslope!frontal!currents!
that! are! highly! variable! in! both! speed! and! direction,! and! more! so! for! increasing!
resolution,!or!by!current!bottom!drag!on! the!continental!slope.!Whenever! formed!by!
bottom! drag,! the! shear! boundary! layer! is! in! most! cases! underQresolved! in! the! low!
resolution! run! being! its! width! proportional! to! the! slope! of! the! bathymetry.!
Submesoscale!cyclones!and!anticyclones!are!in!approximately!equal!number!between!
1000!and!1500!m,!while! cyclones!dominate!below.!They! form!everywhere!along! the!
continental! slopes,! as! shown! in! Fig.! 9,! and! are! dissipated! preferentially! over! the!
Central! Slope! and! Sigsbee! Escarpment! through! interactions! with! the! complex!

bathymetry.!Submesoscale!eddies!generated!in!the!De!Soto!Canyon!live!the!longest,!up!
to! four! months,! being! isolated! from! strong! shear! currents,! while! the! numerous!
structures!that!populate!the!Northwest!Slope!are!usually!sheared!away!within!a!couple!
weeks.!!
Submesoscale! eddies! and! vorticity! filaments,! and! the! more! intense! and! variable!
currents!found!in!the!HR!run!impact!the!representation!of!transport!and!mixing!along!
the!slope!in!ways!that!vary!greatly!across!the!northern!GoM,!as!shown!by!the!passive!
tracer! integrations.!We!deployed! a! tracer! close! to! the!Macondo!wellhead,! at!MC297,!
and!a!second!one!to!the!west!of!the!Mississippi!Slope,!at!GC600.!In!the!MC297!site,!the!
mean! flow!velocity! around! the!deployment! site! is! small.! In!HR! the! tracer! is! trapped!
inside!submesoscale!eddies!and!stretched!into!narrow!filaments,!resulting!in!a!patchy!
distribution,!while!in!LR!it!spreads!in!a!uniform!narrow!band!that!develops!along!the!
continental!slope.!The!mapping!of!the!deep!oil!plume!following!the!2010!spill!supports!
the!patchiness!found!in!HR.!!Near!the!GC600!site,!on!the!other!hand,!the!mean!currents!
are!strong,!and!their!time!and!space!variability!is!large!and!increases!with!resolution.!
In!the!higher!resolution!run!the!tracer!is!transported!faster!from!the!site!to!the!Central!
Slope,!where!is!efficiently!diffused!due!to!the!turbulent!interaction!of!the!bottom!flow!
with!the!complex!bathymetry.!!
The!two!tracer!experiments!exemplify!the!complexity!and!variability!of!the!circulation!
along!the!continental!slope!in!the!northern!Gulf!of!Mexico.!Overall,!our!results!indicate!
that! the! predictability! potential! in! the! event! of! another! deep! spill! is! hampered! by!
mesoscale!and!submesoscale!structures!that!form!at!irregular!intervals!along!most!of!
the!continental!slope,!and!by!the!variability!of!the!alongQslope!currents.!While!the!longQ

term,!asymptotic!behavior!of!pollutants!originating!from!different!sites!in!the!Gulf!may!
be! estimated! (general! direction! of! propagation,! minimum! and! maximum! times!
required! to! be! advected! and! diffused! from! one! location! to! another),! the! trapping! in!
individual! eddies! and! filaments! is! not.! In! the! aftermath! of! the! 2010! spill! those!
submesoscale! ‘patches’! of! hydrocarbons! and! dispersants!were! likely! responsible! for!
the!spotty!impacts!to!deep!coral!communities!(Fisher!et!al.,!2014).!
A! potential! delicate! issue! is! the! extent! of! the! numerical! error! introduced! in! tracer!
integrations! in! presence! of! strong! concentration! gradients.! ! The! HR! simulation!
indicates!that!the!error!is!small!when!the!horizontal!resolution!is!sufficiently!high,!but!
it!is!large!enough!to!impact!diffusivity!estimates!in!a!mesoscaleQresolving!integration.!!
Finally,! this! investigation! confirms! that! the! generation!of! submesoscale! eddies! along!
continental! slopes! is! a! generic! process,! as! hypothesized!by!Molemaker! et! al.! (2015),!
likely! relevant! to!most! coastal! areas,!with! important! implications! for! understanding!
abyssQtoQcoast!connectivity.!
!
Acknowledgment+
This!work!was!made!possible!by!a!grant!(in!part)!from!BP/the!Gulf!of!Mexico!Research!
Initiative! to!support!consortium!research!entitled!“Ecosystem!Impacts!of!Oil!and!Gas!
Inputs!to!the!Gulf!(ECOGIG)”!administered!by!the!University!of!Georgia!Q!Athens.! JCM!
acknowledges! support! from! the! Office! of! Naval! Research,! grant! N00014Q12Q1Q0939..!
The!modeling!data!relevant!to!this!work!may!be!obtained!through!the!Gulf!of!Mexico!
Research! Initiative! Information! and! Data! Cooperative! (GRIIDC)! under! number:!

R1.x132.141:0005! or,! in! the! case! of! complete! 3D! fields,! contacting! the! first! author.!
ECOGIG!contribution!number:!??.!
!
Appendix:+Validation+of+near+bottom+model+velocities++
The!mean!circulation!of! the!Gulf!of!Mexico,! in!both! the!observations!and! in!ROMS! is!
discussed!in!Cardona!and!Bracco!(2014)!for!a!similar!configuration.!A!validation!of!the!
model! surface! currents! and! of! the! temperature! and! salinity! distributions! across! the!
water! column! in! the! current! setQup! is! presented! in! the! Appendix! of! LBCM.! Overall!
ROMS!provides!a!very!good!representation!of!all!mean!quantities,! including!the!Loop!
Current!(LC)!strength!and!evolution,!the!Loop!Eddies!detachment!and!propagation,!the!
Yucatan! Channel! transport,! mean! near! surface! and! deep! currents,! and! the! water!
column!stratification.!!
The!mean!deep!flow!in!the!northern!Gulf!is!not!well!characterized!in!the!observations!
due! to! the! paucity! of! data.! A! mean! velocity! reconstruction! over! this! area! has! been!
attempted!using!17!PALACE!(Profiling!Autonomous!Lagrangian!Circulation!Explorer)!
floats! deployed! at! approximately! 900!m! between! 1998! and! 2002! (Weatherly! et! al.,!
2004).! At! this! depth! the! flow! is! still! dominated,! both! in! the! model! and! in! the!
observations,! by! the! Loop! Current.! Nonetheless! the! velocity! field! derived! from! float!
trajectories!supports!the!modeled!mean!cyclonic!pattern,!the!presence!of!recirculation!
zones,!and!the!mean!speed!amplitude!presented!in!Fig.!2.!
As! mentioned,! topographic! Rossby! waves! with! periodicities! from! 10! to! 50! days,!
contribute! to! the! variability! of! the! deep! flow! of! the! northern! Gulf! (Hamilton,! 2009;!
Kolodziejczyk! et! al.,! 2012;! PérezQBrunius! et! al.,! 2013).! In! the! observations! the!

variability!associated!to!TRWs!has!been!shown!to!have!periodicities!preferentially! in!
the!10Q20!days!band!for!currents!aligned!to!the!1000Q1500!m!isobaths,!20Q30!days!for!
currents! along! the! 1500! Q! 2000! m! isobaths,! and! around! 50! days! for! nearQbottom!
currents! over! 2300! –! 2500! m! (Hamilton,! 2009).! We! verified! that! comparable!
periodicities!are!simulated!by!ROMS,!despite!the!smoothing!applied!to!the!bathymetry,!
in!both!solutions.!This!is!shown!in!Fig.!A1!(HR!case!only),!where!we!plot!the!period!of!
the!maximum!of! the!varianceQpreserving!spectrum!for! the! first!normalized!empirical!
orthogonal! function! (EOFQ1)! of! the! zonal! velocity!u! for! each! grid! point! at!which! the!
variance!is!higher!than!an!arbitrary!threshold,!and!over!two!fourQmonths!long!periods!
at!the!beginning!and!end!of!the!integration!(similar!results!are!obtained!through!other!
model! periods).! The! threshold! was! chosen! based! on! the! observed! speed! spectra!
(Hamilton,!2009)!and!set!to!be!0.5.!!
!!
Figure+A1!Maps!of!the!period!of!the!maximum!of!the!varianceQpreserving!spectrum!for!
the! normalized! EOFQ1! of! the! nearQbottom! zonal! velocity!u! whenever! the! variance! is!
higher!than!0.5!in!the!HR!solution.!Left!panel:!JanuaryQMay!2010;!Right!panel:!AugustQ
December!2012.!Unit:!Days.!

!
Additionally,!numerical!simulations!have!shown!that!in!the!north!GoM!the!eddy!kinetic!
energy! (EKE)! to! kinetic! energy! (KE)! ratio! is! close! to! one! everywhere! but! over! the!
portion! of! the! continental! shelf! where! the! water! column! is! shallower! than! 200! m!
(Cardona!and!Bracco,!2014).!In!the!northern!Gulf!mesoscale!dynamics!prevails!also!in!
the!bottom!layer,!contributing!at!least!80%!of!the!total!kinetic!energy.!!
Deep! current! measurements! in! our! focus! area! are! not! abundant.! They! are! mostly!
limited! to! the!eastern!end!of! the!Central!Slope,!where! the! topography! is!particularly!
steep,!with!current!meters!deployed!as!early!as!the!1980s!(Hamilton,!1990;!Hamilton,!
2007),! and! to!exploratory!work!performed!between!2003!and!2006! (Donohue!et! al.,!
2006;!Hamilton,!2009).!The!magnitude!of! the!modeled!currents!at!eastern!portion!of!
the! Central! Slope! underestimates! the! observations.! A!maximum! speed! of! 90! cm! sQ1,!
associated!with! the!propagation!of!TRWs!with!a! short!period!of!8Q14!days,!has!been!
recorded! at! about! 50!m! from! the! bottom! (Hamilton! and! LugoQFernandez,! 2001).! In!
contrast,! modeled! values! attain! only! 50! cm! sQ1! in! HR! and! 30! cm! sQ1! in! LR,! and! the!
characteristic! period! over! the! area! covering! the! mooring! is! 10Q25! days.! The! speed!
underestimation!is!caused!in!part!by!the!smoothing!applied!to!the!topographic!relief!to!
limit!unphysical!pressure!gradient! currents.!We! tested! that! values!nearing!80! cm!sQ1!
are!achieved!near!the!bottom!along!the!steeper!portions!of! the!continental!close! in!a!
sensitivity!run!performed!at!1!km!resolution!with!the!bathymetry!smoothed!at!1!km!
(in! this! work! the! bathymetry! is! smoothed! at! 5! km! in! both! runs).! Longer! preferred!
periodicities,! ranging! from! 40! to! 80! days,! characterize! the! modeled! flow! south! of!
26.5oN! in! the! eastern! portion! of! the! domain,! in! agreement! with! previous! modeling!

work! (Oey! and! Lee,! 2002),! while! 20Q40! day! peaks! are! commonly! found! in! spectra!
calculated!over!areas!covering!the!slope!to!the!west!of!the!eastern!end!of!Sigsbee.!!The!
periodicities!are!independent!of!resolution!given!that!an!identical!smoothing!is!applied!
to!the!topography!(not!shown).!!
Between! 2010! and! 2013,! the! ECOGIG! program! collected! several! time! series! of! near!
bottom!velocities! (usually!10!m! from! the!bottom)! through!Acoustic!Doppler!Current!
Profilers!(ADCPs)!and!single!point!current!meters!deployed!on! lander!systems!at! the!
locations!where!the!passive!tracers!have!been!released.!The!time!series!were!obtained!
in! correspondence!of!bathymetric! features!with! size!of! few!hundred!meters! that! are!
not! resolved! by! our! model.! Notwithstanding! the! modeled! mean! speed!
compares!reasonably!well!with!the!observed!ones!subsampled!at!the!model!frequency!
and!over!the!same!time!period!(MC297:!ADCP!=1.6!cm!sQ1;!HR!=!2.8!cm!sQ1;!LR!=!2.0!cm!
sQ1.!GC600:!ADCP!5.4!cm!sQ1;!HR!=!4.1!cm!sQ1;!LR!=!2.6!cm!sQ1).!Sample!timeQseries!of!the!
meridional!and!zonal!velocity!components!at! the!three!sites!on! intervals!overlapping!
with!the!available!inQsitu!data!are!presented!in!Fig.!A2.!
!
!
!
u2 + v2( )

+
+
Figure+ A2:+ Sample! timeQseries!of!3Qday!averages!of!meridional! (a)! and!zonal! (b! Q! c)!
velocity! in! the! model! and! inQsitu! data! at! the! MC297! and! GC600! sites,! respectively.!
Mean! and! standard! deviation! calculated! over! the! observational! time! frame! are!
indicated!in!the!legend.!For!the!model!integrations!mean!and!standard!deviation!over!
the!Jan.!2010!Q!Dec.!2012!period!are!also!shown!in!parenthesis.!Unit:!cm!sQ1.!
+ +

Bibliography+
Antonov,!J.I.,!Seidov,!D.,!Boyer,!T.P.,!Locarnini,!R.A.,!Mishonov,!A.V.,!Garcia,!H.E.,!!Baranova,!O.K.,!Zweng,!M.M.,!Johnson,!D.R,!2010.!World!Ocean!Atlas!2009,!Volume!2:!Salinity.!S.!Levitus,!Ed.!NOAA!Atlas!NESDIS!69,!U.S.!Government!Printing!Office,!Washington,!D.C.,!184!pp.!!Boccaletti,!G.,!Ferrari,!R.,!FoxQKemper,!B.,!2007.!Mixed!layer!instabilities!and!restratification.!J.!Phys.!Oceanogr.!37,!2228Q2250.!!Camilli,!R.,!Reddy,!C.!M.,!Yoerger,!D.!R.,!Van!Mooy,!B.!A.!S.,!Jakuba,!M.!V.,!Kinsey,!J.!C.,!McIntyre,!C.!P.,!Sylva,!S.!P.,!Maloney,!J.!V.,!2010.!Tracking!Hydrocarbon!Plume!Transport!and!Biodegradation!at!Deepwater(Horizon.(Science,!330,!201Q206.!!Capet,!X.,!McWilliams,!J.C.,!Molemaker,!M.J.,!Shchepetkin,!A.F.!,!2008a.!Mesoscale!to!submesoscale!transition!in!the!California!current!system.!Part!I:!Flow!structure,!eddy!flux,!and!observational!tests,!J.!Phys.!Oceanogr.!38,!29–43.!!Capet,!X.,!McWilliams,!J.C.,!Molemaker,!M.J.,!Shchepetkin,!A.F.,!2008b.!Mesoscale!to!submesoscale!transition!in!the!California!Current!System.!Part!II:!Frontal!processes,!J.!Phys.!Oceanogr.,!38,!44–64.!!Cardona!Y.,!Bracco!A.,!2014.!Predictability!of!mesoscale!circulation!throughout!the!water!column!in!the!Gulf!of!Mexico!Deep!Sea!Res.!II,!http://dx.doi.org/10.1016/j.dsr2.2014.01.008!!D’Asaro,!E.,!Lee,!C.,!Rainville,!L.,!Harcourt,!R.,!Thomas,!L.,!2011.!Enhanced!Turbulence!and!Energy!Dissipation!at!Ocean!Fronts.!Science!332,!318Q322,!doi:!10.1126/science.1201515!!Debreu,!L.,!Marchesiello,!P.,!Penven,!P.,!Cambon,!G.,!2012.!TwoQway!nesting!in!splitQexplicit!ocean!models:!Algorithms,!implementation!and!validation.!Ocean!Modelling!49–50,!1Q21.!!Dee,!D.!P.,!Uppala,!S.!M.,!Simmons,!A.!J.,!Berrisford,!P.,!Poli,!P.,!Kobayashi,!S.,!Andrae,!U.,!Balmaseda,!M.!A.,!Balsamo,!G.,!Bauer,!P.,!Bechtold,!P.,!Beljaars,!A.!C.!M.,!van!de!Berg,!L.,!Bidlot,!J.,!Bormann,!N.,!Delsol,!C.,!Dragani,!R.,!Fuentes,!M.,!Geer,!A.!J.,!Haimberger,!L.,!Healy,!S.!B.,!Hersbach,!H.,!Hólm,!E.!V.,!Isaksen,!L.,!Kållberg,!P.,!Köhler,!M.,!Matricardi,!M.,!McNally,!A.!P.,!MongeQSanz,!B.!M.,!Morcrette,!J.QJ.,!Park,!B.QK.,!Peubey,!C.,!de!Rosnay,!P.,!Tavolato,!C.,!Thépaut,!J.QN.,Vitart,!F.,!2011.!The!ERAQInterim!reanalysis:!configuration!and!performance!of!the!data!assimilation!system.!Quart.!J.!Roy.!Meteorol.!Soc.!137,!553–597.!!!DeHaan,!C.J.,!Sturges,!W.,!2005.!Deep!Cyclonic!Circulation!in!the!Gulf!of!Mexico.!J.!Phys.!Oceanogr.!35,!1801Q1812.!!

Dewar,!W.!K.,!J.!C.!McWilliams,!and!M.!J.!Molemaker,!2015:!Centrifugal!instability!and!mixing!in!the!California!Undercurrent.!J.!Phys.!Oceanogr.,!in!press,!doi:10.1175/JPOQDQ13Q0269.1.!!!Dukhovskoy,!D.S.,!Morey,!S.L.,!Martin,!P.J.,!O’Brien,!J.J.,!Cooper,!C.,!2009.!Application!of!a!vanishing,!quasiQsigma,!vertical!coordinate!for!simulation!of!highQspeed,!deep!currents!over!the!Sigsbee!Escarpment!in!the!Gulf!of!Mexico.!Ocean!Modelling!28,!250Q265.!!Fisher,!C.!R.,!Hsing,!P.QY.,!Kaiser,!C.!L.,!Yoerger,!D.!R.,!Roberts,!H.!H.,!Shedd,!W.!W.,!Cordes,!E.!E.,!Shank,!T.!M.,!Berlet,!S.!P.,!Saunders,!M.!G.,!Larcom.,!E.!A.,!Brooks,!J.!M.,!2014.!Footprint!of!Deepwater(Horizon!blowout!impact!to!deepQwater!coral!communities.!Proc.!Nat.!Acad.!Sciences!USA,!111,!11744–11749,!doi:!10.1073/pnas.1403492111.!!Garrett,!C.!1983.!On!the!initial!streakiness!of!a!dispersion!tracer!in!twoQ!and!threeQdimensional!turbulence.!Dyn.!Atmos.!Oceans,!7,!265–277.!!Greene,!A.D.,!Sutyrin,!G.G.,!Watts,!D.R.,!2009.!Deep!cyclogenesis!by!synoptic!eddies!interacting!with!a!seamount.!J.!Marine!Res.!67,!305Q322.!!Gula,!J.,!Molemaker,!M.J.,!McWilliams,!J.C.,!2014.!Submesoscale!cold!filamentes!in!the!Gulf!Stream.!J.!Phys.!Oceanogr.!44,!2617Q2643.!!Hamilton,!P.,!1990.!Deep!Currents!in!the!Gulf!of!Mexico.!J.!Phys.!Oceanogr.!20,!1087Q1104.!!Hamilton,!P.,!2007.!DeepQcurrent!variability!near!the!Sigsbee!Escarpment!in!the!Gulf!of!Mexico.!J.!Phys.!Oceanogr.,!37,!708Q726.!!Hamilton,!P.,!2009.!Topographic!Rossby!waves!in!the!Gulf!of!Mexico.!Prog.!Oceanogr.!82,!1–31,!http://dx.doi.org/10.1016/j.pocean.2009.04.019.!!Hamilton,!P.,!LugoQFernández,!A.,!2001.!Observations!of!high!speed!deep!currents!in!the!northern!Gulf!of!Mexico.!Geoph.!Res.!Lett.!28,!2867Q2870.!!Huppert,!H.E.,!Bryan,!K.,!1976.!Topographically!generated!eddies.!DeepQSea!Res.,!23,!655–679.!!Joye,!S.B.,!MacDonald,!I.R.,!Leifer,!I.,!Asper,!V.,!2011.!Magnitude!and!oxidation!potential!of!hydrocarbon!gases!released!from!the!BP!oil!well!blowout.!Nature!Geosci.!4,!160Q164.!!Klein,!P.,!Lapeyre,!G.,!2009.!The!Oceanic!Vertical!Pump!Induced!by!Mesoscale!and!Submesoscale!Turbulence.!Annual!Rev.!Marine!Science!1,!351Q375!!Klocker,!A.,!Ferrari,!R.,!LaCasce,!J.!H.,!Merrifield,!S.!T.,!2012.!Reconciling!floatQbased!and!tracerQbased!estimates!of!lateral!diffusivities.!J.!Marine!Res.,!70,!569Q602!

!Kolodziejczyk,!N.,!Ochoa,!J.,!Candela,!J.,!Sheinbaum,!J.,!2012.!Observations!of!intermittent!deep!currents!and!eddies!in!the!Gulf!of!Mexico,!J.!Geophys.!Res.!117,!C09014,!doi:10.1029/2012JC007890.!!Koszalka,!I.,!Bracco!A.,!McWilliams,!J.C.,!Provenzale,!A.,!2009.!Dynamics!of!wind�forced!coherent!anticyclones!in!the!open!ocean.!J.!Geophys.!Res.!114,!C08011,!doi:10.1029/2009JC005388!!Large,!W.!G.,!McWilliams,!J.C.,!Doney,!S.!C.,!1994.!Oceanic!vertical!mixing:!a!review!and!a!model!with!a!nonlocal!boundary!layer!parameterization.!Rev.!Geophys.!32,!363Q403.!!Ledwell,!J.!R.,!Watson,!A.!J.,!Law,!C.!S.,!1993.!Evidence!for!slow!mixing!across!the!pycnocline!from!an!openQocean!tracerQrelease!experiment.!Nature,!364,!701Q703.!!Lee,!H.QC.,!Mellor,!G.L.,!2003.!Numerical!simulation!of!the!Gulf!Stream!System:!The!Loop!Current!and!the!deep!circulation,!J.!Geophys.!Res.!108(C2),!3043,!doi:10.1029/2001JC001074.!!Lemarié,!F.,!Debreu,!L.,!Shchepetkin,!A.F.,!McWilliams,!J.C.,!2012.!On!the!stability!and!accuracy!of!the!harmonic!and!biharmonic!adiabatic!mixing!operators!in!ocean!models,!Ocean!Model.,!52Q53,!9Q35.!!Lévy,!M.,!Ferrari,!R.,!Franks,!P.J.S.,!Martin,!A.P.,!Rivière,!2012.!Bringing!physics!to!life!at!the!submesoscale.!Geoph.!Res.!Letters!39,!L14602,!doi:10.1029/2012GL052756!!Lévy,!M.,!Iovino,!D.,!Resplandy,!L.,!Klein,!P.,!Madec,!G.,!Tréguier,!A.QM.,!Masson,!S.,!Takahashi,!K.,!2011.!LargeQscale!impacts!of!submesoscale!dynamics!on!phytoplankton:!local!and!remote!effects.!Ocean!Modelling,!44,!77–93!!Lévy,!M.,!Klein,!P.,!Treguier,!A.!M.,!Iovino,!D.,!Madec,!G.,!Masson,!S.,!Takahashi,!K.,!2010.!Modifications!of!gyre!circulation!by!submesoscale!physics.!Ocean!Modelling!34,!1Q15.!!Luo,!H.,!Bracco,!A.,!Cardona,!Y.,!McWilliams,!J.C.,!2015.!The!submesoscale!circulation!in!the!Northern!Gulf!of!Mexico:!Surface!processes!and!the!impact!of!the!freshwater!river!input.!Ocean!Modelling,!In!Revision!!MacDonald,!I.!R.,!Leifer,!I.,!Sassen,!R.,!Stine,!P.,!Mitchell,!R.,!Guinasso,!N.,!2002.!Transfer!of!hydrocarbons!from!natural!seeps!to!the!water!column!and!atmosphere,!Geofluids!2,!95Q107!!Marchesiello!P.,!Debreu,!L.,!Couvelard,!X.,!2009.!Spurious!diapycnal!mixing!in!terrainQfollowing!coordinate!models:!the!problem!and!a!solution.!Ocean!Modelling!26,!156Q169.!!

McWilliams,!J.C.,!Colas,!F.,!Molemaker,!M.J.,!2009a.!Cold!filamentary!intensification!and!oceanic!surface!convergence!lines.!Geophys.!Res.!Lett.!36,!L18602,!doi:10.1029/2009GL039402.!!!!Molemaker,!M.!J.,!J.!C.!McWilliams,!and!W.!K.!Dewar,!2015:!Submesoscale!instability!and!generation!of!mesoscale!anticyclones!near!a!separation!of!the!California!Undercurrent.!J.!Phys.!Oceanogr.,!45,!613–629,!doi:10.1175/JPOQDQ13Q0225.1.!!!Oey,!L.QY.,!Hamilton,!P.,!2012.!UltraQdeepwater!circulation!processes!in!the!Gulf!of!Mexico.!U.S.!Dept.!of!the!Interior,!Bureau!of!Ocean!Energy!Management,!Gulf!of!Mexico!OCS!Region,!New!Orleans,!LA.!OCS!Study!BOEM!2012Q004.!72!pp.!!Penven,!P.,!Marchesiello,!P.,!Debreu,!L.,!Lefèvre,!J!,!2008.!Software!tools!for!preQ!and!post!processing!of!oceanic!regional!simulations.!Environm.!Modelling!&!Software!23,!660Q662.!!PérezQBrunius!P.,!GarcíaQCarrillo,!P.,!Dubranna,!J.,!Sheinbaum,!J.,!Candela,!J.,!2012.!Direct!observations!of!the!upper!layer!circulation!in!the!southern!Gulf!of!Mexico.!DeepQSea!Res.!85,!82Q94,!doi.org/10.1016/j.dsr2.2012.07.020.!!!!!!Poje,!A.C.,!Özgökmen,!T.M.,!Bruce!L.!Lipphardt,!B.L.,!Haus,!B.K.,!Ryan,!E.H.,!Haza,!A.C.,!Jacobs,!G.A.,!Reniers,!A.!J.!H.!M.,!Olascoaga,!M.J.,!Novelli,!G.,!Griffa,!A.,!BeronQVera,!F.B.,!Chen,!S.S.,!Coelho,!E.,!Hogan,!P.J.,!Kirwan,!A.D.!Jr,!Huntley,!H.S.,!Mariano,!A.J.,!2014.!Submesoscale!dispersion!in!the!vicinity!of!the!Deepwater(Horizon!spill.!Proc.!Natl.!Acad.!Sci.!U.S.A.!111,!12693Q12698!!Sandwell,!D.!T.,!Smith,!W.H.F.,!1997.!Marine!Gravity!Anomaly!from!Geosat!and!ERSQ1!Satellite!Altimetry,!J.!Geophys.!Res.,!102,!10,039Q10,054.!!Shcherbina,!A.!Y.,!D’Asaro,!E.A.,!Lee,!C.M.,!Klymak,!J.M.,!Molemaker,!M.J.,!McWilliams,!J.C.,!2013.!Statistics!of!vertical!vorticity,!divergence,!and!strain!in!a!developed!submesoscale!turbulence!field,!Geophys.!Res.!Lett.!40,!4706–4711,!doi:10.1002/grl.50919.!!Taylor,!G.!I.,!1921.!Diffusion!by!continuous!movements,!Proc.!London!Math.!Soc.,!s2Q20(1),!196–212,!doi:10.1112/plms/s2–20.1.196.!!Taylor,!J.R.,!Ferrari,!R.,!2011.!Ocean!fronts!trigger!high!latitude!phytoplankton!blooms.!Geoph.!Res.!Lett.,!38,!L23601,!doi:10.1029/2011GL049312.!!Thomas,!L.,!Ferrari,!R.,!2008.!Friction,!frontogenesis,!and!the!stratification!of!the!surface!mixed!layer,!J.!Phys.!Oceanogr.,!38,!2501Q2518.!!Thomas,!L.,!Tandon,!A.,!!Mahadevan,!A.,!!2008.!Submesoscale!ocean!processes!and!dynamics,!in:!Eddy!Resolving!Ocean!Modeling,!edited!by!M.!Hecht!and!H.!Hasumi,!pp.!17–38,!AGU,!Washington,!D.!C.!

!Valentine,!D.L.,!Fisher,!G.!B.,!Bagby,!S.!C.,!Nelson,!R.!K.,!Reddy,!S.!P.,!Sylva,!C.!M.,!Woo,!M.!A.,!2014.!Fallout!plume!of!submerged!oil!from!Deepwater(Horizon.!!Proc.!Natl.!Acad.!Sci.!U.S.A.,!111,!15906Q15911,!doi:!www.pnas.org/cgi/doi/10.1073/pnas.1414873111!!Vukovich,!F.!M.,!2007,!Climatology!of!ocean!features!in!the!Gulf!of!Mexico!using!satellite!remote!sensing!data,!J.!Phys.!Oceanogr.!37,!689Q707!!Weatherly,!G.,!2004.!Intermediate!Depth!Circulation!in!the!Gulf!of!Mexico:!PALACE!float!results!for!the!Gulf!of!Mexico!between!April!1998!and!March!2002.!OCS!Study!MMS!2004Q013,!U.S.!Dept.!of!the!Interior,!Minerals!Management!Service,!Gulf!of!Mexico!OCS!Region,!New!Orleans,!LA,!51!pp.!!Zhong!Y.,!Bracco,!A.,!Villareal,!T.,!2012.!Pattern!formation!at!the!ocean!surface:!Sargassum!distribution!and!the!role!of!the!eddy!field.!Limn.!&!Ocean.:!Fluid!and!Environ.,!2,!12Q27,!doi:10.1215/21573689Q1573372!!Zhong!Y.,!Bracco,!A.,!2013.!Submesoscale!impacts!on!horizontal!and!vertical!transport!in!the!Gulf!of!Mexico.!J.!Geoph.!Res.!Q!Oceans!,!118,!5651Q5668,!doi:10.1002/jgrc.20402!!!
+ +

Figure+Captions+
Figure+1.!Bathymetry!over!the!northern!Gulf!(HR)!domain.!The!1000,!1500,!and!2000!m! bathymetric! contours! are! indicated! by! the! black! lines! and! major! topographic!features! are! named.! The! sites!where! the! passive! tracer! is! released! are! indicated! by!black!stars.!!Figure+ 2.!Mean! velocity! vector! field! in! the!whole! Gulf! of!Mexico!with! zooms! in! the!
northern!portion! in! both!HR! (top! left)! and!LR! (top! right).! ! ! ! The! color! bar! indicates!
speed!in!cm!sQ1.!
!
Figure+3.!Eddy!Kinetic!Energy!time!series!averaged!over!the!northern!Gulf!at!different!
depths! across! the! deep! layer.! HR! run! on! top! (thick! lines)! and! LR! integration! below!
(thin! lines).! The! black! dots! indicate! the! generation! of! mesoscale! ! cyclones! at! the!
Mississippi!Fan.!Unit:!cm2sQ2!
!
Figure+ 4.! Snapshots! of! relative! vorticity! normalized! by! the! Coriolis! frequency,! ζ/f,!
depthQaveraged!from!1000!m!to!the!bottom.!Top!panel:!HR;!Bottom!panel:!LR.!
!
Figure+5.!Snapshots!of!depthQaveraged!relative!vorticity!at!the!Mississippi!Fan!during!
the!formation!of!one!of!the!mesoscale!cyclones!in!the!HR!run.!!!
!
Figure+6.!Left:!Vertical!profiles!of!relative!vorticity!ζ!averaged!over!the!northern!Gulf!
domain! in! HR! and! LR;! Right:! PDFs! of! ζ/f! in! HR! and! LR! at! the! depth! of! 1000! m,!

normalized!to!have!unit!integral!probability.!!The!skewness!!γ!of!the!two!distributions!
is!listed.!!!!
!
Figure+7.!Mean!(a)!and!instantaneous!snapshot!(b)!of!zonal!velocity!in!cm!sQ1,!and!!the!
corresponding! instantaneous! relative! vorticity! normalized! by! the! Coriolis! frequency!
(c)!along!the!Q93.5oW!transect!in!the!HR!run.!Density!isolines!(mean!or!instantaneous)!
are!superimposed!on!the!velocity!plots.!!
!
Figure+8.+Mean!nearQbottom!speed!and!its!standard!deviation!at!each!model!grid!point!
in!HR! (left)! and!LR! (right)!with! superimposed!horizontal! velocity! streamlines! in! the!
bottom!model!layer.!Unit:!cm!sQ1!
!
Figure+9.! !Maxima!(top)!and!minima!(bottom)!of!ζ/f(!at!each!model!grid!point! in!HR!
(left)!and!LR!(right)!at!the!depth!of!1000!m.!!The!association!with!the!continental!slope!
is!strong.!
!
Figure+ 10! Standard! deviation! of! horizontal! divergence! normalized! by! the! Coriolis!
frequency!at!1000,!1500!and!2000!m!in!HR!(top)!and!LR!(bottom).!
!
Figure+ 11! DepthQintegrated! concentration! of! the! tracer! deployed! at! MC297! (black!
star)! after! 3,! 6! and! 12! months! after! deployment! in! the! HR! (left)! and! LR! (right)!
integrations.!The!1000,!1500!and!2000!m!isobaths!are!also!shown.!
+

Figure+ 12!DepthQintegrated!concentration!of! the! tracer!deployed!at!600! (black!star)!
after!3!(top),!6!(middle)!and!12!(bottom)!months!after!deployment!in!the!HR!(left)!and!
LR!(right)!integrations.!The!1000,!1500!and!2000!m!isobaths!are!also!shown.!Note!the!
different!color!scale!compared!to!Fig.!11.!
!
Figure+13!Zonal!(Kx)!and!meridional!(Ky)!diffusivities!as!function!of!time!in!HR!(red)!
and! LR! (blue),! including! concentrations! that! include! negative! values! (bold)! or! after!
removing!them.!Note!the!different!yQaxis!for!Kx!and!Ky.!Unit:!m2!sQ1.!
+
Figure+ 14+ Vertical! profiles! of+ horizontally! averaged! tracer! mass! (concentration!
multiplied!by!the!volume!occupied)! in!density!space!3!(blue),!6!(red)!and!12!(green)!
months!after!deployment!at!MC297!transformed!into!depth!z!through!the!3Qyear!mean!
density!profile!calculated!over!an!area!covering!the!tracer!6!months!after!deployment.!
The! black! line! indicates! the! release! depth.! Depth! unit:! m;! σ! =! ρ! –! 1000! kg! mQ3,!
integrated!mass!of!the!tracer:!1010.!
+
Figure+A1!Maps!of!the!period!of!the!maximum!of!the!varianceQpreserving!spectrum!for!
the! normalized! EOFQ1! of! the! nearQbottom! zonal! velocity!u! whenever! the! variance! is!
higher!than!0.5!in!the!HR!solution.!Left!panel:!JanuaryQMay!2010;!Right!panel:!AugustQ
December!2012.!Unit:!Days.!
+
Figure+ A2:+ Sample! timeQseries!of!3Qday!averages!of!meridional! (a)! and!zonal! (b! Q! c)!
velocity! in! the! model! and! inQsitu! data! at! the! MC297! and! GC600! sites,! respectively.!

Mean! and! standard! deviation! calculated! over! the! observational! time! frame! are!
indicated!in!the!legend.!For!the!model!integrations!mean!and!standard!deviation!over!
the!Jan.!2010!Q!Dec.!2012!period!are!also!shown!in!parenthesis.!Unit:!cm!sQ1.!
+
+